Final Report for GNC10-143
Project Information
Disturbances that accompany the production of agricultural crops such as tillage, pesticide application, and harvesting can negatively impact beneficial arthropod communities and the arthropod-mediated ecosystem services they support. Habitat management examines methods that alter agricultural habitats to lessen negative disturbances and optimize the performance of beneficial insects. The introduction of floral resources to provide habitat and alternative food and prey for beneficial insects has been shown to increase their diversity and abundance. This project investigated how localized habitat management and landscape composition affected the abundance and activity of pollinators and natural enemies in pumpkin agroecosystems. Localized habitat additions included either a pair of non-native annual floral strips consisting of sweet alyssum (Lobularia maritima) or a swath of perennials consisting of native Ohio forbs and grasses. I compared beneficial insect abundance, diversity, and biocontrol and pollination services within 6 treatment (floral strips), 6 control (crop produced adjacent to mown grass) pumpkin farms across Ohio, and also compared pollination and biocontrol services with landscape composition surrounding those sites. Data on beneficial arthropod abundance and diversity was collected using pitfall traps, pan traps, and video footage. Predation and parasitism of cucumber beetle and squash bug eggs and parasitism of adults was compared across treatment and control pumpkin fields. Pollination service and the diversity and activity of the pollinator community were also compared within treatment and control fields, and across time. Additionally, an economic analysis of the net revenue between treatment and control farms was conducted to evaluate the feasibility of this habitat management tactic. This study contributed to NCR-SARE’s broad-based goals by providing vegetable growers and extension agents with information on the effectiveness and economics of habitat management within a vegetable cropping system. This information will prove useful in reducing costs of chemical insecticides and in enhancing environmental quality and the natural resources base on which agriculture depends.
Introduction:
My project builds on SAREfunded research by measuring both the economic and ecological costs and benefits of incorporating native perennial floral resource strips in an annual vegetable cropping system (Fiedler and Landis, 2004; Walton and Isaacs, 2007; Blaauw and Isaacs, 2008 and 2009). Further, my research will measure not only the abundance of beneficial insects, but also both the pollination and biocontrol services they support. This was a two-year study (2011-2012), of which NCR-SARE funding was only applied to 2012. Data processing for the 2012 pollination experiments has not yet been finished for all objectives. Collected pollinator data from 2011 was similar, and will be covered in this report. However, research questions for 2011 were more to do with large-scale landscape effects on beneficial insects, rather than local habitat additions.
These were modified from the proposal as circumstances changed.
1. Determine if landscape composition at 500, 1000, and 1500 m radii around pumpkin plantings affects the ecosystem service provided by native and managed bees.
2. Determine if the addition of a native perennial floral strip enhances the biocontrol services of generalist predators and parasitoids.
Cooperators
Research
Study sites
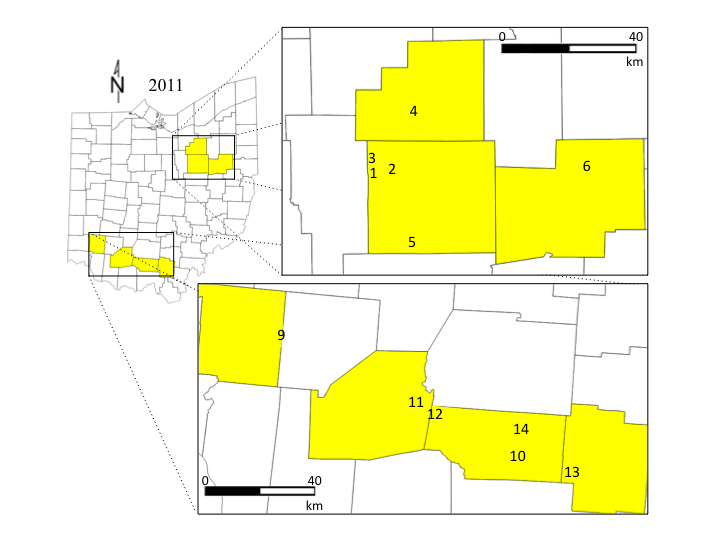
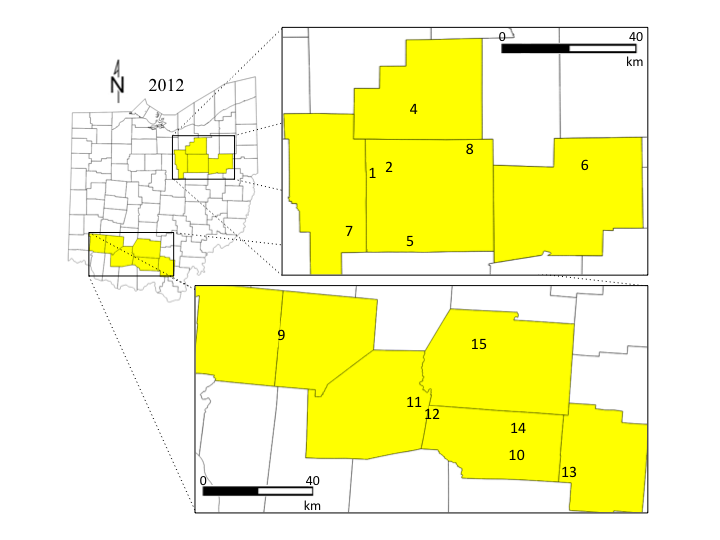
Ohio is the 2nd largest pumpkin-producing state, and two regions were selected that represent major production areas (USDA-NASS, 2013). In 2011, 12 sites were included; six in Wayne, Stark, and Medina counties in northern Ohio, and six in Jackson, Pike, Highland, and Warren counties in southern Ohio. In 2012, one site was dropped (site 3) and three sites were added (sites 7, 8, and 15) in Ashland county in north Ohio, and Ross and Clinton county in southern Ohio (Figure 2). In 2011 and 2012 a plot consisting of four rows of jack-o-lantern pumpkins (var. Gladiator) were established between 10 June and 8 July within each site. No insecticides were applied to these sites. Each plot was divided into 4 sub-plots where all data were collected. Sites were chosen based on grower interest in participating, and by their surrounding landscape. I used ground-truthed aerial photos to quantify the percent of non-crop habitat present surrounding each site at spatial scales of 1500 m, 1000 m, and 500 m (Steffan-Dewenter et al., 2002; Gardiner et al., 2009). Landscapes ranged in non-crop habitat from 2-91%. In 2011, I measured how the landscape composition and diversity influenced biocontrol and pollination services in the pumpkins. In 2012, I evaluated the effect of both localized habitat management and landscape composition on the abundance and activity of predators, parasitoids and pollinators in pumpkin.
Habitat management
Two habitat management strategies were examined in 2012; a native perennial floral insectary made up of 25 plants and a non-native annual floral nectary of sweet alyssum (Lobularia maritima). Three sites in the northern and southern regions were each assigned to one of three treatments: 1) – CONTROL pumpkin plots planted adjacent to a 6 x 60 m grass area, mowed approximately once per month; 2) – PERENNIAL pumpkin plots planted adjacent to a 6 x 60 m swath of native perennials; and 3) – ANNUAL pumpkin plots planted between two 60 m rows of the non-native annual, L. maritima (Table 1). Each individual farm site was established with one pumpkin plot and one floral strip treatment except for sites 2, 9, and 10. In these cases, both an annual plot and a perennial plot were established. The distances between paired plots ranged from 51 m at site 10, to 570 m at site 9.
Establishing native plant insectaries
In October 2010, six sites were selected to establish a 6 x 60 m perennial insectary treatment of 25 native forbs and grasses (Table 5). Each grower cleared the area with field cultivators and herbicide, and rolled the soil flat. I mixed the perennial seeds with sawdust at a ratio of 1:2 and spread 1.3 kgs of that mixture at each site to overwinter (Fiedler et al., 2007; Fiedler and Landis, 2007; Landis et al., 2000). The perennial insectary plots were mowed once per month during the 2011 growing season.
Establishing non-native insectaries
In 2012, I planted two rows of L. maritima as the annual insectary treatment adjacent to pumpkins at six sites in north and south Ohio. For this treatment, one row of L. maritima was established on either side of the pumpkin plot. The sweet alyssum was started from seed in 72-cell plug trays in a greenhouse in early May and fertilized twice per week for two weeks. The plants were hardened off outside for an additional two weeks before being transplanted with a pottiputki planter (Stand ‘n Plant, Saltsburg, PA) into the ANNUAL treatment plots between 7-14-June 2012. Plants were watered and Preen Garden Weed Preventer (Lebanon Seaboard Corp., Lebanon, PA) was applied. The transplants were watered via drip irrigation and hand containers (~190 L) twice a week in the field through July.
Measuring biocontrol on pumpkin pest eggs
In 2011-2012, I deployed sentinel eggs of two pumpkin pests to assess biocontrol services. Eggs of D. undecimpunctata were purchased from French Agricultural Research, Inc. (Lamberton, MN). They were laboratory reared on artificial diet, and were maintained for use in a refrigerator at 4 °C for no longer than 8 days before a fresh batch was ordered. A. tristis eggs were reared in a greenhouse from a colony of field-captured adults. They were fed on young pumpkin plants, and fresh 1-2 day old eggs were collected directly from leaves one day prior to the experiment,
The eggs were attached to 2 x 2 cm construction paper cards by being set in a thin layer of non-toxic silicon fish tank sealant (Hoffmann et al., 1991; Tillman, 2010). They were deployed in paired treatments: the Exclusion Cage treatment cards were covered with a clip cage to control for environmental conditions that may have caused eggs to fall off of the cards, while the Open treatment cards were left uncovered and open to predation and parasitism (Jones et al., 2001; Tillman, 2010). In 2011 D. undecimpunctata eggs were glued to brown cards in sets of 30 and secured to the ground around the base of plants, while 16 A. tristis eggs were glued to green cards and secured to the top side of pumpkin leaves. They were deployed twice in south Ohio (8 July, 29 July) and twice in north Ohio (14 July, 3 Aug). In 2012, I used 18 D. undecimpunctata eggs and 10 A. tristis eggs, and they were deployed twice in south Ohio (4 July, 17 July) and twice in north Ohio (26 June, 11 July) (Table 3). In both years, one set of Exclusion Cage/Open treatment cards were placed each pumpkin plot for 48 hours, and recounted in the laboratory after retrieval. A. tristis eggs were placed in a growth chamber held at 28 °C, 80% RH, and 12:12 light:dark to assess parasitism, though none was observed.
Surveillance of egg predation
A modified 4-channel security camera system (Q-see, model no. QSC26404, Anaheim, CA) was used to monitor predator activity on two D. undecimpunctata egg cards and two A. tristis egg cards (Grieshop et al., 2012) (Table 1). Cameras recorded predator activity at two sets of Open treatment D. undecimpunctata and A. tristis egg cards within two of the four sub-plots within a field for 24 hours. In 2011, this was conducted at two sites in south Ohio (29 July) and two sites in north Ohio (3 Aug). In 2012, data was collected once at each site in south Ohio (3 July or 17 July) and once at each site in north Ohio (11 July). The video footage was transferred to portable hard-drives and stored until viewed on a computer. When an organism was observed interacting with the sentinel eggs, the time of arrival and departure was recorded. All predators were identified to the lowest taxonomic level possible given the resolution of the video.
Measuring biocontrol services of adults by parasitism
I also measured the activity of parasitoids on adult A. vittatum, and the combined capture of adult A. tristis and A. armigera as our target pests. Adults were collected by hand or aspirator. Within each site I searched for adults by checking every plant in the plot, or until 45 minutes had past; whichever came first. We were not able to collect equal sample sizes across sites. D. undecimpunctata counts ranged from 0-51 in 2011 and 1-66 in 2012, while A. tristis/armigera counts varied from 0-9 in 2011 and 1-27 in 2012 (Table 2). In 2011, collections were made twice in south Ohio (8 July, 29 July) and once in north Ohio (3 Aug, 17 Aug one site). In 2012 two collections were made in south Ohio (11-12 July, 25-26 July) and north Ohio (12-13 July, 28-31 July). After the insects had been collected they were all transferred to 3 x 8 cm clear plastic tubes with mesh windows cut into the tube and/or end caps, along with a slice of cucumber. I labeled and kept the insects in a growth chamber held at 28 °C, 80% RH, and 12:12 light:dark for 8 days. Then, they were frozen in a -80 °C freezer and dissected for developing parasitoids (Smyth and Hoffman, 2010; Smyth, 2011). The response variable was the percentage of adults of each species parasitized at each site, averaged across sample dates.
Measuring pollinator activity with video cameras
A modified 4-channel security camera system (Q-see, model no. QSC26404, Anaheim, CA) was used to monitor pollinator activity on two female pumpkin flowers and two male pumpkin flowers within each plot (Grieshop et al., 2012). Cameras recorded pollinator activity between 0600 hr and 1200 hr. In both years, this was conducted once at each site during peak bloom (Table 4). Sites 5, 10, and 13 in 2011, and site 7 in 2012 were not sampled because the peak bloom period occurred too late to accurately represent the pollinator community that focuses on the pumpkin flower resource pulse. The video footage was transferred to portable hard-drives and stored until viewed on a computer at 8-16 times normal speed. When an organism was observed crossing the plane made by the open corolla, the time of arrival and departure was recorded as a measure of the amount of time spent inside the flower. All pollinators were identified to the lowest taxonomic level possible given the resolution of the video.
Measuring pollen deposition throughout the pollination window
Pollen deposition was measured to determine pollination service. One day prior to the collection of video surveillance data, we identified mature female flower buds per plot. All buds that were at least 5 cm in length and turning deep yellow were fitted with a mesh paint strainer bag (Reaves & Co. Durham, NC) as a pollinator excluder, and marked with a step-in poly post (Gempler’s, Madison, WI). We then isolated the stigmas in a vial and placed it on ice for later pollen analysis (see Pollen filtering process).
In 2011, sites were inspected for nine mature female flower buds, which were bagged, one day prior to data collection. Three treatments measured cumulative pollen deposition in flowers open for 2 hrs (CT1: 0600-0800), 4 hrs (CT2: 0600-1000), and 6 hrs (CT3: 0600-1200). On the morning of the experiment I removed bags from all female flowers to allow for ambient pollination to occur. At 0800, 1000, and 1200 hrs three female flowers in each of the three treatments were removed sequentially and the stigmas were placed in a vial on ice. If three flowers could not be found for each treatment on the morning of the video experiment I returned to fill those treatments within seven days of the first attempt, and in comparable weather conditions.
In 2012, I measured pollen deposition differently. I examined the amount of pollen deposited during four segments of the pollination window. As in 2011, two treatments measured deposition between 0600-0800 hrs (T1), and 0600-1200 hrs (T4). Two additional treatments were added wherein bags were left on flowers until either 0800 hr of 1000 hr. They were removed to measure deposition between 0800 and 1000 hr (T2), and 1000 and 1200 hr (T3). Sites were inspected, female flowers were bagged and treatments were assigned one day prior to the experiment. Six flowers were assigned to each treatment except T4, which had two female flowers open 0600-1200 hrs under video surveillance. If six flowers could not be found for each treatment on the morning of the video experiment I returned to fill those treatments within seven days of the first attempt, and in comparable weather conditions. Between each treatment I filtered pollen from the collected stigmas. The response variable was the number of pollen grains deposited averaged by time treatment within each site. The 2012 pollen data have not been counted yet.
Pollen filtering process
I used an Aeropress espresso maker and the stock filters (Aerobie, Inc., Palo Alto, CA) to sieve pollen grains from collected stigmas. The filters were modified with a 1 x 1 cm grid pattern prior to the experiment. Once stigmas were collected I placed them in a 120 mL urine specimen cup with ~44 mL of a dish soap and water solution (4 drops of dish soap per 2 L of water) and shook them vigorously for 20 seconds. The solution was decanted into a separate cup and the stigma was washed a second time. The stigma was then removed from the solution and washed with 70% ethanol from a 500 mL wash bottle. The solution was then poured into the Aeropress, and expunged. The inside of the Aeropress was washed with ethanol so that any pollen that was sticking to the sides was collected on the filter. After each stigma was processed the filters were allowed to dry, and packaged individually in labeled petri dishes. They were frozen until they were counted under a microscope. In 2012, the filters were weighed, controlling for the weight of the filter paper and grid markings (Data Weighing Systems, Inc., model Sartorius Ultramicro 4504 MPB-1, Elk Grove, IL), and were calibrated with pollen counts.
Statistical analyses
I determined if the biocontrol and pollination services differed across landscapes in 2011, and between CONTROL, ANNUAL and PERENNIAL treatments in 2012. The response variable for the predation experiment was the proportion of eggs remaining after field exposure. I compared the egg cards left open to predation to the cards that restricted predation in both years. I also compared the predation of open egg cards across site treatments (control vs alyssum vs perennial in 2012). The response variable for the parasitism study was the percent of adults parasitized of each species, A. vittatum and A. tristis/armigera. The predation and parasitism data were averaged by site prior to analysis, respectively and compared across site treatments (control vs alyssum vs perennial in 2012). The response variables for the pollination experiments were average abundance of bees, average time spent inside the flowers, and average pollen deposition for each time treatment.
2011 Biocontrol across landscape
In 2011, we witnessed a proportion of 0.8760 remaining A. tristis eggs on Open treatment cards, and 0.9654 on Exclusion treatment cards. We saw a proportion of 0.2332 remaining D. undecimpunctata eggs on Open treatment cards and 0.9122 on Exclusion treatment cards. The difference between proportion of eggs remaining on Exclusion and Open treatment cards was significant only for D. undecimpuncata (p < 0.000). D. undecimpunctata eggs were predated on more than A. tristis, and this was moderately significant (p = 0.081) (Figure 3). Out of 330 individual adult A. vittatum collected across all sites, 16% (n = 54) were parasitized by Celatoria spp (Tachinidae). There was a smaller amount of parasitism in adult A. tristis/armigera by Trichopoda spp (2/24 ~ 8%).
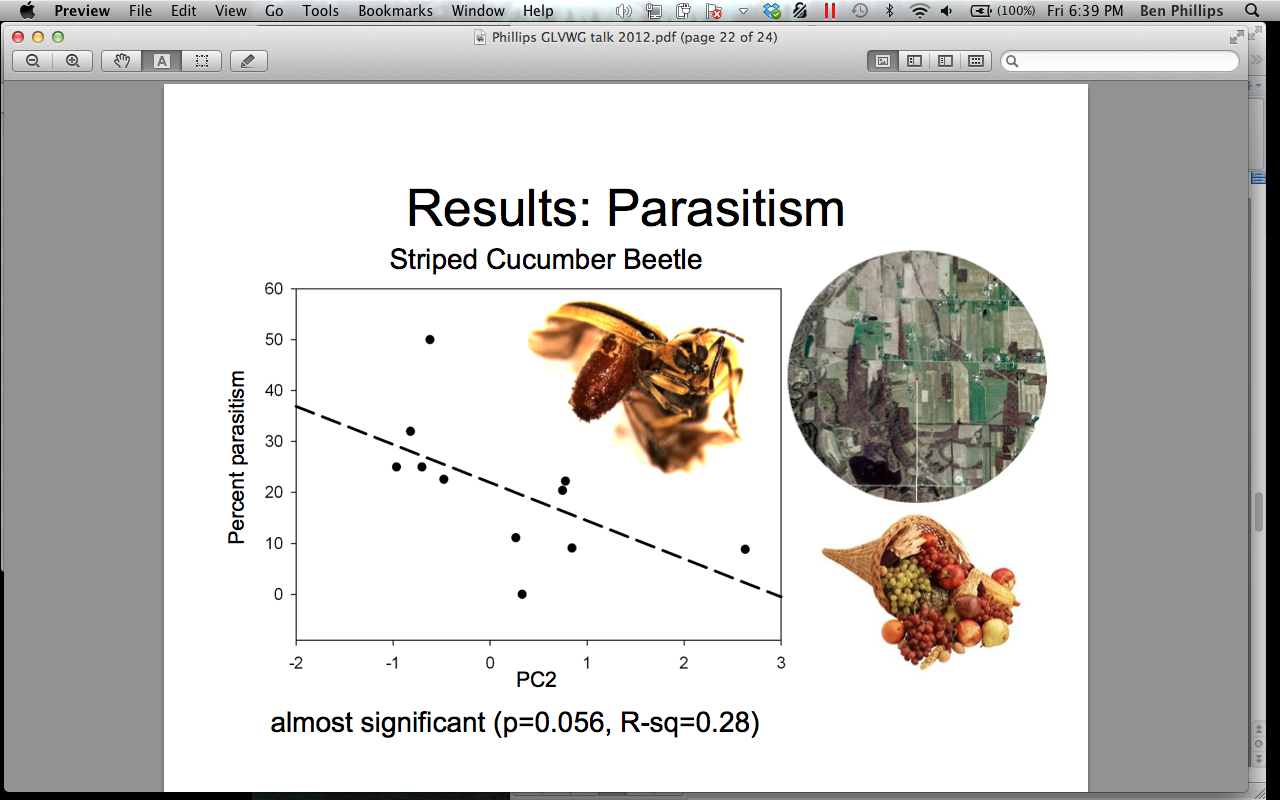
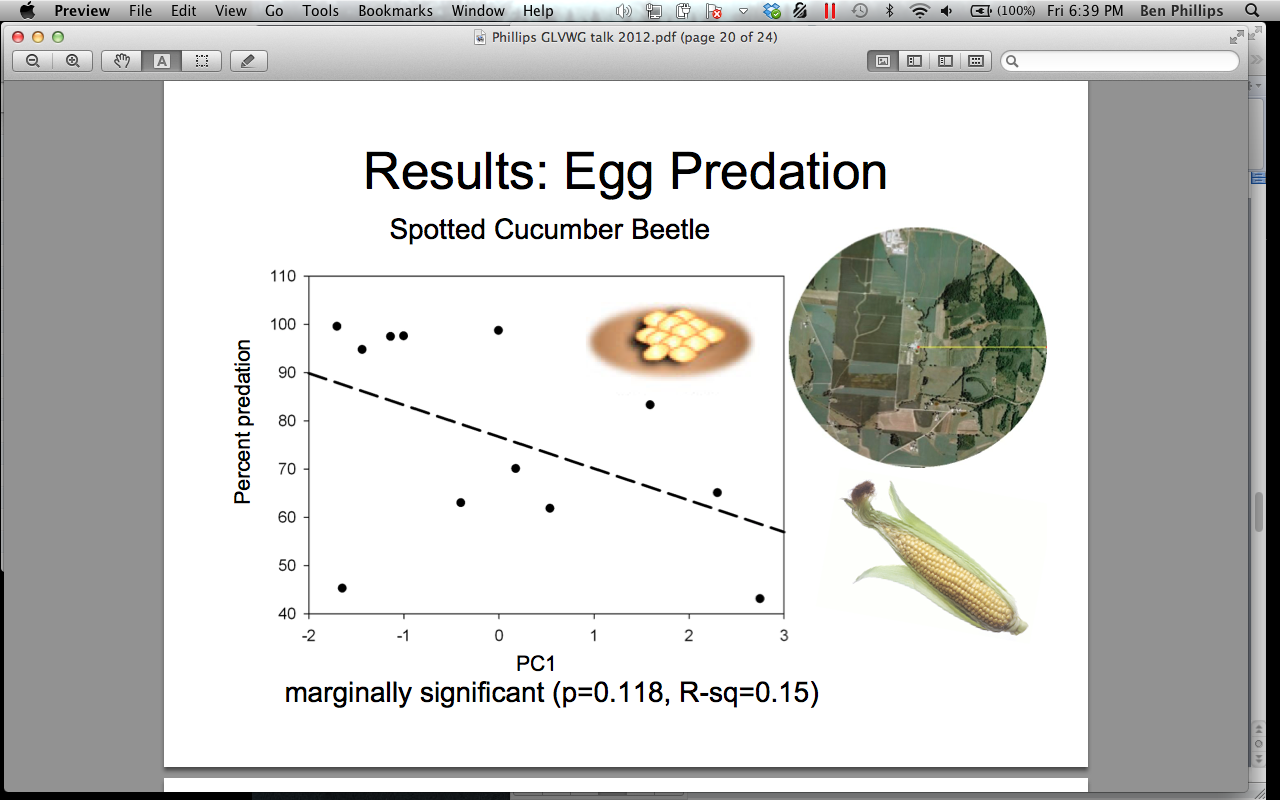
There was a marginally significant positive relationship between the predation on D. undecimpunctata eggs and landscapes characterized by a high proportion of field crops at 1500 m surrounding the pumpkin sites (p = 0.118) (Figure 4). We think this relationship may indicate that predators may be “primed” for eating D. undecimpunctata eggs in areas characterized by field crops because corn is a secondary food source for this pest. Perhaps predators would already be focusing on this resource pulse. There was a moderately significant positive relationship between parasitism of adult A. vittatum and landscapes characterized by a higher proportion of mixed fruit and vegetable crops (p = 0.056) (Figure 5). We interpret this as support that the Celatoria spp fly is a specialist on A. vittatum, and that habitats lacking in their host would not support high parasitism services. A. vittatum can be found predating on all cucurbits, including melons and cucumbers. A diversified farmscape could often have many types of cucurbits, which would support A. vittatum and its specialist parasitoid.
2011 Egg predation video
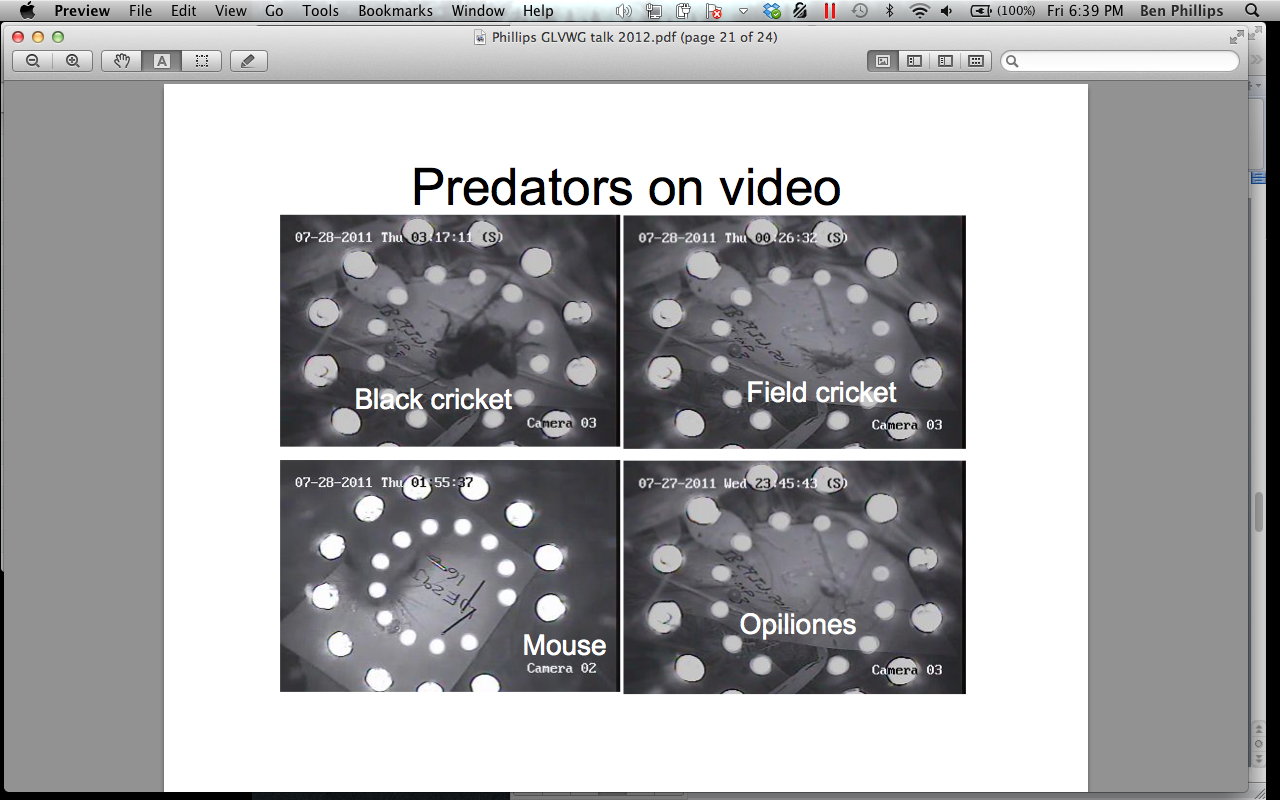
We discovered that the main predators of D. undecimpunctata and A. tristis eggs were ants (Formicidae), daddy-long-legs (Opiliones), and crickets (Gryllidae) (Figure 6). We found this interesting because a large amount of literature has cited ground beetles (Carabidae) as a key generalist predator on insects at many life stages. Perhaps their role as egg predators is not as great as was assumed.
2011 Pollination across time
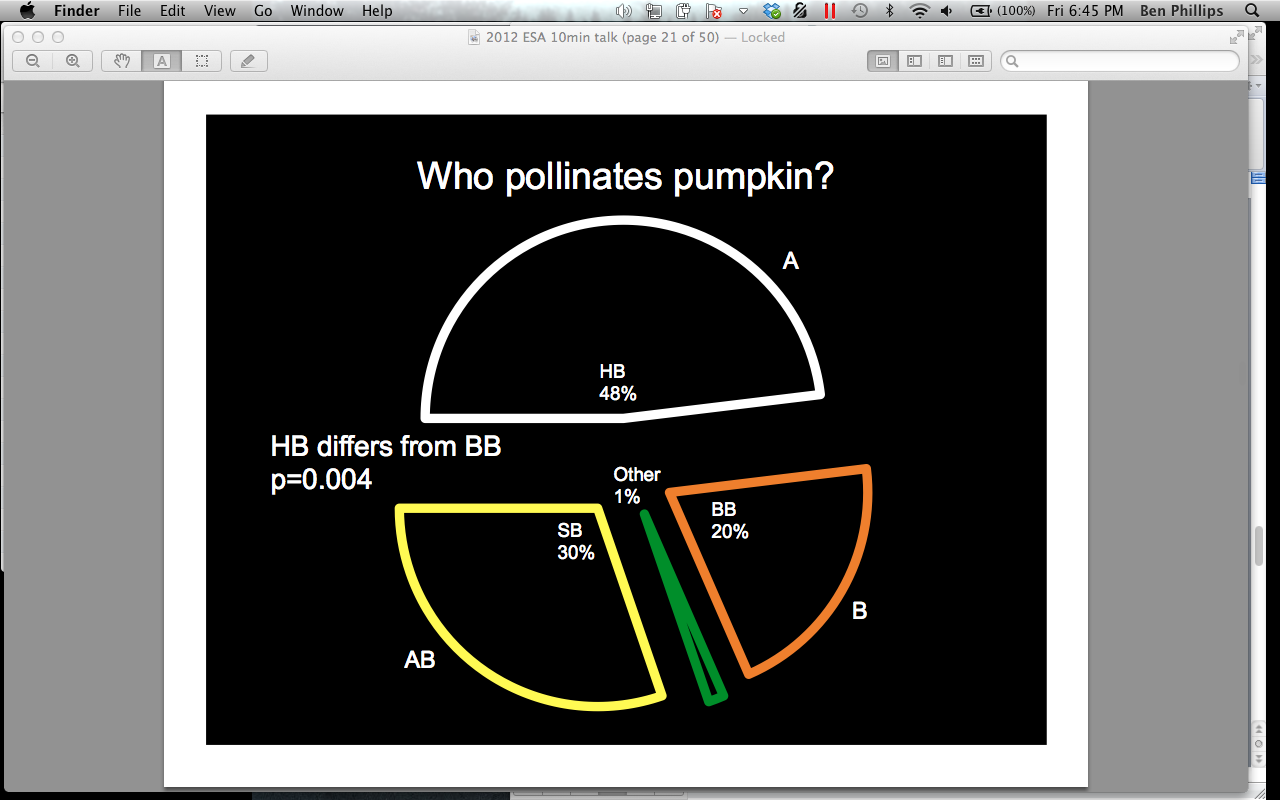
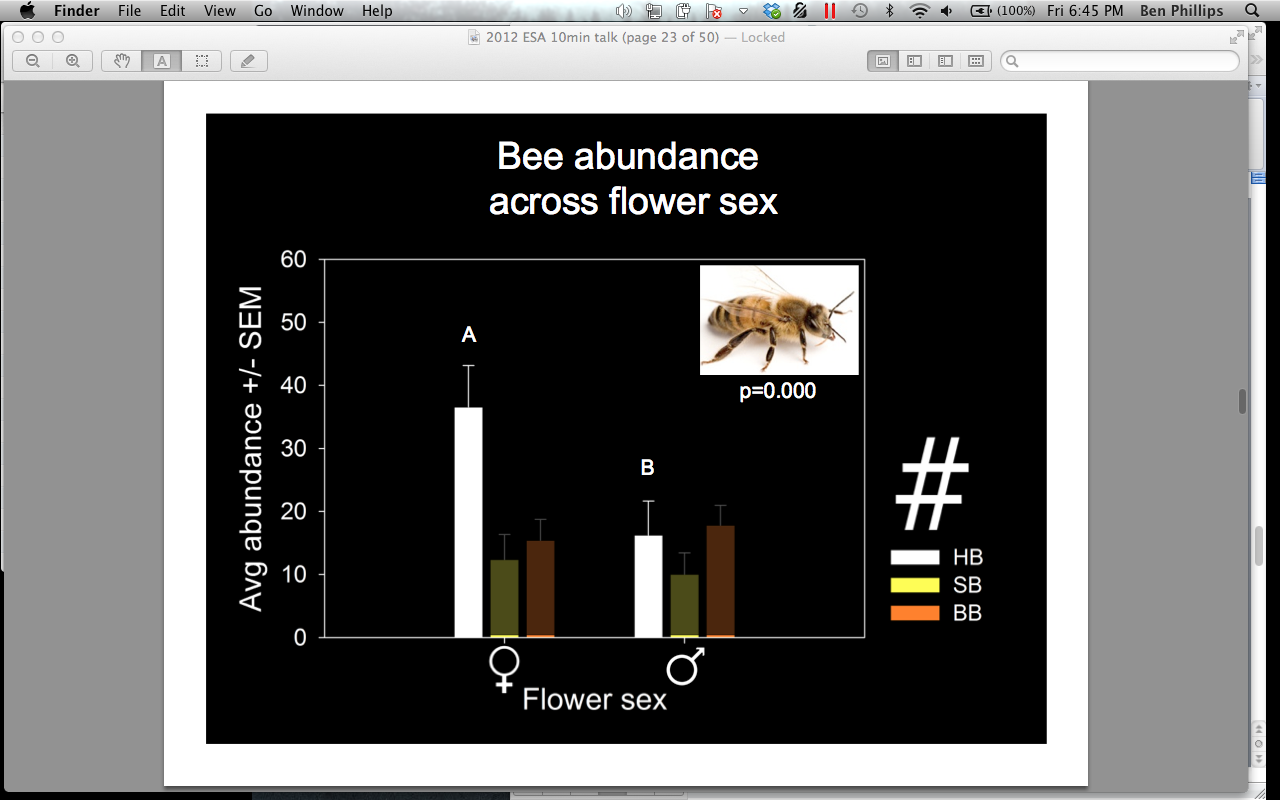
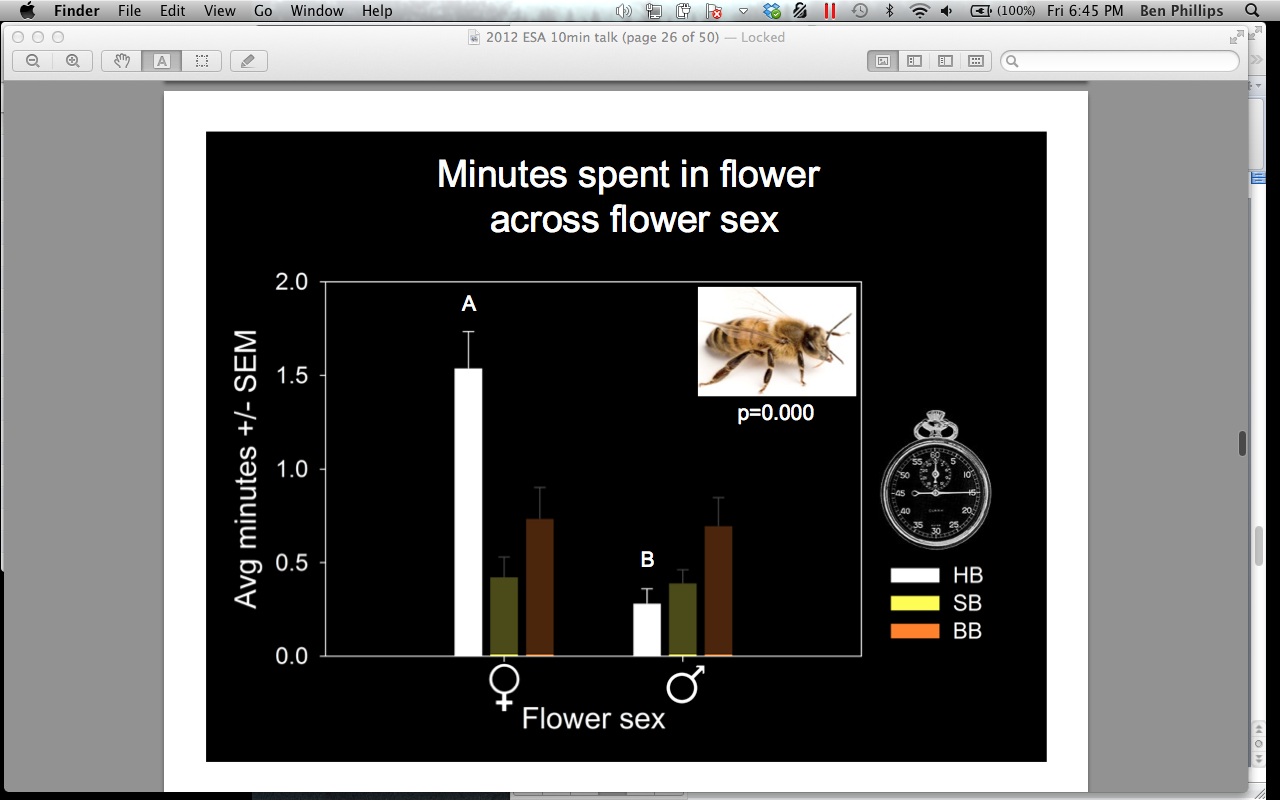
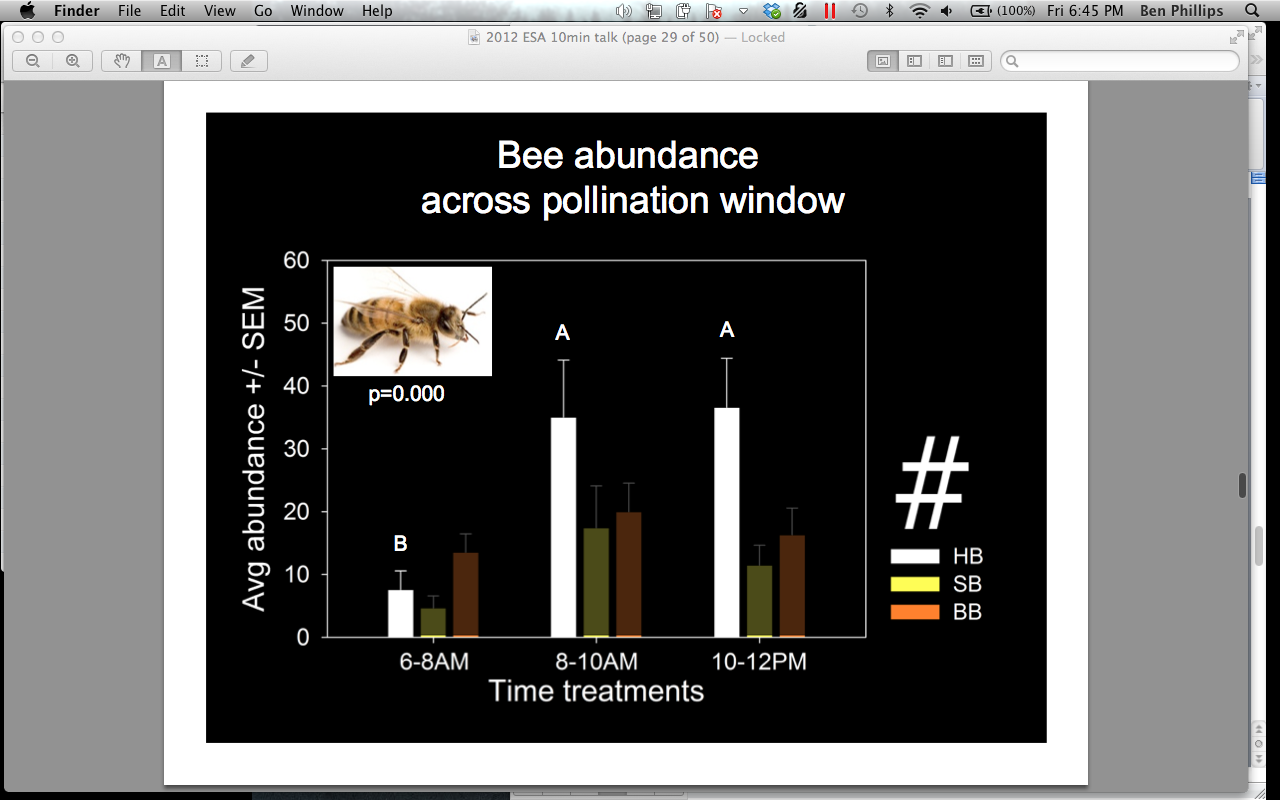
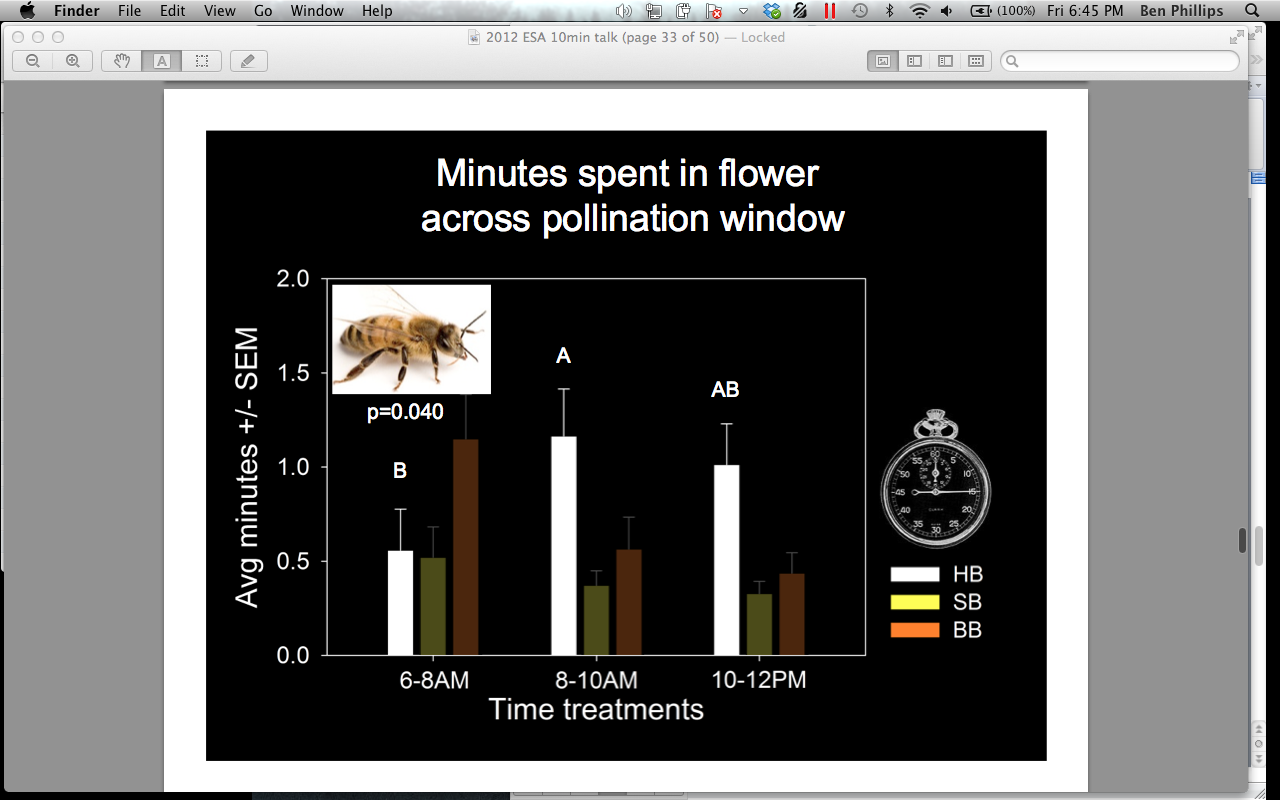
In 2011, 48% of all visitors to the combined male and female pumpkin flowers under video surveillance at all sites were honey bees (Apis mellifera), 30% were squash bees (Peponapis pruinosa), 20% were bumble bees (Bombus spp), and 1% were a mix of Lasioglossum, Mellisodes, Triepeolus, and other unidentified species. A. mellifera was significantly more abundant, overall, than Bombus spp. (p = 0.004) (Figure 7). When we compared attendance of bees on male and female flowers we found that A. mellifera was found in female flowers significantly more than on male flowers (female = 36.59, male = 16.26, p = 0.000) (Figure 8). They also spent significantly more time inside female flowers (female = 1.54 min, male = 0.28 min, p = 0.000) (Figure 9). This trend was not witnessed in Bombus spp or P. pruinosa, which occurred overall in relatively equal numbers in male and female flowers, and spent relatively equal amounts of time inside them. This apparent preference in A. mellifera was an interesting finding that we hypothesized to be an artifact of their overwintering strategy. Female cucurbit flowers produce more nectar than the male flowers, and A. mellifera, unlike most bees, overwinters as an entire colony. This overwintering strategy requires an enormous amount of nectar to keep the population fed. P. pruinosa females burrow up to 60 cm into the soil to lay eggs in lateral chambers in August. Each lateral chamber has one egg cell supplied with nectar and pollen to allow that offspring to survive the winter. Bombus spp work as a colony throughout the summer by establishing a temporary hive in rodent burrows, but all of the workers die in the fall to allow only the queen to nourish herself on the supply of nectar and pollen gathered. Both Bombus spp and P. pruinosa would not require the amount nectar that A. mellifera does, which may explain why we observed a significant difference in their attendance and time spent in female flowers.
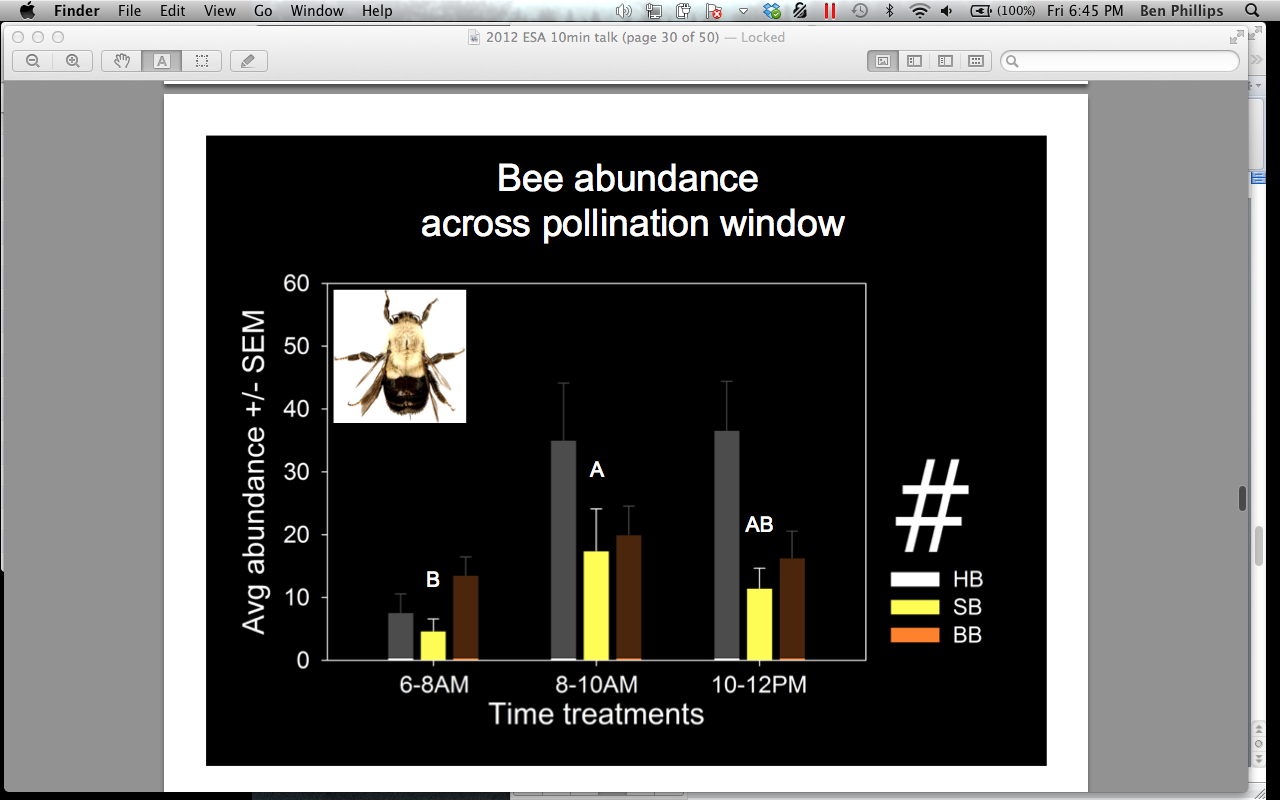
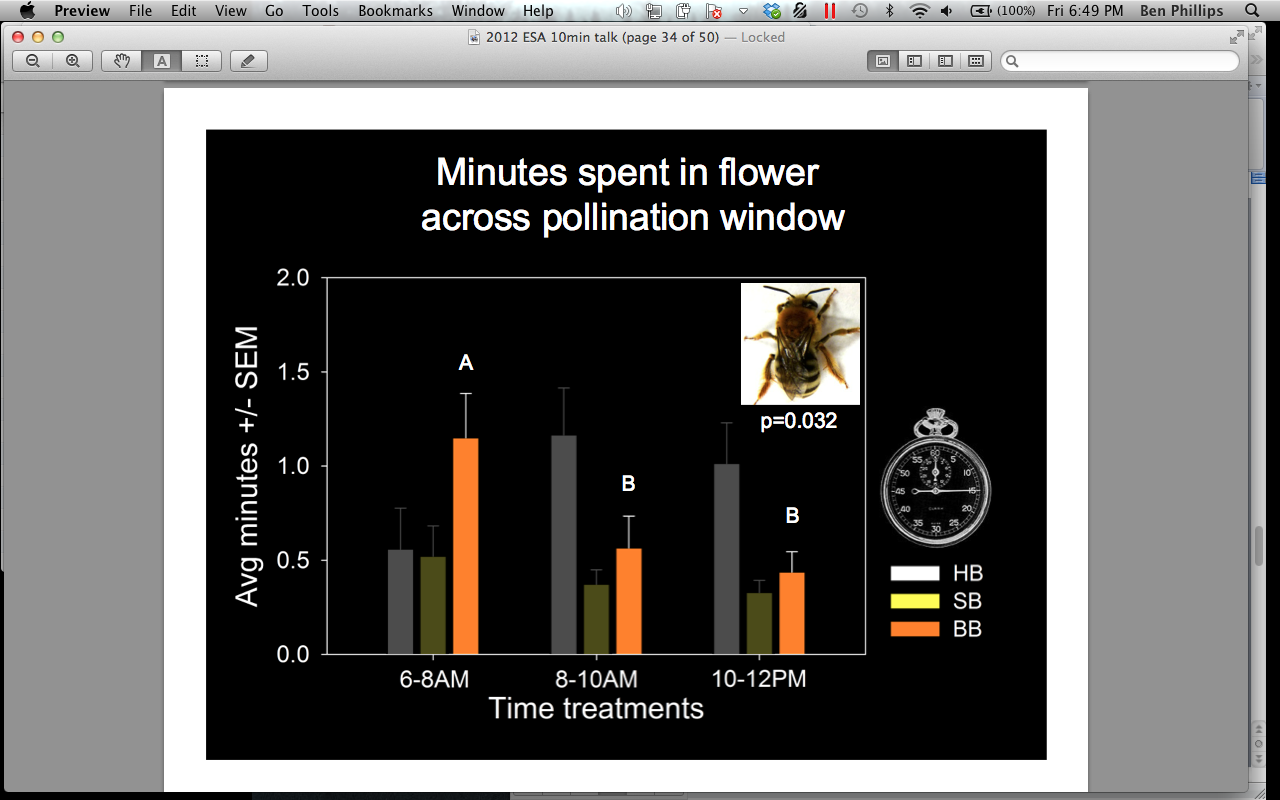
We also compared bee abundances and attendance time across the pollination window (0600-0800, 0800-1000, 1000-1200 hrs). We found that A. mellifera occurs significantly more in flowers after 0800 hrs (p = 0.000), and spends significantly more time inside flowers in the 0800-1000 hrs treatment when compared to the 0600-0800 hrs treatment (Figures 10 and 11). Bombus spp occurs significantly more in flowers 0800-1000 hrs, compared to the 0600-0800 hrs treatment, but does not differ in the amount of minutes spent in the flowers across the pollination window (Figure 12). P. pruinosa does not significantly differ in abundance across the pollination window, but spends significantly more minutes inside the flowers in the 0600-0800 hrs treatment (Figure 13). Based on previous research, we expected to see a higher abundance of P. pruinosa in the 0600-0800 hrs treatment, followed by a decline in abundance as Bombus spp and A. mellifera became more prevalent in the later hours. P. pruinosa has been credited has providing satisfactory pollination early in the morning, when other bees do not fly. Perhaps the number of individuals passing between flowers does not cause this effect, but the amount of time they spend inside of them.
Pollen was removed from stigmas and counted, and the data was averaged across sites for each time treatment. We determined that pollen tube formation was a confounding factor that prevented pollen from being successfully washed from the stigma after accumulating for more than 1 hour. As a result our results appear to show a decline in cumulative pollen deposition across the pollination window (2017.59 grains 0600-0800 hrs, 1818.12 grains 0800-1000 hrs, and 1687.08 grains 1000-1200) (Figure 14). In 2012 we limited each treatment to 2 hours (see methods) to prevent this, but the data has not yet been analyzed.
2011 Pollination across landscape
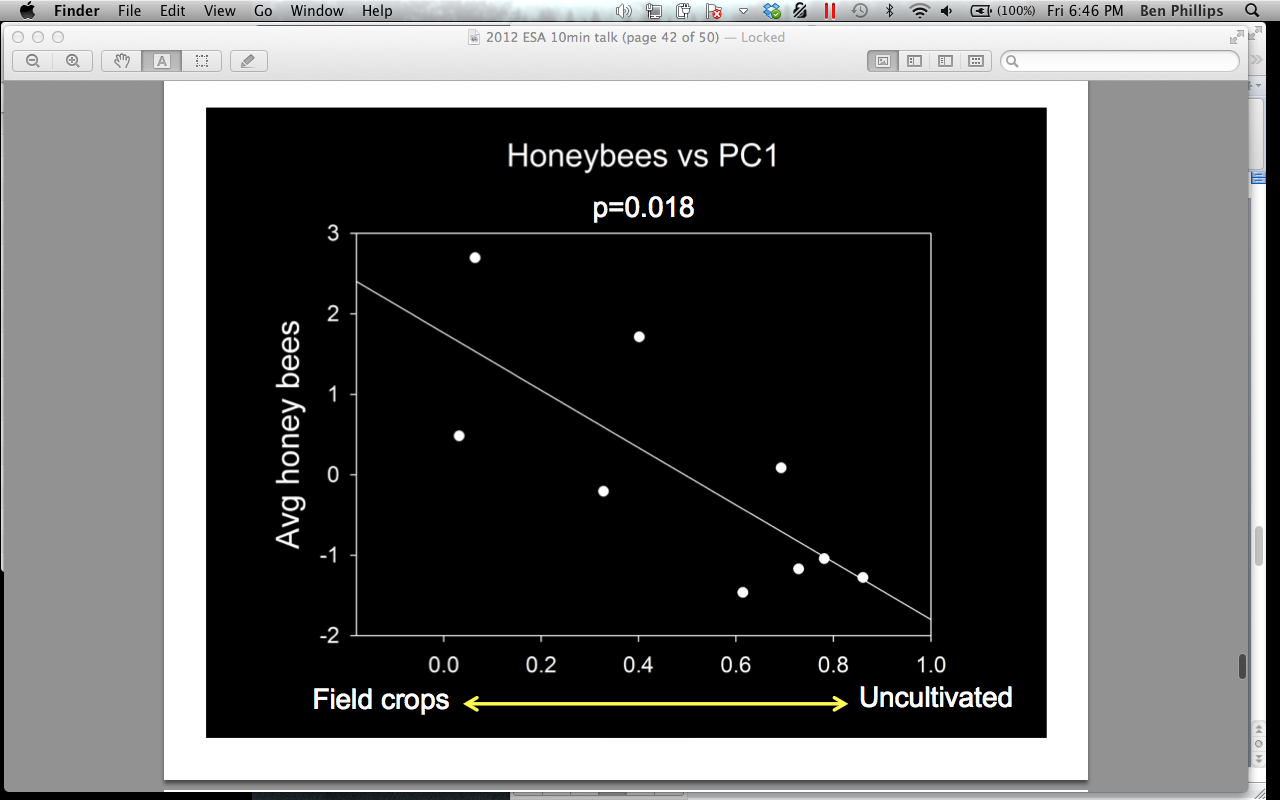
There was a significant positive relationship between the abundance of A. mellifera viewed in male and female pumpkin flowers and landscapes characterized by a high proportion of field crops at 1500 m surrounding the pumpkin sites, and negatively associated with uncultivated areas (p = 0.018) (Figure 15). A. mellifera has been known to feed on corn pollen and in soy bean flowers. This behavior does not necessarily aid reproduction in those plants, as corn is wind pollinated, and conventional soy bean is self-pollinated internally before the flowers open. Perhaps A. mellifera engages in this behavior to a larger extent than previously thought, and then switches to pumpkins during their peak bloom. Another possible explanation for this observation is that uncultivated areas serve poorly to support A. mellifera, and could be evidence of Colony Collapse Disorder.
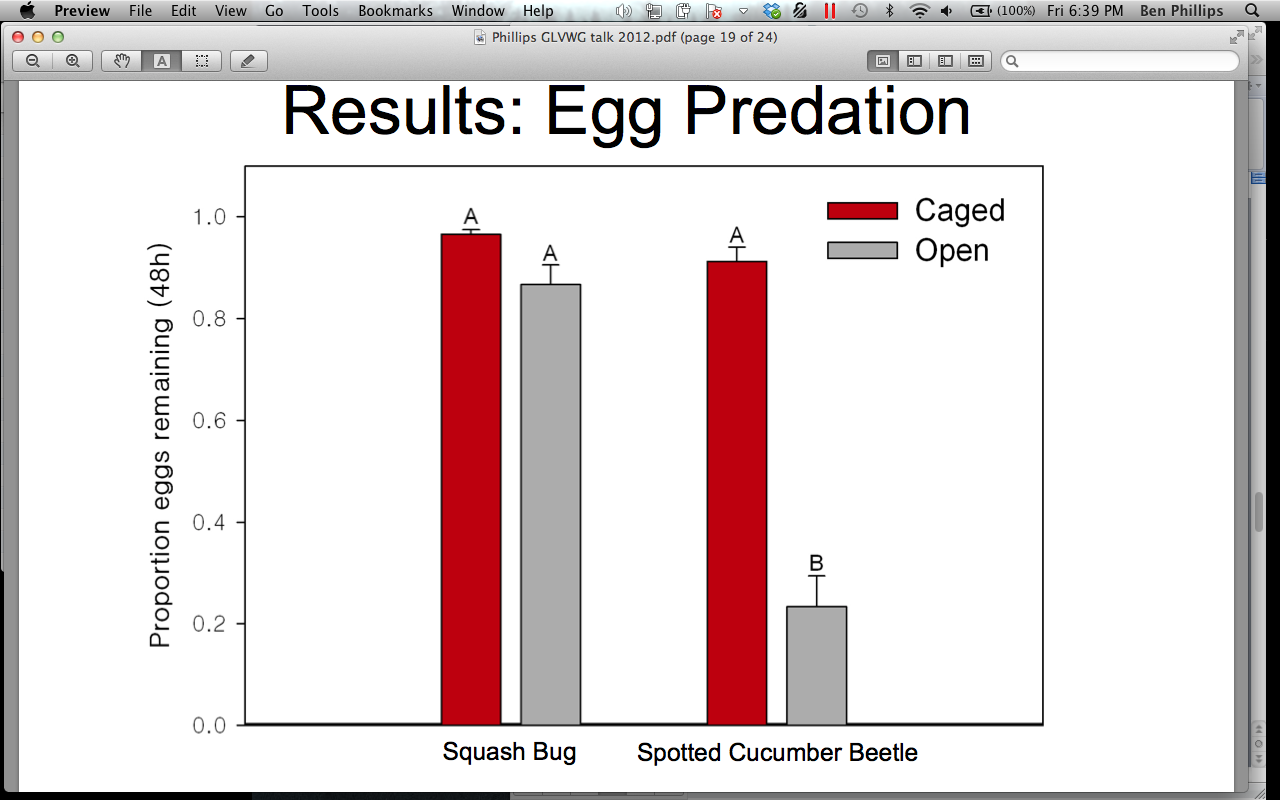
2012 Biocontrol across floral treatments
In 2012 we successfully established CONTROL, ANNUAL, and PERENNIAL treatments at farms across Ohio. We compared the biocontrol services in the pumpkins across these treatments and found no significant difference between floral treatment for egg predation or parasitism of adults (Figures 16 and 17). However, there was a numerical trend towards greater parasitism and predation services in the PERENNIAL treatment. Parasitism services in the ANNUAL treatment were greater than in the CONTROL treatment. However, predation services were higher in the CONTROL treatment, than in the ANNUAL treatment.
Educational & Outreach Activities
Participation summary:
With our findings on the insect communities in pumpkin and floral treatment plots I plan to publish two peer-reviewed research papers. The first paper will focus on the results of examining how the addition of floral strips influenced the diversity, abundance, and activity of pollinators in pumpkin fields. The second publication will report the findings detailing the influence of floral strip addition on generalist predators, parasitoids, and biocontrol services in pumpkin. I also plan to collaborate with our economist to publish an Extension bulletin detailing the full costs and benefits of floral strips as a habitat management tactic for growers. My findings will also be posted online by the Pollinator Partnership, an organization dedicated to the conservation of pollinators.
I attended annual extension workshops including a pumpkin field day held in Piketon, Ohio and a Beekeepers School, in Cincinnati, OH where I presented my findings. I also presented data at national science conferences, including the Entomological Society of America meeting, The Great Lakes Vegetable Working Group meeting, and EcoSummit. These outputs will aid farming communities and the scientific community as a whole in furthering our understanding of conservation techniques in agroecosytems.
Project Outcomes
The results of my biocontrol experiments comparing floral strip systems could potentially impact the agricultural and conservation community by supplying some light evidence that native perennial insectary habitats can increase ambient pest control without the addition of agrochemicals while also adding biodiversity to the surrounding system. The video footage of pest eggs revealed some compelling behaviors of insects that are not often credited as biocontrol agents, and a lack of behaviors from insects that are. This type of data collection is not commonly used because it is labor-intensive, but shows a clearer picture of what is going on. We think more data like this could have an impact on which insects are studied, desired for in farmscapes, and managed for as biocontrol agents in the future.
The pollination experiments comparing bee activity across the pollination window could help farmers decide whether or not they might need to rent or purchase honey bee hives to pollinate their crop, depending on the area in which they live. Though honey bees seem to prefer female flowers over male flowers, their overwhelming numbers can make up for the uneven male : female visitation ratio. However, in an area with low honey bee density, this may result in ineffective pollination. The data shows that bumble bees and squash bees are more even in their visitation between male and female flowers, resulting in a more stable pollen transfer.
Economic Analysis
Economic data was collected with a questionnaire that detailed the costs of establishing and managing the floral strips, and the pumpkin plots. We fixed the cost of fuel, labor (expenditures), and price of pumpkins (return) in an attempt to reduce variation in the individual farmers estimations. All of the raw economics data was sent to Erik Nordman, our economics collaborator in the Biology department at Grand Valley State University. At the point of this report, the results have not been reached.
Farmer Adoption
In my experience creating the network of farmers to help complete the research, I found that some people were more likely to participate than others. Growers were more likely to participate if they partook in previous field research for seed companies or with the university. Still others were new to research collaboration, and were eager to develop a working relationship with the university. In sharing my work with various audiences I felt that growers from small scale and diversified production schedules were most likely to adopt floral stripping as a technique. More information on clear benefits of floral strips, their management, and their integration into the crop will aid further adoption.
Areas needing additional study
Variability in ecological research is an inevitability, especially when the treatments are, themselves, living organisms. In two years, we were able to determine better ways to establish the non-native annual, L. maritima, within pumpkin fields. It was labor intensive, and I am confident that there are better ways to establish this plant, or another, with fewer labor inputs.
Additionally, we did not find any parasitism of A. tristis eggs using our methods (modified from Hoffmann et al., 1991 and Tillman, 2010). We suspect that the egg parasitoids of A. tristis respond to specific queues that we were unable to reproduce, or interfered with, in gluing the eggs to the card stock. To examine egg parasitism levels more accurately, a field study may need to be conducted on egg masses that occur naturally in the field.