Final Report for GNC14-190
Project Information
Precise water application conserves resources, reduces costs, and optimizes plant performance and quality. Existing irrigation scheduling utilizes single, localized measurements that do not account for spatial crop water need; but, quick, single-point sensors are impractical for measuring discrete variations across large coverage areas. Thermography is an alternate approach for measuring spatial temperatures to quantify crop health. However, agricultural studies using thermography are limited due to previous camera expense, unfamiliar use and calibration, software for image acquisition and high-throughput processing specifically designed for thermal imagery mapping and monitoring spatial crop water need. Recent advancements in thermal detectors and sensing platforms have allowed uncooled thermal infrared (TIR) cameras to become suited for crop sensing.
Therefore, a small, lightweight thermal infrared imaging system (TIRIS) was developed capable of radiometric temperature measurements. A one-time (OT) radiometric calibration method was developed and validated for repeatable, temperature measurements while compensating for strict environmental conditions within the field. A TIRIS was built for high-throughput image capture, correction, and processing and RT environmental compensation for temperature mapping aboard a small unmanned aerial systems (sUAS). Similarly, static validation aboard static and dynamic platforms provided radiometric thermal images with a ±0.60°C (α=0.05) measurement accuracy. Due to the TIR cameras’ performance, a TIRIS could provide unparalleled spatial coverage and measurement accuracy capable of monitoring subtle crop stress indicators on sensing platforms intended for extended coverage area. Further studies need to be conducted on dynamic sensing platforms to produce spatial crop water stress maps at scales necessary for variable rate irrigation systems.
By simplifying image acquisition and application solutions, producers, agricultural service providers, and researchers will have acquisition system for capturing high spatial surface temperatures to develop management solutions to better allocate available water resources for variable rate irrigation. Therefore, research objectives were to develop (1) an environmentally compensated thermal infrared imaging system (TIRIS) capable of measuring accurate surface temperatures at accuracies and resolutions sensitive to crop health monitoring, (2) a small, lightweight TIRIS package for temperature mapping aboard a multirotor sUAS, (3) a complementary hardware and software package to radiometrically calibrate the TIRIS during infield setup while providing in-flight ground truthing.
Cooperators
Research
A small, lightweight TIRIS was developed with an uncooled Tamarisk® 640 TIR cameras (DRS Technologies, Inc., Dallas, Texas) offering the highest spatial resolution configuration available to the commercial market. The development of a TIRIS for thermal mapping aboard a multirotor sUAS has been supported with preliminary studies that investigated the physical properties and environmental conditions that restrict the practical use of TIR cameras’ in precision agriculture. The hardware and software required to integrate an uncooled TIR camera core into an imaging system were identified and built to include a sUAS thermal imaging acquisition system, in-field calibration system, and ground reference monitoring system for real-time environmental parameters during a flight campaign. Evaluation was conducted to investigate control ease, standard operating protocol, radiometric calibration, and measurement accuracy, thereby completing system validation. Physical properties that restricted TIR camera use were identified and investigated as the following:
- Image resolution
- Lens distortion
- Warm-up time and camera recalibration
- Radiometric characterization
- Camera controllability
- Hardware and software
These physical properties and their influence on accurate surface measurement were considered in order to minimize influence by configuring the camera and hardware for use aboard sUAS, designing image processing software specifically for thermal imagery, generating standard operating protocol, and selecting a camera-lens combination suited for the sensing platform. System expectations for validation included maintained temperature measurement accuracy, camera controllability, limited image noise, and spatial accuracy.
1. Image Resolution
The TIR camera core was chosen based on its small size, low weight, limited power consumption, capture framerate, and thermal detector, called a microbolometer, resolution. For high spatial resolution applications, a DRS Tamarisk® 640 TIR camera core with a 640×480 fixed pixel array microbolometer was chosen featuring a 25 mm lens with a 24º×19º FOV. In application, temperature monitoring and mapping aboard sUAS use the theoretical camera field of view (FOV), critical spatial resolution, and the desired level of detail specific in order to determine the sUAS autopilot flight program regarding altitude, flight speed, and flight orientation. These flight parameters have direct implications on the resulting orthomosaic image from sufficient image overlap, camera stability, on-ground coverage, and the volume of images captured to sense the entire coverage area (Rango, et al., 2009).
2. Lens Distortion
Maintained lens focus over a wide span of temperatures is essential for quality thermography. Unlike autofocus of a typical visible camera, the lens focal length on a TIR camera core must be adjusted to focus on particular sensing distances (DRS Technologies A Finmeccanica Company, 2013). TIR camera lenses are constructed from an expensive material known as germanium, which is transparent to thermal radiation (Kuenzer, 2014). Germanium lenses are optimized for radiometric transmission, increasing the susceptibility to geometric distortion that causes spatial inaccuracy. A distorted image does not fully represent real spatial points but a distorted location dependent on the position within the lens’ FOV. Because the manufacturer does not provide lens distortion coefficients, lens distortion was investigated using a Grid Distortion Model calibration approach. Resulting lens distortion coefficients were used in the image processing algorithm for batch processing in order to undistort images for precise location.
3. Warm-up Time and Camera Recalibration
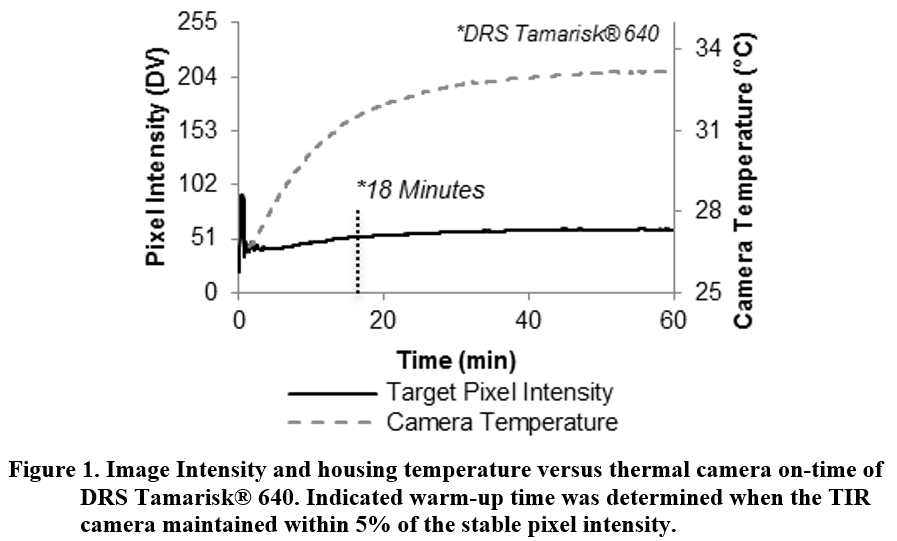
Because uncooled TIR cameras operate without heavy cooling jackets, uncooled TIR cameras regulate their thermal detectors with automatic temperature re-calibration to maintain sensor accuracy and limit sensor measurement drift caused by temperature fluctuations (DRS Technologies, Network and Imaging Systems Group, n.d.). A shutter recalibration technique is activated to conduct a non-uniformity correction (NUC) across the thermal detector at either a user-defined time interval and/or in the event of an internal temperature change of the thermal detector (DRS Technologies, Network and Imaging Systems Group, n.d.). During a NUC, the camera shutter closes to block incoming thermal energy, thereby providing a uniform thermal reference for the detector. At that time, a recalibration algorithm ensures a uniform pixel intensity is measured across the entire microbolometer. As a result, each TIR camera core’s warm-up time needs to be determined before use in an imaging system. Warm-up times of 18 min with a 1 minute timed-interval NUC were necessary for stable temperature measurement of the Tamarisk® 640 (Figure 1). Adherence to the required warm-up period during standard operating protocol reduces inaccuracy as the camera reaches a stable operating temperature.
4. Radiometric Calibration
Because uncooled TIR cameras have a low signal-to-noise ratio, their thermal detectors are less sensitive (±0.1°C) than other temperature sensors (Kuenzer, 2014). However, microbolometers are sensitive to subtle temperature differences (<0.5°C) necessary for accurate crop stress assessment (Blonquist & Bugbee, n.d.; Sepulcre-Canto, et al., 2007). In the context of agricultural sensing applications, the Tamarisk® 640 is sensitive to 8 to 14 µm longwave infrared (LWIR) radiation corresponding to a -66ºC to 90ºC temperature span. In operation, LWIR radiation strike the detector material, altering the electrical resistance from a temperature change, transforming LWIR radiation intensity into a raw digital value (DV), thereby generating a thermal image (Kuenzer, 2014).
A limitation of uncooled TIR cameras, however, is their inability to quantify absolute temperatures. Therefore, a one-time (OT) radiometric calibration method was developed and used to quantify absolute surface temperature at environmental conditions in which the uncooled TIR camera was calibrated. A OT radiometric calibration uses one calibration image to characterize pixel-to-temperature relationships, as shown below in Figure 2. Using the radiometric calibration method, the uncooled TIR camera core was found to be directly sensitive (R2 = 0.99) to the temperature within the FOV (Figure 2).
5. Camera Controllability
The selected TIR camera core provides an 8-bit (256 discrete pixel intensity DV) thermal video. Within the TIR camera control software, the camera was configured for video output and frame rate, and thermal detector sensitivity. In order to set the DRS Tamarisk® 640 camera core, a DRS breakout board module (Breakout Box 1003785-001, DRS Technologies, Inc., Dallas, Texas) adjusts the thermal detector gain sensitivity (i.e., detectable scene temperature span) and level control (i.e., shift offset of the center temperature within the temperature span), thereby improving detected thermal energy of the scene temperatures (Figure 3).
Manual control of the DRS Tamarisk® 640 thermal detector gain and level yielded a configurable temperature span from 5°C to 156°C and resolution from 0.02°C to 0.61°C (Figure 4).
As shown in Figure 4, camera control software adjusted the limits of upper and lower pixel saturation while adjusting measurable temperature resolution on object targets. For example, a temperature span of 20°C is set by the camera gain control whereas a center temperature of 25°C is controlled by the level control. In this example, the lower and upper saturation temperatures would be at 15°C and 35°C, respectively. In addition, the temperature resolution of the resulting 8-bit image of a 20°C span would equal 0.08°C, as defined by Equation 1.
A significant relationship was found by combining temperature span and incremental offset level range where each level control increment offsets the temperature span by 0.107 ºC, regardless of gain control. This was directly applicable for use in the field calibration software in order to provide suggested camera configurations for a particular temperature span and center temperature.
6. Hardware and Software Development
Three distinct portions of the TIRIS are segmented into the sUAS TIRIS, OT calibration, and ground reference station. The system hardware and software was specifically developed to configure the TIR camera core within the sUAS TIRIS, provide OT radiometric calibration, and measure real-time environmental parameters for in-flight ground truthing in order to compensate for environmental conditions and maintain measurement accuracy (Figure 6).
The DRS breakout board module (Breakout Box 1003785-001, DRS Technologies, Inc., Dallas, Texas) functioned as the camera configuration board, video interface, and power input. Analog video was stored in video form using a miniature digital video recorder (RMRC FPV1000 DVR, ReadymadeRC, USA). The TIR camera core and video recorder were set to record video at 30 frames per second. Power was supplied with an 11.1 volt battery (RMRC 1100mAh 3S 35C, ReadymadeRC, USA).
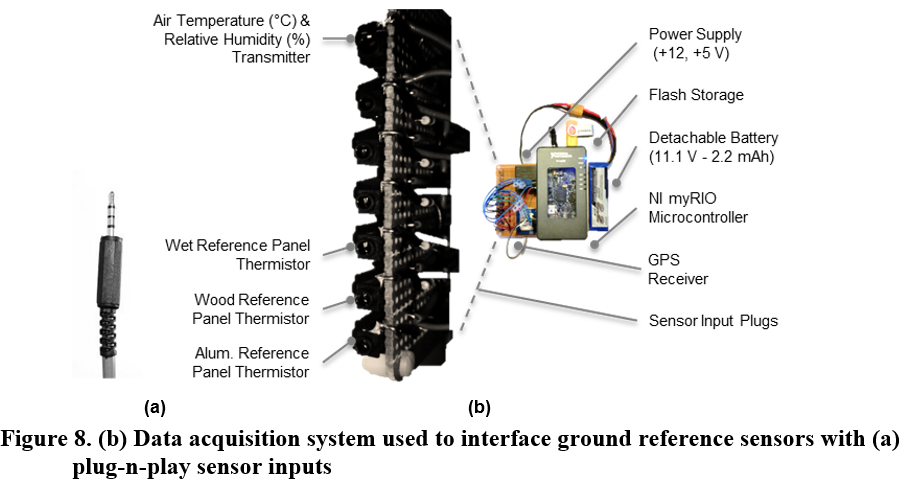
The ground reference station measured in-flight ground truthing reference data, such as air temperature and relative humidity, reference panel temperature, solar radiance, and global positioning from a GPS receiver. Air temperature and relative humidity were measured with an Omega (HX303AV, Omega, Stamford, Connecticut) transmitter sensor with an accuracy of ±3% and ±0.3°C. Solar radiance was measured with a pyranometer (SP115, Apogee Instruments, Logan, Utah) with accuracy of ±0.25 W m-2. Three surface mounted thermistors (ON-930-44004, Omega Engineering, Stamford, Connecticut) capable of temperature measurements with an accuracy of ±0.1°C were used to measure temperature panels in order to create reference surface temperatures.
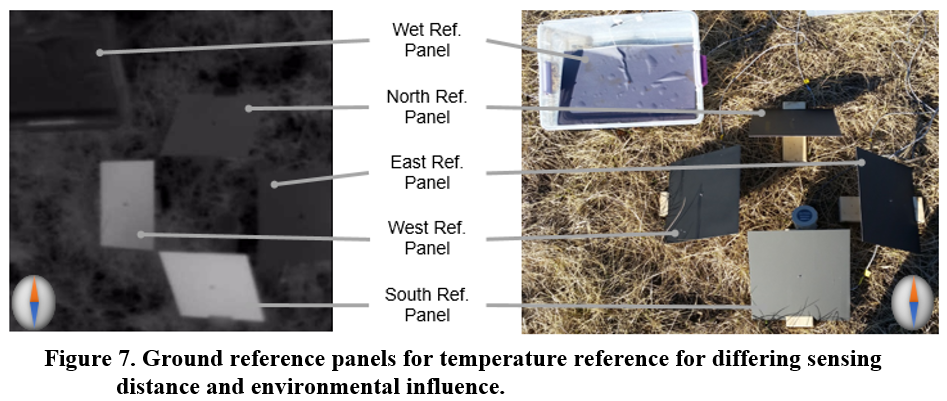
Four reference panels were fabricated from a 0.30×0.60 m piece of 1.52 mm thick (14 gauge) aluminum sheet metal and painted flat black. The fifth reference panel was identified as a wet reference. To make the wet reference, a 0.30×0.60 m polystyrene foam pad was covered with a highly evaporative cloth (Chilly Padd, Arab, Alabama) that rapidly cooled when exposed to air. This foam piece was placed in a tub of water to allow continuous wicking and evaporation. In order to provide an emissivity correction, indirect background temperatures of the sky were measured from a viewable horizontal lambert radiator (i.e., crimped aluminum sheet metal). Differential temperatures provide visible reference temperatures within the TIR camera’s FOV (Figure 7).
Reference temperature panels were sized to be viewable from aboard a sUAS and materials were constructed with a high surface emissivity in order to increase measurement accuracy. A data acquisition (DAQ) system was built using a NI myRIO (National Instruments Corporation, Austin, Texas) in order to capture thermistors, air temperature, relative humidity, solar radiance, and global position and time, as shown in Figure 8. Data was captured at 5 hz matching the frequency of the GPS reciever (Crius CN-06 V3 GPS Receiver Module, Swiss U-Blox, Thalwil, Switzerland). The DAQ was programed to store all sensor data files in a measurement file into a flash storage device. Each data sample in the ground reference measurement file had a corresponding time stamp that was parsed from a GPS national marine electronics association (NMEA) message string provided by a GPS receiver. Each thermal video had a corresponding ground reference measurement file.
A lipo battery (RMRC 2200mAh 3S 35C, ReadymadeRC, USA) supplied power to a power supply in order to provide sensor excitation voltages and power to the microcontroller.
For the OT calibration components, analog video from a sUAS TIRIS is streamed at 30 Hz into an analog-to-digital video converter (Dazzle DVD Recorder HD, Corel Corporation, USA). This raw analog video signal was streamed into a host computer aboard sUAS using LabVIEW™ (National Instruments Corporation, Austin, TX) image acquisition and processing software in which each video frame was captured, processed, and stored using a developed virtual interface (VI) to radiometrically calibrate the TIRIS and provide ground reference data. Ground reference data from the DAQ was wirelessly sent to the host computer using a developed software package to perform on-ground OT radiometric calibration before flying a sUAS and monitoring in-field data of the ground monitoring station.
6.1 Radiometric Calibration and Ground Reference Data
For a OT radiometric calibration, direct surface temperature measurements (Figure 9) and camera pixel intensity from the analog video stream were monitored with a TIR Field Calibration (TFC) software program developed with NI LabVIEW™ (National Instruments Corporation, Austin, TX) (Figure 10). For ease of camera configuration, characteristic gain and level responses were used to set the cameras for a user-defined span and center level temperature.
6.2 Camera Housing Design
The camera housing design was designed for a multirotor sUAS that contains a gimbal camera mount below the main airframe to maintain stable nadir camera orientation for improved aerial thermography. A small, lightweight camera case was developed to mount all sUAS TIRIS components and provide protection while aboard a sUAS. The camera housing was generated using computer aided design (CAD) modeling (Pro/Engineer, PTC Inc., USA) (Figure 11.a). A 3D printer (Makergear™ LLC, Beachwood, Ohio) was used to print a camera case out of polyactic acid (PLA) plastic because of printing ease and UV protection for use in the field (Figure 11.b).
6.3 Field Testing
The thermal camera was mounted on fixed and dynamic platforms for constant nadir orientation (Figure 12).
Prior to a test, the standard operating procedures are determined as follows:
- Unpack equipment
- Power on the TIRIS to allow the TIR camera core to warm-up
- Setup the ground reference station
- Power on the ground monitoring station in order to achieve a GPS fix
- Start laptop to program and configure the TIRIS
- Connect the TIRIS to the on-ground OT radiometric calibration hardware
- Configure the Tamarisk camera core using Camera Configuration Software
- Conduct an on-ground OT Radiometric Calibration
- Start recording a simultaneous thermal video and ground measurement file
- Mount the TIRIS on the sensing platform
- Take sample measurements for image processing
- Stop recording the measurement file and thermal video
- Validate data was recorded
- Finish testing and load equipment
By mounting the system on a ground-based platform, vegetation grown in the greenhouse and research farms was monitored for temperature measurement accuracy. By conducting greenhouse tests, only temperature, humidity, and sensing distance were varied. With successful greenhouse monitoring, the CAT system was tested under uncertain field conditions. This objective validated the camera setting recommendations for thermographic calibration for environmental compensation.
A small, lightweight TIRIS was developed for thermal mapping aboard a multirotor sUAS. The TIRIS capabilities include one TIR camera core, ground measurement system to record and transmit environmental parameters, and on-ground OT calibration equipment. When considering the application, the necessary spatial resolution, budget, and permissible payload determines which uncooled TIR camera core is appropriate. In addition, the sensitivity, controllability, measurement accuracy, and necessary hardware and software will be dependent on uncooled TIR camera core selected.
Due to their low cost compared to cooled TIR cameras, minimal size and weight, and lack of moving parts, uncooled TIR cameras have been emphasized and utilized aboard sUAS platforms for coverage and spatial crop temperature assessments. Study results indicated that TIRIS could be further researched in order to produce temperature maps for spatial crop water stress at scales needed for large agricultural production systems. Producers, agricultural service providers, and researchers should consider TIRIS for crop water stress monitoring applications.
In application, important factors critical for the design and testing phase of the TIRIS is related to the sensing platform’s permissible payload, the survey area and resulting sensing distance and spatial resolution, required temperature measurement accuracy, and the end use of the temperature data. The following sections describe the measurement accuracy and importance of matching a TIRIS spatial resolution to the desired target resolution.
Ground Reference Data
Ground truthing was used to validate the on-ground OT radiometric calibration. Thermal images obtained after processing were used to verify that image pixel intensity of the images remained within upper and lower saturation points of the thermal detector. As a result, all vegetation (or desired target) must remain within the scene temperatures for quality thermography. This acts as a validation that the correct camera configuration settings were set based on the user-defined temperature span and center temperature.
Ground reference data monitored during fixed tests were used to conduct on-ground OT radiometric calibrations. With a 5 Hz sample rate, subtle differences in reference temperature panels are shown in Figure 13. Results show the reference panels with different orientation provided temperature differentials needed for environmental compensation to reduce LWIR energy attenuation from the influence of water vapor and aerosols present between the TIR camera and the reference panels as suggested by similar protocol conducted by Berni et al. (2009) and Monteith and Unsworth (2013). By ground truthing the thermal imagery, the TIRIS measurement accuracy was found to be ±0.60ºC (α=0.05) using the on-ground OT radiometric calibration, as shown in Figure 14.
Spatial Resolution and Measurement
Pixel-by-pixel resolution ROI analysis provided a recommended spatial resolution in order to limit false measurements. The spatial resolution was adjusted within a developed ROI analysis program, and the corresponding quantified temperature is shown in Figure 15. Results show measurement accuracy diminished from increasing ROIs of spatial resolutions from influence from warm background soil temperature. At a spatial resolution of 200 cm/pixel, the measured temperature was 3.0°C above the measured temperature at 6 cm/pixel. Results reveal a spatial resolution above that of the critical target spatial resolution (6 cm/pixel in this scenario) significantly impacts the measurement accuracy of a TIRIS aboard sUAS.
In application, the above influence could vary through crop development, where the largest influence may occur early in the growing season when soil dominates most of the measurement surface. Later in the growing season, a full canopy would reduce but may not eliminate this error.
Sensing Altitude and Coverage Area
For high spatial resolution applications, a DRS Tamarisk® 640 TIR camera core with a 640×480 fixed pixel array microbolometer was chosen featuring a 25 mm lens with a 24º×19º FOV. Table 1 illustrates the theoretical spatial resolutions and FOV with the chosen lens at select sensing distances.
Temperature mapping uses the theoretical FOV, critical spatial resolution, and the desired level of detail specific to the sensing application in order to determine the sUAS autopilot flight program regarding altitude, flight speed, and flight orientation. These flight parameters have direct implications on the resulting thermal imagery from sufficient image overlap, camera stability, and the volume of images captured to sense the entire coverage area (Rango, et al., 2009). In addition, a sensing distance depicts the on ground coverage. For example, the Tamarisk® 640, flown at 40 m with a nadir orientation, will have a spatial resolution of 27 mm/pixel and the resulting image will have an on-ground coverage of 18×13 m (Table 1).
In application, measurement error can be introduced from bidirectional reflectance due to varying incident radiation (Jones, et al., 2009). Unlike visible imagery that is subject to incident visible light radiation, thermal imagery is subject to bidirectional effects of thermodynamic heat transfer. Time and changing viewing angle between images may cause subtle temperature differences between targets from changes in convective, conductive, and radiant heat transfer due to changing air temperature, relative humidity, air drawn across the target surface, and incoming solar radiation. To account for bidirectional influence, multiple camera viewing angles provide a more representative sampling mean of a target’s temperature (Jones, et al., 2009). As a result, image overlap improve this representative pixel intensity by providing multiple camera views defined by the lateral and forward overlap as defined by Equation 2.
Using Equation 2, for example, a forward and lateral overlap of 75% and 75%, respectively, results in 16 camera views of a specific target surface. Uniform forward and lateral image overlap is an important criteria when planning the flight campaign in order to increase the confidence level that a measurement truly represents the target surface. In addition, increased overlap produces more measurement samples of a target thereby reducing the standard error of the mean pixel intensity within the thermal image.
Educational & Outreach Activities
Participation summary:
Documentation regarding limitations, technical assistance, operation, and performance guidelines were limited prior to this research for thermal imaging in agricultural production. To develop an outreach for this type of technology, results were submitted to the Computers and Electronics in Agriculture (COMPAG) journal, published in the American Society of Agricultural and Biological Engineering (ASABE) conference proceedings, and published in my Master’s thesis at Kansas State University.
In addition, research results were presented at events held by Kansas State Research-Extension offices with face-to-face interactions with producers to receive their feedback on what they require from a sensing system, how they can apply variable rate irrigation, and what their operation needs to save input costs. Transdisciplinary collaboration between researchers, agricultural service providers, and producers was initiated for the constant feedback for design improvements, ease of adoption in precision cropping systems, preferred system capabilities, and market readiness.
Lessons learned during the project were shared to increase the end-users understanding of TIRIS systems for future research regarding (1) knowledge and processes using laboratory calibration and validation curves, (2) calibration protocols for determining in-field settings, (3) warm-up periods for stable signal output, (4) methods of safely mounting the system, and (5) sensing distances to maximize image accuracy. Due to the increasing sUAS industry, we presented our research findings and supported research to multiple age groups of student, producers, educators, industry collaborators, extension personnel, and researchers with lectures, seminars, clinics, public extension websites, poster competitions, and open house events. For example, we presented this research and research supporting by the TIRIS at the following locations attended by the indicated number of people:
- American Society of Biological and Agricultural Engineering Annual International Meeting (30 industry experts, professors, extension agents, and producers)
- Associate of Agricultural Food and Biological Engineers of India Origin Student Competition (40 industry experts, professors, and producers)
- Boyd Scott Student Competition (20 graduate students and professors)
- Kansas Agricultural Research and Technical Association (KARTA) members (125 Ag producers, education researchers, and extension agents)
- Texas A&M Small Unmanned Aerial Systems Clinic (75 Ag producers, education researchers, and extension agents)
- University of Nebraska at Lincoln Precision Ag Clinic (40 Ag producers, education researchers, and extension agents)
- Association for Unmanned Vehicle Systems International Conference (Ag producers, education researchers, and extension agents)
- Kansas State Extension Clinics (60 Ag producers, education researchers, and extension agents)
- K-12 STEM Students visiting Kansas State University (50 high school students, 10 high school educators, and 10 Kansas State faculty)
- Arizona University Phenotyping Conference (60 educators, plant breeders, and professional students)
- Kansas State Agricultural Graduate Seminar (35 graduate students and college professors)
- Research results are published online for easy public access through our K-State website on Multidisciplinary Environmental and Agricultural sUAS Applications (http://www.k-state.edu/measa/).
Project Outcomes
Areas needing additional study
The critical spatial resolution necessary for accurate vegetation leaf temperature could vary through crop development, where the largest influence may occur early in the growing season when soil dominates most of the measurement surface. Therefore, future research needs to be conducted to develop advanced image analysis procedures; and, use a combination of visible and color infrared (CIR) cameras to accurately segment crop canopy from background soil. These additions could help accurately map canopy temperature at high spatial and temporal resolution throughout crop development.
Intermediate-term outcomes of the research is the adoption of inexpensive, lightweight thermal sensing platforms aboard sUAS. Not only would the resulting resources advance thermal sensing guidelines in agricultural field conditions, but provide practical knowledge and awareness of the technology to increase the adoption in disciplines not limited to crop water stress, such as evaluating nutrient application, comparing phenotypes for enhanced genetic breeding, and monitoring environmental and animal health. Findings of this research support future studies to capture spatial temperatures aboard ground and aerial-based sensing platforms to generate high-spatial thermal images for unique monitoring of crop health for new and advanced relationships.
This is a foundation for future research of all-season crop water stress thereby enhancing irrigation scheduling and decision making not limited to the North Central Region (NCR) of the U.S. Long term project outcomes are the changing of perspectives towards sensing crop water stress instead of tedious and limited soil moisture measurements. Learning outcomes include understanding the critical need for sensing technology to support future studies in sustainable crop production and resource conservation by optimizing water use by using site-specific crop water stress. This has relevance because technology adoption will provide job opportunities to positively impact the economic, social, and cultural structures of rural communities and help NCR-SARE achieve its goal of ‘sustainable agriculture’.