Final report for GNC15-216
Project Information
Small grains, such as oat (Avena sativa L.), are an important component of organic row crop operations in the Upper Midwest. Beyond providing goods for either on-farm use or sale, like grain and straw, they help disrupt above and below ground pest and disease life cycles, provide opportunities for establishing legumes for either forage or green manure purposes, and promote more even distribution of farm labor over the cropping season. Unfortunately, aside from these functions, the economic value of small grains themselves is usually less than other crops within the rotation, primarily corn (Zea mays L.) and soybean (Glycine max (L.) Merr.). As a result, oats are often the financial weak link in diversified crop rotations. This is due to a combination of price, yield, and grain quality (test weight), which is often insufficient (<36 lbs. /bushel) for the food-grade market. Consequently, oats receive little agronomic attention either from farmers or researchers. Both limited institutional support and a loss of generational knowledge about small grains production has limited the amount of information available to aid farmer decision-making. Given this, our goal was to examine the potential for improving oat grain yield and quality through simple low or no-cost agronomic practices.
Experiments took the form of both on-station and on-farm research. On-station research was conducted over two seasons (2015 and 2016) on the Iowa State University (ISU) Marsden research farm in Boone, Iowa. This experiment examined the effects of seeding date and oat crop density on grain yield and test weight, in addition to end of season alfalfa and weed biomass and net returns. On-farm trials were established on seven farms across the state over the same two year period. These trials were used to explore the following research questions with respect to oat yield, test weight, forage legume biomass and weed biomass: 1.) What is the effect of oat crop density? 2.) What is the effect of rotary hoeing? 3.) What is the effect of sowing oats with and without an underseeding? Results from our experiments helped to highlight and quantify areas of potential improvement in oat crop management, while also clarifying limitations to agronomic practices.
On-station research demonstrated the importance of seeding as early as possible. Not only were yield, test weight and net returns maximized by early planting, but alfalfa biomass was greater and weed biomass lesser in one of the two years, indicating that early planting may actually improve objectives other than grain yield and test weight. On-farm research similarly showed that 1.) oat crop density had no effect on grain yield, test weight, forage legume biomass, or weed biomass. However, that equivalent yields were attained across the tested oat crop densities suggests that net returns could be optimized at lower oat crop densities and associated seeding rates 2.) Weed biomass was reduced as a function of rotary hoeing at one of the two farms that participated in this specific trial. However, this tactic had no effect on oat grain yield or test weight and 3.) yield of oat sown without an underseeding was greater than oat with an underseeding at one farm, but test weight between the treatments did not differ. Neither yield and test weight differed at the other participating farm. There was also no difference in weed biomass between oats planted with and without an underseeding at either farm.
Cumulatively, data from both small plot and on-farm research suggest that economical optimal yields can occur at relatively lower densities without negatively affecting alfalfa establishment or weed suppression. Mechanical cultivation with a rotary hoe may not be a tactic of interest for farmers considering the varied results we found and its lack of positive impact on grain yield and/or test weight. Lastly, the use of an underseeding does not seem to substantially alter outcomes important to an oat production year (yield, test weight, weed biomass). While results were mixed, farmers who participated in the trials were enthusiastic and positive about learning more about their growing practices and about contributing useful information.
Our goal with this research was to generate much needed data about the effects of basic low-cost crop management tactics related to an oat rotation year. Our hypotheses were intended to address farmer concerns around no or low-cost management practices that could be implemented to improve the production and profitability of oats and the associated services of a small grain rotation year. In addition to on-station research at an ISU research farm, we planned on and undertook a substantial participatory component to the research. One important objective was to make our results freely accessible through a variety of media and other platforms including field days. Furthermore, we made sure to link our efforts from the outset directly with those of local non-profit organizations with large constituencies that would be interested in this area of research.
Cooperators
Research
Methods and materials will be described for 1.) on-station, small-plot research project and 2.) three distinct on-farm trials.
1.) This study was conducted at the Iowa State University Agronomy Farm, located in Boone County, Iowa, USA for 2 yr. An oat-alfalfa intercrop was used as a model system for the experiment. Sites in 2015 and 2016 were adjacent to one another in order to maintain a system of crop rotation for organic certification per National Organic Program guidelines. In both years, the oat/alfalfa intercrop followed corn in a rotation sequence.
The experimental design was a split plot with five replicates. Planting date was the whole plot (three treatments in each year) and oat crop density the subplot (four treatments in each year). The oat cultivar used in both years was Shelby 427. The alfalfa cultivar used in both years was Viking® 3200.
Before planting, primary and secondary cultivation were performed. Primary cultivation included two passes with a tandem disk over consecutive days. In 2015, this operation was completed on 31 March and 1 April and in 2016, on 10 March and 11 March. Planting dates began in each year as early as field operations could occur without causing undue damage to soil structure. Planting date delays were spaced at an interval of approximately 11 days. In 2015, our Early planting date treatment was 6 April, followed with Mid on 17 April and Late on 28 April. In 2016, the Early planting date treatment was 22 March, followed by Mid on 4 April and Late on 15 April (a summary of planting dates and associated Julian days is presented in the footnotes of Table 2). Secondary cultivation was performed on each planting date with a 12 ft field cultivator. After this secondary cultivation pass, alfalfa seed was planted using a 5 ft Brillion grass seeder (Marysville, KS, USA). Oat was then planted using a 5 ft. Almaco Light Duty Grain Drill with an inter-row spacing of approximately 6 in. (Nevada, IA, USA).
Oat crop densities in this experiment were 15, 22, 29 and 36 plants ft2. Seeding rates used to plant these target oat densities were calculated with an equation from Wiersma et al. (2005), which considered PLS, seed germination percentage, 1000-kernel weight, and estimated mortality, which was set at 15% in both years. The associated seed weight and cost of each oat crop density is presented in Table 1. Alfalfa was seeded at a constant rate of 11 lbs acre-1 in both years. Subplot (planting date x target oat density) size was approximately 10 ft x 60 ft.
|
Table 1. Summary of seeding rate (lbs. acre-1) and cost ($ acre-1) for target oat density treatments in 2015 and 2016. |
|||||
|
Target oat density (plants ft-2) |
|||||
|
Year |
Value |
15 |
22 |
29 |
36 |
|
2015 |
Seeding rate (lbs. acre-1) |
44 |
65 |
86 |
106 |
|
Seed cost ($ acre-1) |
23 |
33 |
44 |
54 |
|
|
2016 |
Seeding rate (lbs. acre-1) |
54 |
79 |
103 |
128 |
|
Seed cost ($ acre-1) |
20 |
29 |
38 |
48 |
|
Oat crop density measurements were made in the late-milk/early soft dough stage of development (Zadoks Growth Stage [ZGS] 83-85) (Zadoks et al., 1974). A quadrat (0.25-m2) was used to take three subsamples in each subplot (planting date x target oat density. Crop plant counts were performed by placing the quadrat parallel to two crop rows. Each individual row of oat crop plants was removed from the ground, counted, and the average of both rows was used in our analyses.
All plots were hand-harvested at maturity (ZGS 90) over a 2 d period from 22 July to 23 July in 2015, and over a two day period from 11 July to 12 July in 2016. Oat physiological maturity was visually determined using phenological guidelines provided by Lee et al. (1979). Mature oat plants were cut at a height of approximately 6 in from the soil surface. All above ground biomass was placed in paper bags and dried at room temperature for 5 d until a constant moisture was obtained. Grain was then threshed using an Almaco Small Bundle Thresher (Nevada, IA, USA). Grain was further cleaned by manually removing larger pieces of chaff and debris and by using a small (12 in diameter) set of two circular sieves with a screen mesh size of 4.7 mm. Grain test weight and moisture concentration were estimated with a Dickey-john 2000-AGRI Grain Analysis Computer (Dickey-john, Auburn, IL). Reported grain yields were normalized to 13% moisture.
Forage and weed biomass measurements were made approximately 6 wks after the entire surface area of the experiment was cleared of grain and straw. The same 0.5-m2 frames were used to harvest forage/weeds by removing all above ground biomass from the soil surface with garden shears, and placing it in a paper bag. All samples were sorted into alfalfa biomass and weed biomass. All biomass samples were then dried at 140°F for 24 h for 5 to 7 d. Dried biomass was then weighed and recorded.
A partial budget analysis was also performed to ascertain effects delayed planting, target oat density (plants ft-2) and its associated seeding rate (lbs acre-1). An economically optimal seeding rate was that which generated the greatest net return; this can be understood as the difference between gross returns acre-1 (grain yield x market price) and seed cost acre-1. Oat seed cost over the two years of the experiment averaged $0.39 lb-1. The 2015 average oat market value of $6.10 bu-1 was used for both years of analysis (Economic Research Service, 2016). Markets for oat exist in the form of food and feed, the Economic Research Service data used did not specify. For the purposes of this paper, we consider them to be feed-grade prices.
2.) The following paragraphs describe methods and materials that were shared across all three on-farm trials. Sections after that detail methods and materials specific to each study and are labelled accordingly. A summary of oat cultivars used, their associated planting and harvest dates along with underseeding species and seeding rates (where applicable) is presented in Table 2. All other operations specific to a given trial are described in their associated sections below.
|
Table 2. Oat cultivar choice, forage species and seeding rate quantities, in addition to underseeding species and seeding rate quantities and operation timing specifications for all 2015 and 2016 on-farm trials. |
|||||
|
Trial |
Farmer Cooperator Site |
Oat Cultivar |
Underseeding species (kg ha-1) |
Planting date for oat + underseeding |
Harvest date of oat crop |
|
Oat crop density |
Hampton |
Saber |
Alfalfa (12), orchard grass (5) |
4/14/2015 |
8/15/2015 |
|
Polk City |
Shelby 427 |
Mammoth red clover (12) |
3/31/2015 |
7/19/2015 |
|
|
Williams |
Saber |
Crimson clover (10.5), medium red clover (1.5) |
4/15/2016 |
7/26/2016 |
|
| Rotary hoeing |
Rolfe |
Deon |
n.a. |
4/13/2016 |
7/25/2016 |
|
Paullina |
Shelby 427 |
n.a. |
4/8/2016 |
7/22/2016 |
|
|
With and w/o underseeding |
Hampton |
Saber |
Medium red clover (12) |
4/16/2016 |
8/17/2016 |
|
Audobon |
Shelby 427 |
Alfalfa (12) |
4/2/2016
|
7/26/2016 |
|
Farmers were responsible for assigning treatments to given plots using a randomized complete block design. Plot sizes varied due to both field and equipment size. Plot lengths were approximately 500 ft. Plot widths were always two times the width of a given grain drill, and ranging from 13 to 40 ft. Seeding rates for all experiments were calculated using the following calibration equation mentioned earlier, adapted from Wiersma et al. (2005).
Farmers were responsible for determining seeds lb-1 by counting out a small lot of 1000 seeds and ascertaining their weight via a scale. Oat crop densitiy and expected loss percentages used in the experiments are commented on within specific methods sections below. Pure live seed (PLS) was calculated by each farmer by multiplying the number of viable seeds times the germination percentage, both of which were found on seed bag tags.
In-season field samples were measured using 0.5 m2 frames. In all instances, five randomly assessed subsamples were taken at each sampling event by walking in a ‘W’ pattern across plots. Sampling frames were placed on the ground so that four crop rows were straddled by the frame. Frames of varying widths and lengths were used to account for different grain-drill row widths whilst maintaining the 0.5 m2 surface area measurement.
Grain yield measurements were recorded by cooperating farmers using their own equipment. Mean yield values for each treatment consisted of strips of one combine-width down the middle of each plot. The seed mass harvested from this area was determined using a weigh wagon and converted to a lbs acre-1 basis. Subsamples of approximately 1 qt were taken from each harvested strip to estimate grain moisture concentration and test weight with a DICKEY-john 2000-AGRI Grain Analysis Computer. Reported yields were normalized to 13% moisture and grain yields were converted to a 32 lbs bu-1 standard.
a. Oat crop density trial.
Research was conducted on two farms in Hampton and Polk City, IA 2015, and in Williams, IA in 2016. On each farm, spring oat was sown at three oat crop densities: 22, 29 and 36 plants ft-2. Expected loss for oat crop densities was 15%. Each of the three cooperating farmers established five replicates of the three treatments, totaling 45 experimental units across three farms.
Hand-harvested measurements were taken 6 weeks post-harvest to determine the effects of the treatments on underseeded legumes and weed biomass. These measurements were made at Polk City and Hampton on 30 August and 15 September 2015, respectively. Underseeding and weed biomass samples were not taken on the Williams farm due to a major disturbance of the stand from a liquid manure application. All vegetative biomass was removed at the soil surface with garden shears and placed into paper bags. The samples were then sorted into underseeding and weed biomass. Samples were then dried at 140°F to a constant weight and weighed.
b. Rotary hoeing trial.
Research was conducted near Rolfe, IA and Paullina, IA in O’Brien County in 2016. On both farms experimental treatments consisted of a rotary hoeing and a control (non-rotary hoed) treatment. On both farms, oat was sown at an oat crop density of 29 plants ft-2. Expected loss in this case was set at 25% due to anticipated damage to seedlings during the rotary hoeing. Both farms established five replicates of the treatments, totaling 20 experimental units across the two farms.
Rotary hoeing events were performed at the 1-2 leaf stage of oat crop development. This took place on 5 and 6 May 2016, and 6 and 7 May 2016 at Rolfe and Paullina, respectively. Both farmers made one pass per day over a two-day period with the rotary hoe. These passes were made parallel to the crop row. Driving speed was approximately 10 miles hr-1 and soil conditions on all days of cultivation were windy and dry, which are optimal for rotary hoeing.
When oat plants were in the early dough (ZGS 8.0) stage of development all vegetative material was removed at the soil surface using garden shears (Zadoks et al., 1974). Oat plant biomass was discarded and weed biomass was dried at 140°F to a constant weight and weighed.
c. Underseeding trial
Research was conducted near Hampton, IA and near Audobon, IA. On both farms treatments consisted of oat planted with an underseeded legume and oat planted in a monoculture. In plots sown without an underseeding, both farmers planted a MSCC after oat harvest. On both farms, oat was sown at a specified oat crop density of 29 plants ft-2. Expected loss in this case was set at 15%. Underseeded legume species were chosen by the farmers based on normal rotation and management practices. Both farms established five replicates of the two treatments, totaling 20 experimental units on two farms.
The first set of measurements were taken when oat crop plants were in the early dough (Zadoks growth stage [ZGS 80]) stage of development (Zadoks et al., 1974). This occurred at Hampton on 22 July and at Audobon on 15 July. All vegetative material was removed at the soil surface using garden shears. This included oat plants, legume underseeding and weed biomass. Underseeding and weed biomass were separated and dried at 140°F to a constant weight and then weighed.
Results will similarly be described for 1.) on-station, small-plot research project and 2.) three distinct on-farm trials.
1.) Grain yield reductions were highly correlated with delayed planting. The greatest yield (97 bu acre-1) was obtained at the earliest planting date (25 March, 2016). Using data from both experimental years (2015 and 2016), the relationship between planting date (Julian day) and grain yield showed a linear decrease in grain yield of approximately 1.5 bu acre-1 day-1. Grain yield followed a quadratic response to oat crop density in one year (2015) and no response to oat crop density in the other (2016). Optimal yield of approximately 59 bu acre-1 was obtained at a oat crop density of approximately 28 oat plants ft-2. Average yield across all populations was approximately 84 bu acre-1 (Fig. 1, below).
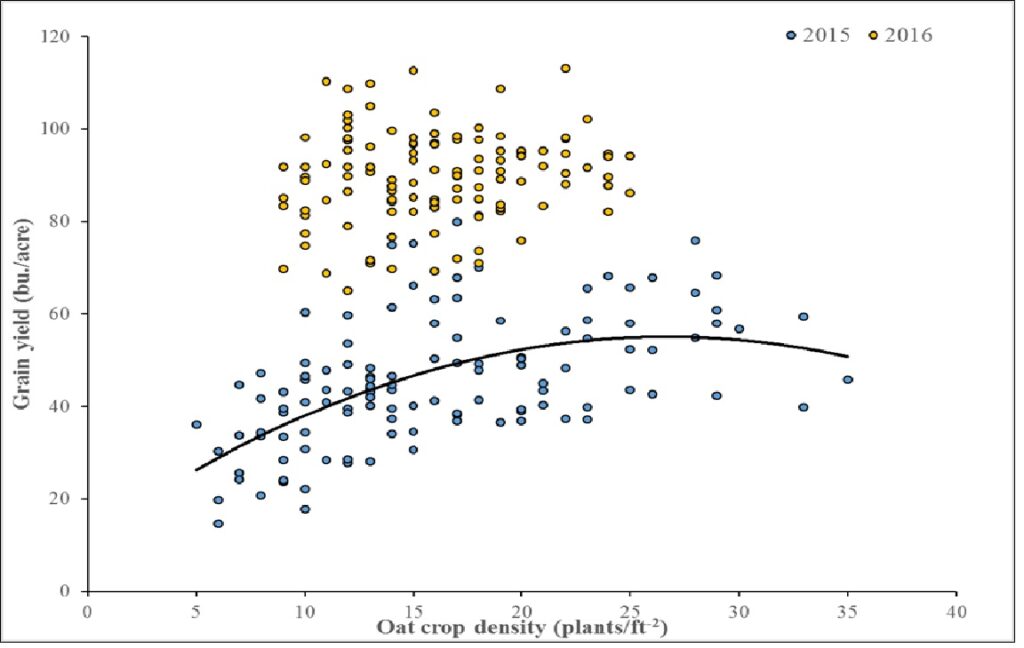
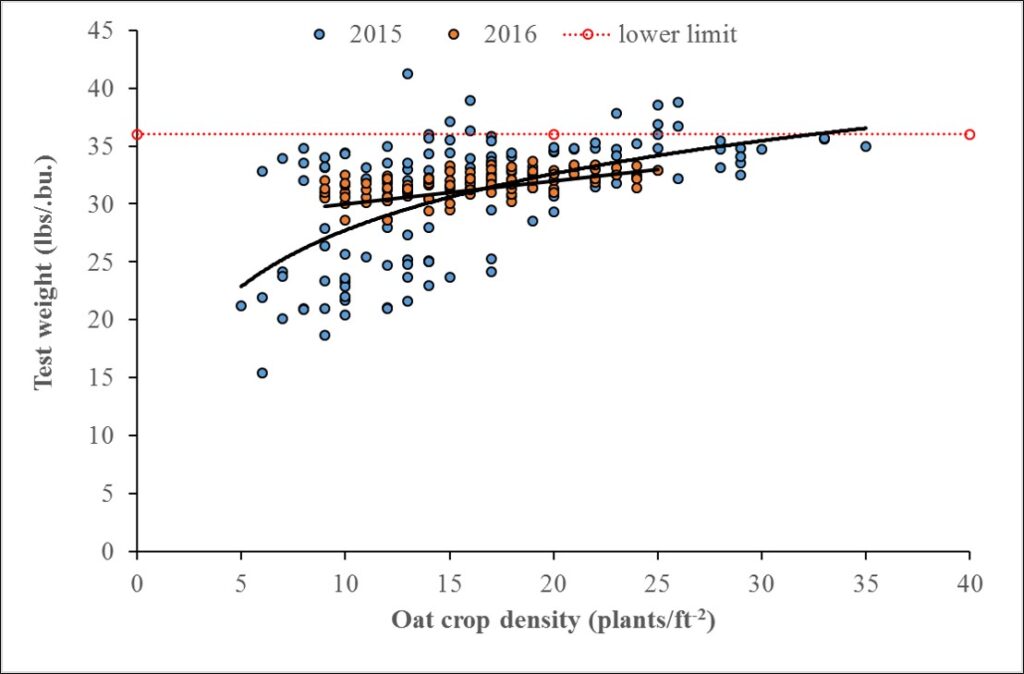
In 2015, the heaviest test weight (34 lbs bu-1) occurred at the earliest planting date. Test weight decreased by approximately 32% over the planting period. In 2016, the heaviest test weight (32 lbs bu-1) also occurred at the earliest planting date, but decreases were only 2% over the planting period. In 2015, test weight followed a quadratic response to oat crop density, with the highest test weight (36 lbs bu-1) occurring at a density of approximately 36 plants ft-2 (Fig. 2, below). In 2016, test weight followed linear response to oat crop density, with the highest test weight (32 lbs bu-1) occurring at a density of 26 plants ft-2 (Fig. 2, below).
Alfalfa and weed biomass showed no response to oat crop density in either year of the study. Mean alfalfa biomass in 2015 and 2016 was 323 and 706 lbs acre-1, respectively. Mean weed biomass in 2015 and 2016 was 2002 and 1860 lbs acre-1, respectively. There was no response to planting date with either alfalfa or weed biomass in 2015, mean values for those were 323 and 1802 lbs acre-1, respectively. In 2016, biomass for alfalfa was greatest at the earliest planting date (822 lbs acre-1) and decreased 40% over the planting period. Weed biomass followed the opposite trend with the lowest amount of biomass (1732 lbs acre-1) occurring at the earliest planting date and increasing 16% and 6% for Early to Mid and Early to Late planting date intervals.
Net returns were unaffected in either year by oat crop density. Mean net returns in 2015 and 2016 were approximately $260 and $514 acre-1, respectively. Net returns did differ due to planting date; the greatest returns returns in 2015 ($320 acre-1) and 2016 ($547 acre-1) both occurred at the earliest planting dates and decreased by 40% and 10%, respectively.
2.)
a. Oat crop density trial. Due to the fact that residual error did not differ among farms, all three were analyzed together. Grain yield did not differ due to oat crop density. Mean yield over the three populations was 97 bu acre-1. Test weight was similarly unaffected by oat crop density, mean test weight was approximately 37 lbs bu-1. Similarly, neither underseeded legumes nor weed biomass differed as a result of oat crop density. Mean underseeding and weed biomass were 360 and 1323 lbs acre-1, respectively.
b. Rotary hoeing trial. Due to the fact that residual error did differ among sites, farms were analyzed separately. There were no differences between grain yield and test weight between rotary hoed and control treatments at either farm. Mean yield and test weight at Paullina, IA were 112 bu acre-1 and 32 lbs bu-1, respectively; while these variables at Rolfe, IA were 111 bu acre-1 and 32 lbs bu-1, respectively. With respect to weed biomass, no differences were observed between treatments at Paullina, IA. Mean weed biomass across both treatments was 146 lbs acre-1. Differences were observed at Rolfe, IA where mean weed biomass under the rotary hoe treatment was 36% less than the control treatment (235 vs. 368 lbs acre-1).
c. Underseeding trial. Due to the fact that residual error did differ among sites, farms were analyzed separately. Grain yield and test weight did not differ at Audobon, IA. Mean values for both were 89 bu acre-1 and 36 lbs bu-1, respectively. Grain yield at Hampton, IA did differ, with the oats sown in a monoculture yielding 7% higher than those sown with a red clover underseeding (106 vs. 99 bu acre-1). Test weight did not differ between treatments at Hampton, mean test weight was 33 lbs bu-1. Weed biomass did not differ between treatments at either farm. Mean weed biomass was 154 and 272 lbs acre-1, for Hampton and Audobon, respectively.
In summation, on-farm trials examining oat crop density showed no treatment effects on grain yield and test weight, or forage legume and weed biomass. However, they did suggest savings could be made via seed and associated cost reductions. Rotary hoeing had no effect on grain yield or test weight relative to the control. Sowing oat with red clover at one farm reduced oat grain yield relative to the monoculture control, but not test weight, relative to the control treatment. Oat undersown with alfalfa, at another farm, had no impact on yield or test weight relative to the control treatment.
Our on-station experiment emphasized the importance of planting date, the effects of which were observed in grain yield, test weight and net returns in both years (decreases), in addition to alfalfa (increase), and weed biomass (increase) in one year. Yield showed a quadratic response with respect to oat crop density in one year, and no response in the other. Oat crop density had no effect on net returns in either year of the study. However, observed oat crop densities suggested that increased test weight may be associated with seeding rate increases up to a certain point, which would improve the economic prospects of oat crop density manipulations. That food-grade quality oats may be produced at higher crop densities is certainly worth re-examining under different environments, using different cultivars, and management systems.
References:
Economic Research Service. 2017. Small grain price summary 2011-2016. raw data. Economic Research Service, Washington, DC, USA.
Lee, H.J., G.W. Mckee, and D.P. Knievel. 1979. Determination of Physiological Maturity in Oat. Agron. J. 71: 931–935.
Wiersma, J., K. Moncada, and M. Brakke. 2005. Small Grains. In: K.M. Moncada and C.C. Shaeffer, editors. Risk management guide for organic producers. University of Minnesota Extension and Outreach, St. Paul, MN. p. 1-18
Zadoks, J.C., T.T. Chang, and C.F. Konzak. 1974. A Decimal Code for the Growth Stages of Cereals. Weed Res. 14: 415–421.
Educational & Outreach Activities
Participation summary:
Education and outreach events and materials ran the gamut in type. Three field days were held over the summer of 2016, two of which were held at cooperating farms. These were organized by Practical Farmers of Iowa (PFI) and sponsored by the Iowa Organic Association (IOA). The third field day was held on the Iowa State University (ISU) Marsden research farm. This event was sponsored by the IOA, and included presentations from three other ISU researchers. All three field days also included small tours of fields/plots and one to two page fact sheets. Published press/articles/newsletters were split between the PFI blog and newsletter in addition to Wallace's farmer, and a small local paper the Newton Daily News. A variety of talks were held over the grant period, which included the Organic Crop Improvement Association annual meeting in Council Bluffs, the PFI annual conference and cooperator's meetings in Ames, as well as IOA conference in Iowa City. Poster presentations also occured at the 2015 MOSES conference in LaCrosse, WI and the 2016 Agronomy Society of America conference in Phoenix, AZ. Presently, an updated guideline is being finalized for oat production to be released via ISU extension and outreach this calendar year. The results of the three on-farm trials will also soon be released as freely accessible reports via the IOA webiste, as well as hard copies at several regional conferences this winter. Additionally, a manuscript on dealing with the on-station small-plot work is currently being edited for submission to a scholarly journal this fall.
Project Outcomes
Through the development of positive and mutually beneficial relationships with several local and regional non-profit groups (IOA, PFI and OCIA), as well as seed industry and milling professionals, as well as other researchers in the upper Midwest, we have increased the quantity of available information pertaining to oat production in Iowa and the Upper Midwest, in addition to engaging with a large and diverse group of industry, academic and farmer stakeholders. The agronomic information generated from this project is not only more easily accessible, but also exist in formats that are user-friendly and approachable such as videos and magazine articles (see examples below). By quantifying the effects that certain practices can have in oat production (i.e. basics like crop density and planting date), we hope to have presented an honest assessment of both the potential opportunities for management improvements, as well as the limitations that farmers may face with this crop. Improving the prospect of oat and small grain production in the state and region would be a positive one. Being able to generate more profit by growing alternative crops like oats could aid in attracting more growers to organic markets and/or sustainable farming practices, such as extended crop rotations and potentially livestock integration. This, in turn, could aid in reducing the overall use of petrochemical inputs, like herbicides and fertilizers, on the landscape. Profitable oat and other small grain growing in the state could also encourage local mills and processors to buy more product within state lines, which would contribute more dollars to local rural economies. While we are still some way from these goals, we feel that local efforts such as ours, go some way towards engaging farmers in the research process, and contributing to the body of information on individual crop improvements within alternative systems that would otherwise go unstudied.
Wallace's farmer article:
http://www.wallacesfarmer.com/story-3-steps-fine-tune-oat-seeding-rate-spring-9-139659
PFI "Rotationally Raised" video series:
https://www.youtube.com/watch?v=cebBxLOE0_c
The project allowed us to implement a set of complementary experiments under more a more highly controlled environment (an ISU research farm), as well as more realistic environments (cooperator's farms). Being able to work on both of these levels helped us to identify and understand some of the finer points of small grains agronomy and physiology, as well as the variety of limitations and constraints that can and do occur on working organic farms here in Iowa. Both perspectives are valid and important for furthering our understanding of oat management and for identifying key limitations moving forward. Additionally, the outreach and education components of the project provided a chance for reciprocal knowledge exchange between us, the researchers, and the variety of farmers with whom we worked and to whom spoke. Having this opportunity for the exchange of information, as well as challenges, helped us to better appreciate the distinct set of hurdles that exist for farmers attempting to make small grains more than just a rotation crop within an extended crop sequence.
Additional research could explore areas of oat-crop physiology and breeding, as important insights and gains from these fields have severely lagged behind those achieved in other crops, especially over the last thirty years. While breeding efforts and physiological insights are not miraculous cure-alls for crop improvement, potential gains in these two areas can certainly contribute more to both tangible crop advances related to productivity and quality, in addition to a greater understanding of the negative effects of abiotic factors and management. These will all be essential to both the ongoing success of this crop and its function within a diverse rotation. As, or even more, importantly, research into both growing and accessing alternative markers and uses for organic oats and other small grains should be paramount. This could contribute immensely to their potential success in Iowa, and throughout the upper Midwest. For example, fully developed organic feed-grade markets would positively alter the economic potential for farmers, creating a truly viable market place for small grains that are unable to meet rigorous food-grade standards. Additionally, regional food-grade small grain markets for barley, rye and wheat are developing at a steady rate, on both coasts, as the demand for local beer, spirits and baked goods continues to rise. More research into these alternative marketing opportunities and the challenges/costs that surround then could be a game-changer for both organic farmers and those looking to diversify their cropping systems.