Final report for GNC19-284
Project Information
Seed bed preparation and soil management history are thought to have a large impact on the efficacy of mechanical cultivation, but limited information is available on of the mechanisms of these effects, and their implications for management. In a series of field trials on a loamy sand soil, we tested how pre-plant bed preparation (rolled vs not), historic compost use (12 previous years of annual applications vs none), and presence of soil crust (induced through application of molasses or not) influenced soil surface characteristics and the efficacy of flextine cultivation in bush beans (Phaseolus vulgaris) and sweet corn (Zea mays L.). Rolling beds prior to planting generally resulted in lower soil surface roughness, greater soil micro-penetrometer resistance, higher soil moisture content, and reduced efficacy of flextine cultivation compared to unrolled beds. Historic compost and molasses applications had few impacts on these soil characteristics and little or no effect on flextine efficacy. The results of this study challenge conventional cultivation wisdom that rolling seed beds improves cultivation efficacy by facilitating more uniform tine working depth. This potential benefit is offset by increasing soil hardness through compaction, which reduce the capacity of tines to disturb soil and uproot weeds. Our surprising results highlight the importance of characterization of soil conditions in cultivation research.
Table beets (Beta vulgaris) are among the most challenging crops to mechanically cultivate, but improved understanding and exploitation of cultivar differences in emergence, growth and morphological characteristics may improve cultivation success. In a series of field and greenhouse trials, four beet cultivars—Boro (B), Chioggia Guardsmark (CG), Moneta (M), and Touchstone Gold (TG)— were evaluated for their tolerance to deep planting and mechanical cultivation as well as their competitiveness with escaped weeds. In one set of experiments, seeds of each cultivar were sown at 1, 2, 3 and 4 cm depth and monitored for emergence and early growth under both greenhouse and field conditions. In a separate field experiment, the effects of cultivar, cultivation tool (finger weeder vs hilling disk) and weed competition (none vs escaped weeds) on weed and beet survival, beet yield and final weed biomass were evaluated. We hypothesized that cultivars with greater root biomass and root anchorage force would be more tolerant to finger weeders, while those with greater shoot biomass and height would be more tolerant to hilling. In emergence studies, we found that under greenhouse conditions, B, CG and TG beet varieties could be planted at 3 or 4 cm depth to delay emergence by 1-2 days relative to shallower seeding depths, potentially allowing for a longer window to stale seedbed. However, under field conditions, emergence from greater depths sometimes resulted in either no apparent difference in emergence timing or reduced total emergence and hence may be an impractical strategy, depending on soil conditions. In field cultivation studies, we found that cultivars differed in their tolerance to cultivation, as well as competitiveness with weeds. B had both the highest yield and was the most weed competitive.
Learning Outcomes:
- Vegetable farmers will have a greater awareness of in-row weed control technologies and practices.
- Vegetable farmers, extension educators, and researchers will have a better understanding of how different in-row weed control technologies can be calibrated for various soil conditions.
Action Outcomes:
- Vegetable farmers will be empowered to try alternative weed management strategies and evaluate them in the context of their specific production system.
- Vegetable farmers will make in-row weed management decisions that will reduce pesticide use and improve soil health.
- Researchers and extension educators will make well-rounded recommendations regarding in-row weed cultivation strategies.
Environment/Production Outcomes
- Vegetable farmers will have the potential of greater profits as a result of reduced weeding costs and higher yields due to reduced weed interference.
- Environmental sustainability will be improved through potential reductions in herbicide use and preservation of healthy soils.
Research
Part 1: Soil Surface Effects on Flextine Cultivation Efficacy in Vegetables
Experimental setting
To test our hypotheses, a field experiment was conducted at Michigan State University’s Horticulture Teaching and Research Center (HTRC) in Holt, MI (42.673705, -84.484900) during the 2020 growing season. The soil type was a ‘Spinks Loamy Sand’ with 74.8% sand, 17.8% silt, and 7.4% clay. This textural class is common for many Michigan vegetable growers. Two separate runs of the experiment were conducted in adjacent plots within a larger long-term experiment with multiple objectives. The first run was conducted from 18 June to 26 June in plots planted to sweet corn ('Sweetness F1 synergistic’, Johnny's Selected Seeds, Winslow, ME). The second run was conducted from 30 June to 17 July in plots planted with bush beans (Provider’, Johnny’s Selected Seeds).
Experimental design
To evaluate flextine cultivator efficacy under various soil conditions, the field experiment was set up in a split-split plot design with historic compost application (12 years of historic compost applications vs none) as the main plot factor; pre-plant bed preparation (rolled vs not rolled) as the sub plot factor; and induced crusting (application of molasses solution or not) as the sub-sub plot factor. All factor combinations were included for a total of eight treatments (Table 1.1), each replicated four times within each run of the experiment.
|
Table 1.1. List of treatments in flextine cultivation experiment |
|||
|
|
|
|
|
|
Main Plot Factor |
Sub Plot Factor |
Sub-Sub Plot Factor |
|
|
Treatment |
Roughness |
Compost |
Crust |
|
1 |
None |
None |
None |
|
2 |
None |
None |
Molasses |
|
3 |
Rolled |
None |
None |
|
4 |
Rolled |
None |
Molasses |
|
5 |
None |
Compost |
None |
|
6 |
None |
Compost |
Molasses |
|
7 |
Rolled |
Compost |
None |
|
8 |
Rolled |
Compost |
Molasses |
Compost treatments in main plots had received 12 consecutive years of spring applications of a dairy-manure based compost (‘Dairy Doo’ from Morgan’s Composting, Sears, MI) at 5.4 dry MT ha-1 yr-1. Non-compost treatments had received no compost during the same period. Historic fertilizer applications in compost vs non compost treatments differed in some years based on soil nutrient testing, with additional NPK applications required in non-compost plots to meet recommendations for rotational crops. Otherwise, all management practices were the same in compost as non-compost treatments including rotational crops, cover crops, tillage, irrigation, and pest management. Estimates of differences in soil organic matter content in composted vs non composted plots prior to initiation of the experiment were taken from six composite soil samples per main plot sampled on 18 May 2019 at a depth of 15cm, and evaluated using loss on ignition.
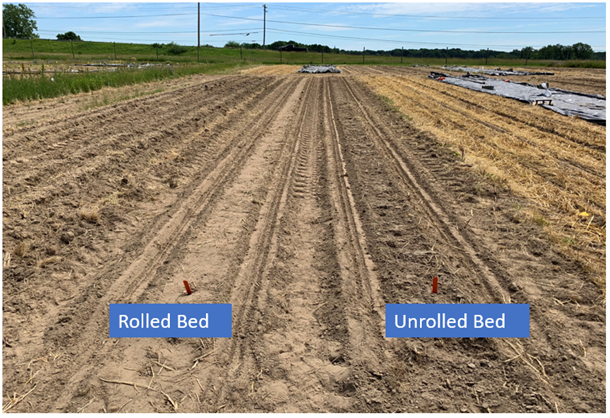
Following primary tillage with a combination of rototilling and sub-soiling (Table 1.2), bed preparation sub-plots were established in adjacent beds, each measuring 1.5 by 24.5 meters. Preceding cultivation rolled bed treatments were established using a 106 cm wide polyurethane lawn roller (Blue Hawk Tools, Mooresville, NC). (Figure 1.2)
|
Table 1.2. Schedule of major field operations and data collection events |
||||||
|
|
|
|
|
|
|
|
|
|
|
Run 1 |
|
Run 2 |
||
|
|
|
(Sweet Corn) |
|
(Bean) |
||
|
Trial |
Event |
Date |
DAP |
|
Date |
DAP |
|
|
Mowed and rototilled cover crops |
5-Jun |
-13 |
|
5-Jun |
-25 |
|
|
Compost applied (main plots) |
16-Jun |
-2 |
|
8-Jun |
-22 |
|
|
Subsoiled |
16-Jun |
-2 |
|
16-Jun |
-14 |
|
|
Fertilized |
16-Jun |
-2 |
|
24-Jun |
6 |
|
|
Rototilled |
16-Jun |
-2 |
|
30-Jun |
0 |
|
|
Rolled (sub-plots) |
18-Jun |
0 |
|
30-Jun |
0 |
|
|
Planted |
18-Jun |
0 |
|
30-Jun |
0 |
|
|
Surrogate weeds sown |
18-Jun |
0 |
|
30-Jun |
0 |
|
|
Molasses applied (sub-sub plots) |
23-Jun |
5 |
|
12-Jul |
12 |
|
|
Scanned soil surface (pre) |
24-Jun |
6 |
|
13-Jul |
13 |
|
|
Weed density evaluated (pre) |
25-Jun |
7 |
|
13-Jul |
13 |
|
|
Soil resistance evaluated |
25-Jun |
7 |
|
14-Jul |
14 |
|
|
Flextine cultivated |
25-Jun |
7 |
|
14-Jul |
14 |
|
|
Scanned soil surface (post) |
25-Jun |
7 |
|
14-Jul |
14 |
|
|
Weed density evaluated (post) |
26-Jun |
8 |
|
17-Jul |
17 |
Immediately following bed preparation, crops were planted in two rows spaced 76 cm apart per bed at 15.3 cm spacing (sweet corn) and 7.1 cm spacing (beans) using a MaterMacc precision vacuum seeder (MaterMacc, San Vito al Tagliamento PN, Italy). Following crop planting, four 0.25m2 permanent quadrats were created in all sub plots, two to evaluate ambient weeds and two to evaluate surrogate weeds. Surrogate weeds included red amaranth (Amaranthus cruentus ’Red Spike’Johnny’s Selected Seeds) and condiment mustard (Brassica juncia’ Mighty Mustard Pacific Gold’ Johnny’s Selected Seeds) with 200 seeds of both species suspended in 250 ml sand sown with the goal of obtaining approximately 100 seedlings of both species at the time of cultivation.
Two days before anticipated flextine cultivation, soil crusting treatments were established in sub-sub plots by applying a solution of molasses (Sweet Select Unsulfured Molasses, Gordon Food Services, Wyoming, MI) and water through a C02 backpack sprayer at a rate of approximately 200 ml molasses m-2 within two 50 cm x 25 cm quadrats within each sub-plot (one for ambient and one for surrogate weeds). This rate was determined based on preliminary greenhouse testing at multiple rates with the same field soil. Molasses applications were made two days before flextine cultivation to provide sufficient time for crusting to occur. In run 2, weeds and beans had emerged at this stage, but no observed effects of the molasses on plant growth were observed by the time of cultivation.
Flextine cultivation was accomplished with an Einbock flextine cultivator (Einböck GmbH, Schatzdorf, Austria) at 7 DAP in run 1, and 14 DAP in run 2 (Table 1.2). These timings followed flextine recommendations for each crop given the crop stage and weather conditions. Sweet corn (run 1) is more tolerant of flextine cultivation at an early stage, so cultivation occurred shortly after weed and crop emergence, with weeds at the cotyledon to one leaf stage, and corn at the V3 stage. In contrast, snap beans are susceptible to flextine damage at the hook stage, so cultivation was delayed until the 2-leaf stage. At that point, surrogate weeds had failed to germinate, but ambient weeds were at the cotyledon to two leaf stage. The flextine cultivator was 3-point rear-mounted to a John Deere 5054 tractor and run at approximately 9.7 km·h−1. Prior to cultivation, the flextine was calibrated in adjacent plots using a tine working depth of 2 cm, and a tine angle of approximately 90 degrees relative to the soil surface. Speed was the primary factor adjusted during calibration, with gradually increased speeds evaluated until complete horizontal disturbance of the soil surface was observed.
Soil surface characterization
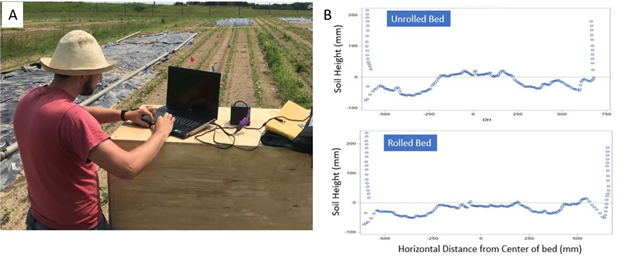
Soil surface roughness was quantified using a A2 LIDAR laser scanner (SlamTec, Shanghai, China) mounted to the top of a dark box custom constructed from wood and black plastic measuring 61 by 122 by 122 cm (Figure 1.3). The LIDAR was mounted to the top of the box, approximately 59 cm from the soil surface, with scans occurring in the lengthwise direction. Output from scans produced datapoints showing distance and relative angle from the LIDAR to the soil surface. The LIDAR scanner was centered between crop rows, and scans extended the full width of the beds. Scans were taken immediately before and after flextine cultivation. Length and angle data from the LIDAR was transformed to obtain distances in the vertical and horizontal direction relative to the center of the between-row zone. Transformations were made by converting LIDAR angle data into radians, and multiplying the length data by the cosine or sine of the radian data for the vertical and horizontal distance, respectively. Surface roughness was calculated from the standard deviation of soil height (Cramers et al. 1996) using the LIDAR vertical distances data for all horizontal distances within 25 cm from the center of the row (to exclude soil surface roughness created by the planter in the in-row zone). The effects of flextine cultivation on surface roughness were assessed by scanning plots immediately prior to cultivation, and immediately afterward, and calculating the change in surface roughness.
Micropenetrometer resistance (‘hardness’) measurements were conducted at 10 random locations within plots with a Shimpo force gauge (Model #: FGV-100XY Shimpo, Kyoto, Japan) slowly pressed into the top 1 cm of soil. The maximum force recorded as the gauge broke through this top layer of soil was averaged across these 10 readings.
Soil gravimetric water content (GWC) was evaluated based on soil samples collected with a trowel to a depth of 2 cm from areas directly adjacent to all plots immediately prior to cultivation events. This soil was weighed, dried, and then weighed again to calculate GWC. The 2 cm depth was chosen to reflect moisture conditions most relevant to the functioning of the flextine cultivator on small weed seedlings present at the time of cultivation.
Weed mortality and flextine efficacy
Tool efficacy was determined from weed and crop density counts in each quadrat before and after cultivation. Weed counts in ambient and surrogate subplots were done immediately prior to cultivation. Post counts were taken 1 day following cultivation in corn and 3 days following cultivation in beans. Weed mortality was estimated based on the percent change in weed density for each species from the pre and post counts. Based on the size of the weeds at the time of the post count, we believe that no new weeds had germinated, and that this calculation therefore provides a reasonable estimate of mortality.
Statistical analysis
Analysis was conducted in SAS (Statistical Analysis Software 9.2 Cary, NC). Assumptions of normality and equal variance for all response variables were evaluated using PROC UNIVARIATE and Levene’s test. Where needed, data was transformed using a Box Cox test to determine optimal transformation. The effects of compost addition, soil preparation, molasses addition and their interaction on weed density, weed survival, soil surface roughness, soil moisture and soil micro-penetrometer resistance were evaluated using PROC MIXED procedures in SAS, with each of the three soil factors treated as fixed effects, and compost nested within replicate treated as random effects. Tool selectivity was analyzed separately for each surrogate species and crop and combined for ambient weeds due to low ambient weed pressure. Where main or interactive effects were significant, mean separation was conducted using Tukey’s HSD adjustment for multiple comparisons.
Regression analysis was conducted using PROC REG, with soil condition measurements regressed against weed mortality for each weed category. The model equation used was:
Where y is either non-transformed weed mortality (for mustard in run 1 and ambient weeds for run 2) or the square root of weed mortality (for red amaranth and ambient weeds in run 1). Square root transformation was used to normalize residuals to meet model assumptions.
Part 2: Integrated Physical and Cultural Weed Management in Table Beets
Cultivar x Depth Studies
To test our hypotheses, separate experiments were conducted to evaluate 1) the impact of beet cultivar and sowing depth on emergence and early growth, and 2) the impact of cultivar and mechanical cultivation tool on weed control efficacy, selectivity, crop competitiveness and yield.
Greenhouse evaluations. In 2019, a greenhouse experiment was set up in a Randomized Complete Black Design (RCBD) with 14 replicates in the Plant Science Greenhouse facility at Michigan State University, East Lansing, MI. Experimental factors were cultivar and depth (Table 2.1). Two separate runs of the experiment were conducted between June 31 and August 18 (run 1) and November 8 and November 27 (run 2). For each experimental run, four table beet cultivars were evaluated: Boro, a red beet; Chioggia Guardsmark, a bicolored beet; Moneta, a monogerm red beet; and Touchstone Gold, a yellow beet. Beet seeds were sourced from Johnny’s Selected Seeds (Winslow, ME). These cultivars represent the broad categories of fresh market beets available to growers.
|
Table 2.1. List of treatments for cultivar*depth studies. |
|||||
|
|
|
|
|
|
|
|
|
Cultivar |
Depth |
GH1 |
GH2 |
Field |
|
1 |
Boro |
1 |
X |
X |
X |
|
2 |
Boro |
2 |
X |
X |
X |
|
3 |
Boro |
3 |
X |
X |
X |
|
4 |
Boro |
4 |
X |
X |
X |
|
5 |
Chioggia Guardsmark |
1 |
X |
X |
N/A |
|
6 |
Chioggia Guardsmark |
2 |
X |
X |
N/A |
|
7 |
Chioggia Guardsmark |
3 |
X |
X |
N/A |
|
8 |
Chioggia Guardsmark |
4 |
X |
X |
N/A |
|
9 |
Moneta |
1 |
X |
X |
X |
|
10 |
Moneta |
2 |
X |
X |
X |
|
11 |
Moneta |
3 |
X |
X |
X |
|
12 |
Moneta |
4 |
X |
X |
X |
|
13 |
Touchstone Gold |
1 |
X |
X |
X |
|
14 |
Touchstone Gold |
2 |
X |
X |
X |
|
15 |
Touchstone Gold |
3 |
X |
X |
X |
|
16 |
Touchstone Gold |
4 |
X |
X |
X |
Beet seeds were planted in 4 cm diameter and 21 cm deep black germination tubes at four depths (1, 2, 3, and 4 cm) using tweezers to ensure precise planting depth. A single beet seed was planted in each tube. Growing media was a 40:40:20 mixture of Suremix Perlite (peat, perlite, lime) (Michigan Grower Products Inc, Galesburg, MI), sand, and organic compost (Dairy Doo compost, Morgan’s Composting, Sears, MI). Cotton balls were placed in the bottom of germination tubes before growth media to avoid loss of soil through drain hole in tubes.
Beet tubes were watered as needed to maintain uniform moisture and counted daily for emerging seedlings. Time to emergence and total seedlings produced per seed were recorded for the first 16 days after planting (DAP) in the first run and the first 19 DAP in the 2nd run. In run 1, after all seedlings had emerged, beets were thinned to the single largest seedling per tube. These seedlings were grown until 24 DAP, then removed with roots intact and gently washed to remove soil adhering to roots, and roots and shoot lengths were measured.
Field evaluations. In August 2019, a field trial was set up in a Split Plot Design with four replicates at Green Wagon Farm in Ada, MI (42.874881, -85.446880). Experimental factors were cultivar (B, M and TG) and depth (1, 2, 3 and 4 cm) (Table 2.1). Soil type in the field was “Parkhill Loam”. Seed beds were prepared by rototiller and then formed into 1.5m beds. Two rows of beets were planted in each bed with 0.76m between rows. B, M, and TG table beet cultivars were selected for their potential differences in early growth and depth response based on observations from greenhouse trails. Seeds were planted individually with tweezers at 1, 2, 3, and 4 cm depth in 3m row plots with 20 evenly spaced seeds per plot.
Beet plots were overhead irrigated as needed and weeded by hand to minimize competition. Daily stand counts were taken of emerging seedlings until emergence slowed at 8 DAS . Seedling clusters were then thinned to the largest seedling, which grew until 20 DAP. At 20 DAP, the anchorage force of five beets of each cultivar in each replicate seeded at 2cm depth was evaluated using a Shimpo force gauge (Model #: FGV-100XY, Shimpo, Kyoto, Japan); beets were clamped at the base of the stem and slowly and steadily pulled upward until uprooting occurred. The anchorage force was defined as the maximum force recorded on the force gauge during uprooting. In cases where five beets had not germinated, beets sown at 3cm depth were uprooted and evaluated for anchorage force. Uprooted beets were then separated into roots and shoots and dried at 100° C for 7 days and weighed.
Statistical analysis. For both greenhouse and field emergence studies, the fixed effects of cultivar and planting depth on beet emergence were evaluated using PROC MIXED procedures in SAS (Statistical Analysis Software 9.2 Cary, NC). PROC UNIVARIATE and Levene’s test were used to evaluate assumptions of normality and equal variance. Replicate was treated as a random effect. Mean separation for significant main effects and interactions was conducted using Tukey’s HSD adjustment for multiple comparisons. Significant interactions between fixed effects of cultivar and depth were sliced by cultivar.
Cultivar x Tool Field Cultivation Study
Experimental design. In the 2020 field season, we evaluated the effects of cultivar (B, CG, M, and TG) and tool (Finger Weeder or Hilling Disk) on beet and weed survival and harvest yield. Plots were arranged in a split plot design with tool as the main plot factor, and cultivar as the sub-plot factor (Table 2.2). Main plots consisted of the center row of a 12.2 m long bed with subplots consisting of 6.1m row length. Beds contained 3 rows of beets spaced at 38 cm between rows, with the outer rows planted to the ‘Boro’ cultivar.
|
Table 2.2. Treatment list of cultivar*cultivation tool field trial. |
||
|
|
|
|
|
|
Tool |
Cultivar |
|
1 |
Finger Weeder |
Boro |
|
2 |
Finger Weeder |
Chioggia Guardsmark |
|
3 |
Finger Weeder |
Moneta |
|
4 |
Finger Weeder |
Touchstone Gold |
|
5 |
Hilling Disk |
Boro |
|
6 |
Hilling Disk |
Chioggia Guardsmark |
|
7 |
Hilling Disk |
Moneta |
|
8 |
Hilling Disk |
Touchstone Gold |
Beet cultivar sub-plots were sown in the center row at 3cm spacing and 2cm depth with a one-row Jang Speed Seeder (Jang Automation Co., LTD, Cheongju-city, South Korea), belly-mounted to a 520 Series Cultivating Tractor (Tilmor, Dalton, OH). The hopper was exchanged with different cultivars to establish subplots. Out-row ‘Boro” beets were sown with a MaterMacc precision vacuum seeder (MaterMacc, San Vito al Tagliamento PN, Italy).
Field operations. The entire experimental area was tilled with a subsoiler, amended with compost, rototilled, and then tarped to flush weeds seeds from the surface soil layer approximately 2 months before planning (Table 2.3). Two weeks before planting, tarps were removed, fertilizer applied (430.56 kg ha-1 of 10-2-8 + 22.34 kg ha-1 boron) in accordance with soil tests, and beds rototilled to incorporate fertilizer and form beds. Final bed preparation occurred 6 days before planting beets, and flame weeding occurring at 3 DAP to kill emerged weed seedlings just before beet emergence. Flame weeding was accomplished with a hand-held flame weeder targeting the in-row (7-10 cm) zone. Between-row weeds were managed with a basket weeder at 9 and 13 DAP (Tilmor) with baskets set with a 13 cm gap to avoid disturbance of the in-row zone (Table 2.3). Following flame weeding, two adjacent 1.25m sections of the center row in each subplot were flagged to create permanent sampling quadrats, spanning 7cm over the center the crop row, representing the in-row zone for evaluation of the effects finger weeder and hilling disks on weeds and beets. One quadrat served as an area to sow surrogate weeds; the other quadrat used to count ambient species. Stand counts of emerging beets were conducted in all quadrats at 5, 6, and 8 DAP. At 15 DAP, all quadrats were handweeded and beets were thinned to approximately 5cm spacing. We then spread approximately 200 seeds of both “Red Spike” red amaranth (Amaranthus cruentus) and “Mighty Mustard Pacific Gold” condiment mustard (Brassica juncia) (both from Johnny’s Selected Seeds) suspended in 250 ml of sand evenly over the in-row plots and covered lightly with loose soil. Cutaway disks set to a DUO parallel linkage (Kult-Kress, Germany) were used at 18 DAP to remove weeds near row leaving approximately 10 cm of undisturbed soil centered on the crop row (Table 2.3).
|
Table 2.3. Schedule of relevant events in cultivation study. |
|
|||
|
|
|
|
|
|
|
|
|
|
||
|
Trial |
Event |
Date |
DAP |
|
|
|
Subsoiled with Unverferth |
26-May |
-64 |
|
|
|
Added compost |
27-May |
-63 |
|
|
|
Rototilled all plots, incorporated compost |
27-May |
-63 |
|
|
|
Applied tarps |
1-Jun |
-58 |
|
|
|
Removed tarps |
14-Jul |
-15 |
|
|
|
Fertilizer applied |
23-Jul |
-6 |
|
|
|
Rototilled all plots |
23-Jul |
-6 |
|
|
|
Rolled beds with water roller |
23-Jul |
-6 |
|
|
|
Irrigated to germinate weeds |
24-Jul |
-5 |
|
|
|
Planted crop |
29-Jul |
0 |
|
|
|
In row flame weeding |
1-Aug |
3 |
|
|
|
Cultivar emergence count |
3-Aug |
5 |
|
|
|
Cultivar emergence count |
4-Aug |
6 |
|
|
|
Cultivar emergence count |
6-Aug |
8 |
|
|
|
Basket weeded between-row |
7-Aug |
9 |
|
|
|
Basket weeded between-row |
13-Aug |
15 |
|
|
|
Thinned beets |
13-Aug |
15 |
|
|
|
Sowed surrogate seeds |
13-Aug |
15 |
|
|
|
Duo cutaway disk near-row cultivation |
16-Aug |
18 |
|
|
|
Beet height measure |
20-Aug |
22 |
|
|
|
Uprooting force measurements |
21-Aug |
23 |
|
|
|
Crop and weed density evaluation (pre) |
22-Aug |
24 |
|
|
|
In-row cultivation |
22-Aug |
24 |
|
|
|
Crop and weed density evaluation (post) |
24-Aug |
26 |
|
|
|
Handweeded ambient weed quadrat |
9-Sep |
43 |
|
|
|
Beet Harvest |
6-Oct |
70 |
|
Crop and weed evaluation before in-row cultivation. Two days before in-row cultivation (22 DAP), height measurements were taken from 10 random beets in each plot, adjacent to the quadrat area. One day before in-row cultivation (23 DAP), the anchorage force of five beets were estimated as described above for the greenhouse study. At 24 DAP, emerging surrogate and ambient weeds were counted in plot quadrats. At this stage, carpetweed (Mollugo verticillata) was the only ambient weed species sufficiently abundant to evaluate tool efficacy. Surrogate red amaranth germination was also low, leaving mustard as our only surrogate weed to evaluate. Beets were at the four to six leaf stage, while surrogate and ambient weeds were at cotyledon stage.
Mechanical cultivation treatments. At 24 DAP, after all weed and crop evaluations, plots were cultivated with either a DUO cutaway disks (Kult-Kress) set to hill or with finger weeders mounted on a floating arm (Tilmor). Both tools were belly mounted on a Tilmor cultivating tractor (Figure 2.1). Hilling disks were calibrated to throw soil into the crop row to a height of approximately 3.5 cm. This height was chosen to bury the tallest weeds (mustard) while minimizing burial of any beet leaves. This was accomplished by setting the front edge of the disks 18cm apart and the rear edge 10cm apart; gauge wheels adjusted to cut soil at 2cm working depth; and speed adjusted upward until the desired 3.5 cm was accomplished, with occurred at 4 km h-1. Closer spacing of the disks would have clipped beet leaves. Wider spacing would have required greater speed to accomplish the same result which was deemed too risky for retaining precise steering. Fingers were calibrated to ‘scrub’ soil and weeds out of the crop row, rather than hill soil. This was accomplished by setting the toolbar height so that the floating arm sloped upward slightly from the toolbar to the finger mount, resulting in an angle of the vertical shanks to which fingers were mounted of 85 degrees relative to the soil in front of the fingers (Figure 2.1). Tips of fingers were set 1 cm apart to minimize disturbance of beet stems. Calibration was then accomplished by increasing the speed until beet damage occurred, and then reducing the speed so no noticeable beet damage was observed. This occurred at approximately 9.5 km h-1. Post-cultivation weed counts were conducted within each quadrat 2 days after cultivation. At the time of the post count, some new ambient weeds were emerging, but were excluded from counts based on size. Weed and beet mortality were estimated based on percent change in density from pre and post-cultivation counts.
Weed-crop competition. At 42 DAP, ambient quadrats were handweeded to serve as a control for evaluation of the effect of escaped surrogate weeds on beet growth. Surrogate weeds that survived cultivation were left to grow in surrogate quadrats until beet harvest. In effect, the experimental design for end of season crop and weed evaluations was a split-split plot, with late-season weed competition (none or escaped surrogates) as the sub-sub plot factor. Harvest occurred at 69 DAP. Beets were separated into roots and shoots. Shoots and weeds growing in the surrogate plot were dried in a 100° C oven for 6 days and weighed for biomass. Roots were categorized into “marketable” and “unmarketable” categories based on a 2cm diameter cutoff. Marketable and unmarketable beets were weighed fresh and total beet diameter was taken for all plot quadrats.
Statistical analysis. The fixed effects of experimental factors on all responses were evaluated using the PROC MIXED procedures in SAS, with replication treated as a random effect. For emergence and early beet data, the fixed effect of cultivar was evaluated. For weed and crop survival data following cultivation, the fixed effects of cultivar and tool were evaluated. Finally, for final weed and beet biomass data, the fixed effects of cultivar, tool, and weed competition were evaluated. All responses were evaluated for normality and equal variance using PROC UNIVARIATE and Levene’s test and transformed as necessary to meet model assumptions. Where fixed effects or interactions were significant, mean separation was conducted using Tukey’s HSD.
Part 1: Soil Surface Effects on Flextine Cultivation Efficacy in Vegetables
Soil surface and weed density responses to compost, rolling and molasses
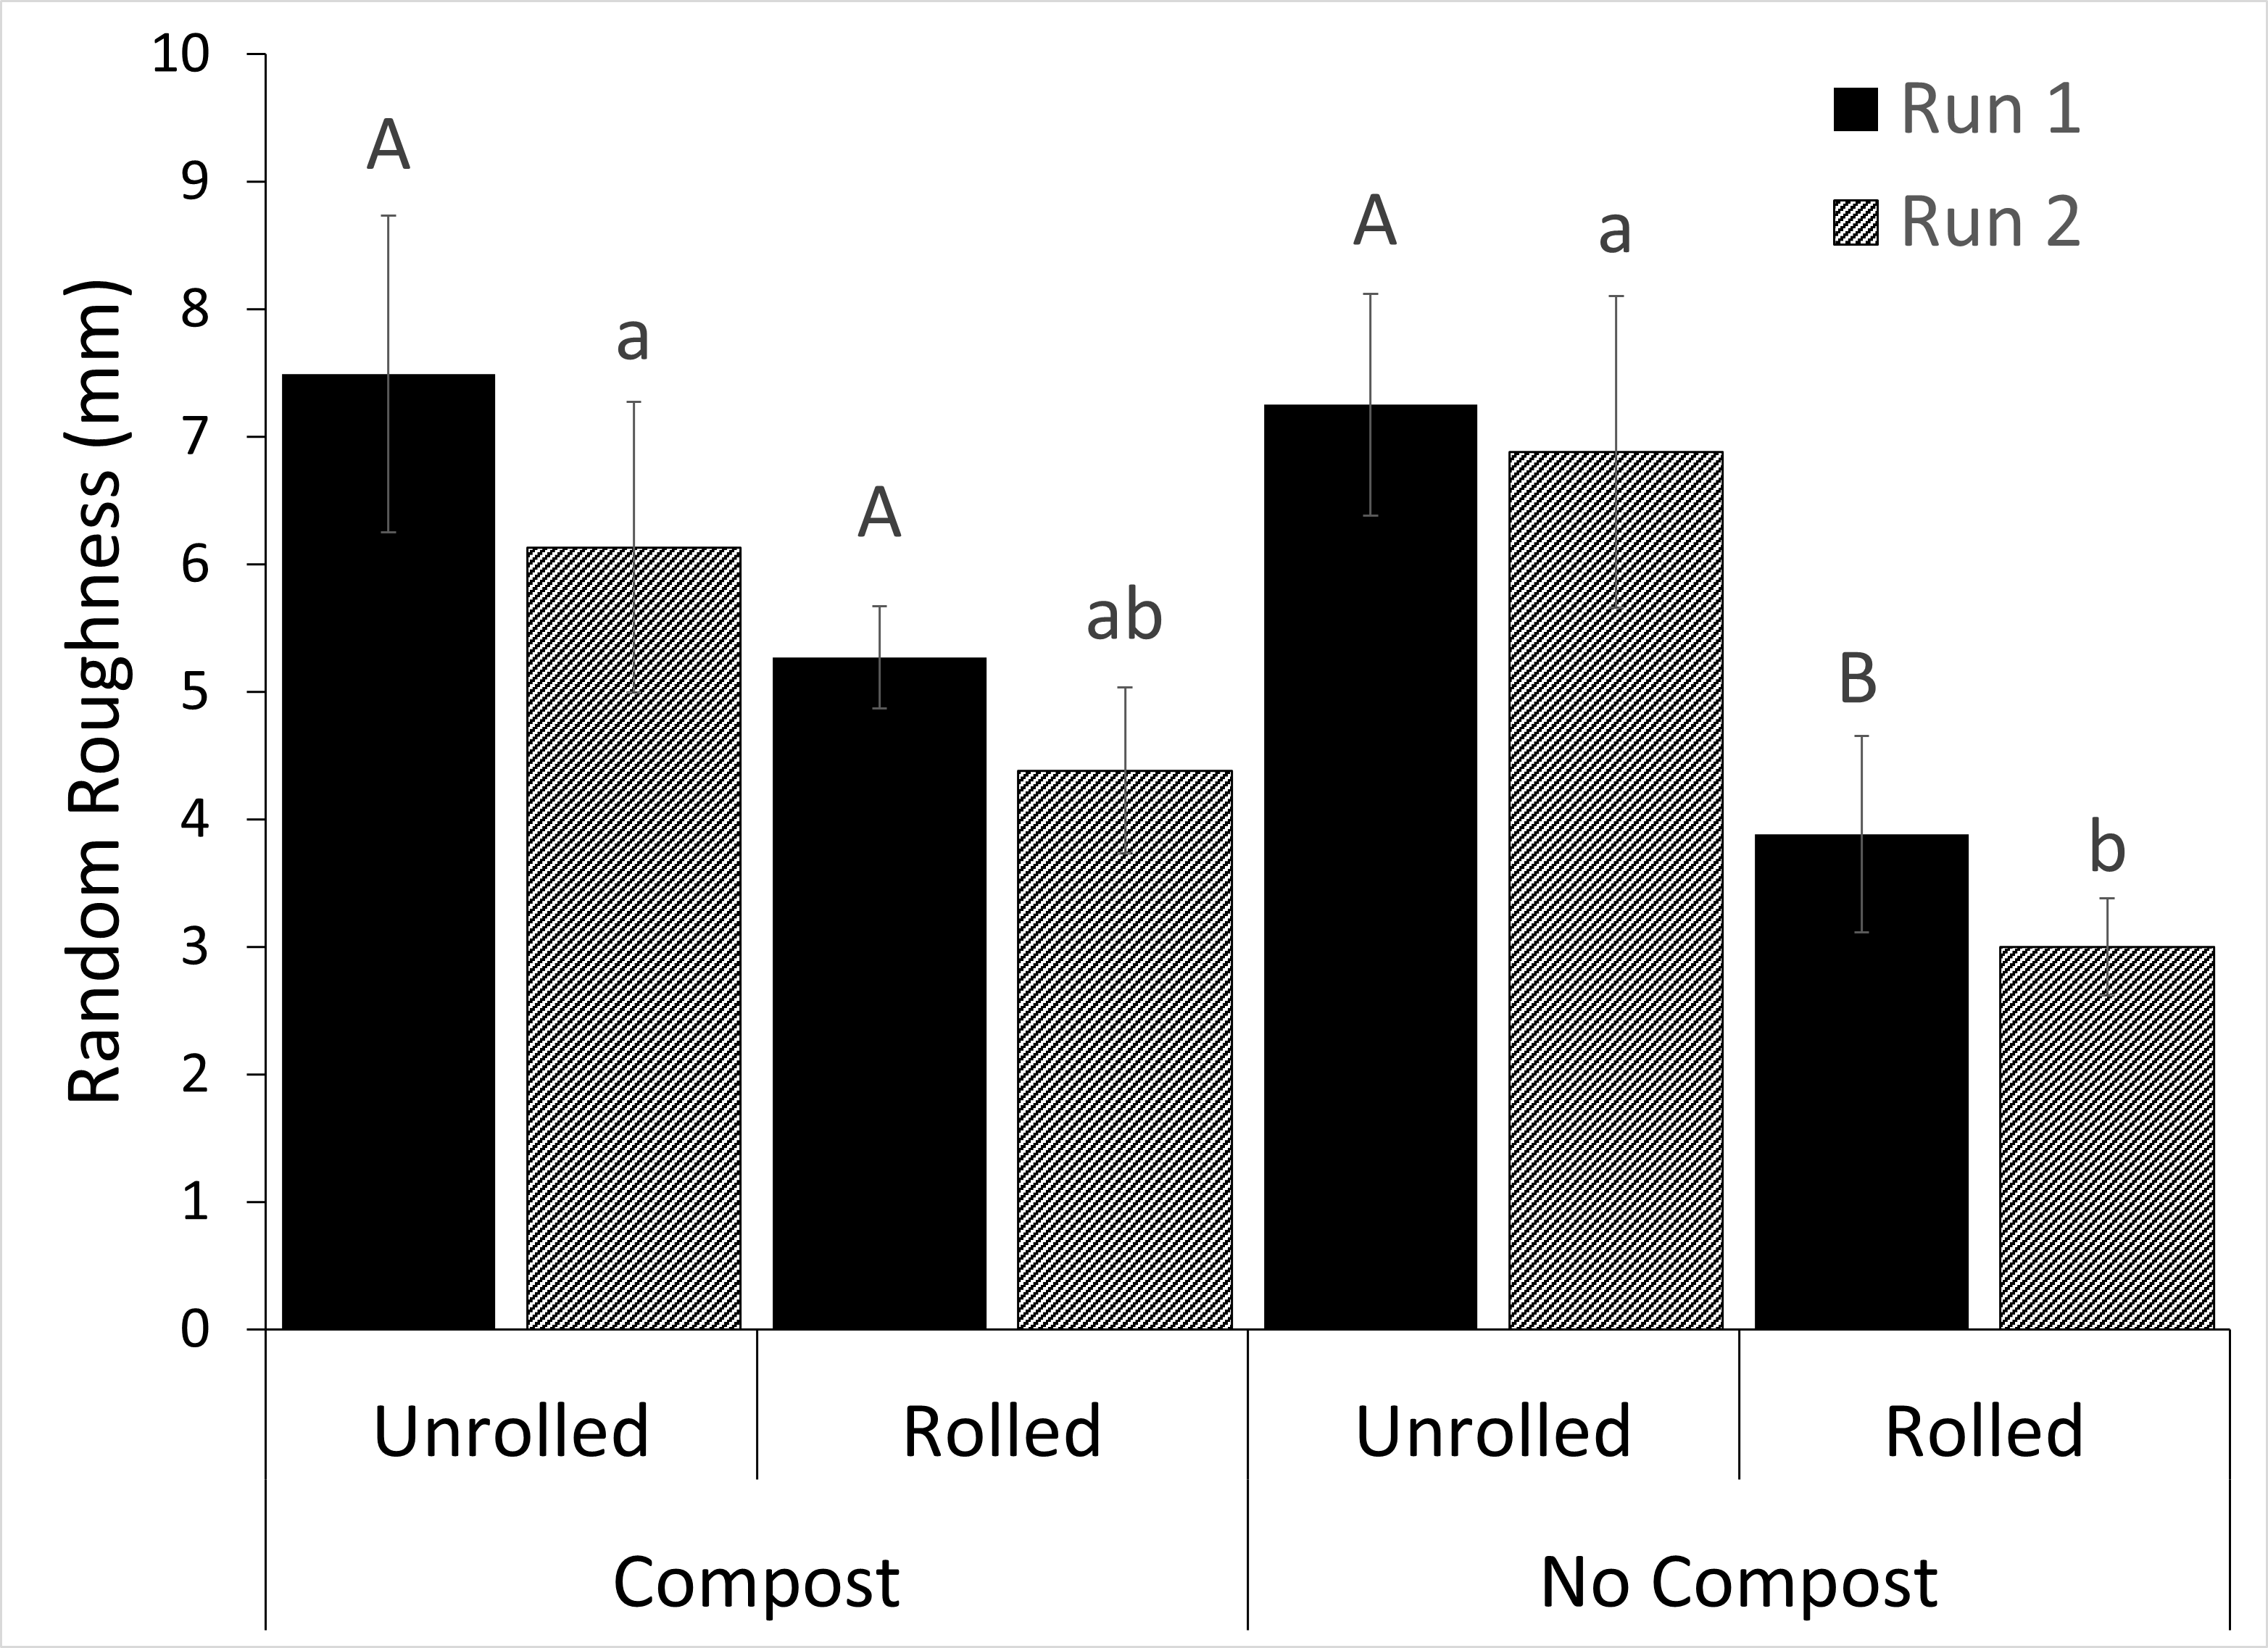
Surface roughness. The surface roughness of soil just before flextine cultivation was influenced by rolling or compost additions but not by molasses (Table 1.3). As expected, rolling reduced surface roughness in both runs of the experiment. In run 1, there was an interaction between rolling and compost addition: Rolled soils which had received historic compost additions had 26.3% greater roughness than rolled soils which had not received compost (Figure 1.4). Surprisingly, the effect of rolling was greatest where no compost had been applied (Figure 1.4). In run 2, the same trend held, but surface roughness in rolled compost plots was not different than rolled plots without compost (Figure 1.4).
|
Table 1.3. Significance (P values) of effects of compost, rolling, and molasses applications on soil random roughness, soil moisture (gravimetric moisture content) and soil hardness (micropenetrometer resistance). |
||||||||||||
|
|
|
|
|
|
|
|
|
|
|
|
|
|
|
|
|
Run 1 (Sweat Corn) |
|
Run 2 (Bean) |
||||||||
|
|
|
Surface Roughness |
|
|
|
|
Surface Roughness |
|
|
|
||
|
Soil Treatments |
Pre-Cult |
Post-Cult |
|
Soil Moisture |
Soil Hardness |
|
Pre-Cult |
Post-Cult |
|
Soil Moisture |
Soil Hardness |
|
|
|
|
-------------------------------------------Significance (P-value)---------------------------------------- |
||||||||||
|
ANOVA |
|
|
|
|
|
|
|
|
|
|
|
|
|
|
Compost (C) |
0.1082 |
0.5156 |
|
0.2236 |
0.9696 |
|
0.3330 |
0.8923 |
|
0.2205 |
0.3274 |
|
|
Rolling (R) |
0.0004 |
0.7425 |
|
0.0036 |
0.0001 |
|
0.0001 |
0.0001 |
|
0.7786 |
0.0001 |
|
|
Molasses (M) |
0.4208 |
0.5289 |
|
0.2617 |
0.0045 |
|
0.0138 |
0.6219 |
|
0.0732 |
0.2820 |
|
|
C X R |
0.0150 |
0.2682 |
|
0.4873 |
0.8266 |
|
0.0058 |
0.1436 |
|
0.7996 |
0.5531 |
|
|
C X M |
0.1451 |
0.8770 |
|
0.3851 |
0.2852 |
|
0.6011 |
0.1276 |
|
0.8101 |
0.8306 |
|
|
R X M |
0.0894 |
0.3915 |
|
0.8199 |
0.0279 |
|
0.0001 |
0.1170 |
|
0.7152 |
0.4181 |
|
|
C X R X M |
0.0764 |
0.3117 |
|
0.6589 |
0.4160 |
|
0.9213 |
0.4974 |
|
0.9869 |
0.8543 |
|
Bolded p values are statisticaly significance (p = 0.05) |
||||||||||||
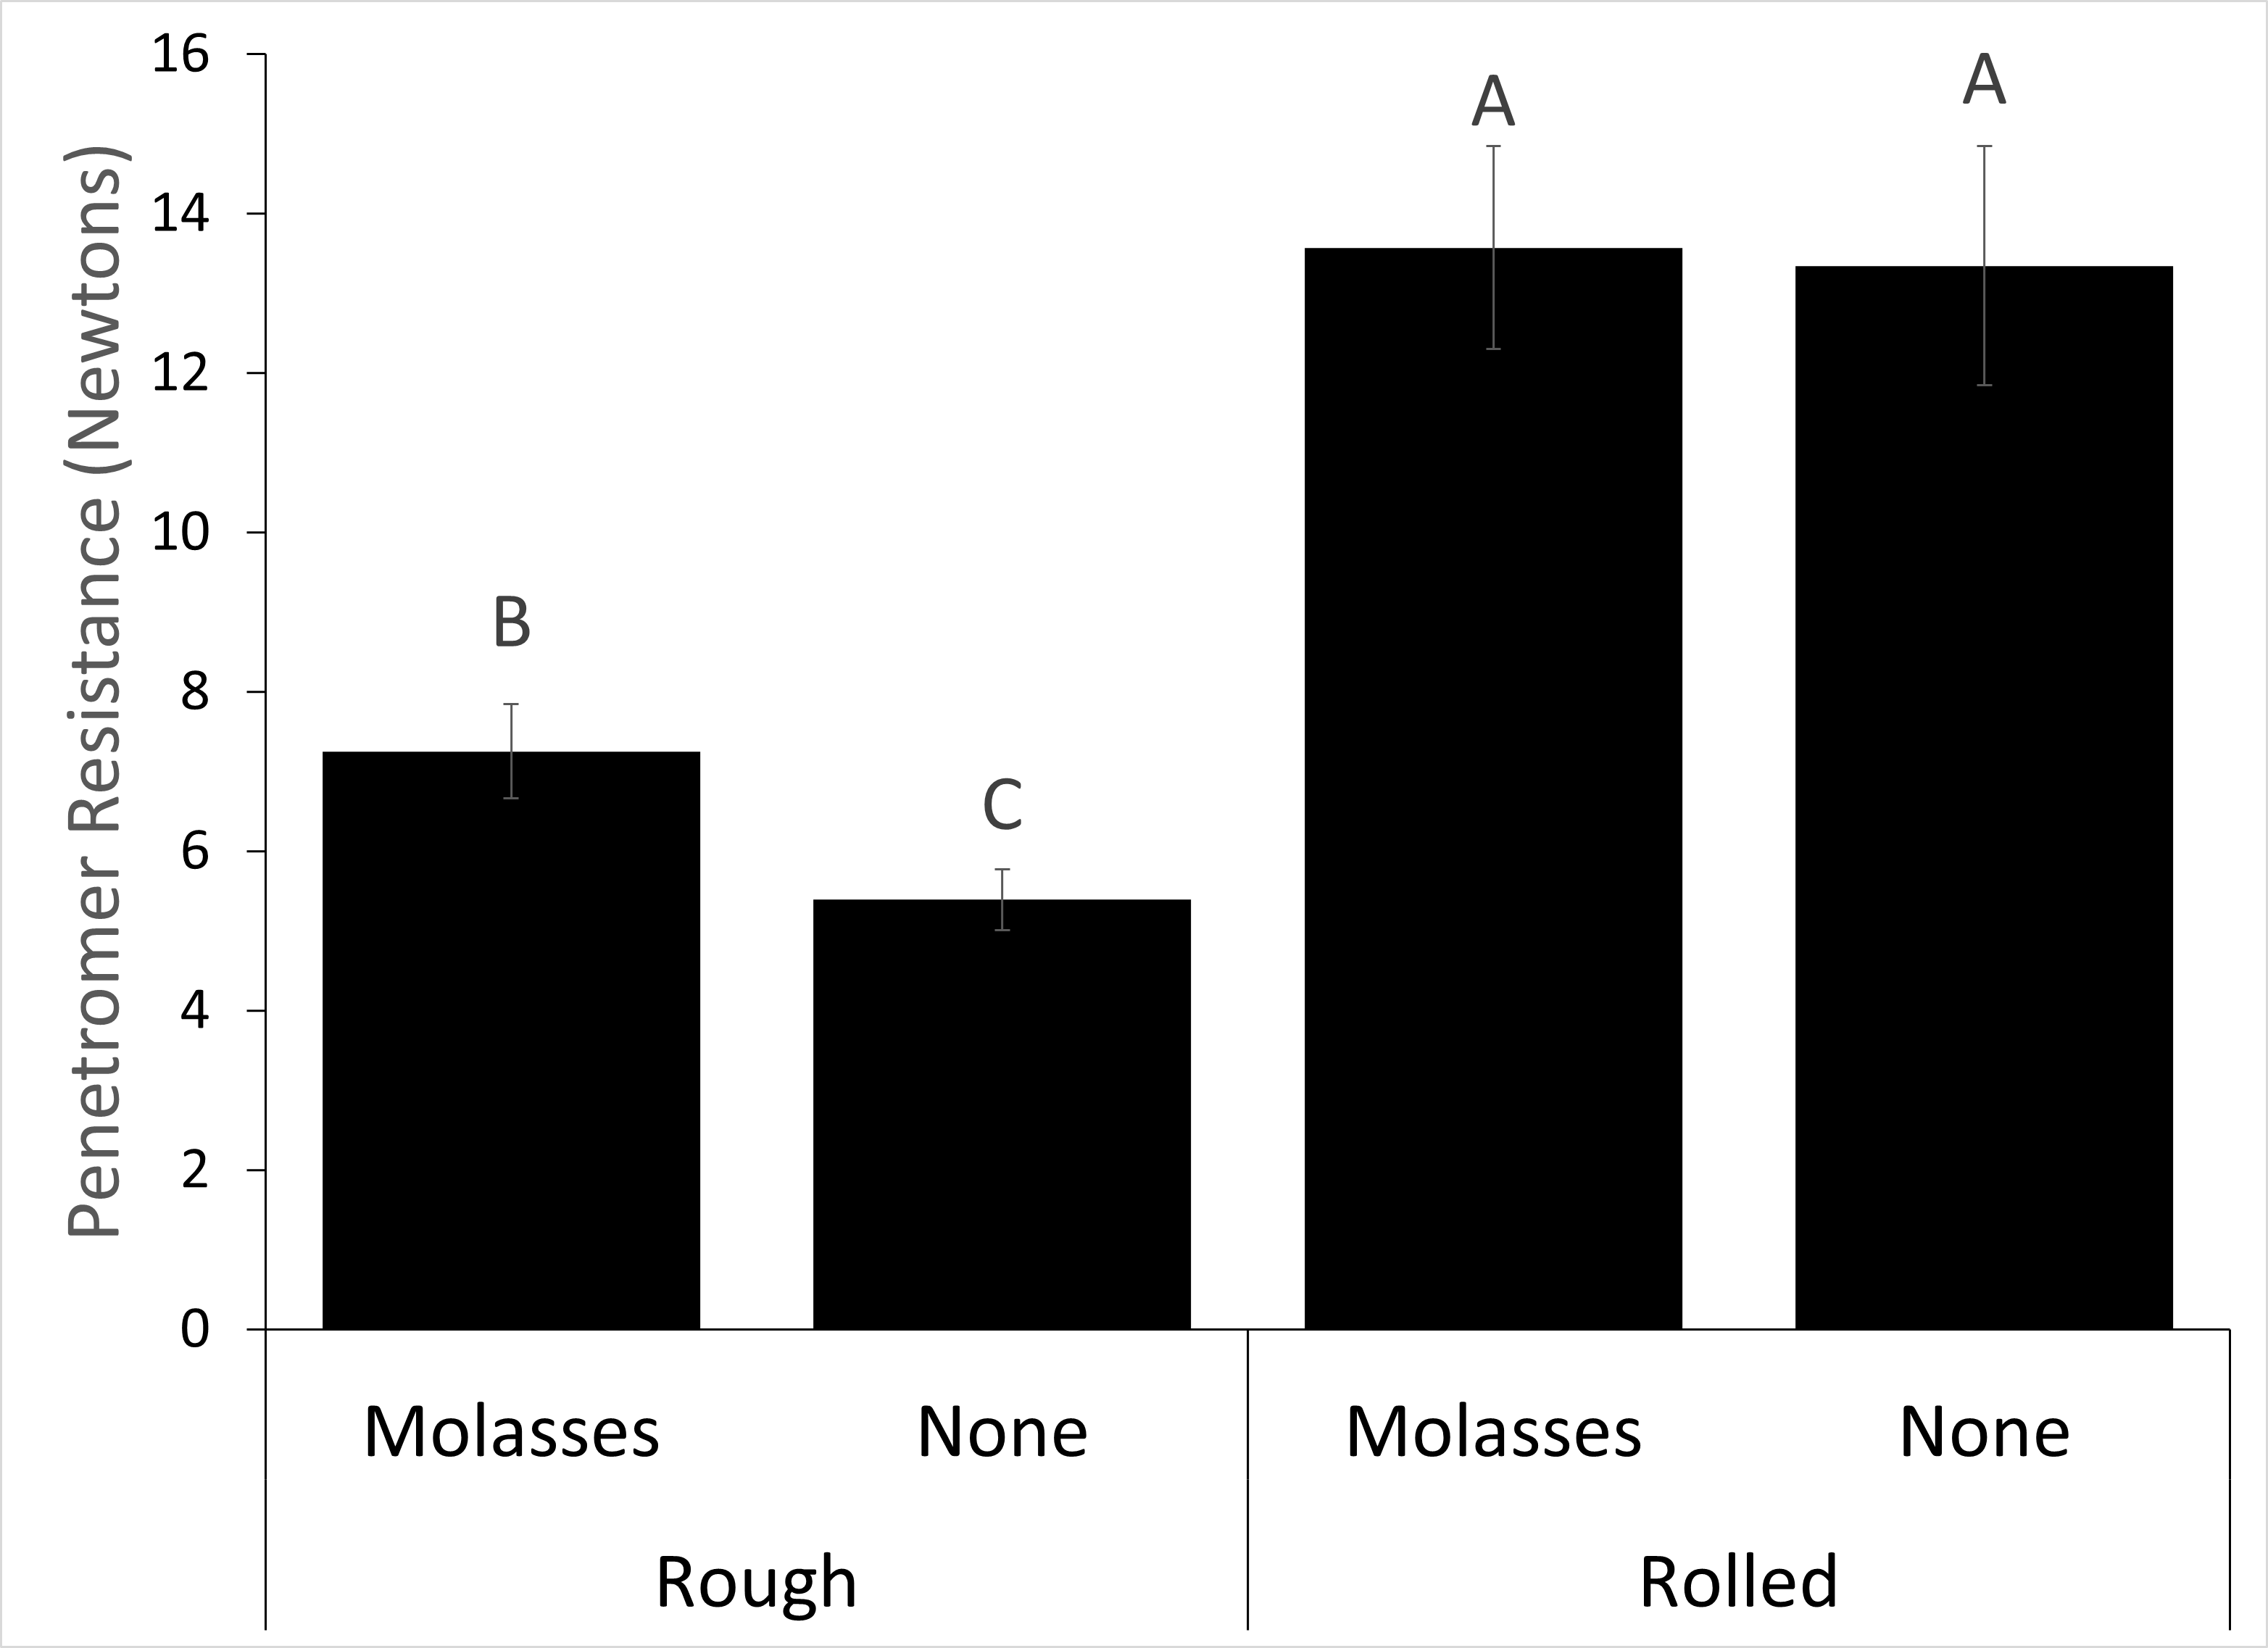
Soil micro-penetrometer resistance. Soil hardness was influenced by rolling, but not by compost application (Table 1.3). The effect of molasses application on hardness was only detected in run 2, and only in treatments that had not been rolled (Table 1.3; Figure 1.5). Rolled plots were 73% and 85% harder compared to unrolled plots, in run 1 and 2, respectively (Table 1.4). In run 2, molasses application increased hardness by 24% in unrolled treatments, but had no effect in treatments that had been rolled (Figure 1.5).
|
Table 1.4. Mean surface random roughness, soil water content, and micropenetrometer resistance in response to main effects of historic compost, rolling and mollasses application in run 1 and run 2. |
|||||||||||||||||||||
|
|
|
|
|
|
|
|
|
|
|
|
|
|
|
|
|
|
|
|
|
|
|
|
|
|
Run 1 (Sweet Corn) |
|
Run 2 (Bean) |
|||||||||||||||||
|
|
|
Surface Roughness |
|
|
|
|
|
|
Surface Roughness |
|
|
|
|
|
|
||||||
|
Soil Treatments |
Pre-Cult |
Post-Cult |
|
Soil Moisture |
Soil Hardness |
|
Pre-Cult |
Post-Cult |
|
Soil Moisture |
Soil Hardness |
|
|||||||||
|
|
|
----------- mm ---------- |
|
---%--- |
---N--- |
|
----------- mm ---------- |
|
---%--- |
---N--- |
|
||||||||||
|
Compost Main Effect |
|
|
|
|
|
|
|
|
|
|
|
|
|
|
|
|
|
|
|
|
|
|
|
Compost |
6.4 |
|
10.0 |
|
|
6.9 |
|
10.0 |
|
|
5.1 |
|
7.7 |
|
|
5.7 |
|
7.5 |
|
|
|
|
None |
5.6 |
|
9.6 |
|
|
5.8 |
|
9.8 |
|
|
5.0 |
|
8.0 |
|
|
5.1 |
|
8.2 |
|
|
|
Rolling Main effect |
|
|
|
|
|
|
|
|
|
|
|
|
|
|
|
|
|
|
|
|
|
|
|
Rough |
7.4 |
a |
10.0 |
|
|
5.6 |
b |
6.3 |
b |
|
6.5 |
a |
9.8 |
a |
|
5.4 |
|
5.5 |
b |
|
|
|
Rolled |
4.6 |
b |
9.6 |
|
|
7.1 |
a |
13.5 |
a |
|
3.6 |
b |
6.0 |
b |
|
5.5 |
|
10.2 |
a |
|
|
Molasses Main Effect |
|
|
|
|
|
|
|
|
|
|
|
|
|
|
|
|
|
|
|
|
|
|
|
Molasses Applied |
5.7 |
|
9.6 |
|
|
6.6 |
|
10.6 |
a |
|
4.8 |
b |
8.0 |
|
|
5.6 |
|
8.1 |
|
|
|
|
None |
6.3 |
|
10.0 |
|
|
6.0 |
|
9.1 |
b |
|
5.3 |
a |
7.7 |
|
|
5.2 |
|
7.5 |
|
|
|
Statistical significance (p = 0.05) is indicated by different letters within the same column. |
|||||||||||||||||||||
Soil moisture. Rolling, compost and molasses factors had no detectable effect on soil moisture prior to flextine cultivation with one notable exception (Table 1.4): In run 1, rolled soils were 26.3% wetter than unrolled soils prior to sweet corn cultivation (Table 1.4).
Flextine effects on weed mortality and crop mortality following compost, rolling and molasses
Flextine efficacy. In both runs of the experiment, ambient weed mortality following flextine cultivation was influenced by the main effect of rolling, but not by historic compost or molasses application (Table 1.5). Rolling reduced flextine efficacy on ambient weeds by 1.7% in run 1 and 2.6% in run 2 (Table 1.6). In run 1, red amaranth surrogate mortality was also higher in unrolled treatments, but no effect was detected for mustard surrogate weeds. In run 2, germination of both surrogate weeds was poor, so no surrogate mortality could be evaluated. As anticipated given our calibration process, crop mortality in both runs of the experiment was low, averaging approximately 8% for sweet corn and 5% for beans, with no obvious effects of compost, rolling or molasses (Table 1.6).
|
Table 1.5 Significance (P values) of effects of compost, rolling, and molasses applications on weed density and mortality of mustard, red amaranth, and ambient weeds following cultivation. |
|||||||||||||||||
|
|
|
|
|
|
|
|
|||||||||||
|
|
|
|
Run 1 (Sweet Corn) |
|
Run 2 (Bean) |
||||||||||||
|
|
|
|
Ambient a Weed Emergence |
|
Weed Mortality |
|
Ambienta Weed Emergence |
|
Weed Mortality |
||||||||
|
Factors |
|
|
Mustard |
Red Amaranth |
Ambient Weeds |
|
|
Ambient Weeds |
|||||||||
|
|
|
-----------------------------------------Significance (P-value)-------------------------------------- |
|||||||||||||||
|
ANOVA |
|
|
|
|
|
|
|
|
|
|
|
|
|
|
|
|
|
|
|
Compost (C) |
0.0085 |
|
0.1350 |
0.3364 |
0.7186 |
|
0.7726 |
|
0.9011 |
|||||||
|
|
Rolling (R) |
0.0001 |
|
0.0877 |
0.0447 |
0.0066 |
|
0.2068 |
|
0.0010 |
|||||||
|
|
Molasses (M) |
0.0586 |
|
0.9915 |
0.9836 |
0.9708 |
|
0.5533 |
|
0.9194 |
|||||||
|
|
C X R |
|
0.2011 |
|
0.0860 |
0.9924 |
0.1682 |
|
0.5181 |
|
0.8651 |
||||||
|
|
C X M |
0.1613 |
|
0.3760 |
0.6484 |
0.9601 |
|
0.3967 |
|
0.5404 |
|||||||
|
|
R X M |
0.0834 |
|
0.6805 |
0.6186 |
0.4664 |
|
0.6037 |
|
0.8551 |
|||||||
|
|
C X R X M |
0.7071 |
|
0.9393 |
0.6259 |
0.4164 |
|
0.8040 |
|
0.7853 |
|||||||
|
Bolded p values are statistically significance (p = 0.05) |
|||||||||||||||||
|
a Ambient weeds were purslane (Portulaca oleracea), lambsquarter (Chenopodium album), crabgrass (Digitaria sanguinalis) and pigweed (Amaranthus powellii) species |
|||||||||||||||||
|
Table 1.6. Mean weed density and mortality following flextine cultivation in response to main effects of historic compost, rolling and molasses application in run 1 and run 2. There were no significant interactions (see Table 1.4). |
||||||||||||||||||||
|
|
|
|
|
|
|
|
|
|
|
|
|
|
|
|
|
|
|
|
|
|
|
|
|
Run 1 (Sweet Corn) |
|
Run 2 (Bean) |
||||||||||||||||
|
|
|
Ambienta Weed Emergence |
|
Mortality |
|
Ambienta Weed Emergence |
|
Mortality |
||||||||||||
|
Soil Treatments |
|
Sweetb Corn |
Mustard |
|
Red Amaranth |
Ambient Weeds |
|
|
Beanb |
Ambient Weeds |
||||||||||
|
|
---# m-2--- |
|
-------------------------------------------- % -------------------------------------- |
|
---# m-2--- |
|
----- % ----- |
|||||||||||||
|
Compost Main Effect |
|
|
|
|
|
|
|
|
|
|
|
|
|
|
|
|
|
|
|
|
|
|
Compost |
216.4 |
a |
|
6.4 |
|
87.8 |
|
94.9 |
|
99.0 |
|
|
262.5 |
|
|
3.9 |
|
98.0 |
|
|
|
None |
121.5 |
b |
|
9.7 |
|
95.0 |
|
97.1 |
|
98.6 |
|
|
287.0 |
|
|
5.7 |
|
98.1 |
|
|
Rolling Main Effect |
|
|
|
|
|
|
|
|
|
|
|
|
|
|
|
|
|
|
|
|
|
|
Rough |
119.3 |
b |
|
9.4 |
|
94.2 |
|
98.2 |
b |
99.6 |
b |
|
249.8 |
|
|
3.7 |
|
99.3 |
b |
|
|
Rolled |
218.6 |
a |
|
6.6 |
|
88.6 |
|
93.8 |
a |
98.0 |
a |
|
299.8 |
|
|
6.0 |
|
96.8 |
a |
|
Molasses Main Effect |
|
|
|
|
|
|
|
|
|
|
|
|
|
|
|
|
|
|
|
|
|
|
Molasses Applied |
186.7 |
|
|
7.5 |
|
91.0 |
|
95.8 |
|
99.0 |
|
|
283.2 |
|
|
5.6 |
|
98.0 |
|
|
|
None |
148.8 |
|
|
8.7 |
|
91.9 |
|
96.2 |
|
98.6 |
|
|
265.2 |
|
|
3.7 |
|
98.1 |
|
|
Statistical significance (p = 0.05) is indicated by different letters within the same column. |
||||||||||||||||||||
|
a Ambient weeds were purslane (Portulaca oleracea), common lambsquarters (Chenopodium album), large crabgrass (Digitaria sanguinalis) and Powell amaranth(Amaranthus powellii) species. |
||||||||||||||||||||
|
b No statistical means separations were performed on crop mortality due. Unable to normalize data through transformation. |
||||||||||||||||||||
Flextine effects on surface roughness. Surface roughness following flextine cultivation was influenced by the main effect of rolling in run 2, but not in run 1 (Table 1.3). Rolled soils had 38.5% lower surface roughness than unrolled soils following flextine cultivation in beans (Table 1.4). However, following cultivation in corn, surface roughness was not different between rolled and unrolled soils (Table 1.4).
Relationship between mortality and soil surface characteristics
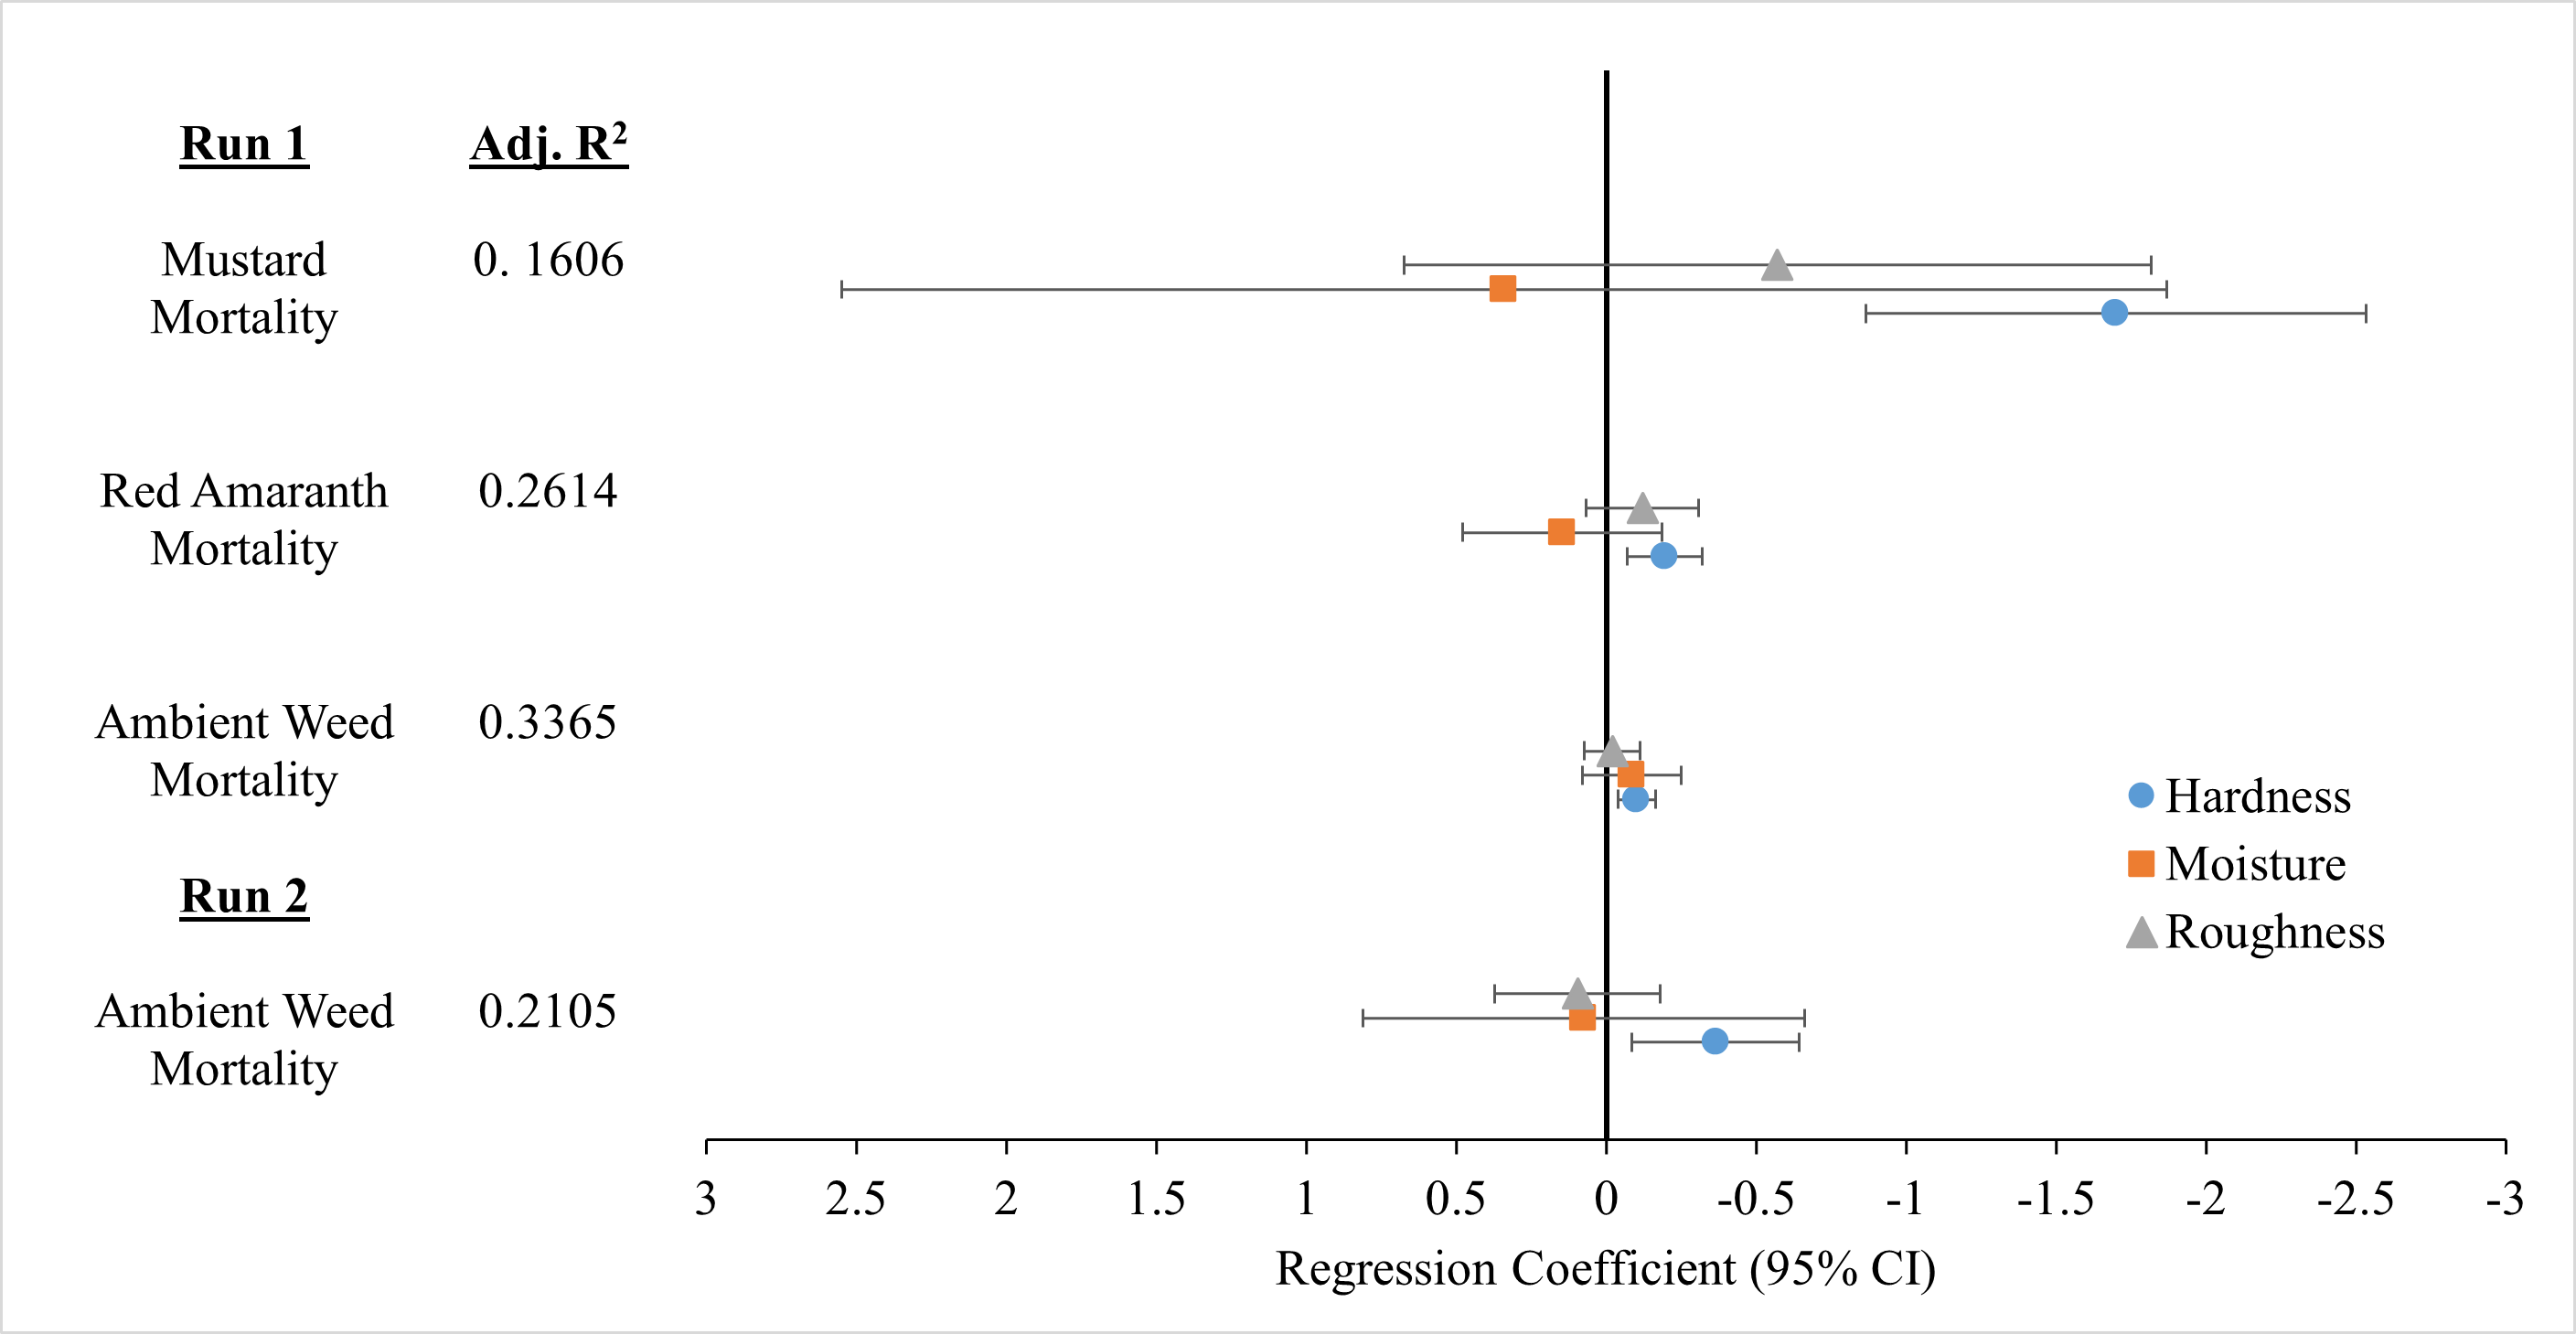
Results from our regression analysis show that among the variables we tested, weed mortality was negatively correlated with soil hardness for all species in both runs (Figure 1.6). We were not able to detect correlations between weed mortality and soil moisture or surface roughness. Regression coefficient suggest that each one newton increase in soil penetrometer resistance was associated with a reduction in flextine efficacy of approximately 1 to 2 percentage points.
Contrary to expectations, we found that rolling a seedbed to create a level soil reduced efficacy of flextine cultivation in most cases. In both runs of the experiment, rolling resulted in reduced efficacy of flextine cultivation for control of ambient weeds (Table 1.6). Although efficacy was greater than 95% regardless of rolling, the greater density of escaped weeds in rolled plots is likely to represent a real potential cost to growers in the form of higher handweeding costs or reduced quality and yield. For example, in run 1 of this experiment, ambient weed density following flextine cultivation was 6-fold higher in rolled compared to unrolled treatments.
Our results also suggest several mechanisms that help explain this counterintuitive effect of rolling on flextine efficacy. As expected, rolling beds prior to planting produced a more level soil surface in most cases (Table 1.3; Figure 1.4), which —other things equal—would likely result in the more uniform working depth to improve efficacy. However, although rolling reduced surface roughness, we were not able to detect any correlation between surface roughness and flextine efficacy (Figure 1.6). Rolling also affected other soil conditions which may have had a negative effect on flextine efficacy. In particular, rolling soils increased soil micropenetrometer resistance (hardness) in both runs of the experiment, and increased soil surface moisture content in run 1 (Table 1.4). Our regression analysis shows that among these factors, soil hardness was most clearly associated with weed mortality (Figure 1.6). Regression coefficients estimates suggest that a 1 N increase in soil penetrometer resistance was associated with a reduction in efficacy of 1 to 2 percentage points. Lack of observed surface roughness effects on efficacy may have been due in part to the relatively small differences in the range of roughness evaluated in this trial; although differences existed across rolled and unrolled bedsi (Table 1.4), the soil surface was probably sufficiently level to facilitate tine working depths that effectively killed weeds.
Rolling soils prior to planting represents a cost to growers in time, labor, and increased soil disturbance, and we found no benefit to this practice for flextine cultivation of large seeded vegetable crops on our loamy-sand soils. In fact, our results suggest that rolling can reduce flextine efficacy through its adverse effects on soil penetrometer resistance. However, these results may not be generalizable to other soil textures, crops, or cultivation tools. For example, soils with finer textures may be rougher following primary tillage and may benefit from leveling with a roller to improve cultivation equipment function and reduce potential safe-sites for weeds. Levelling may also provide benefits for smaller seeded crops such as carrots or beets by improving planting depth, stand establishment and tolerance to cultivation.
Our results also did not support our initial hypotheses that historic compost additions would improve cultivation efficacy (Table1.5). We anticipated that compost additions would improve efficacy by improving tool movement through the soil as previously asserted in several studies (Bowman 1997; Mohler 2001). However, these potential benefits on tool action may have been offset by several negative indirect effects. First, compost applications may have influenced flextine efficacy through effects on the density or growth of weeds and hence their ability to tolerate cultivation. For example, in run 1, historic compost addition was associated with higher densities of ambient weeds (Table 1.6). Although no clear differences in weed growth prior to cultivation were observed, it is also possible that weeds growing in composted soil had more vigorous root systems that improved their tolerance to cultivation. Second, it is interesting to note that compost itself in some cases contributed to greater surface roughness (Figure 1.4) which may have also offset any benefits of compost for flextine efficacy. We speculate that this effect may have been due to aggregates present in the compost applied in the spring just before initiation of the experiment. Such aggregates may have produced safe-sties for weeds that offset any longer term benefits for cultivation of compost addition on soil tilth.
The lack of compost effects on flextine efficacy may have also been due to the limited effects of that compost on soil tilth. Note that our study was conducted on a loamy-sand soil common in Midwest vegetable production. Potential changes in soil organic matter and structure in such soils is limited compared to more fine textured soils. In our case, soil organic matter (SOM) in treatments receiving annual compost for 12 years was 1.6%, compared to 1.3%, in soils receiving no compost. Moreover, both compost and non-compost treatments had identical cover crop and tillage management over this 12 year period, which may have overshadowed compost effects on SOM . It is possible that this difference in SOM between treatments was simply not sufficient to impact soil tilth and tool function. Indeed, we observed no impacts of compost on soil moisture or hardness (Table 1.4) that might have been expected in soils with significant changes in SOM. Cultivation tool function may be improved in soils with increased SOM and tilth, but we were not able to create sufficiently distinct soil conditions in this study to adequately test this hypothesis.
Artificial induction of soil crusting using molasses also did not have detectible effects on cultivation efficacy. Although we observed crusting due to molasses in these soils in greenhouse testing, molasses effects in the field appear to have been relatively small, with little or no detectable effect on soil penetrometer resistance (Table 1.4). However, we did observe that the soil surface with molasses appeared to create visible differences in soil crusting that were not adequately captured by resistance measured with our micropenetrometer. Again, the loamy sand soil where this trial was conducted has a lower propensity for crusting compared to finer textured soils, and our ability to produce a detectable soil crust with molasses was limited. Heavier soil types with poor soil structure are more likely to produce a crust that inhibits function of cultivation tools (Bresson and Boiffin 1990).
Our study demonstrates that soil conditions can play an important role in cultivation tool function. Characterization of soil conditions before and after cultivation events can provide insights into the mechanisms responsible for these effects. Observed discrepancies between tool function across years and sites may be attributable to differences in soil characteristics including roughness, moisture, and crusting. Unfortunately, soil conditions are often overlooked in cultivation studies, making inferences about the mechanisms of tool efficacy difficult or impossible. Ultimately, we’d like to be able to tell growers which tool will work best under which conditions, and give insights into management decisions. For instance, we saw in this study how soil compaction effects from rolling on efficacy might not be obvious when preparing level beds for cultivation. Including mechanistic information in cultivation studies is critical for providing growers with the information they need. Further research opportunities exist to more deeply explore how these characteristics impact cultivation efficacy and make management recommendations to growers.
Part 2: Integrated Physical and Cultural Weed Management in Table Beets
Cultivar x depth studies
Greenhouse
Total number of emerged seedlings. The final number of seedlings seed-1 to emerge was influenced by the main effect of cultivar but not by depth of planting (Table 2.4). B and TG varieties had the greatest total seedling emergence, and M had the least (Table 2.4). Final emergence of CG was higher than M in run 1, but lower than B and TG in run 2 (Table 2.4).
|
Table 2.4. Mean final emergence of seedlings per seed in response to cultivar and planting depth. |
|||||||||
|
|
|
|
|
|
|
|
|
|
|
|
|
|
Final emergence |
|||||||
|
|
|
GH |
|
|
|
||||
|
Treatment |
Run 1 |
Run 2 |
|
Field |
|||||
|
|
|
---seedlings seed-1--- |
|||||||
|
Cultivar Main Effect |
|
|
|
|
|
|
|
||
|
|
Boro |
1.27 |
a |
1.53 |
a |
|
1.30 |
a |
|
|
|
Chiogga Guardsmark |
1.42 |
a |
1.19 |
ab |
|
N/A |
|
|
|
|
Moneta |
0.71 |
b |
0.88 |
b |
|
0.70 |
b |
|
|
|
Touchstone Gold |
1.57 |
a |
1.29 |
a |
|
0.82 |
b |
|
|
Depth Main Effect |
|
|
|
|
|
|
|
||
|
|
1 cm |
1.29 |
|
1.22 |
|
|
1.04 |
a |
|
|
|
2 cm |
1.45 |
|
1.30 |
|
|
1.03 |
a |
|
|
|
3 cm |
1.18 |
|
1.20 |
|
|
0.88 |
ab |
|
|
|
4 cm |
1.05 |
|
1.21 |
|
|
0.80 |
b |
|
|
ANOVA |
------------------Significance (P-value) ------------------ |
||||||||
|
|
Cultivar |
0.0001 |
0.0003 |
|
0.0001 |
||||
|
|
Depth |
0.2073 |
0.8580 |
|
0.0078 |
||||
|
|
Cultivar x Depth |
0.8655 |
0.8796 |
|
0.2316 |
||||
|
Statistical significance (p = 0.05) is indicated by different letters within the same column. |
|||||||||
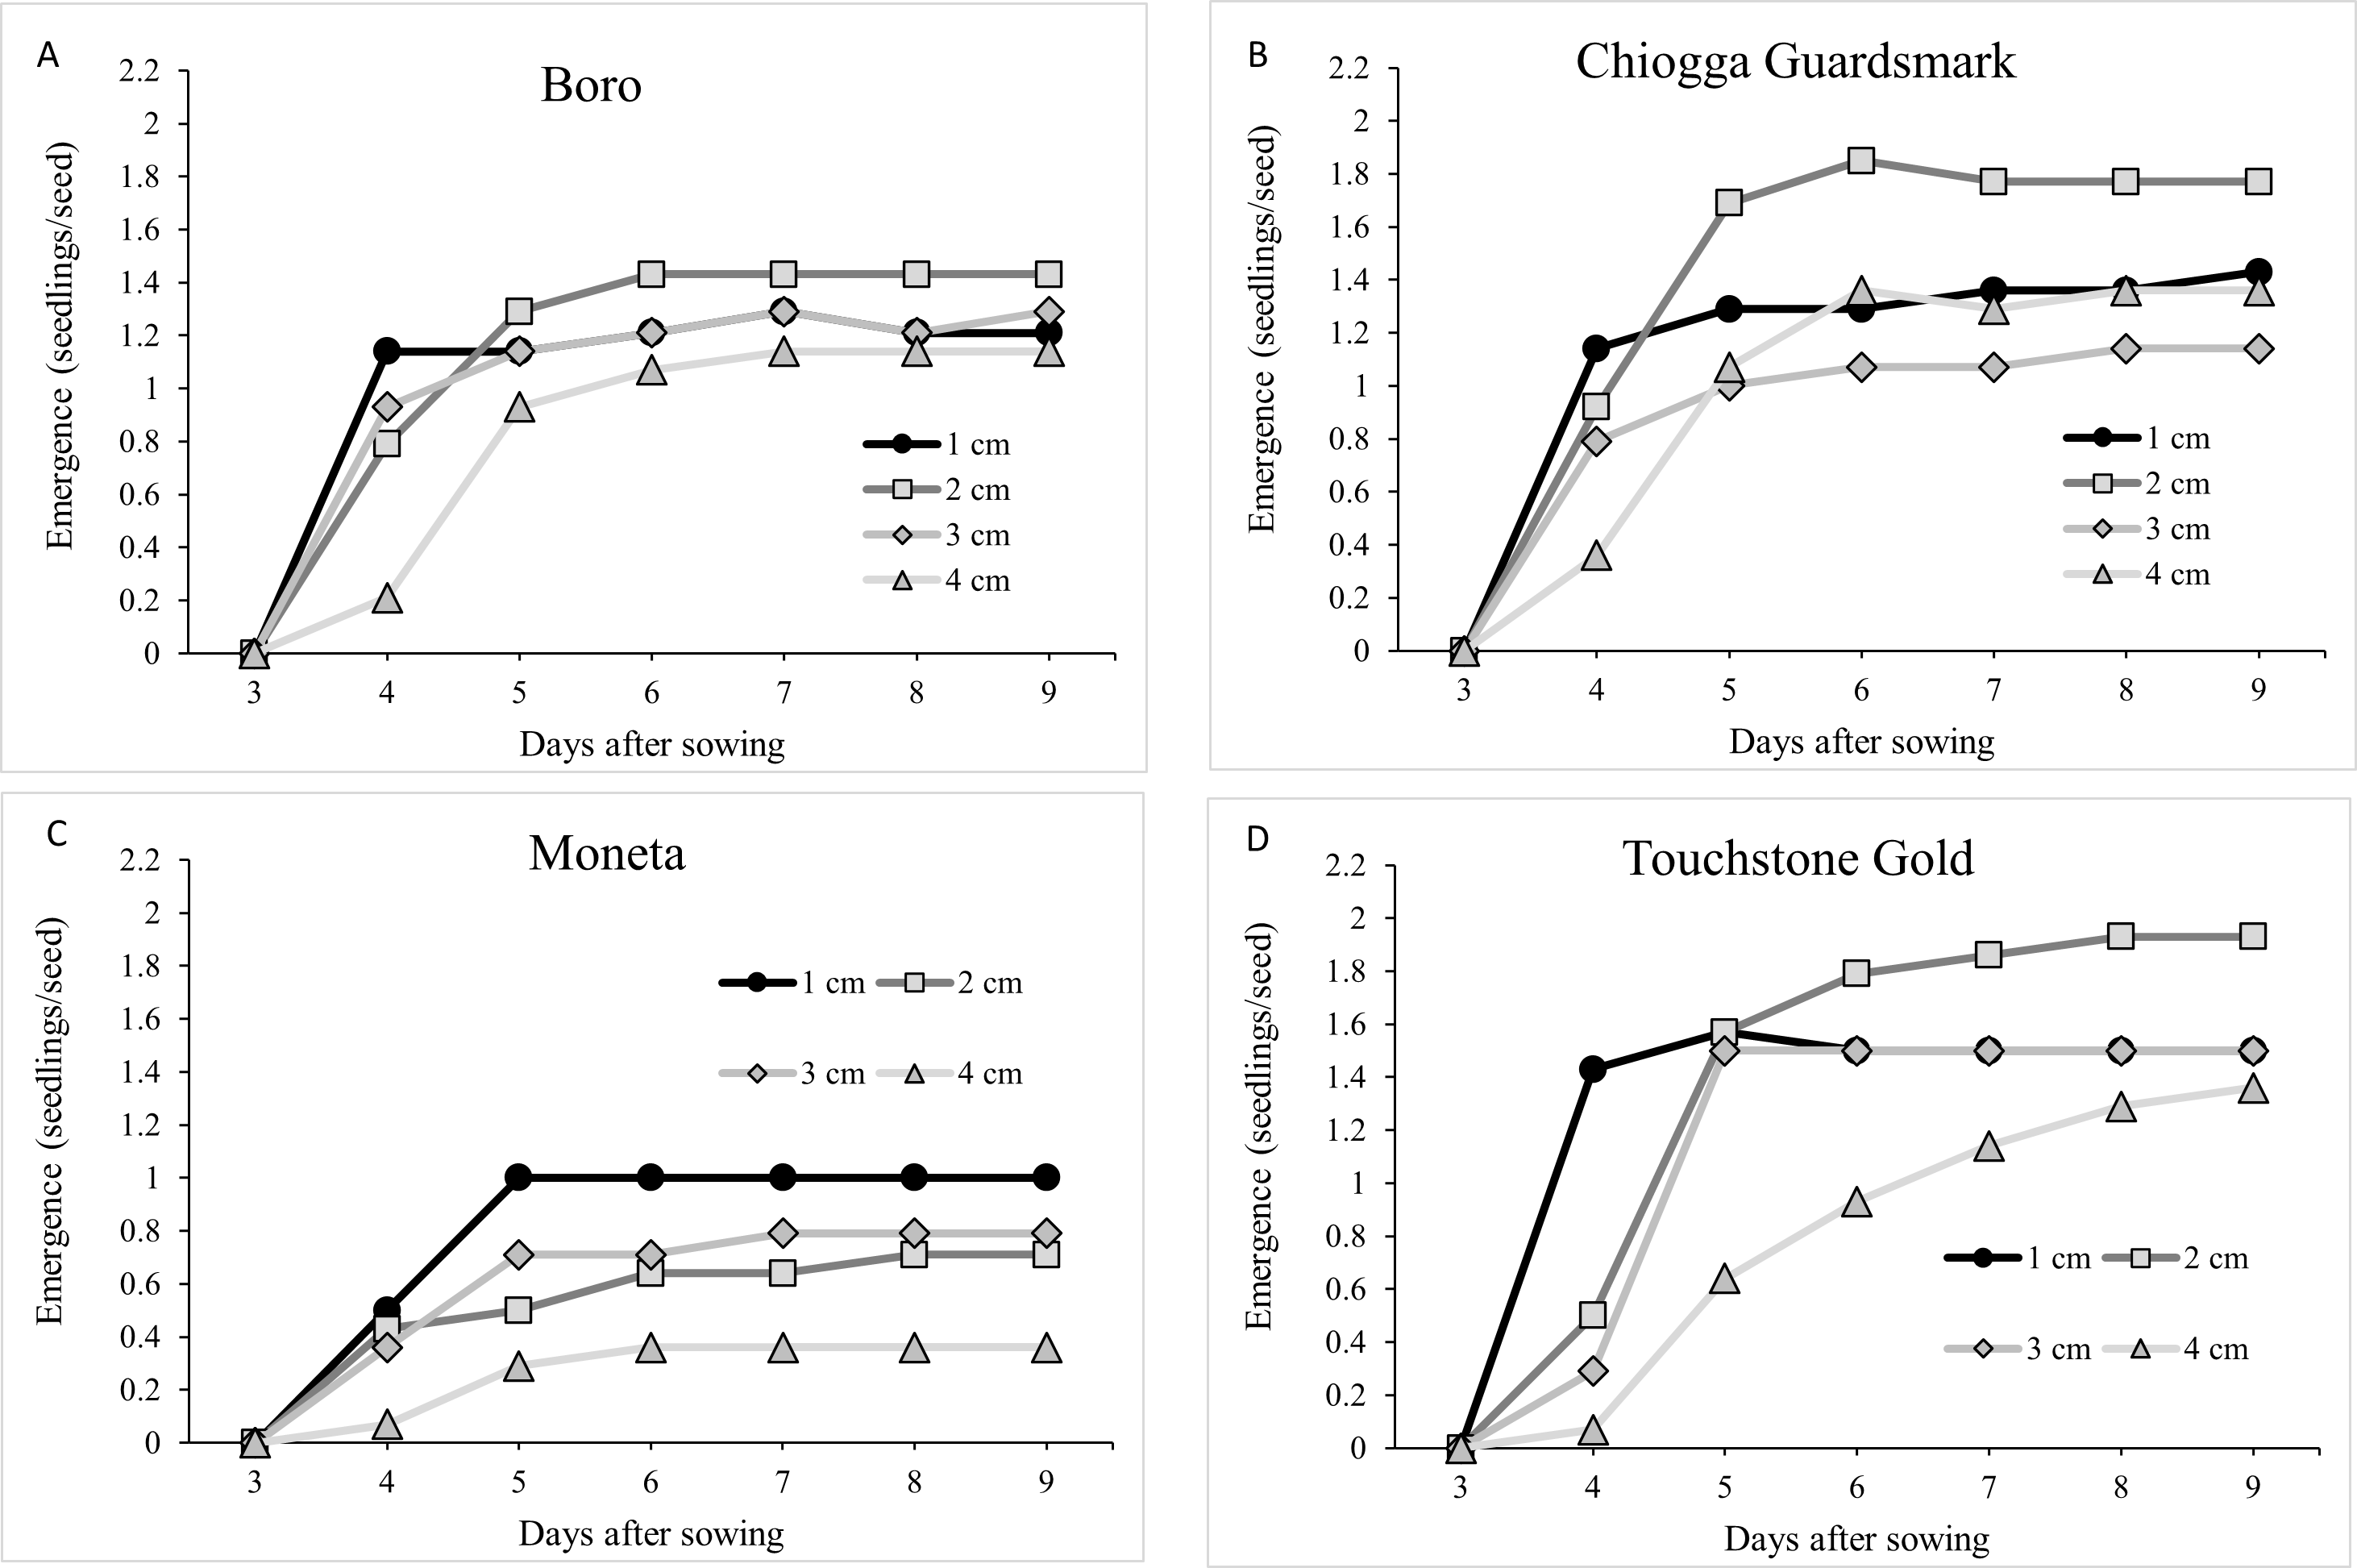
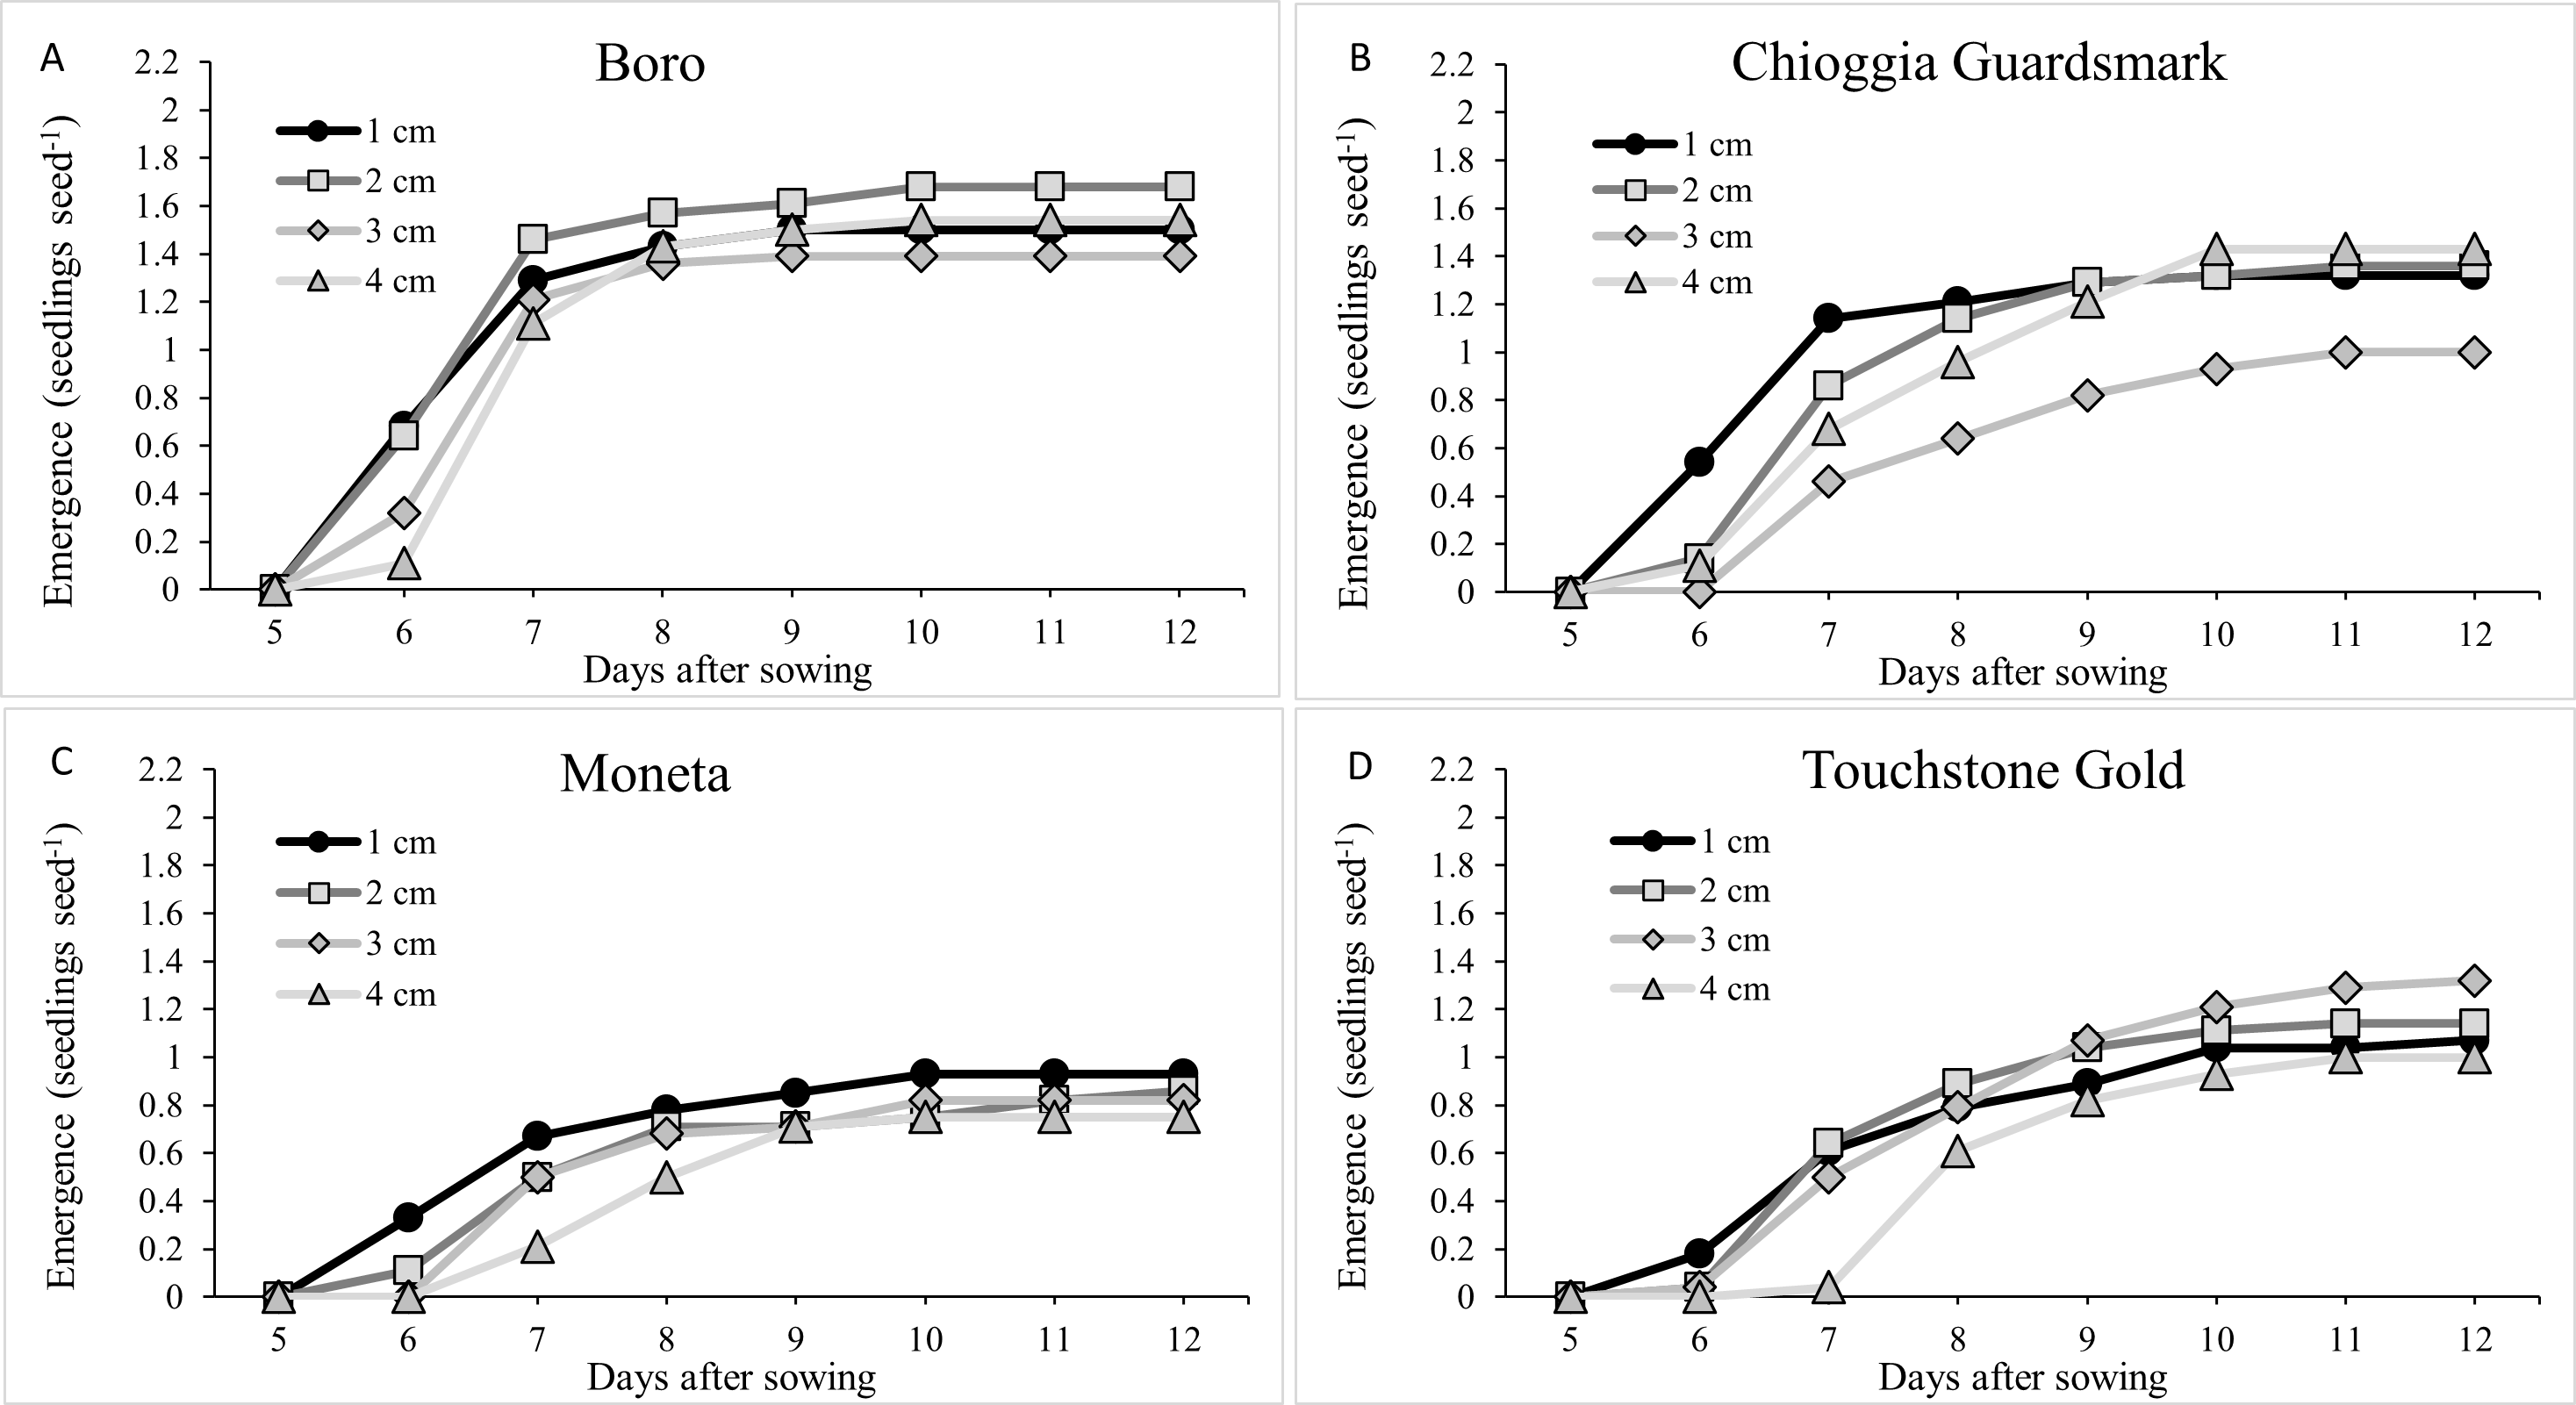
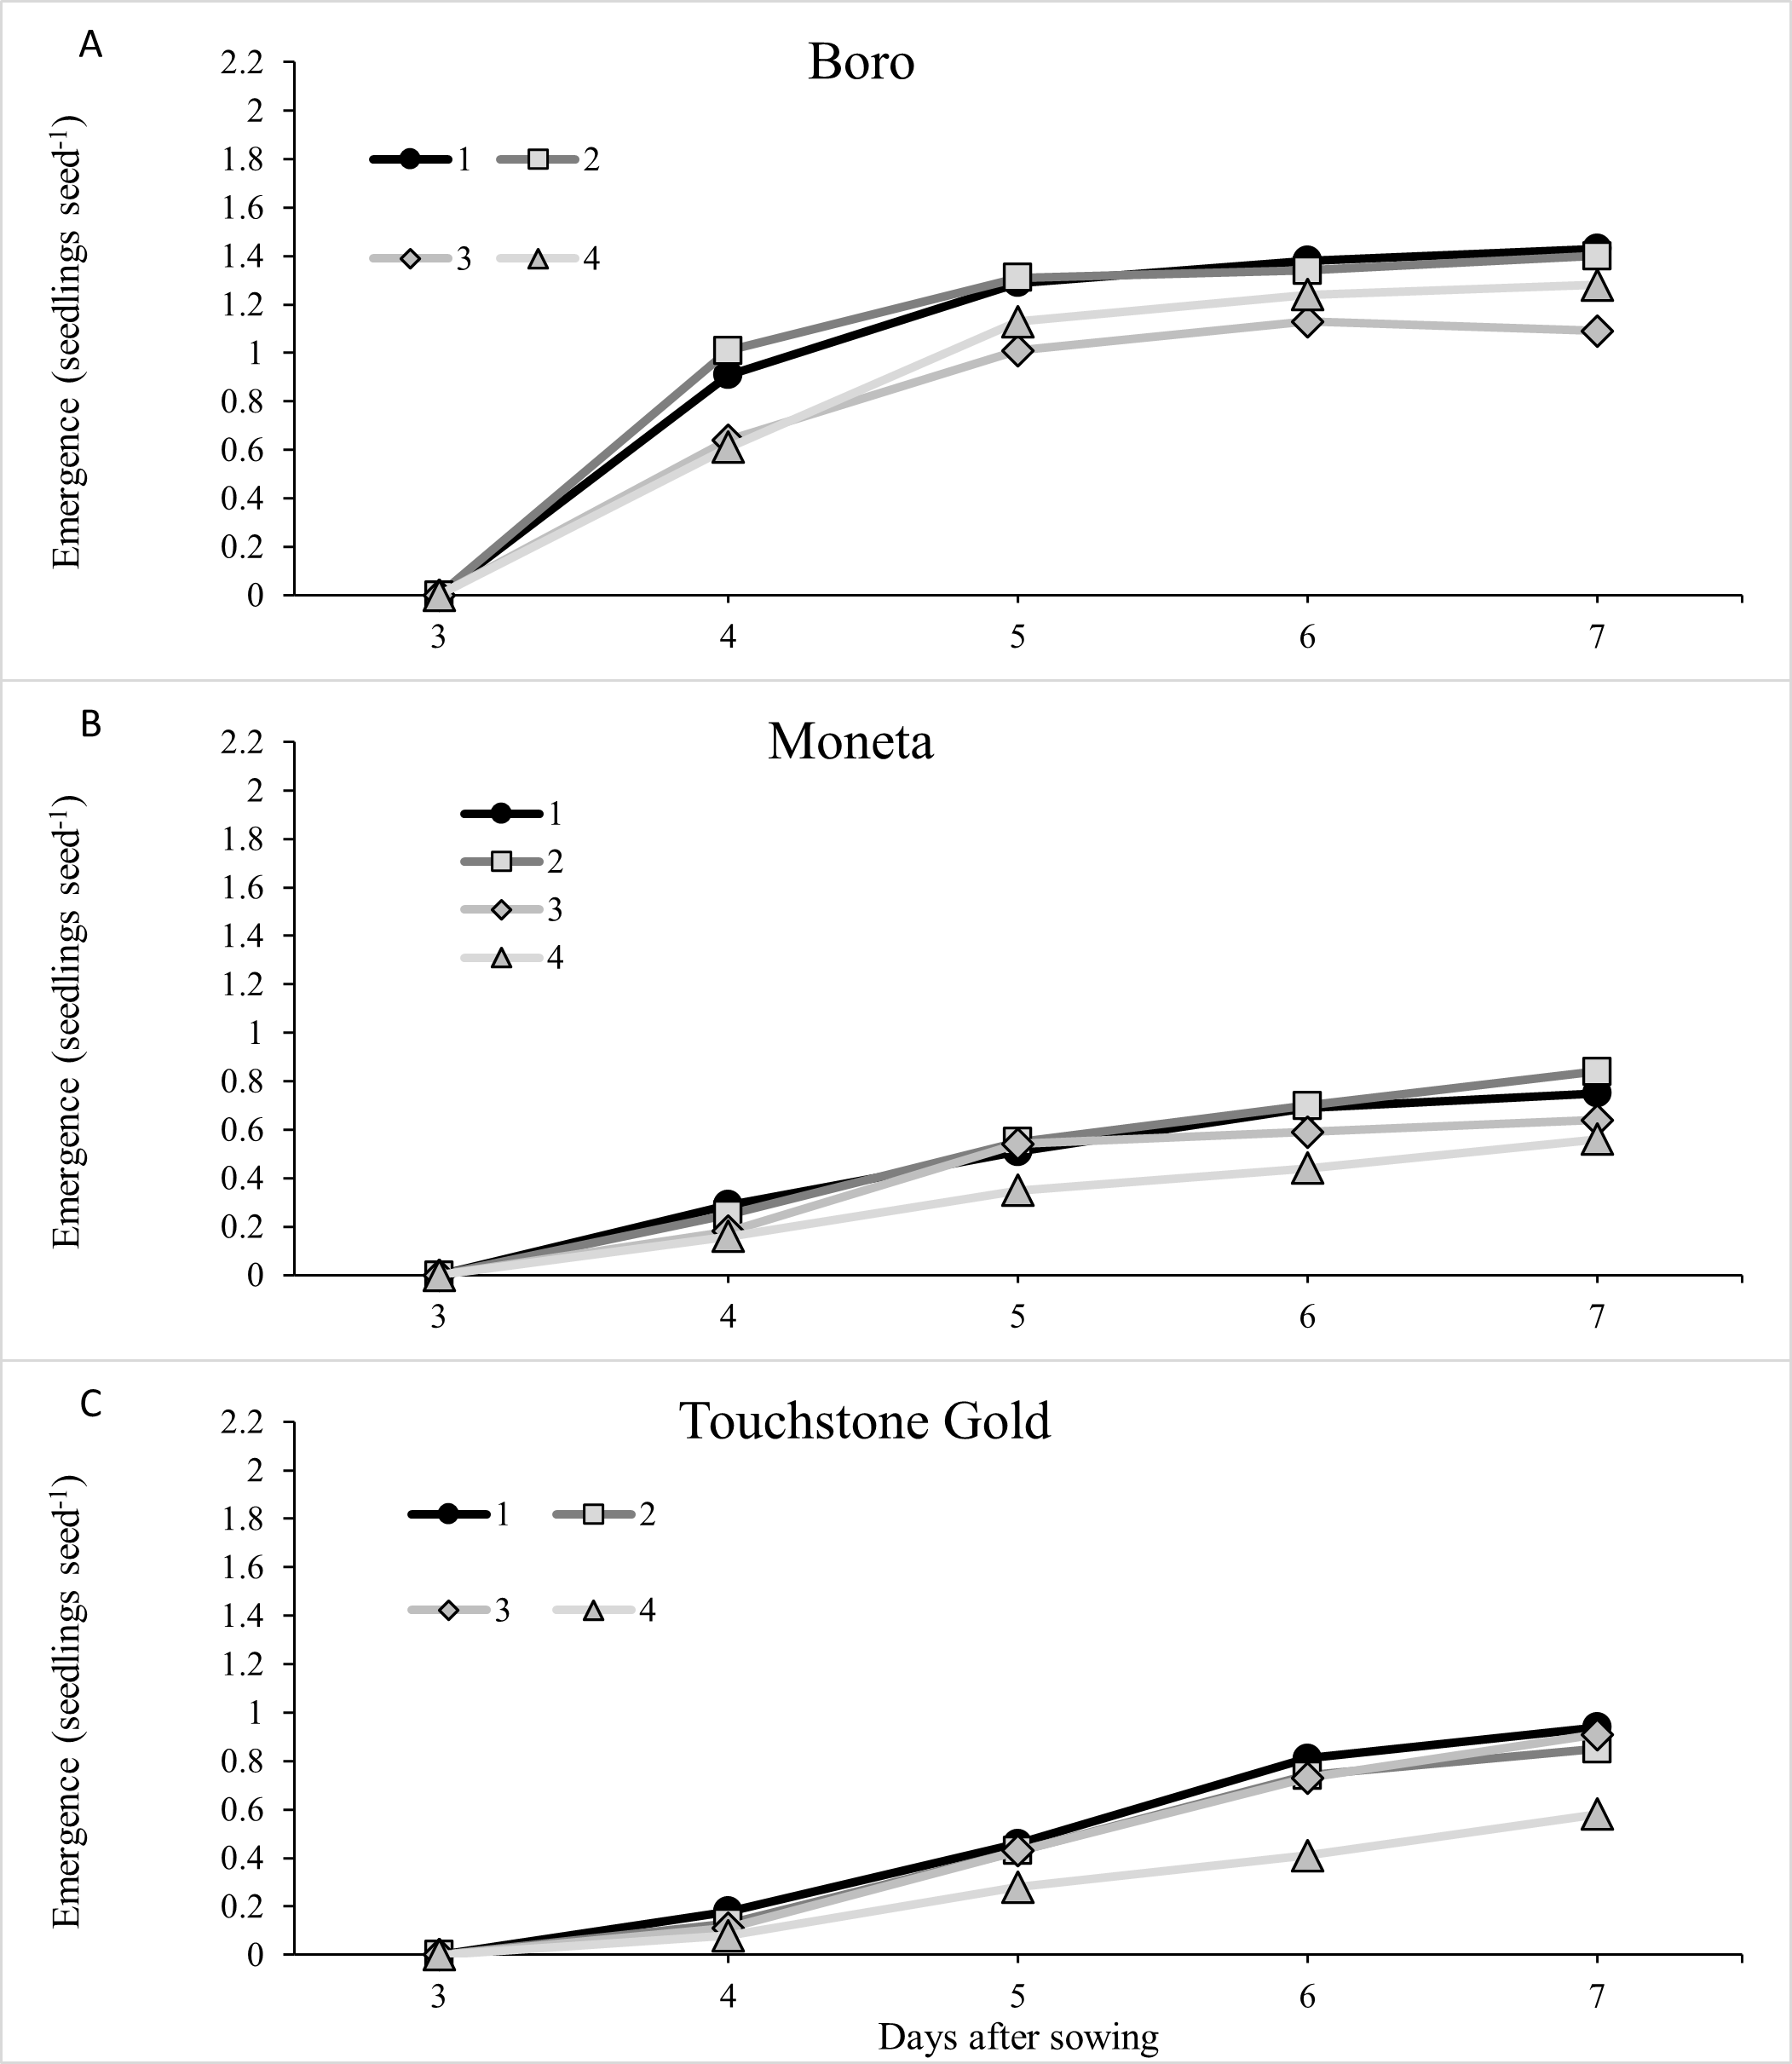
Percent emergence days 4-8. The percentage of final seedlings that had emerged at 4-8 days appears to have been influenced by both cultivar and depth (Figures 2.2 and 2.3). In run 1, B and CG planted at 4 cm appear to have emergence delayed by 1 day, relative to other depths, without a noticeable reduction in yield (Figure 2.2a and 2.2b). TG and M in run 1 seem to have reduced germination at 4 cm depth (Figure 2.2c and 2.2d). In run 2, delay in B and CG emergence based on depth was not noticeable, but TG planted at 4 cm is much lower than other depths at day 7, before catching up with other depths at day 8 (Figure 2.3).
Field trial
Final emergence was influenced by the main effects of cultivar and planting depth, however no interactions between cultivar and depth were detected (Figure 2.4). Beets planted at 4cm had lower final emergence compared to beets planted at 1 and 2cm. B germinated with more seedlings seed-1 than M and TG varieties (Figure 2.4).
Shoot biomass was influenced by the main effect of cultivar, while root biomass and the root-shoot ratio (RSR) were influenced by cultivar and depth main effects (Table 2.5). Both root and shoot biomass were greater for B than M and TG. TG had particularly small roots, with biomass representing only 24% that of B and 42% that of M. Lower root biomass of TG was due to both smaller overall plant growth, and lower partitioning to root tissue relative to shoot tissue (lower RSR).
|
Table 2.5. Mean root and shoot biomass and root/shoot ratio in response to cultivar and planting depth in field trial. Cultivar*depth interactions are sliced by cultivar, so mean separations represent differences in depth within each cultivar. |
||||||||
|
|
|
|
Field |
|||||
|
Treatment |
Root Biomass |
Shoot Biomass |
Root/Shoot Raito |
|||||
|
|
|
|
------g------ |
--%-- |
||||
|
Cultivar Main Effect |
|
|
|
|
|
|
||
|
|
Boro |
1.47 |
a |
8.05 |
a |
0.18 |
a |
|
|
|
Moneta |
0.84 |
b |
5.26 |
b |
0.16 |
a |
|
|
|
Touchstone Gold |
0.35 |
c |
4.39 |
b |
0.08 |
b |
|
|
Depth Main Effect |
|
|
|
|
|
|
||
|
|
1 cm |
0.71 |
b |
5.60 |
|
0.12 |
b |
|
|
|
2 cm |
1.09 |
a |
6.56 |
|
0.15 |
a |
|
|
|
3 cm |
0.86 |
ab |
5.98 |
|
0.14 |
ab |
|
|
|
4 cm |
0.88 |
ab |
5.47 |
|
0.14 |
ab |
|
|
Cultivar*Depth |
|
|
|
|
|
|
||
|
|
Boro |
|
|
|
|
|
|
|
|
|
|
1 cm |
1.08 |
b |
6.83 |
|
0.15 |
b |
|
|
|
2 cm |
2.01 |
a |
9.51 |
|
0.21 |
a |
|
|
|
3 cm |
1.34 |
ab |
8.04 |
|
0.16 |
ab |
|
|
|
4 cm |
1.46 |
ab |
7.84 |
|
0.19 |
ab |
|
|
Moneta |
|
|
|
|
|
|
|
|
|
|
1 cm |
0.67 |
|
4.97 |
|
0.13 |
b |
|
|
|
2 cm |
0.95 |
|
5.27 |
|
0.18 |
a |
|
|
|
3 cm |
0.81 |
|
4.96 |
|
0.16 |
ab |
|
|
|
4 cm |
0.96 |
|
5.83 |
|
0.16 |
ab |
|
|
Touchstone Gold |
|
|
|
|
|
|
|
|
|
|
1 cm |
0.38 |
|
4.99 |
|
0.07 |
|
|
|
|
2 cm |
0.33 |
|
4.89 |
|
0.07 |
|
|
|
|
3 cm |
0.44 |
|
4.94 |
|
0.09 |
|
|
|
|
4 cm |
0.23 |
|
2.74 |
|
0.08 |
|
|
|
|
|
---------------- Significance (P-value) ------------ |
|||||
|
ANOVA |
|
|||||||
|
|
Cultivar |
0.0001 |
0.0001 |
0.0001 |
||||
|
|
Depth |
0.0212 |
0.1885 |
0.0182 |
||||
|
|
Cultivar x Depth |
0.0374 |
0.0644 |
0.0484 |
||||
|
Statistical significance (p = 0.05) is indicated by different letters within the same column. |
||||||||
The effects of planting depth on root biomass and RSR—but not shoot biomass—differed for B and M (Table 2.5). For B, the root biomass and RSR were lower when planted at 1 cm compared to 2 cm. RSR in Moneta was also lower when planted at 1cm compared to 2cm.
Cultivar x tool field cultivation study
At the time of cultivation, beet varieties differed in their height, anchorage force, root biomass and shoot biomass, but not in their RSR (Table 2.6). The root and shoot dry weights and anchorage forces of B and M were greater than those of TG. B also had greater shoot length than CG and TG (Table 2.6). No differences in dry weights, anchorage forces or heights were detected between the CG and TG cultivars, nor between TG and M cultivars.
|
Table 2.6. Mean beet height, anchorage force, root and shoot biomass and root/shoot ratio for each cultivar immediately before in-row cultivation with finger weeders and hilling disks in cultivation field trial. |
||||||||||||
|
|
|
|
|
|
|
|
|
|
|
|
|
|
|
Soil Treatments |
Beet Height |
Anchorage Force |
Root Biomass |
Shoot Biomass |
Root/Shoot Ratio |
|||||||
|
|
|
----cm---- |
----N---- |
----------g---------- |
----%---- |
|||||||
|
Cultivar Main Effect |
|
|
|
|
|
|
|
|
|
|
|
|
|
|
Boro |
9.74 |
a |
3.55 |
a |
0.29 |
a |
1.28 |
a |
0.22 |
|
|
|
|
Chioggia Guardsmark |
8.23 |
bc |
3.08 |
ab |
0.21 |
ab |
0.76 |
ab |
0.28 |
|
|
|
|
Touchstone Gold |
7.97 |
c |
2.44 |
b |
0.16 |
b |
0.86 |
b |
0.23 |
|
|
|
|
Moneta |
9.16 |
ab |
2.91 |
ab |
0.21 |
ab |
0.92 |
ab |
0.19 |
|
|
|
|
----------------------------- Significance (P-value) ---------------------------- |
|||||||||||
|
ANOVA |
|
|
|
|
|
|
|
|
|
|
|
|
|
|
Cultivar |
0.0009 |
0.0175 |
0.0292 |
0.0012 |
0.1018 |
||||||
|
Statistical significance (p = 0.05) is indicated by different letters within the same column. |
||||||||||||
Beet survival following cultivation was influenced by beet cultivar but not by tool type or tool by cultivar interactions (Table 2.7). CG beet survival following cultivation was significantly greater than TG variety, where 17.1% of beets did not survive cultivation (Table 2.7). However, no differences in survival were detected between B, M, and the other cultivars.
|
Table 2.7. Mean beet and weed density following cultivation and surrogate weed biomass at harvest in response to cultivar and tool used. Interaction between cultivar and tool was not significant. |
|
|||||||||||
|
|
|
|
|
Change in Weed Density |
|
|
|
|
||||
|
Factors |
Beet Survival |
Mustard |
Carpetweed |
Final Mustard Biomass |
Yield Loss |
|
||||||
|
|
|
-----------------%-------------------- |
----g m-2--- |
---%--- |
|
|||||||
|
Cultivar Main Effect |
|
|
|
|
|
|
|
|
|
|
||
|
|
Boro |
93.73 |
ab |
54.24 |
|
38.89 |
|
48.88 |
a |
-0.07 |
|
|
|
|
Chioggia Guardsmark |
98.18 |
a |
105.95 |
|
66.67 |
|
155.76 |
b |
0.00 |
|
|
|
|
Moneta |
94.18 |
ab |
68.05 |
|
43.85 |
|
141.12 |
b |
-0.14 |
|
|
|
|
Touchstone Gold |
82.90 |
b |
76.64 |
|
37.32 |
|
133.40 |
b |
-0.68 |
|
|
|
Tool Main Effect |
|
|
|
|
|
|
|
|
|
|
||
|
|
Finger |
90.96 |
|
35.31 |
b |
54.42 |
|
79.24 |
a |
-0.23 |
|
|
|
|
Hilling Disk |
93.54 |
|
117.13 |
a |
39.17 |
|
170.24 |
b |
-0.21 |
|
|
|
|
|
-------------------------- Significance (P-value) ---------------------------------- |
|
|||||||||
|
ANOVA |
|
|
|
|
|
|
|
|
|
|
||
|
|
Cultivar |
0.0249 |
0.3398 |
0.4249 |
0.0046 |
0.0670 |
|
|||||
|
|
Tool |
0.5858 |
0.0001 |
0.3815 |
0.0001 |
0.9044 |
|
|||||
|
|
Cultivar*Tool |
0.8081 |
0.8442 |
0.5412 |
0.8613 |
0.5228 |
|
|||||
|
Statistical significance (p = 0.05) is indicated by different letters within the same column. |
|
|||||||||||
|
a Percent change in weed population density following cultivation |
|
|||||||||||
|
b BRAJU = condiment mustard (Brassica juncea) |
|
|||||||||||
|
c MOLVE = carpetweed (Mollugo verticillata) |
|
|||||||||||
Cultivation efficacy on the surrogate mustard weed was greater for finger weeders than hilling disks (Table 2.7). Compared to density prior to cultivation, mustard density three days after cultivation was 65% lower following finger weeding, but 17% greater following hilling compared to pre-cultivation density, suggesting some mustard seeds did not germinate until after cultivation (Table 2.7). However, carpetweed control was not influenced by tool, and neither weed species’ survival was influenced by beet cultivar.
The biomass of surrogate mustard weeds was affected by both cultivar and tool, but not their interaction (Table 2.8). Mustard biomass was the lowest in B plots, while weed dry weights from CG, M, and TG plots were not different (Table 2.7). Final mustard biomass was lower in plots that had been cultivated with the finger weeder compared to the hilling disks (Table 2.7). However, yield loss due to surrogate mustard was affected neither by beet cultivar nor cultivation tool (Table 2.7).
Yield was affected by cultivar but not by tool or tool x cultivar interaction (Table 2.8). B was the highest yielding variety among the four cultivars tested, both in marketable and total beet yield (Table 2.8). CG and M had significantly higher yield than TG, which was the lowest yielding cultivar (Table 2.8).
|
Table 2.8. Mean marketable and total yield weights, counts, and sizes of beets at harvest in response to cultivar and tool. Total yield, counts, and average diameter includes all marketable and unmarketable beets. |
||||||||||||||||||||
|
|
|
|
|
|
|
|
|
|
|
|
|
|
|
|
|
|
|
|
|
|
|
|
|
Yield |
|
Final Root Number |
|
Diameter |
||||||||||||||
|
Factors |
Total |
Marketable |
% Mkt |
|
Total |
|
Marketable |
|
Total Avg |
Mkt Avg Diameter |
|
|||||||||
|
|
|
-----g m-1---- |
--%-- |
-----# m-1---- |
-----cm ---- |
|||||||||||||||
|
Cultivar Main Effect |
|
|
|
|
|
|
|
|
|
|
|
|
|
|
|
|
|
|
||
|
|
Boro |
804 |
a |
778 |
a |
96.7 |
|
|
14.7 |
a |
|
12.0 |
a |
|
4.4 |
|
4.8 |
|
|
|
|
|
Chioggia Guardsmark |
497 |
b |
480 |
b |
96.6 |
|
|
9.6 |
b |
|
7.9 |
b |
|
4.3 |
|
4.8 |
|
|
|
|
|
Moneta |
484 |
b |
467 |
b |
96.2 |
|
|
9.8 |
b |
|
7.9 |
b |
|
4.1 |
|
4.6 |
|
|
|
|
|
Touchstone Gold |
280 |
c |
266 |
c |
94.5 |
|
|
6.6 |
c |
|
5.2 |
c |
|
3.9 |
|
4.3 |
|
|
|
|
Tool Main Effect |
|
|
|
|
|
|
|
|
|
|
|
|
|
|
|
|
|
|
||
|
|
Finger |
502 |
|
483 |
|
95.6 |
|
|
10.0 |
|
|
8.1 |
|
|
4.1 |
|
4.5 |
|
|
|
|
|
Hilling Disk |
531 |
|
512 |
|
96.4 |
|
|
10.3 |
|
|
8.4 |
|
|
4.2 |
|
4.6 |
|
|
|
|
|
|
|||||||||||||||||||
|
ANOVA |
-----------------------Significance (P-value)----------------------- |
|||||||||||||||||||
|
|
Cultivar |
0.0001 |
0.0001 |
0.4355 |
|
0.0001 |
|
0.0001 |
|
0.7760 |
0.0778 |
|
||||||||
|
|
Tool |
0.3332 |
0.3422 |
0.4534 |
|
0.6306 |
|
0.5565 |
|
0.0545 |
0.4634 |
|
||||||||
|
|
Cultivar*Tool |
0.2484 |
0.2414 |
0.5336 |
|
0.5746 |
|
0.7957 |
|
0.1508 |
0.4711 |
|
||||||||
|
Statistical significance (p = 0.05) is indicated by different letters within the same column. |
||||||||||||||||||||
As hypothesized, we found that planting beets deeper than the typical recommended 2cm depth may delay germination by a day or two, allowing for more flexibility in implementing a stale seedbed. However, this result was not consistent across cultivars or trials (Figure 2.2, 2.3, and 2.4). Under field conditions, deep planting of beets did not obviously delay emergence, and final emergence was reduced at depths greater than 3 cm (Table 2.4). For polyembryonic beet cultivars, a slight reduction in stand may reduce the need for thinning of beets but greater stand losses could be costly for growers. Our results are similar to those obtained by Romaneckas et al. (2009), who also found that deep planting delayed sugar beet emergence in the greenhouse, but reduced emergence under field conditions. Such discrepancies between greenhouse and field studies likely reflect more uniform and optimal growing conditions in the greenhouse. For example, differences by depth in soil moisture, temperature or soil resistance are much more common in the field, and undoubtedly influence relationships between seed depth and seedling emergence in some cases. Tradeoffs associated with different planting depths must be considered based on specific field conditions. Our results suggest that although planting beets deeper may not be practical in all soil conditions, it has the potential to give growers more flexibility in implementing a pre-emergent stale seedbed.
A second central hypothesis of our study was that cultivars differ in their tolerance to in-row cultivation, and that this difference might be exploited to improve tool selectivity and lower weed management costs. Our results were consistent with this hypothesis (Table 2.7), although the magnitude of differences in cultivar tolerance were relatively small. Our primary finding was that TG tolerance to both finger weeding and hilling was lower than that of the CG variety. Poor relative tolerance of TG to cultivation is not surprising given that it was consistently among the cultivars with the shortest height and lowest anchorage force (Table 2.6). The CG cultivar appears to both establish more slowly, and partition fewer resources to early root development than other beet cultivars (Table 2.5), and hence—other things equal—is not a good choice for improving weed management in beets.
We anticipated that such differences in beet cultivar partitioning to root vs shoot tissue might confer preferential tolerance to tools that killed weeds either by uprooting (fingers) versus burial (hilling disk). However, we were unable to identify specific plant traits related to cultivation tolerance because beet mortality was too low and beet characteristics too similar. B was our most vigorous cultivar, with the greatest root and shoot biomass, and anchorage force. However, B survival was not different than CG and M cultivars. Nor did we detect any differences in beet tolerance based on tools differing in their mode of action.
We were surprised to find that our estimate of mustard “survival” following cultivation with the hilling disk was greater than 100% (Table 2.7). The tool hilled soil nicely in the crop row, covering mustard and ambient weed seedlings but not beets. However, buried mustards were able to recover, and some mustard seeds that had been on the soil surface prior to cultivation may have been induced to germinate by hilling, resulting in greater post-cultivation counts.
Our study also provided insight into the relative competitive ability of beet cultivars with weeds. In particular, surrogate mustard biomass was lowest in plots with the B cultivar (Table 2.7). This apparent weed-suppressive ability of the B cultivar was presumably due to the fact that it was among the cultivars with the highest shoot biomass and height (Table 2.6), traits shown in studies in other crops to improve weed competitive ability through shading (Colquhoun et al. 2009; Garrity et al. 1992). Though B survival following cultivation was not different than other cultivars, its weed competitive ability makes it a good cultivar choice for suppressing weeds.
Cultivar choice may be an important consideration for growers managing weeds through physical and cultural approaches. Differences in both cultivation tolerance and weed competitiveness among cultivars of the same species can be important factors in determining weed management success in certain crops (Colquhoun et al. 2009; Garrity et al. 1992; Wick et al. 1986). However, within the conditions of our study, cultivation tolerance appears to have been less important than weed competitive ability in determining agronomic success. It can be difficult to draw broad conclusions from weed competition in one study because weed impact is dependent on weed populations, crop conditions, soil type, and a host of other factors. Nevertheless, future research should consider both cultivation tolerance and weed competitive ability as potentially important characteristics for reducing weed management costs in vegetable crops including table beets. Identification of specific traits associated with these characteristics may be also be helpful for plant breeders wishing to select useful cultivars for improving weed management However, our results suggest that straightforward selection criteria to improve weed management success are unclear. For example, given the greater efficacy of uprooting (finger weeding) relative to burial (hilling disk) in controlling weeds in our study, selection of cultivars which partition more early season resources to roots relative to shoots might be desirable; however, partitioning resources to roots at the expense of shoots might reduce the capacity of that cultivar to suppress weeds through shading. Early season partitioning to shoots may be a desirable trait for weed competitiveness, along with improved cultivation tolerance to burial with hilling disk. Beet breeders could also select for cultivars with delayed emergence from shallow planting to facilitate a longer stale seedbed window, further improving weed competitiveness of a shoot-partitioning cultivar.
Educational & Outreach Activities
Participation summary:
Due to the COVID-19 pandemic in 2020, research outreach was limited. Research outcomes were presented at the Great Lakes Fruit and Vegetable Expo in December 2020, the Weed Science Society Association Meeting in February 2021, and at Daniel Priddy’s public thesis defense in April 2021. We published an article in Veg Growers News in May 2021 about beet planting based on experiences gained from this study. Additionally, the Gallandt lab at University of Maine and the Brainard lab at Michigan State have collaborated to create the Physical Weed Control Forum (https://forum.physicalweedcontrol.org/), which exists as a space for farmers, researchers, and manufacturers to collaborate and share experiences with physcial weed control strategies. The research findings associated with the SARE project have been shared through this forum.
Looking forward, we are planning to publish our research findings in the journal Weed Science with a targeted submission in the Winter of 2021. Further grower outreach and demonstrations will be held during Summer and Fall of 2021, including presentations to beginning farmers at MSU Student Organic Farm (Organic Certificate Program) and MSU North Farm Field Day.
Project Outcomes
Our research into effects of soil topography the efficacy of mechanical weed cultivation provides growers with more perspective when making early season management decisions regarding soil preparation. We were surprised to discover that rolling soils flat did not improve cultivation efficacy, but instead lead to reduced efficacy, contrary to conventional wisdom. Growers who incorporate this practice are not only needlessly wasting time and resources preparing a level seedbed, but may also be negatively impacting their weed control outcome later in the season.
Further, our research highlights the need for careful characterization of soil conditions in mechanical cultivation research. Rolling seedbeds flat prior to planting made soils more level, but it also increased soil hardness, which wasn’t an intended effect. We only discovered this through characterization of soil conditions at the time of cultivation.
Over the course of this research project, I developed a greater understanding of the challenges and opportunities for growers to incorporate mechanical weed control technology in their weed control regiment. These tools represent an opportunity for organic weed control to scale up and can even be of use for conventional growers in diversifying their weed control strategy. But mechanical cultivation is also challenging. Effective cultivation requires careful planning, preparation, calibration, and luck. I’ve learned that these tools are of most use when incorporated within a long term, ecological weed control program which incorporates weed seedbank reduction, stale seed bedding, reduced tillage, and other weed control strategies.