Final report for GNC19-285
Project Information
Impact of management practices on soil health in organic grain systems
Assessing and managing organic agricultural systems for biological soil health is essential to sustaining these systems as their fertility relies on the microbial processing of organic amendments, such as manure and compost. In Wisconsin, organic field crop production represents over 50% of all organic production acres (USDA-NASS, 2017). Identifying the most influential soil properties and management practices for biological soil health in these systems is critical to the development of soil health assessments and best management practice (BMP) recommendations. Overall, improvements in these areas would optimally inform farm decision making for better soil health.
To determine the key factors affecting soil carbon (C) and nitrogen (N) pools as well as biological soil health, publicly accessible soil property information from the United States Department of Agriculture – Natural Resources Conservation Service (NRCS) along with farmer-obtained management histories for 124 fields from 16 certified organic grain farms in the Driftless Area of Wisconsin were analyzed for significant effects. The main pools of C and N were measured via soil organic matter (SOM), total organic C (TOC), and total N (TN), while biological soil health was measured via permanganate oxidizable C (POXC), mineralizable C (minC), potentially mineralizable N (PMN), and autoclaved-citrate extractable protein (ACE).
Results indicate that publicly accessible NRCS soil information is useful for benchmarking soil health at the regional level. In particular, soil taxonomy, soil moisture, the fragile soil index, susceptibility to soil surface sealing, and susceptibility to SOM depletion should be considered as potential co-variates in soil health assessments. Disparate responses of biological soil health indicators to management practices suggest that multiple shifts in management may be required to support both healthy C and N cycling in agricultural systems. The outcomes of this study have and will continue to be disseminated to our participating farmers, other farmers, and stakeholders through farm-specific reports, conferences, field days, Extension events, and at least one peer-reviewed publication. From these sources, farmers will gain knowledge of currently recommended measurements for biological soil health and first indications of BMPs to consider in their operation's goals.
The expected learning outcomes for this research are as follows: 1) researchers will learn which management practices and inherent soil properties contribute the most to biological aspects of soil health on organic grain farms; 2) researchers will learn whether the duration cropland has been in certified organic management has an effect on biological aspects of soil health; 3) farmers will have increased knowledge of the current measurements for the biological component of soil health and best management practices for improving this component of their soil’s health. The expected action outcomes are that: 1) farmers will incorporate identified best management practices for soil health in their operations; 2) farmers that incorporate such practices will improve biological aspects of soil health, which may result in long-term crop productivity and ecosystem services.
Cooperators
- (Researcher)
- (Researcher)
Research
Field Descriptions and Soil Sampling
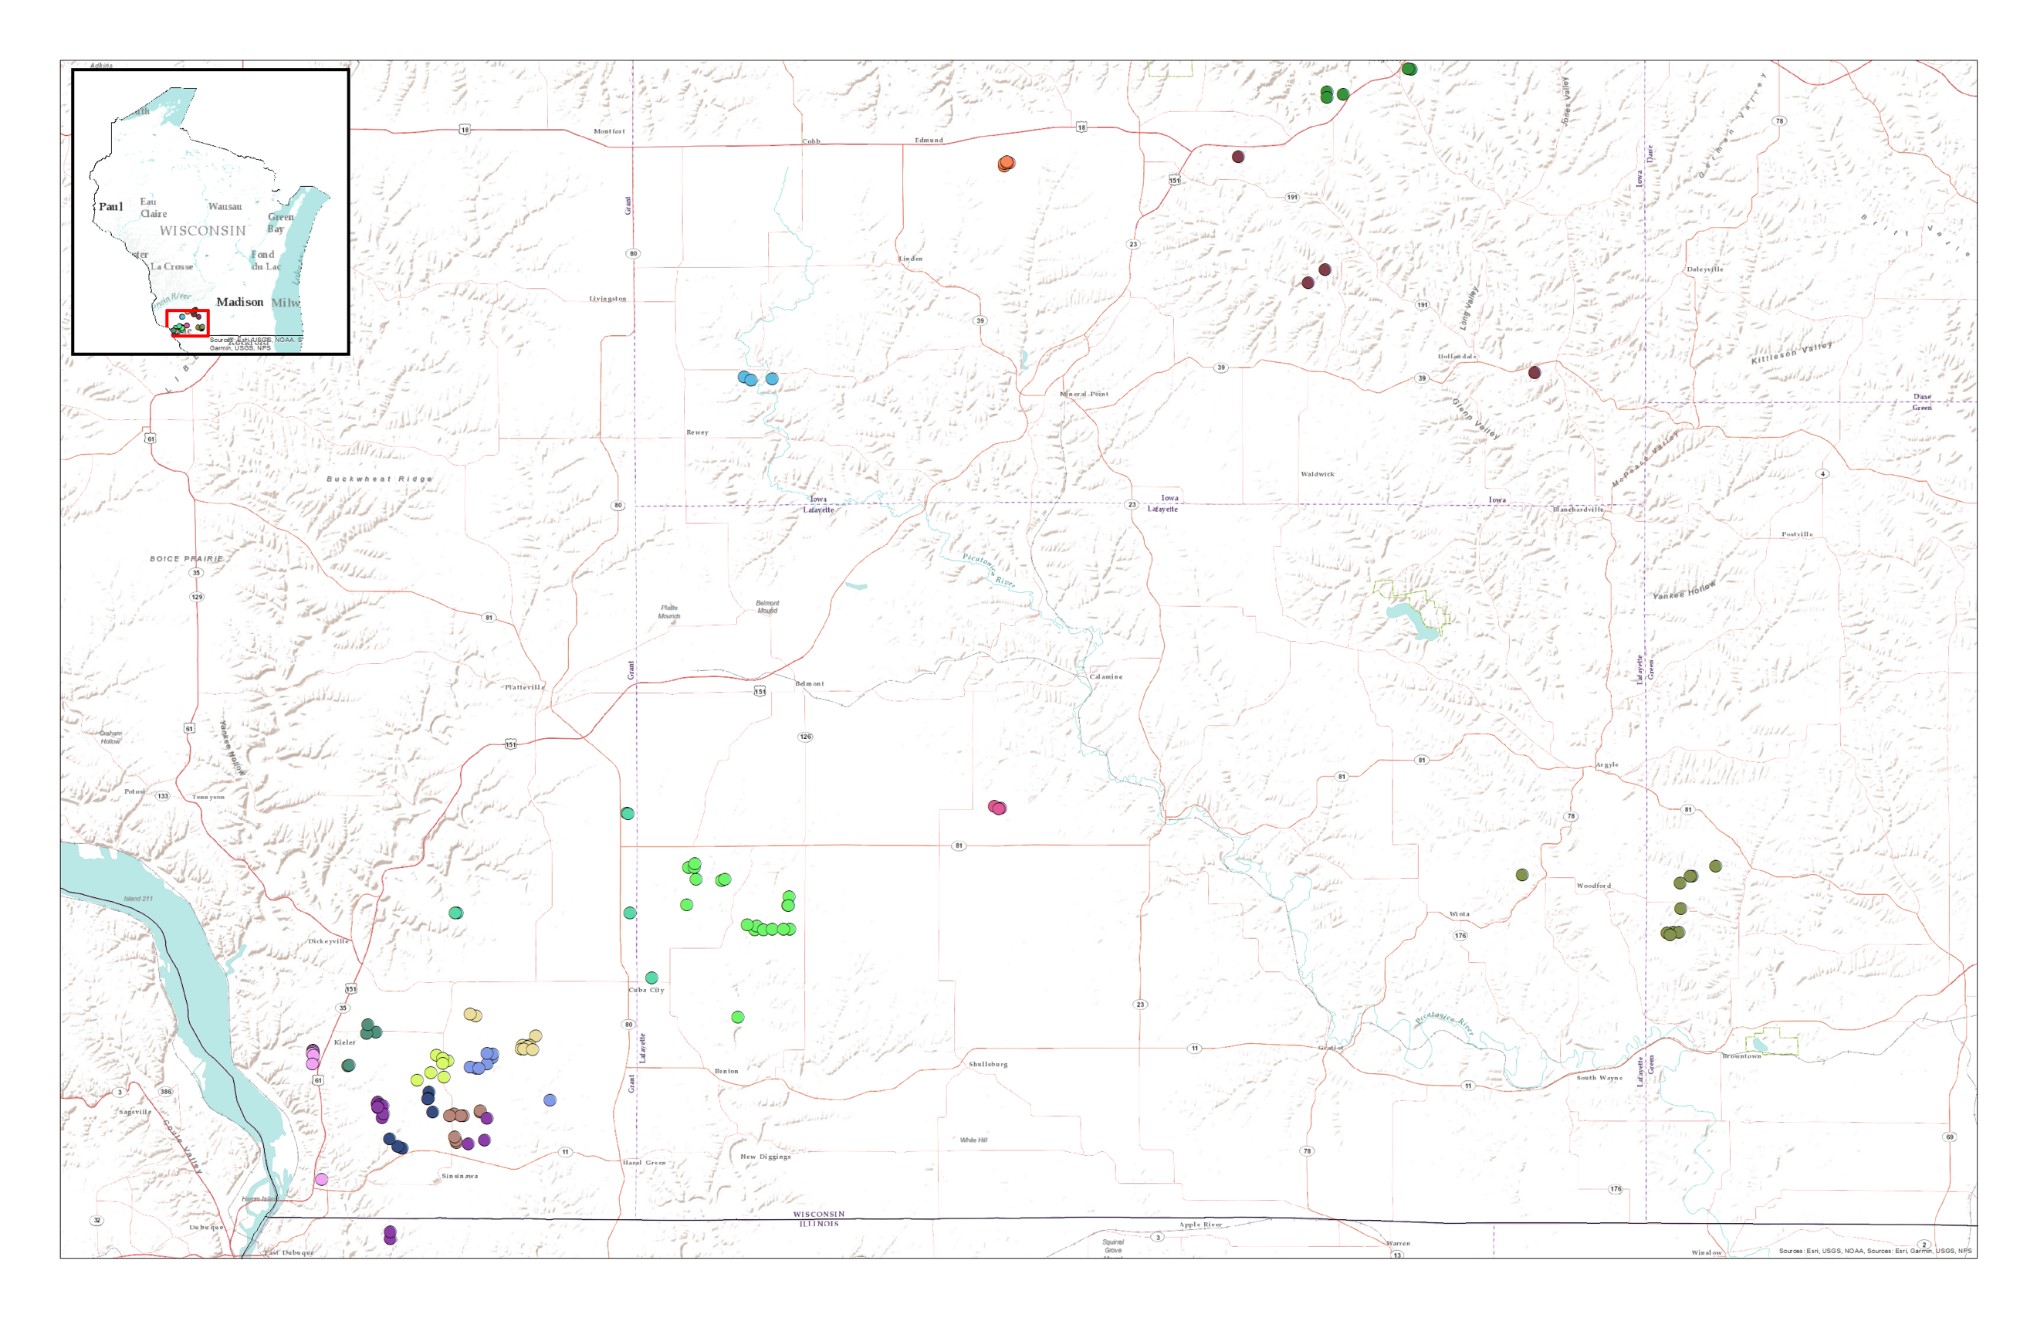
Soil samples were collected from 124 fields of 16 certified organic grain farms in the southwest Driftless Region of Wisconsin (Figure 1). Farms were selected from a list of Wisconsin farms that are members of the organic cooperative Organic Valley based on the following criteria: 1) grain production was a major part of their farm operations, 2) farms were based in the Driftless Region of Wisconsin, and 3) willingness to participate in this research. Locations were limited to the Driftless Region because of the high density of organic grain farms in that region and to minimize the variation in inherent soil properties and climate. Fields were located in the Wisconsin counties of Grant (n = 73), Lafayette (n = 23), Iowa (n = 17), and Green (n = 9), and the Illinois county of Jo Daviess (n = 2).
Soil samples were collected between 18 May to 2 July in 2018 (n = 59) and 22 April to 13 May in 2019 (n = 65), prior to planting of the next crop. Soil samples were solely collected in fields where the previous year’s crop was corn. For each field, ten soil cores were obtained in a circular array with a radius of approximately 2 meters. GPS coordinates noted the center of the sampling circle. The soil cores were taken from a depth of 0 to 15 cm by a probe with an internal diameter of 2.0 cm, and then were composited and well-mixed. Upon immediate return from field locations, composited samples were air-dried using a force-air drier at 32 °C for 3 days, then ground to pass through a 1-mm sieve and stored at room temperature until analysis.
Soil Analysis
According to procedures set and standardized by the North Central Regional Extension & Research Activity (2015), air-dried soils were analyzed for soil pH, reserve acidity, and soil organic matter (SOM). Soil pH was measured using a 1:1 ratio of soil to deionized water. For soils with a pH ≤ to 6.5, reserve acidity was measured using Sikora buffer (Sikora, 2006). Soil was heated for 2 hours at 360 °C and the mass lost on ignition was used to calculate SOM content.
Soil total carbon (C) and nitrogen (N) content were obtained through dry combustion of 8–10 mg of soil in a tin capsule, where the soil was previously ground to a flour-like consistency. Total C and N were measured with the Flash EA 1112CN Automatic Elemental Analyzer (Thermo Finnigan, Milan, Italy). Presence of soil inorganic C was determined visually from effervescence using 5% HCl. Soils without inorganic C were assumed to have total organic carbon (TOC) values equivalent to measured total C values. For soils testing positive for inorganic C, TOC was obtained using HCl fumigation to remove inorganic C prior to dry combustion (Harris et al. 2001).
For both C and N cycling, a chemical extraction and incubation method were utilized as indicators for important soil processes of each element. Permanganate oxidizable C (POXC) was determined through chemical oxidation of soil organic C with 0.02 M KMnO4 according to the procedures of Culman et al. (2012), a modification of Weil et al. (2003); it represents the fraction of C most-readily available to soil microorganisms. Mineralizable C (minC) represents general microbial activity and was measured as the amount of CO2 produced through soil respiration over a 24-hour incubation at 25 °C and 60% water-filled pore space (Franzluebbers et al., 2000; Haney et al., 2004). Potentially mineralizable N (PMN) was measured as the amount of ammonium produced during a 7-day, 40 °C anaerobic incubation (Drinkwater et al., 1996); it indicates the relative activity of microbial conversion of organic N to plant-available N. Autoclaved-citrate extractable protein (ACE) was quantified using the bicinchoninic acid assay on the supernatant of soil extracted in 0.02 M sodium citrate pH 7 solution while autoclaved at 121 °C for 30 minutes (Hurisso et al., 2018b); it is a measure of soil protein, which represents bioavailable N.
Dataset Construction
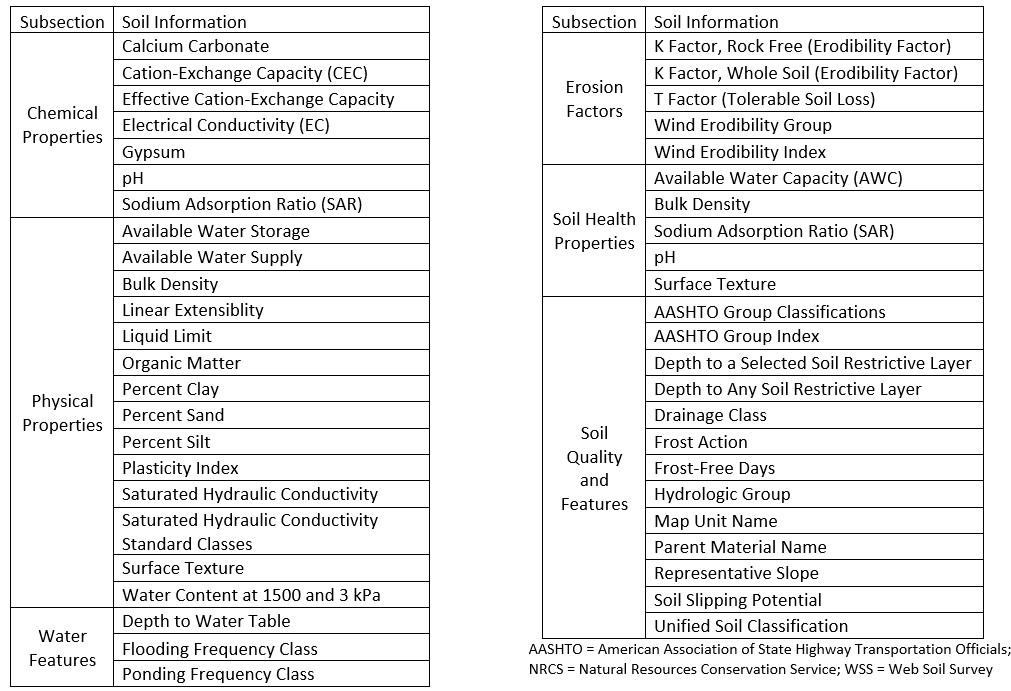
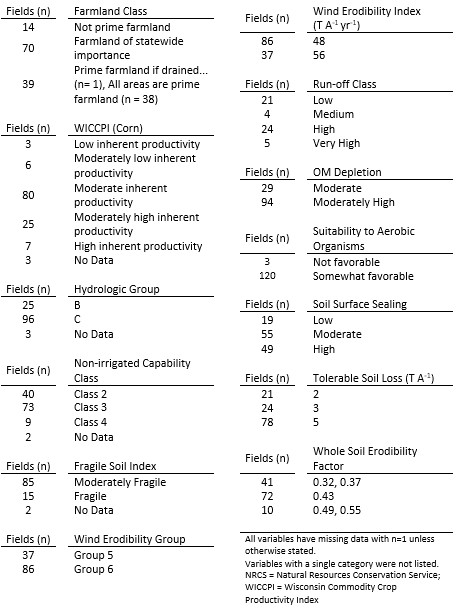
Publicly available soil properties and indices data for each field was obtained and aggregated from the NRCS Soil Survey Geographic Database (SSURGO) via the Web Soil Survey (WSS) (Soil Survey Staff, n.d.). The soil map was used to determine the soil series and its map unit code for each sampling location based on georeferenced coordinates of samples. Using the map unit code in WSS's Soil Data Explorer, soil properties and qualities as well as soil suitabilities and limitations data was collected with cropland as a land use filter to avoid incorporating data for other land uses. Depth of A horizon and landform position information were added to the dataset from the map unit description for each soil series. Tables 1 and 2 are a truncated list of the data collected including only Soil Data Explorer subsections pertinent to crop production, soil health, soil classification, and inherent soil properties.
Table 1. Soil information from the suitabilities and limitations, and map unit description sections of the NRCS WSS.
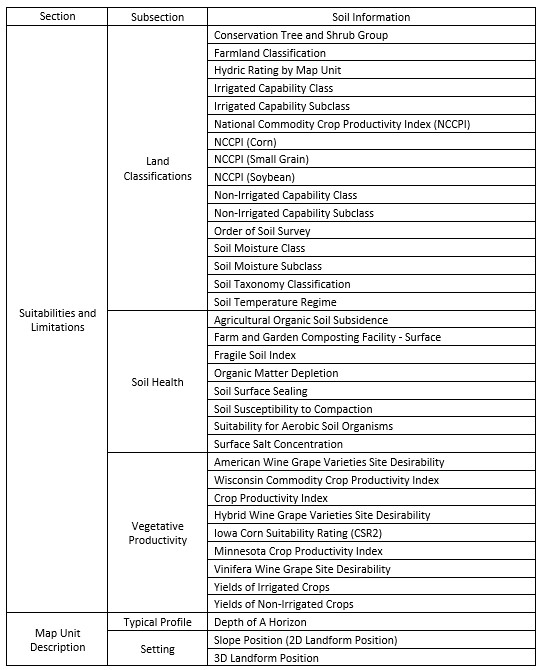
NRCS = Natural Resources Conservation Service; WSS = Web Soil Survey
Table 2. Soil information from the soil properties and qualities section of the NRCS WSS.
From this list, soil properties and indices were selected for analysis based on the following criteria: 1) they are related to grain and forage systems, 2) they are developed for Wisconsin or apply to this region, and 3) they do not capture information for climate and/or engineering purposes as these are not relevant to the localized area and land use considerations. The remaining soil properties and indices were aggregated to construct a dataset to evaluate the relationships between NRCS soil information and soil heath indicators (Tables 3 - 5). Categories containing less than three field observations within a categorical variable were excluded from analysis because meaningful standard deviations cannot be computed for n < 3. NRCS variables that were computed by applying a factor to another NRCS variable were excluded since they would supply redundant information and exhibit high collinearity.
Table 3. Univariate statistics for NRCS continuous variables.
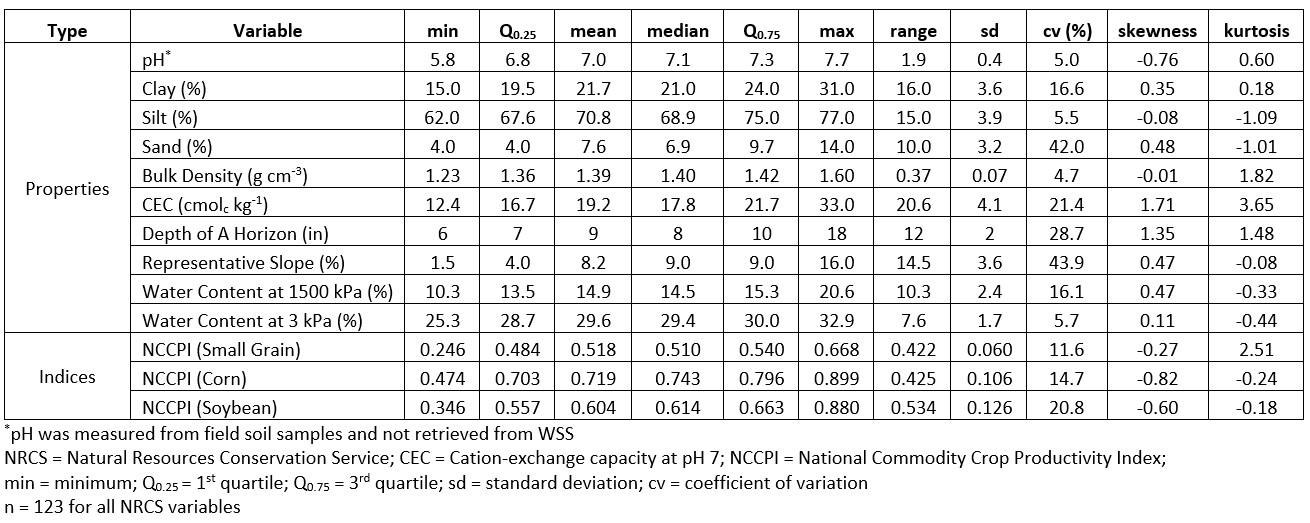
Table 4. NRCS soil property categorical variables and their distribution.

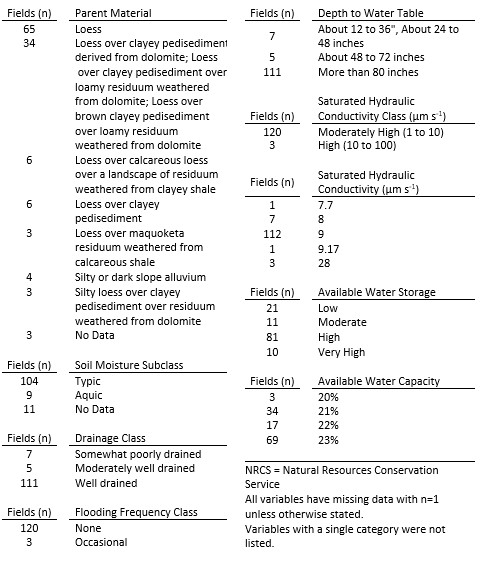
Table 5. NRCS categorical indices and their distribution.
Detailed histories of the previous five years of management regarding cropping sequence, cover cropping, and tillage and fertility management as well as long-term organic management history information were obtained directly from correspondence with each farmer. In particular, the following management information for the past five years was obtained: the order, timing, and plant species used in the cropping sequence; the frequency, timing, and plant species used in cover cropping; the tillage implements used, the number of passes with each, and when they were used; and the application method, frequency, timing, source (i.e. animal), and physical state of manure and other applied amendments. The following information regarding the long-term organic history of each field was obtained: first transition year, first organic certification year, duration under organic management (years), and land use prior to organic transition.
To exclude NRCS and management variables from analysis that did not provide sufficient information due to lack of or excess variation, variables were removed from the dataset if the following criteria were met: 1) <80% of fields had a value reported, 2) >90% of fields belong to a single category, and/or 3) categorical variables contained greater than ten categories that were highly unbalanced.
Statistical Analysis
Descriptive statistics were used to explore the distribution of NRCS soil properties, farm management, and response variables (SOM, TOC, TN, POXC, minC, PMN, and ACE) included in the dataset. The describe function from the Psych package in R was used to perform univariate statistics, such as mean, median, skewness, etc., on continuous variables. Farm management and NRCS soil property effects on soil health indicators were assessed in R using analysis of variance (ANOVA) with a Fisher’s least significant difference (LSD) test for categorical explanatory variables and simple linear regression for continuous explanatory variables (α= 0.05). Simple linear regression assumptions of linearity, constant variance, and normality were evaluated using residuals versus fitted values plots and Q-Q plots.
Regression tree analysis of the dataset was used to evaluate the relative importance of NRCS soil properties and farm management practices on soil health indicator values. Prior to regression tree analysis, contingency tables were used to evaluate collinearity between categorical variables while collinearity between continuous variables were evaluated with simple linear regression. If perfect collinearity was identified between variables, the variable providing the most reliable highest resolution information was selected for inclusion in the regression tree model.
For each soil health indicator, trees were manually generated 20-times under the following node termination criteria using rpart: 1) nodes must contain >10% of observations for a split to be attempted, 2) for a split to be included it must decrease the complexity parameter (cp) by a minimum of 0.0001, and 3) the maximum branching depth of the tree is eight. Each manual generation of a tree was cross-validated with ten equally sized subsets of the original dataset. The cp for the branch depth that minimized the cross-validation error was recorded for each of the twenty manually generated trees. To avoid overfitting the data, a single regression tree was formed for each soil health indicator by pruning the original tree to the branch depth that most frequently (n =20) yielded the lowest cross-validation error. Primary and surrogate splits, and variable importance for pruned trees were obtained with summary. Variable importance is calculated as “the sum of the goodness of split measures for each split for which it was the primary variables, plus goodness × (adjusted agreement) for all splits in which it was a surrogate” (Therneau & Atkinson, 2019).
Effects of NRCS Soil Properties and Indices
Soil Taxonomy
Classification of soils in the U.S. is performed according to the principles outlined in NRCS’ Soil Taxonomy, which categorizes soils primarily by their composition, structure, and chemical and physical properties. Since the criteria used in classification affects many soil functions, biological soil health is likely to differ between more disparate soil classifications. Three soil orders (Alfisols, Entisols, and Mollisols) were represented in our dataset (Table 4). Fields with higher SOM and TOC occurred in Mollisols and soils containing Mollic epipedons (Figure 2 and 3). An inherent aspect of Mollisols and Mollic epipedons is a deep, SOM-rich surface horizon primarily formed from long-term accumulation under historical grassland cover (Brady and Weil, 2010). In addition, fields that were Mollisols and Udolls had higher TN (Figure 4). The influence of soil classification on TN may be less important as TN was differentiated at a coarser resolution than SOM and TOC. Suborder was the finest resolution that was able to differentiate TN compared to subgroup for SOM and TOC. Soil order and suborder have identical distributions due to perfect collinearity in the dataset. Thus, the resolution for TN may be even coarser.
The higher baseline values of soil health in Mollisols highlight that soil taxonomy is an important consideration in soil health evaluation and the setting of benchmarks. However, none of the biological indicators of soil health were differentiated by soil taxonomy. Although there were not differences at this regional scale, a greater representation of soil taxonomic classes may be necessary for assessing biological soil health on a national scale. The NRCS and the USDA-Agricultural Research Service are cooperating on a meta-analysis spanning 38 states to evaluate the effect of 57 different soil series, 68 great groups, 28 suborders, and 9 different soil orders on SMAF soil health indicators and their response to management (Karlen et al., 2019).
Parent Material
Although parent material had an effect on SOM, TOC, and TN, its effect was difficult to interpret with the limited differentiation between parent materials (Figure 2 to 4). The surface layer of fields were primarily windblown-deposited materials such as silt and loess (Table 4). Only four out of 124 fields had surface alluvial deposits. The primary differences between parent materials were in the subsurface layers and many categories had 6 or fewer observations. Narrowing the focus to the Driftless Region may have limited the capacity to accurately identify minute differences in parent materials. At a larger regional or national scale, parent material may have clearer effects on soil health as parent materials might diverge further in composition. Effects of parent material on microbial parameters have been found in natural and forested systems, but most effects are explained by soil properties, such as clay content and pH, resulting from soil development under different parent materials (Yarwood et al., 2014; Alfaro et al., 2017; Angst et al., 2018). It is unclear if parent material would be a useful component to soil health assessment or if it could be easily reflected by other properties.
Slope Position
Representative slope percentage did not affect soil health values, but primarily summit and primarily back slope positions had higher SOM than other hillslope positions. Soil protein was highest in soil profiles found on both interfluve and side slope positions. Interfluves are analogous to summit positions while side slopes are analogous to back slopes (Schoeneberger and Wysocki, 2017). Due to parallel surface water flow, back slopes/side slopes generally have higher rates of erosion relative to accumulation compared to summit/interfluve and toeslope positions. Thus, it is surprising that soils primarily residing on back slopes/side slopes would contain the highest SOM and ACE values due to their predisposition to erosion. Contour strip cropping was common on farms in our study area and may imply that preventative management was taken for areas with high susceptibility to water erosion. However, this was not captured in our study. Future research may want to evaluate the relative importance of this management practice on varying slopes.
Depth of A Horizon
As the thickness increased of a soil’s A horizon (the top mineral layer of soil that is typically higher in SOM than its lower layers), the amount of SOM, TOC, and POXC increased. A thicker A horizon may be indicative of soils that accumulated more SOM due to the factors of soil formation. Management such as tillage and cropping also affect the depth of soil horizons, but is not always reflected in soil surveys. Surface layers that are more frequently disturbed are more likely to change in composition and structure over time.
The recency of soil surveys may limit the ability to discriminate differences at the field level derived under intensive management and land use change. According to the NRCS, field mapping for the entire state of Wisconsin was completed in fall 2005 and soil survey information made available online in 2006. The latest modifications to the soil survey occurred in September of 2019 in an effort to continuously update WSS compatibility with GIS technology and modern standards of mapping. Explicit statements highlighting the soil information that was updated, when, and how is critical to the interpretation of field observations. Updates on soil information from archived samples using modern methods compared to new observations from soil field mapping have very different considerations for interpretation. Nevertheless, Depth of A horizon can be directly measured by farmers and land managers with training, and thereby can circumvent the use of estimates from the WSS and provide a potential co-variate for soil health assessment.
pH
Soil acidity is recognized as an important factor for microbial community composition and activity (Rousk et al., 2009), but the bounds of the pH range used in analysis may be an important consideration in evaluating effects. All indicators were affected by pH besides SOM and PMN (Table 6 and 7). Total organic C, TN, and POXC had positive relationships with pH while minC and ACE had negative relationships with pH. Most fields had pH values higher than the target optimum for corn, soybean, and alfalfa production with 50% of fields between a pH of 6.8 and 7.3 (Laboski and Peters, 2012) (Table 3). The higher density of neutral to alkaline fields may not capture pH effects in soils that span acidic to basic conditions. Field experiments with a more extensive range of pH values (as low as 3.5 to as high as 8.3) identified the opposite relationship between C mineralization and pH (Rousk et al. 2009 and Kemmit et al. 2006). Even with the direct measurement of pH (i.e. instead of an estimated pH from WSS), the limited range in pH values explained less than 5% of the variation in soil health indicators. Since pH is largely managed for optimizing production of specific crops, pH may be more useful for adjusting soil health expectations across different cropping systems than within similar cropping systems.
Soil Texture, Cation-Exchange Capacity, and Bulk Density
Currently, multiple soil health assessments for agricultural systems (e.g. CASH and SMAF) utilize soil texture to adjust indicator scoring functions (Moebius-Clune et al., 2016; Stott, 2019). Other properties that relay soil textural information may provide further understanding in biological soil health differences. Of the 124 fields, only three had a soil texture other than silt loam. Although variation in soil texture was limited, the amount of sand (one of the particle sizes that quantitatively defines texture) had a positive relationship with SOM, TOC, and ACE. Sand content was relatively low (4.0 to 14.0%). Typically, larger variation in sand content is necessary to affect soil function as it is relatively inactive compared to the other solid components of soil, such as clay. Small changes in the proportion of clay-sized particles has large effects on soil properties and affects a soil’s potential for accumulating SOM and TOC (Moebius-Clune et al., 2016). However, clay content did not affect any of the soil health indicator values in our study while soil protein was the only indicator responsive to silt content.
The Cation-Exchange Capacity (CEC) of soils is primarily a function of SOM and clay mineralogy (Brady and Weil, 2010). Soil organic matter increases soil CEC through its high proportion of negatively charged sites that attract and exchange cations with the soil solution. As CEC and SOM are intrinsically related, soils with higher CECs coincided with higher SOM values. Cation-exchange capacity values from the WSS reflect antecedent SOM, which can be relayed by other soil information that is unlikely to change over relevant timescales (e.g. soil taxonomy).
Bulk density had stronger linear relationships with SOM and TOC than sand content or any other continuous soil property. Bulk density more accurately reflects soil composition and texture as it is a measure of the amount of soil solids within a given volume. It is a function of soil aggregation as well as sand, silt, clay, and SOM content. Bulk density estimates from the WSS may prove useful for adjusting soil health benchmarks or be a potential substitute for textural class.
Soil Water
Total organic C was heavily influenced by soil water properties. Wetter soils contained more TOC (Table 8 and Figure 3). Aquic Hapludolls had higher TOC values than other subgroup classifications. Soils with aquic moisture subclass regimes experience saturated conditions more frequently than drier regimes (Soil Survey Staff, 1999). These conditions slow decomposition rates causing SOM and C to accumulate. In fact, soils with poorer drainage, shallower depths to water table, and higher AWC had higher TOC, but hydrologic group had no effect on TOC or any other soil health indicator (Figure 3 and Table 8).
Available water capacity is an estimate of plant-available water calculated as the difference in soil water content at 3 kPa (i.e. field capacity) and 1500 kPa (i.e. wilting point). Although TOC increased with increasing AWC, water content at 1500 kPa and 3 kPa did not affect any indicators and should not be used individually to define critical thresholds for TOC. Site-specific management is likely to cause divergence from WSS estimated AWC. Future research should evaluate direct measurement of AWC for use as a potential co-variate while other soil moisture information may be well-estimated from the WSS. Soil moisture is an important consideration for evaluating TOC potential and was identified as the primary environmental factor for storage of TOC in cropland (Wiesmeier et al., 2013).
Soil Erodibility and Tolerance to Soil Loss
Soil organic matter and TOC were impacted by whole soil erodibility and tolerance to soil loss. Soil erodibility (i.e. K factor) is used to quantify the vulnerability of soil particles to detachment and movement by water. Increases in index values reflect increased susceptibility to water erosion. Soils with a whole soil erodibility factor less than 0.43 had higher SOM and TOC. Granted, erodibility is not the only component determining soil loss, but reduced susceptibility to water erosion may minimize the overall erosion rate leading to higher SOM and TOC values. Soil erodibility is determined mainly by soil structure, saturated hydraulic conductivity, and percentage of silt, sand, and SOM. Thus, its relationship with SOM and TOC may in part be the result of differences in antecedent SOM.
Only TN increased with increasing tolerance to soil loss and did not reflect SOM and TOC, which are usually depleted when soil is lost. Tolerable soil loss (i.e. T factor) is described as the “maximum rate of annual soil loss that will permit crop productivity to be sustained economically and indefinitely on a given soil” (Wischmeier and Smith, 1978). The inherent soil properties used to estimate tolerable soil loss are the depth to root and plant growth limiting layers and the severity of their physical and chemical properties (USDA-NRCS, 2019). Since tolerable soil loss is related to a soil’s inherent fertility, soils with higher tolerance may exhibit intrinsic conditions for superior crop growth, such as higher TN.
NRCS Soil Health Indices
Several NRCS soil health indices depicted differences in most of the soil health indicators, especially the biological indicators (POXC, minC, PMN and ACE) (Figure 2 to 6). Soils with lower susceptibility to surface sealing had higher SOM, TOC, TN, and POXC, while ACE was highest in highly susceptible soils. Surface seals and crusts are layers with poor infiltration formed by the destruction of soil aggregates, which causes surface pores to be blocked or filled (USDA-NRCS, 2008). Soil susceptibility to surface sealing is related to soil texture, SOM content, and sodium content. The fragile soil index is a measurement of a soil’s susceptibility to degradation. It is characterized by low SOM content, low aggregate stability, and weak soil structure. Soils that were less fragile had higher TN, minC, PMN, and ACE. Organic matter depletion is an index of soil vulnerability to SOM losses estimated by antecedent SOM, aeration, clay content, and land shape. Lower susceptibility to SOM depletion had higher SOM, TOC, and TN. Many individual properties have not identified differences in biological soil heath indicators, but NRCS soil health indices represented differences well. The NRCS soil health indices combine multiple properties to explain susceptibility of soil to various forms of degradation and require further exploration as potential co-variates for biological indicators.
NRCS Productivity Indices
Farmland class and National Commodity Crop Productivity Indices (NCCPI) for corn and soybean did not affect any soil health indicators. The NCCPI for small grains had a negative relationship with TOC. It is an index based on inherent soil properties and modeled with winter wheat. The index weighs heavily the negative effects to small grain production resulting from saturated soil conditions. Since TOC increases under wetter conditions, the inverse relationship between TOC and NCCPI for small grains occurs despite the common association of TOC with enhanced crop productivity. The Wisconsin Commodity Crop Productivity Index (WICCPI) assesses the inherent capacity of land to produce non-irrigated crops through soil, landscape, and climate criteria for corn production. Fields ranked high according to WICCPI had higher TOC than less productive ratings. This index directly utilized antecedent SOM in its evaluation, which may contribute to the differences in TOC between ratings. The influence of biological soil health is unrepresented in crop productivity indices, but recent work from Wade et al. (2020) found that improvements in biological soil health (POXC, minC, and ACE) increased fertilizer N use efficiency and corn grain yield. Biological soil health should be incorporated into crop productivity indices.
Table 6. Continuous NRCS variable effects on SOM, TOC, and TN.
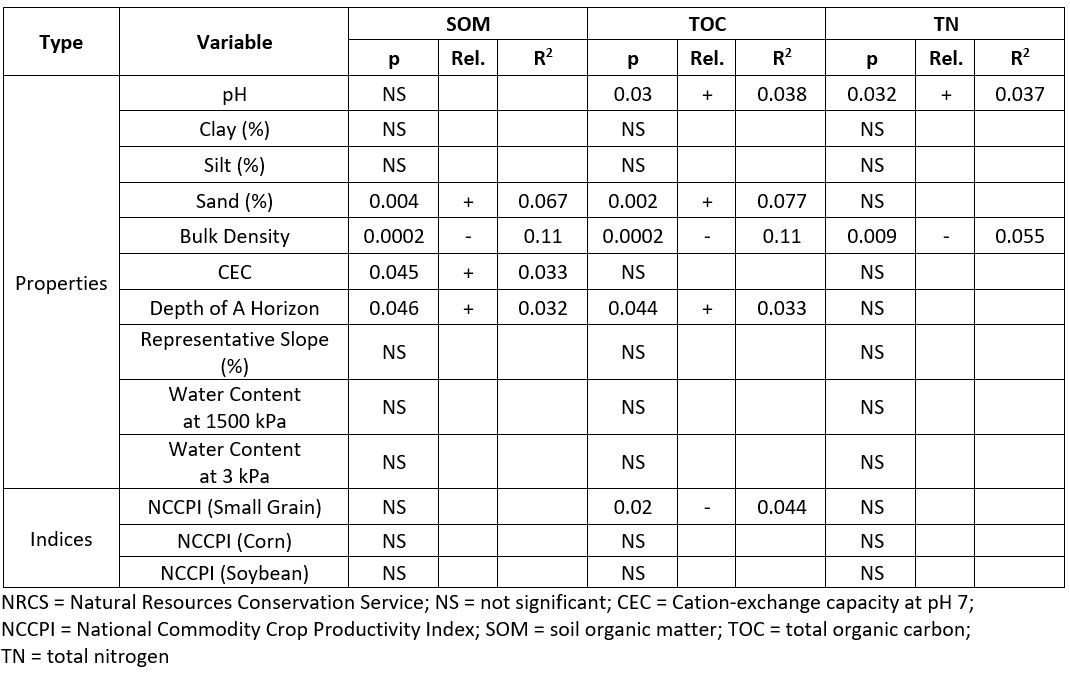
Table 7. Continuous NRCS variable effects on POXC, minC, PMN, and ACE.
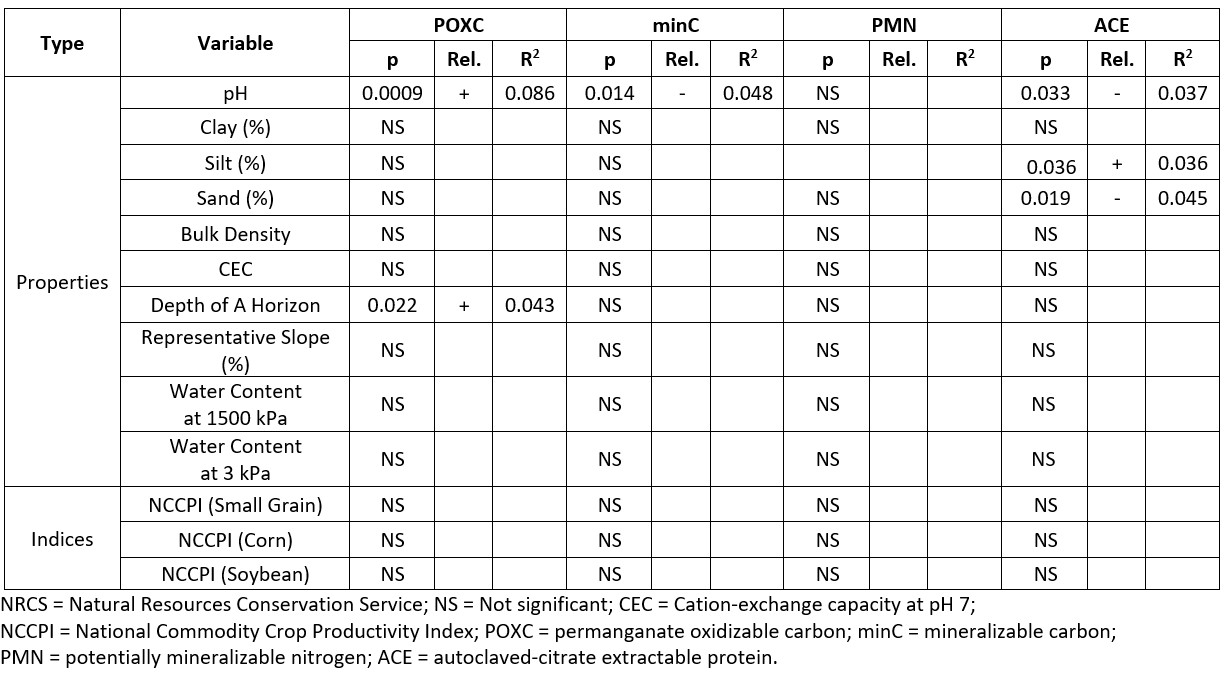
Table 8. Categorical NRCS variable effects on soil health indicators.
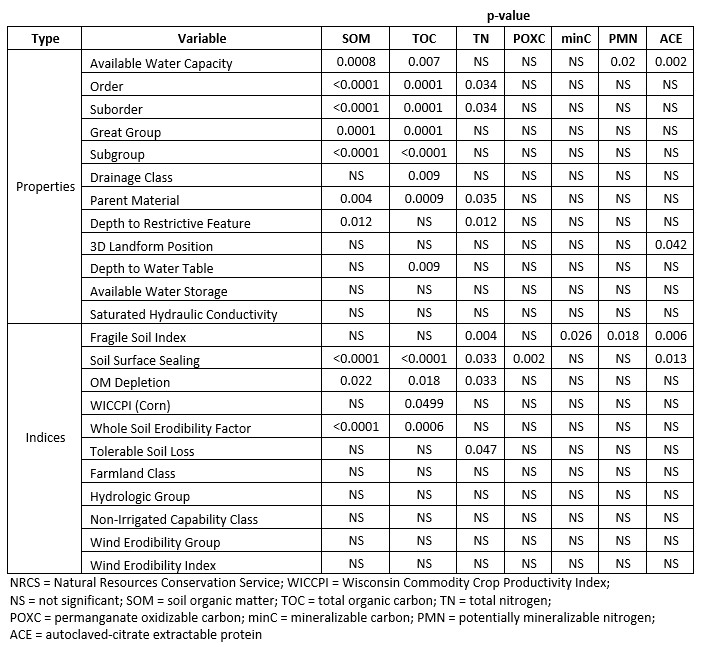
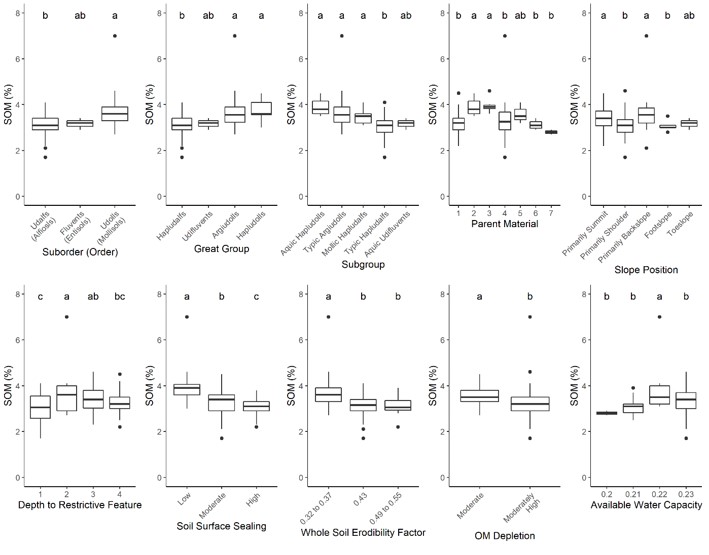
Figure 2. NRCS categorical variable effects on soil organic matter (SOM).
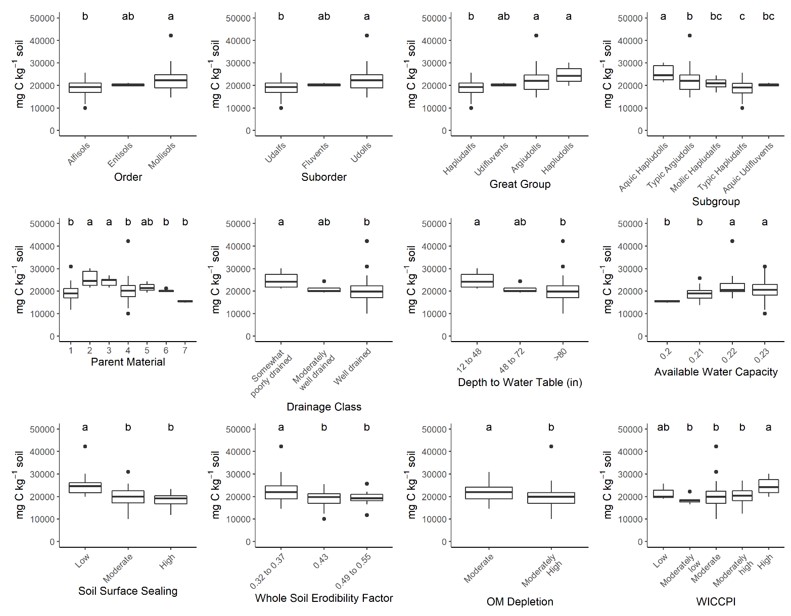
Figure 3. NRCS categorical variable effects on total organic carbon (TOC).

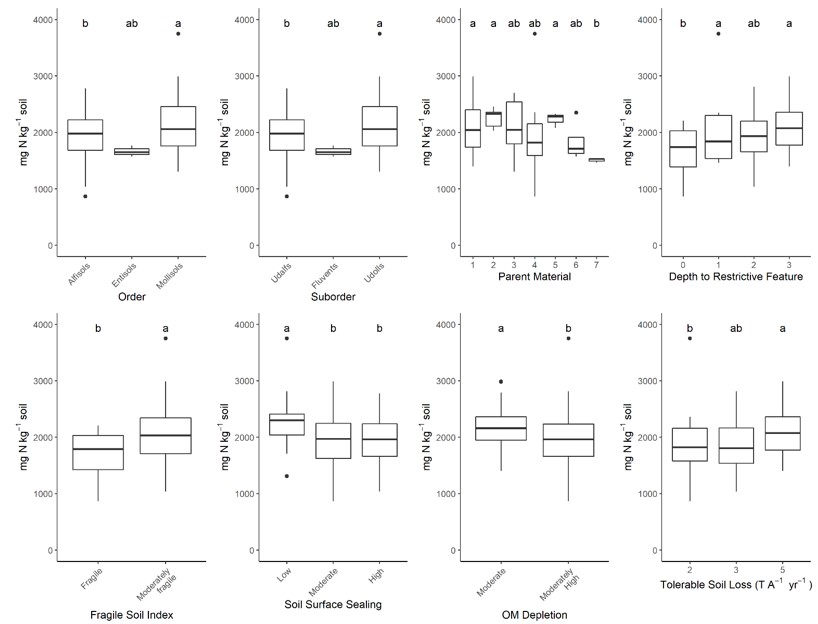
Figure 4. NRCS categorical variable effects on total nitrogen (TN).

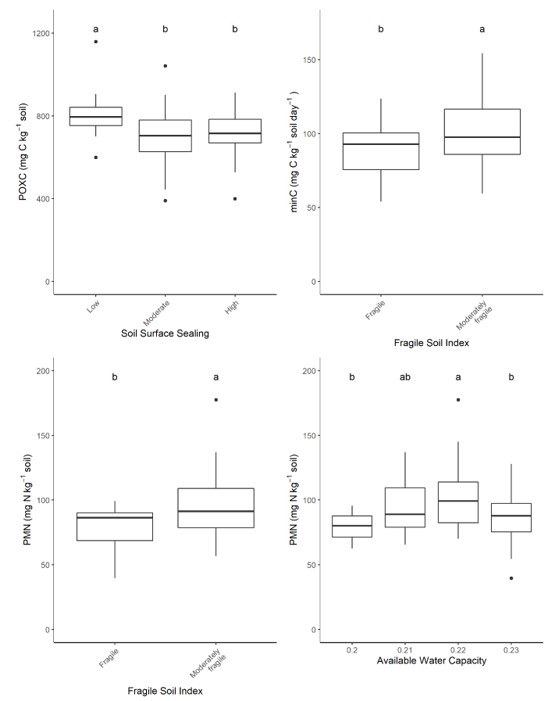
Figure 5. NRCS categorical variable effects on permanganate oxidizable carbon (POXC), mineralizable carbon (minC), and potentially mineralizable nitrogen (PMN).
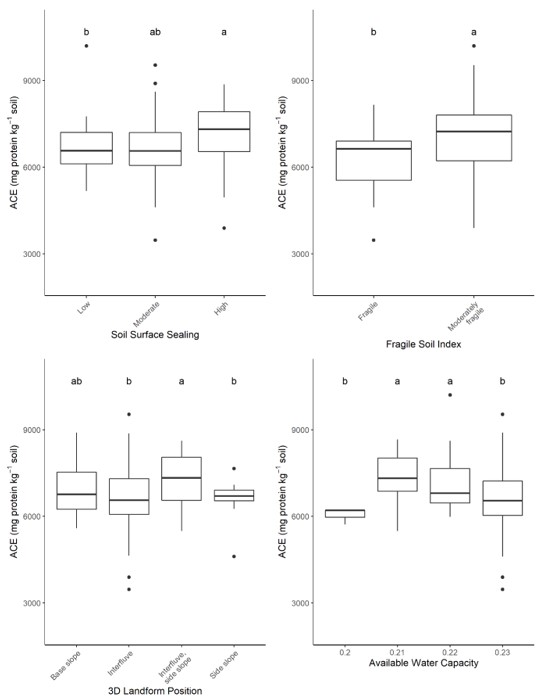
Figure 6. NRCS categorical variable effects on autoclaved-citrate extractable protein (ACE).
Effects of Management
Sampling Time
Mineralizable C and POXC were the only indicators affected by sampling day (Table 9). The linear relationship between the day of sampling and minC had the largest coefficient of determination (R2) with 0.20; it was nearly double the next largest R2 observed with any other indicator and explanatory variable (management or NRCS). As in our study, previous studies concluded that temporal variation was a limitation in soil health evaluation and comparison; soils sampled later in the growing season (June to August) tended to have higher minC, PMN, and POXC values than when sampled earlier (Diederich et al. 2019; Hurisso et al. 2018a). Unlike previous work, POXC had a weak inverse relationship with sampling day, but our sampling window was narrower, which may have limited temporal variation in POXC values. Still, standardizing a sampling period for soil health assessment may be essential for developing critical values and making meaningful interpretations for management recommendations, especially for minC.
Land Use Legacy
Despite narrowing the focus of the study to certified organic grain systems, legacy effects of historical land use were a major contributor to soil health. All but one of the fields that were conventional pasture prior to organic certification were converted over ten years ago. Despite this temporal distance in system, fields that were previously conventional pastures had higher SOM, TOC, TN, and POXC (Table 10 and Figure 7 to 10). Perennial pasture systems contribute a larger amount of belowground C to the soil compared to cropped land (Radrizzani et al., 2011; Sanford et al., 2012) while also stabilizing OM and C through soil aggregation and cover. Over a 20-year period, soil TOC in the upper 15 cm of Wisconsin Mollisols increased in perennial pasture systems, while other common Midwestern cropping systems lost TOC (Sanford et al., 2012). Identifying novel strategies to incorporate pasture into cropping systems of the Midwest may be a worthwhile approach to improve SOM and TOC content of our agricultural lands. In conventional tillage systems, Salvo et al. 2010 found that crop-pasture rotations (three years of annual crops followed by three years of pasture) led to higher TOC accumulation than rotations solely with annual crops.
Fields that were conventional row crop prior to initiating organic management were primarily in the transition phase and not yet organic certified. These fields along with fields previously enrolled in the Conservation Reserve Program (CRP) had lower TN values than conventional pasture and dairy systems. Since animal waste management is an intrinsic aspect of conventional pasture and dairy systems, fields with these prior uses tend to receive more manure through application or grazing than conventional row crop systems and CRP. This likely contributed to differences in TN values.
Rotation and Cropping Sequence
Total N and POXC were lowest in fields with five years of consecutive annual cropping (Figure 9 and 10). A positive relationship between perennial cover and TN reinforced an effect of perenniality (Table 11). Increasing system perenniality has been recognized as a strategy to increase biological soil health and SOM accumulation. Specifically, increases in system perenniality led to higher total C, TN, POXC, minC, and PMN in Wisconsin Mollisols (Diederich et al., 2019).
In addition, the cropping sequences and order of crops had an effect on N indicators. Increasing the diversity of plants utilized in five-year cropping sequences increased PMN and ACE (Table 9). This reinforces work that found that PMN was higher in rotations containing at least three different crops (Mahal et al., 2018). What crops were planted within the last two years affected TN. Total N was reduced when soybean was planted before corn compared to other crops before corn (Figure 9). Despite being an annual legume, soybean provides little N through biological fixation and additional N is required to supplement uptake from high N demanding crops. The differences in TN by crop sequence may also be a result of manure and N management decisions by crop not reflected in other management variables.
Duration of Organic Management
Although greater than three years of organic management was shown to improve soil health (Drinkwater et al., 1995), most indicators were not affected by duration of organic management. Only 3.8% of the variation in POXC and ACE was explained by duration of organic management. Without the use of synthetic fertilizers, organic systems rely on soil microorganisms to process SOM in order to supply fertility (Doran et al., 1987), resulting in a tightly-coupled N cycle with higher turnover rates (Drinkwater et al., 1995). Many comparison studies have found that biological metrics of soil health are improved in organic systems. Organic management increased TOC (Surekha et al., 2006), TN (Marinari et al. 2005), and PMN (Drinkwater et al., 1995; Doran et al., 1987; Gunapala and Scow, 1997) compared to conventional management. Surprisingly, these indicators did not respond to duration of organic management in our study despite containing fields that spanned zero years (in transition) to 27 years of certified organic management (Table 12).
Corn Harvest and Residue
The type of corn harvest and residue management that occurred the year prior to soil sampling affected SOM and TOC (Figure 7 and 8). Most of the corn was harvested for grain (n = 74), but 36 of the fields harvested the stalks for other on-farm uses while 38 of the fields left their stalks remaining as residue (Table 13). Snaplage, an alternative feed for dairy cattle made of ensiled corn ears, husks, and shanks, was utilized in two fields that left their stalks as residue (Akins et al., 2008). Fields that harvested corn for silage or left corn stalks as residue had higher SOM and TOC values. Corn silage harvest leaves little residue on the field as the whole corn plant is harvested in the process. Thus, it is unlikely that the same mechanism is responsible for the higher SOM and TOC values in fields harvesting for silage or grain with stalks remaining.
Manure Management
Mineralizable C and PMN positively responded to manure application (Figure 10). Fields with manure applied the year prior to sampling had higher minC. When solely liquid manure was applied compared to none or other physical states of manure, minC and PMN values were elevated regardless of the animal(s) that provided the manure. Fields that did not receive manure over the past five years were primarily conventional pasture prior to their organic transition. Soil organic matter was highest in these fields due to collinearity between previously conventional pasture fields and fields with no manure application. The land use legacy of pasture is likely the overriding factor in SOM values as manure and organic amendment application had been previously shown to increase minC and PMN in a diverse set of cropping systems and geographic regions (Hurisso et al., 2016; Mikha et al., 2006; Sharifi et al., 2008).
Tillage Management
Increasing tillage frequency and intensity reduced ACE (Table 9 and Figure 10). The number of tillage passes completed in between the fall and spring before sampling had a negative relationship with ACE, but the relationship only explained 4% of the variation. Minimum tillage fields (fields utilizing a disk, cultivator, or other less disruptive tillage implement) and chisel-tilled fields had higher ACE values than fields that utilized a moldboard plow within the last five years. Previous work has found that PMN and ACE respond positively to reduced tillage systems (Mahal et al., 2018; Doran, 1987; Rasmussen et al., 1998; Nunes et al., 2018; Sandeep et al., 2016).
Regression Tree Analysis
Regression tree analysis utilizing NRCS soil information and farm management information produced trees for SOM, TOC, TN, and minC. No trees were generated for POXC, PMN, and ACE. Soil surface sealing was the most influential factor for SOM and TOC; the indicators had identically pruned trees with a single split at low susceptibility to soil surface sealing (Figure 11 and 12). In further support of the standardization of sampling times for soil health analysis, minC was highest in samples obtained after May 26th (i.e. day 146) (Figure 13). Timing of sampling can greatly influence soil health values leading to misinterpretations of soil health status and management needs.
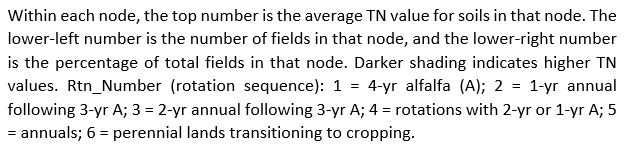
Total N differentiated fields by their inclusion of perennials within the past five years (Figure 14); consecutive annual cropping led to lower TN values. Over 70% of fields utilized alfalfa, a perennial forage, which replenishes soil N through biological fixation. Alfalfa can meet the N demands of first-year corn when sufficient stand plant density is met (Laboski and Peters, 2012), and older stands of alfalfa typically provide larger N credits than younger stands (Yost et al., 2018). Although many annually cropped fields incorporated soybean, the amount of N provided is over 7-times smaller than that of a good alfalfa stand. Thereby, annual cropping systems are more susceptible to soil TN depletion following corn if organic amendments do not supplement N uptake.
Regression trees were able to supply nuanced information despite containing only a single branch. The tree for minC explained more variation with its single primary split than simple linear regression of sampling time and minC (Figure 13). Regression trees are also able to indicate the amount of variation in indicator values explained by categorical primary variables through R2 values, while ANOVA is unable to provide this information. The R2 for each tree was 0.24 for SOM and TOC, 0.15 for PMN, and 0.26 for minC. Regression tree analysis has the ability to identify linear and non-linear effects, thereby providing better descriptions of relationships between indicators and explanatory variables than simple linear regression. Unfortunately, the ability is limited to variables included in the pruned trees.
Regression trees were produced using the variable that best segregated fields by their soil health values. Variable importance, a measure of a variable frequency as a primary and surrogate split while accounting for “goodness of split”, was highest for the variables selected for inclusion in indicator regression trees (Table 14). The best primary variable had improvement ratings 1.23 to 1.69 times greater than the variable with the next highest improvement rating (Table 15). Improvement is the difference in sum of squared errors between parent and child nodes, and is a measure of decreased impurity (i.e. increased homogeneity) (Therneau and Atkinson, 2019). For the TN regression tree, five-year rotation sequence and the number of years with perennial cover had equal importance and improvement values due to their identical splitting pattern; they split according to whether the past five years of cropping were all annual crops or not.
Surrogate variable agreement was sufficient for handling missing observations in primary variables. Agreement is the proportion of observations sent the correct direction when using a surrogate variable in place of the primary variable for an observation with missing data (Therneau and Atkinson, 2019). Besides minC, the best performing surrogate variable of each regression tree had agreement values greater than 94%. Mineralizable C utilized sampling time as its primary variable, which had no missing observations and did not require a surrogate split for regression tree formation. Therefore, all of the surrogate variables utilized in tree formation were able to accurately direct observations to the appropriate nodes and produce informative trees for assessing relative effects on indicator values. Future research that aggregates soil health data to form larger regional and national datasets would be beneficial for developing soil health assessments by increasing the likelihood to identify important effects and interactions with regression tree analysis.
Summary of Findings
Existing, publicly available soil information provided by the NRCS WSS was a useful tool to explore how inherent soil properties affected soil health in a given region. Analysis of soil health in the Driftless Region identified potential co-variates to include in soil health assessment despite minimization of variation in soil properties relative to inter-region variation. In particular, soil taxonomy, soil moisture, soil surface sealing, whole soil erodibility, the fragile soil index, and SOM depletion were identified as potential co-variates for indicator scoring functions and benchmarks. Those properties and indices differentiated soil health values within the Driftless Region. This soil information should be collected and utilized in future soil health studies to understand their effects in other regions, climates, and cropping systems as well as to understand their applicability across spatial scales. Soil health assessments that incorporate essential co-variates when setting benchmarks may more accurately represent the health status of a given soil among its related peers as well as inform management to improve crop production and the provision of ecosystem services.
While many inherent soil properties contribute to differences in soil heath, farm management practices can improve or weaken the biological health of soils under agricultural production. Legacy land use and cropping sequences that utilized perennial cover had higher SOM, TOC, and TN. Nitrogen-cycling indicators were more affected by cropping sequence, crop diversity, and tillage. The incubation methods, minC and PMN, were influenced by the use of manure in the last year and the physical state of the manure. Regression tree analysis found that perennial cover within rotation sequences was most important for differentiating TN while susceptibility to soil surface sealing was most important for differentiating SOM and TOC. Mineralizable C was most affected by sampling time and requires standardization of a sampling window for soil health comparisons. The disparate response of soil health indicators to management indicates differences in sensitivity between indicators as well as soil elemental cycles. Therefore, multiple shifts in management may be required to support both healthy C and N cycling in agricultural systems. These results provide first-indications of best management practices for biological soil health in organic grain systems.
Table 9. Continuous farm management variable effects on POXC, minC, PMN, and ACE.
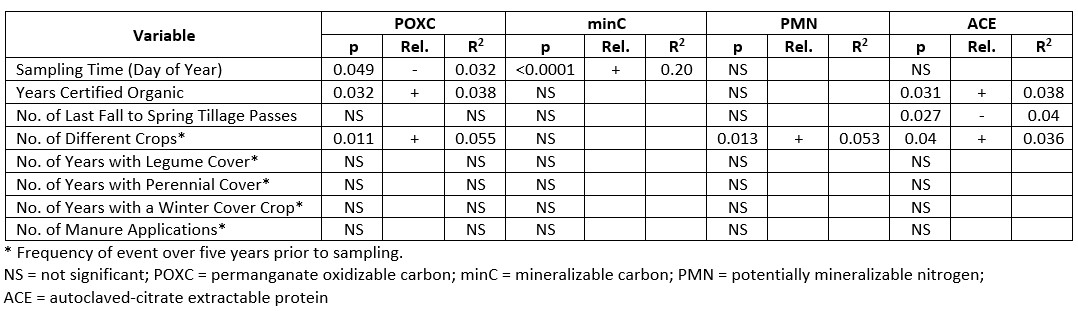
Table 10. Categorical farm management variable effects on biological soil health indicators.
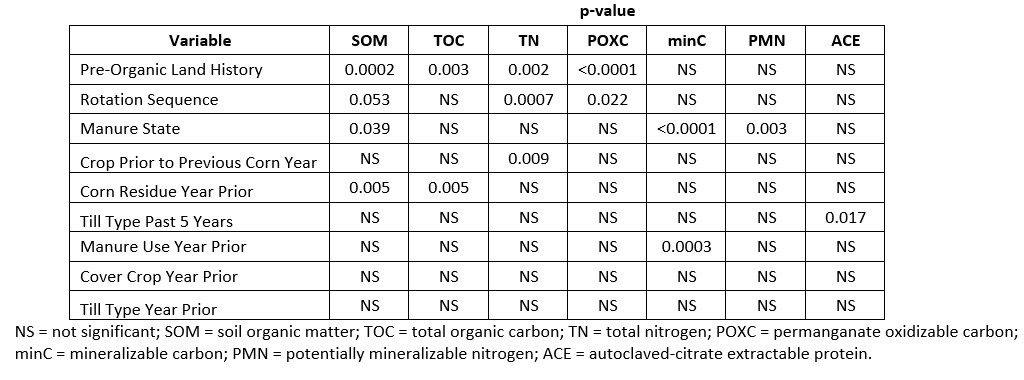
Table 11. Continuous farm management variable effects on SOM, TOC, and TN.
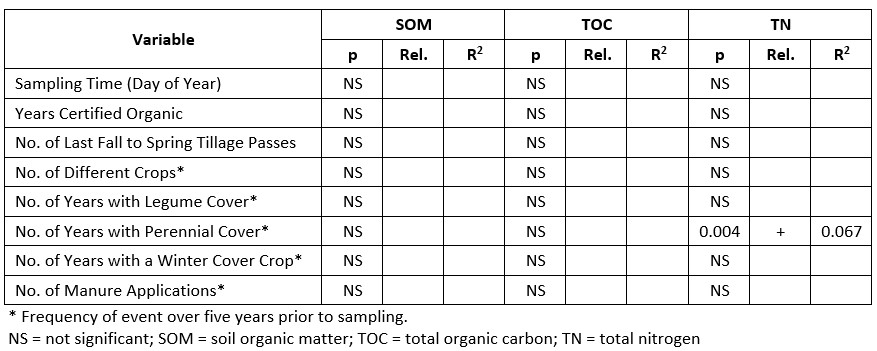
Table 12. Univariate statistics for farm management and sampling continuous variables.
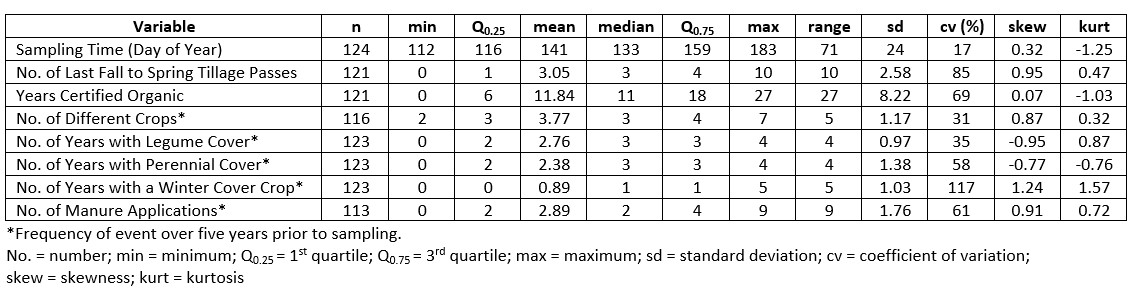
Table 13. Farm management categorical variables and their distribution.
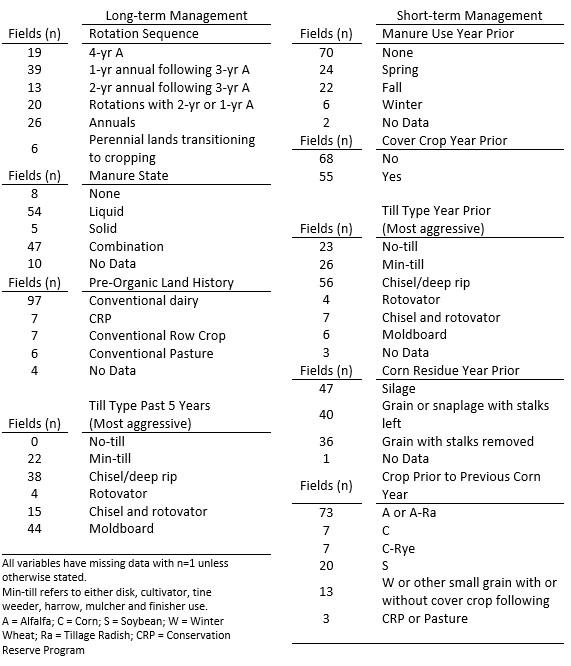
Table 14. The top five most important variables (variable importance scores) by soil health indicator.
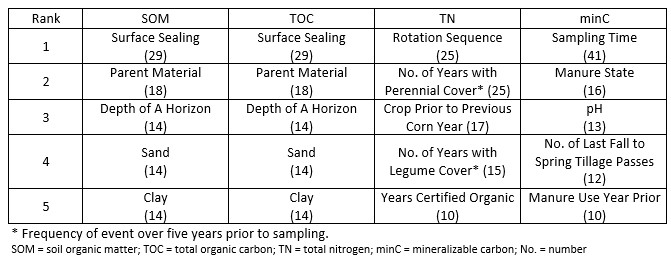
Table 15. The top three primary and surrogate splits by soil health indicator.
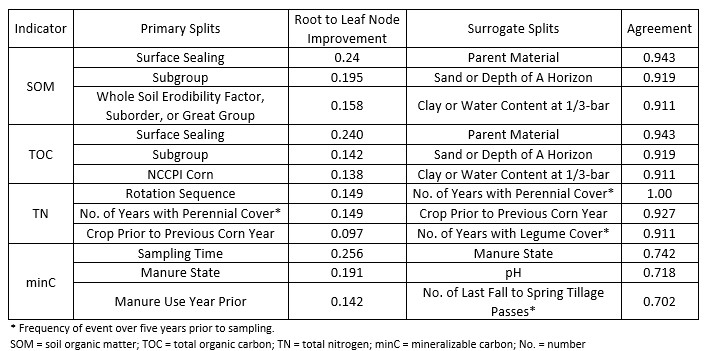
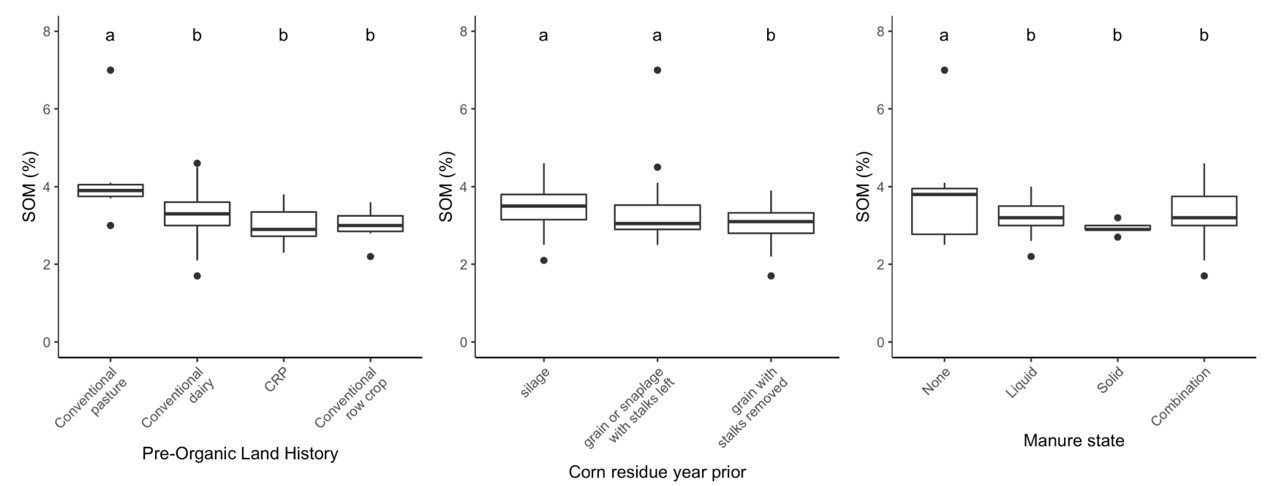
Figure 7. Categorical farm management variable effects on soil organic matter (SOM).
CRP = Conservation Reserve Program
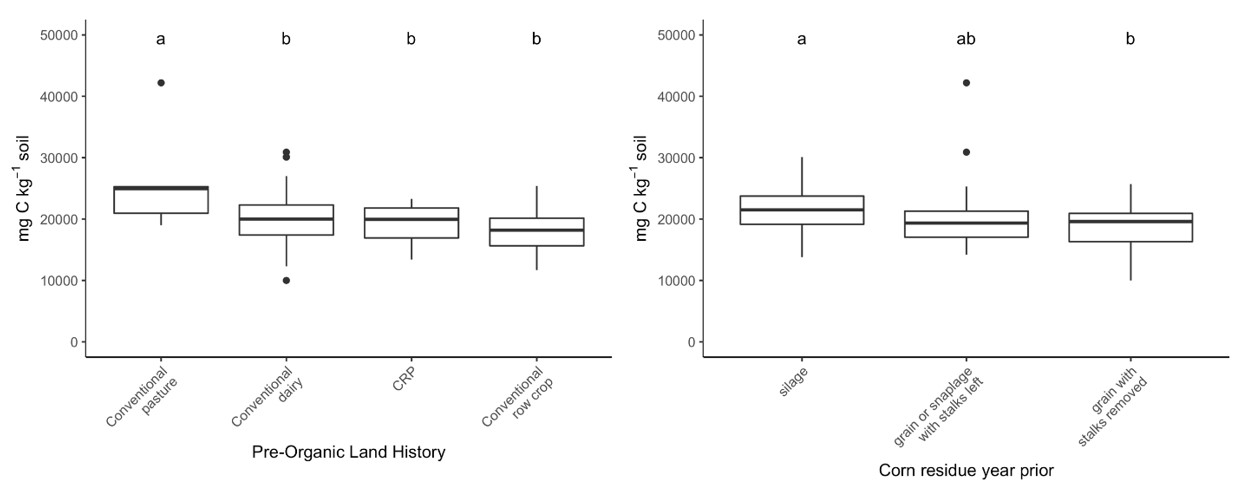
Figure 8. Categorical farm management variable effects on total organic carbon (TOC).
CRP = Conservation Reserve Program
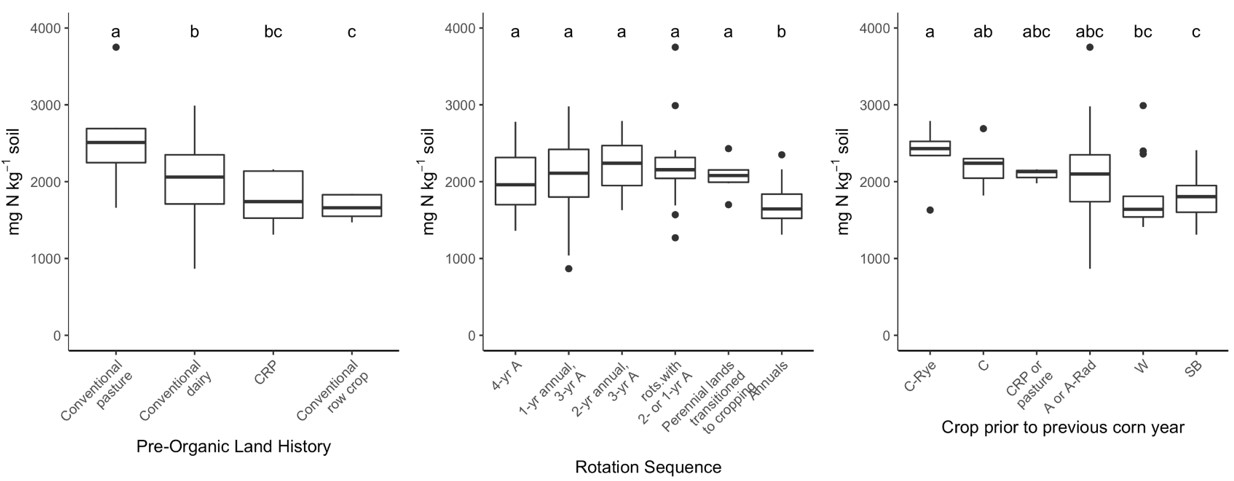
Figure 9. Categorical farm management variable effects on total nitrogen (TN).
A = alfalfa; CRP = Conservation Reserve Program; C = corn; Rad = Radish; W = wheat; SB = soybean
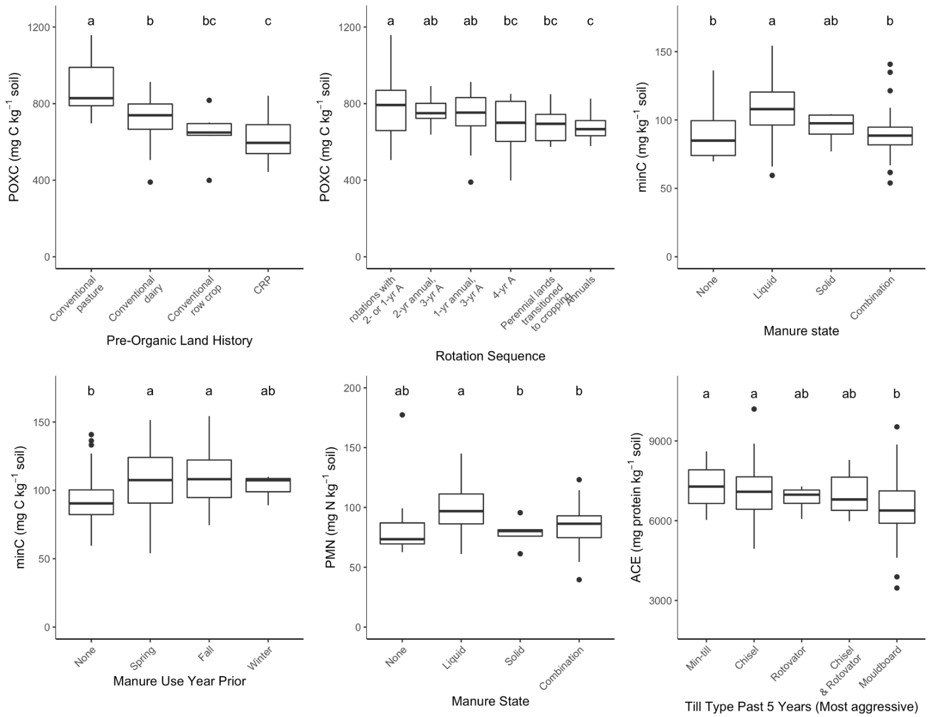
Figure 10. Categorical farm management variable effects on biological soil health indicators.
A = alfalfa; POXC = permanganate oxidizable carbon; minC = mineralizable carbon; PMN = potentially mineralizable nitrogen; ACE = autoclaved-citrate extractable protein

Figure 11. Pruned regression tree for soil organic matter (SOM) percentage.
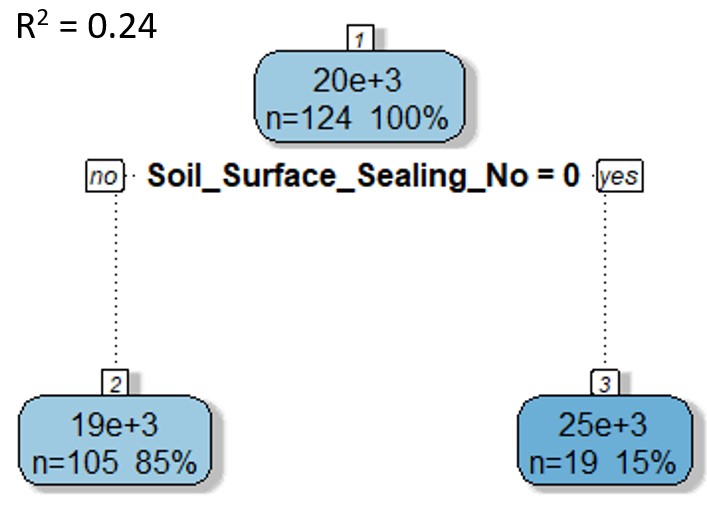
Figure 12. Pruned regression tree for total organic carbon (TOC) (mg C kg-1 soil).
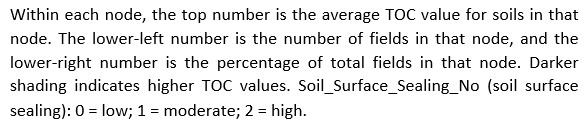
Figure 13. Pruned regression tree for mineralizable carbon (minC) (mg C kg-1 soil day-1).
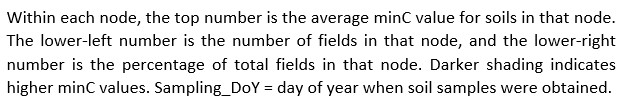
Figure 14. Pruned regression tree for total nitrogen (TN) (mg N kg-1 soil).
References
Akins, M., R. Shaver, and J. Lauer. 2008. Corn snaplage harvest and feeding storage / feedout. Focus Forage. 15(2): 1–3.
Alfaro, F.D., M. Manzano, P.A. Marquet, and A. Gaxiola. 2017. Microbial communities in soil chronosequences with distinct parent material: the effect of soil pH and litter quality. J. Ecol. 105(6): 1709–1722. doi: 10.1111/1365-2745.12766.
Angst, G., J. Messinger, M. Greiner, W. Häusler, D. Hertel, et al. 2018. Soil organic carbon stocks in topsoil and subsoil controlled by parent material, carbon input in the rhizosphere, and microbial-derived compounds. Soil Biol. Biochem. 122: 19–30. doi: 10.1016/j.soilbio.2018.03.026.
Brady, N.C., and R.R. Weil. 2010. Elements of the nature and properties of soils. 3rd edition. Prentice Hall, Upper Saddle River, New Jersey.
Culman, S.W., S.S. Snapp, M.A. Freeman, M.E. Schipanski, L.E. Drinkwater, et al. 2012. Permanganate oxidizable carbon reflects a processed soil fraction that is sensitive to management. Soil Sci. Soc. Am. J. 76(2): 494–504. doi: 10.2136/sssaj2011.0286.
Diederich, K.M., M.D. Ruark, K. Krishnan, F.J. Arriaga, and E.M. Silva. 2019. Increasing labile soil carbon and nitrogen fractions require a change in system, rather than practice. Soil Sci. Soc. Am. J. 83(6): 1733–1745. doi: 10.2136/sssaj2018.11.0458.
Doran, J.W. 1987. Microbial biomass and mineralizable nitrogen distributions in no-tillage and plowed soils. Biol. Fertil. Soils 5(1): 68–75. doi: 10.1007/BF00264349.
Drinkwater, L.E., D.K. Letourneau, F. Workneh, A.H.C. Van Bruggen, and C. Shennan. 1995. Fundamental differences between conventional and organic tomato agroecosystems in California. Ecol. Soc. Am. 5(4): 1098–1112.
Drinkwater, L.E., C.A. Cambardella, J.D. Reeder, and C.W. Rice. 1996. Potentially mineralizable nitrogen as an indicator of biologically active soil nitrogen. Soil Sci. Soc. Am. J. (Special Publication 49): 217–229. doi: 10.2136/sssaspecpub49.c13.
Franzluebbers, A.J., R.L. Haney, C.W. Honeycutt, H.H. Schomberg, and F.M. Hons. 2000. Flush of carbon dioxide following rewetting of dried soil relates to active organic pools. Soil Sci. Soc. Am. J. 64(2): 613–623. doi: 10.2136/sssaj2000.642613x.
Gunapala, N., K.M. Scow, T. Sustainable, and A. Farming. 1997. Dynamics of soil microbial biomass and activity in conventional and organic farming. Soil Biol. Biochem. 30(6): 805–816.
Haney, R.L., A.J. Franzluebbers, E.B. Porter, F.M. Hons, and D.A. Zuberer. 2004. Soil carbon and nitrogen mineralization: Influence of drying temperature. Soil Sci. Soc. Am. J. 68(2): 489–492. doi: 10.2136/sssaj2004.4890.
Harris, D., W.R. Horwath, and C. van Kessel. 2001. Acid fumigation of soils to remove carbonates prior to total organic carbon or carbon-13 isotopic analysis. Soil Sci. Soc. Am. J. 65(6): 1853–1856. doi: 10.2136/sssaj2001.1853.
Hurisso, T.T., S.W. Culman, W.R. Horwath, J. Wade, D. Cass, et al. 2016. Comparison of permanganate-oxidizable carbon and mineralizable carbon for assessment of organic matter stabilization and mineralization. Soil Sci. Soc. Am. J. 80(5): 1352. doi: 10.2136/sssaj2016.04.0106.
Hurisso, T.T., S.W. Culman, and K. Zhao. 2018a. Repeatability and spatiotemporal variability of emerging soil health indicators relative to routine soil nutrient tests. Soil Sci. Soc. Am. J. 82(4): 939. doi: 10.2136/sssaj2018.03.0098.
Hurisso, T.T., D.J. Moebius-Clune, S.W. Culman, B.N. Moebius-Clune, J.E. Thies, et al. 2018b. Soil protein as a rapid soil health indicator of potentially available organic nitrogen. Agric. Environ. Lett. 3(1): 0. doi: 10.2134/ael2018.02.0006.
Karlen, D.L., K.S. Veum, K.A. Sudduth, J.F. Obrycki, and M.R. Nunes. 2019. Soil health assessment: Past accomplishments, current activities, and future opportunities. Soil Tillage Res. 195: 1-10. doi: 10.1016/j.still.2019.104365.
Kemmitt, S.J., D. Wright, K.W.T. Goulding, and D.L. Jones. 2006. pH regulation of carbon and nitrogen dynamics in two agricultural soils. Soil Biol. Biochem. 38(5): 898–911. doi: 10.1016/j.soilbio.2005.08.006.
Laboski, C.A.M., and J.B. Peters. 2012. Nutrient application guidelines for field, vegetable, and fruit crops in Wisconsin: A2809. UW Ext. R-11-2012(A2809): 76.
Mahal, N.K., M.J. Castellano, and F.E. Miguez. 2018. Conservation agriculture practices increase potentially mineralizable nitrogen: A meta-analysis. Soil Sci. Soc. Am. J. 82(5): 1270–1278. doi: 10.2136/sssaj2017.07.0245.
Marinari, S., R. Mancinelli, E. Campiglia, and S. Grego. 2006. Chemical and biological indicators of soil quality in organic and conventional farming systems in Central Italy. Ecol. Indic. 6(4): 701–711. doi: 10.1016/j.ecolind.2005.08.029.
Mikha, M.M., C.W. Rice, and J.G. Benjamin. 2006. Estimating soil mineralizable nitrogen under different management practices. Soil Sci. Soc. Am. J. 70(5): 1522–1531. doi: 10.2136/sssaj2005.0253.
Moebius-Clune, B.N., D. Moebius-Clune, B. Gugino, O.J. Idowu, R.R. Schindelbeck, et al. 2016. Comprehensive assessment of soil health - The Cornell framework manual. Third Edition. Cornell University, Ithaca, NY.
North Central Extension & Research Activity. 2015. Recommended chemical soil test procedures for the North Central Region. North Central Regional Research Publication No. 221.
Nunes, M.R., H.M. van Es, R. Schindelbeck, A.J. Ristow, and M. Ryan. 2018. No-till and cropping system diversification improve soil health and crop yield. Geoderma. 328: 30–43. doi: 10.1016/j.geoderma.2018.04.031.
Radrizzani, A., H.M. Shelton, S.A. Dalzell, and G. Kirchhof. 2011. Soil organic carbon and total nitrogen under Leucaena leucocephala pastures in Queensland. Crop Pasture Sci. 62(4): 337–345. doi: 10.1071/CP10115.
Rasmussen, P.E., C.L. Douglas, H.P. Collins, and S.L. Albrecht. 1998. Long-term cropping system effects on mineralizable nitrogen in soil. Soil Biol. Biochem. 30(13): 1829–1837. doi: 10.1016/S0038-0717(98)00057-1.
Rousk, J., P.C. Brookes, and E. Bååth. 2009. Contrasting soil pH effects on fungal and bacterial growth suggest functional redundancy in carbon mineralization. Appl. Environ. Microbiol. 75(6): 1589–1596. doi: 10.1128/AEM.02775-08.
Salvo, L., J. Hernández, and O. Ernst. 2010. Distribution of soil organic carbon in different size fractions, under pasture and crop rotations with conventional tillage and no-till systems. Soil Tillage Res. 109(2): 116–122. doi: 10.1016/j.still.2010.05.008.
Sandeep, S., K.M. Manjaiah, S. Pal, and A.K. Singh. 2016. Soil carbon fractions under maize–wheat system: effect of tillage and nutrient management. Environ. Monit. Assess. 188(1): 1–13. doi: 10.1007/s10661-015-4995-3.
Sanford, G.R., J.L. Posner, R.D. Jackson, C.J. Kucharik, J.L. Hedtcke, et al. 2012. Soil carbon lost from Mollisols of the North Central U.S.A. with 20 years of agricultural best management practices. Agric. Ecosyst. Environ. 162: 68–76. doi: 10.1016/j.agee.2012.08.011.
Schoeneberger, P.J., and D.A. Wysocki. 2017. Geomorphic description system. Version 5.0. Natural Resources Conservation Service, National Soil Survey Center, Lincoln, NE.
Sharifi, M., B.J. Zebarth, D.L. Burton, C.A. Grant, and G.A. Porter. 2008. Organic amendment history and crop rotation effects on soil nitrogen mineralization potential and soil nitrogen supply in a potato cropping system. Agron. J. 100(6): 1562–1572. doi: 10.2134/agronj2008.0053.
Sikora, F.J. 2006. A buffer that mimics the SMP buffer for determining lime requirement of soil. Soil Sci. Soc. Am. J. 70(2): 474–486. doi: 10.2136/sssaj2005.0164.
Soil Survey Staff. 1999. Soil Taxonomy: A basic system of soil classification for making and interpreting soil surveys. Second Edition. U.S. Department of Agriculture, Natural Resources Conservation Service.
Soil Survey Staff. n.d. Web soil survey. U.S. Department of Agriculture, Natural Resources Conservation Service. http://websoilsurvey.sc.egov.usda.gov/ (accessed 15 August 2019).
Stott, D.E. 2019. Recommended soil health indicators and associated laboratory procedures. Soil Health Technical Note No. 430-03. U.S. Department of Agriculture, Natural Resources Conservation Service.
Surekha, K., K. V. Rao, N. Shobha Rani, P.C. Latha, and R.M. Kumar. 2013. Evaluation of organic and conventional rice production systems for their productivity, profitability, grain quality and soil health. Agrotechnology. 01(S11). doi: 10.4172/2168-9881.s11-006.
Therneau, T.M., and E.J. Atkinson. 2019. An introduction to recursive partitioning: Using the RPART routines. https://cran.r-project.org/web/packages/rpart/vignettes/longintro.pdf (accessed 21 May 2020).
USDA-NASS. 2017. Certified organic survey: 2016 summary. U.S. Department of Agriculture, National Agricultural Statistics Service.
USDA-NRCS. 2008. Soil quality indicators: Soil crusts. https://www.nrcs.usda.gov/wps/PA_NRCSConsumption/download?cid=nrcs142p2_051277&ext=pdf (accessed 22 Jun. 2020).
USDA-NRCS. 2019. National soil survey handbook. Title 430. http://www.nrcs.usda.gov/wps/portal/nrcs/detail/soils/ref/?cid=nrcs142p2_054242 (accessed 10 Jun. 2020).
Wade, J., S.W. Culman, J.A.R. Logan, H. Poffenbarger, M.S. Demyan, et al. 2020. Improved soil biological health increases corn grain yield in N fertilized systems across the Corn Belt. Sci. Rep. 10(1): 1–9. doi: 10.1038/s41598-020-60987-3.
Weil, R.R., K.R. Islam, M.A. Stine, J.B. Gruver, and S.E. Samson-Liebig. 2003. Estimating active carbon for soil quality assessment: A simplified method for laboratory and field use. Am. J. Altern. Agric. 18(1): 3–17.
Wiesmeier, M., R. Hübner, F. Barthold, P. Spörlein, U. Geuß, et al. 2013. Amount, distribution and driving factors of soil organic carbon and nitrogen in cropland and grassland soils of southeast Germany (Bavaria). Agric. Ecosyst. Environ. 176: 39–52. doi: 10.1016/j.agee.2013.05.012.
Wischmeier, W.H., and D.D. Smith. 1978. Predicting rainfall erosion losses - A guide to conservation planning. U.S. Department of Agriculture, Agriculture Handbook. 537: 2.
Yarwood, S., A. Wick, M. Williams, and W.L. Daniels. 2014. Parent material and vegetation influence soil microbial community structure following 30-years of rock weathering and pedogenesis. Microb. Ecol. 69(2): 383–394. doi: 10.1007/s00248-014-0523-1.
Yost, M., M. Russelle, J. Coulter, M. Schmitt, C. Sheaffer, et al. 2018. How stand age affects alfalfa nitrogen credits to first-year corn. https://extension.umn.edu/corn-cropping-systems/how-stand-age-affects-alfalfa-nitrogen-credits-first-year-corn (accessed 16 Jul. 2020).
Educational & Outreach Activities
Participation summary:
A virtual 1.5-hour presentation/workshop focused on this research was attended live by 191 participants at the Growing Stronger: Collaborative Conference on Organic & Sustainable Farming in February 2021. This conference merged five conferences that are largely geared towards farmers and producers as well as other agricultural professionals. Previously, preliminary results of the most influential soil properties and management practices on biological soil health was presented via poster presentation at MOSES Organic Farming Conference 2020, another farmer-oriented conference, as well as via oral and poster presentations at the Agronomy Science of America-Crop Science Society of America-Soil Science Society of America (ASA-CSSA-SSSA) Annual Meetings in 2019 and 2020. A public thesis seminar of the work was held virtually at University of Wisconsin-Madison. In addition to speaking events, a factsheet was created and shared via the Organic Grain Resources and Information Network (OGRAIN) that describes biological soil health, its importance to agricultural systems, and key measures for biological soil health assessment. Two journal publications are to be submitted over the next year.
Project Outcomes
The outcomes of this project are that we have identified potential co-variates for soil health assessment for the Driftless Region of Wisconsin. The inclusion of these co-variates would optimize evaluation of a field’s soil health status in order to better inform farm decision making for improved soil health. Additionally, we increased our understanding of how organic grain management affects biological soil health. This information can be used by producers to understand how their fields may respond to adoption of new management. It also provides the first-indications for best management practice recommendations. Overall, this will help direct farm efforts to improves soil health, thereby supporting more efficient production and enhanced provision of ecosystem services.
The knowledge gained from this project resulted in identifying key soil properties for benchmarking soil health in the Driftless Region of Wisconsin. Soil taxonomy, soil moisture, the fragile soil index, susceptibility to soil surface sealing and organic matter depletion were recognized as potential co-variates for use in soil health assessment. In addition, the most influential management practices differed by soil health indicator suggesting that multiple management strategies are required to ensure healthy C and N cycling. Legacy land use and cropping sequences that utilized perennial cover had higher SOM, TOC, and TN. Nitrogen-cycling indicators were more affected by cropping sequence, crop diversity, and tillage. Microbial activity was influenced by the use of manure in the last year and the physical state of the manure. Mineralizable C was highly affected by sampling time and requires standardization of a sampling window for soil health comparisons.