Final report for GNC19-287
Project Information
With a rapidly growing global population, ensuring both food security and access to freshwater is critical. Thus, research is needed on conservation practices that strike a balance between sustaining productive agriculture and minimizing the downstream impacts of nutrient loss, including harmful algal blooms and contaminated drinking water supplies. Winter cover crops have been shown to retain nutrients on fields, and in turn reduce nitrate (NO3--N) loss from soils, especially during vulnerable periods such as spring snowmelt and runoff. However, the efficacy of cover crops in buffering the impacts of extreme events, such as winter and spring storms, is understudied, and these events can cause significant nutrient losses from agricultural land. In fact, the majority of annual NO3--N loss occurs during the largest storms, but the role of conservation to mitigate these losses has yet to be explored. Understanding the relationship between cover crops and storm NO3--N export will be crucial in sustaining crop yields as storm intensity and frequency is predicted to increase in the North Central Region in the future. We propose a study in which we will use real-time sensing equipment (Submersible Ultraviolet Nitrate Analyzers; SUNAs) to quantify the effects of cover crops on storm NO3--N export in two agricultural watersheds planted with contrasting levels of cover crops (~25% versus ~70% of croppable acres). Data from SUNA sensors offer an opportunity to study NO3--N loss and export dynamics during storms using high-frequency data. We will successfully translate our results to our partners in each watershed, including producers, county Soil and Water Conservation Districts, and government stakeholders. Such opportunities will allow us to convey the benefits of implementing cover crops as a conservation practice that imparts resilience to storms events. We will evaluate our progress via monthly data downloads and maintenance, routine data analysis, quarterly progress reports, and the dissemination of our results to project partners. The outcomes of this project will continue to provide data-rich support regarding the potential benefits imparted from cover crop implementation, and their role in building a sustainable cropping system that prevents negative environmental impacts.
Learning Outcomes:
- Producers and landowners, along with resource managers, such as the Soil and Water Conservation District (SWCD) staff, The Nature Conservancy (TNC), and the USDA National Resource Conservation Service (NRCS), will be provided with data that supports the role of cover crops in providing resilience against nutrient loss during storm events. We will quantify these effects by comparing storm NO3--N export in two watersheds with contrasting levels of cover crop implementation: Kirkpatrick Ditch Watershed (KDW) with ~25% coverage and Shatto Ditch Watershed (SDW) with ~70% of croppable acres in cover crops. Results will be published in a peer-reviewed journal and shared at farmer field days and stakeholder meetings in both watersheds, allowing us to translate research outcomes and data to broad and diverse audiences.
Action Outcomes:
- Farmers will adopt cover crops at higher rates in order to add resilience and prevent NO3--N loss from their fields as storm events increase in frequency and intensity over the next few decades. Our work will provide data highlighting a novel benefit of cover crops – storm resilience – that can support agricultural productivity by keeping nutrients on fields even when subjected to more severe storms.
- Using our results, SWCD staff, NRCS managers, and other non-landowner stakeholders will encourage and advise large-scale adoption of cover crops by landowners. We have established a strong outreach network via previous and sustained USDA funding over the past seven years, which will provide us with ample opportunities to share our findings with audiences regionally.
Research
We conducted our study in two small, agricultural watersheds in Northern Indiana; the Shatto Ditch Watershed (SDW) is 13.3 km2, and the Kirkpatrick Ditch Watershed (KDW) is 26.2 km2 (Fig. 1). The predominant land use in both watersheds is row crop agriculture, with >80% of land area in a soybean-corn rotation. We consider these watersheds to be representative of working lands in the midwestern US as cropland in each watershed is operated independently by agricultural producers. At SDW, soils are primarily Alfisols (77%) and Mollisols (13%), while Mollisols are the dominant soil type at KDW.
Both watersheds are also part of a long-term study in which winter cover crops were planted as an agricultural conservation practice in which we provided funds to incentivize producers to plant cover crops on their fields in the fall. Although producers were required to adhere to specific Natural Resources Conservation Service (NRCS) guidelines to be eligible for payment, we did not dictate what species to plant, nor did we discuss any aspect of field management for the cash crop (i.e., tillage practices, fertilizer application, etc.). In SDW, winter cover crop coverage was maintained at an average of 65% of croppable acres during the 2016-2019 water years and decreased to 22% of croppable acres in the 2020 water year. In KDW, cover crops were implemented on an average of 23% of croppable acres across the 2016-2019 water years and decreased to 11% of croppable acres in the 2020 water year. Annual ryegrass (Lolium multiflorum Lam.) was the most commonly planted species, followed by cereal rye (Secale cereale L.). Winter wheat (Triticum aestivum) or an oat (Avena sativa) and radish (Raphanus sativus L. var. niger J. Kern.) mix were planted infrequently on select fields. In both SDW and KDW, herbicide was used to terminate the cover crops in the spring in advance of cash crop planting.
At the beginning of August 2016, we deployed SUNA V2 Nitrate Sensors (10 mm path length; Sea-Bird Scientific, Bellevue, WA) at the watershed outlets of both SDW and KDW, measuring NO3--N concentrations at 30-minute intervals. Both sensors were deployed with CDMALink data loggers (Sutron, Sterling, VA) that allowed for remote transmission and download of data, resulting in near-continuous deployment of the SUNA sensors for >4 years, with the exception of removal for routine factory calibrations or equipment issues (e.g., data logger malfunctions, lightning strike). We checked the Hydromet Cloud application (Sutron, Sterling, VA) daily to ensure the sensors were functioning and downloaded sensor data monthly. To assess sensor performance, we also collected grab samples directly adjacent to the sensors every two weeks for wet chemistry analysis of NO3--N on a Lachat QuikChem™ Autoanalzyer (Lachat Instruments, Loveland, CO) using the cadmium reduction method (APHA 2012). Finally, we obtained precipitation data from weather stations we placed within the watershed boundaries and stream discharge data from the USGS gages at the outlet of each watershed (KDW – #5524546; SDW – #3331224).

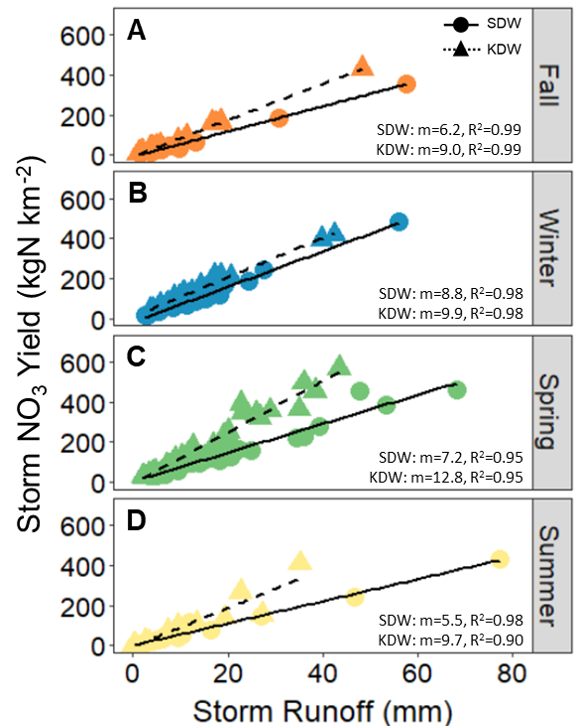
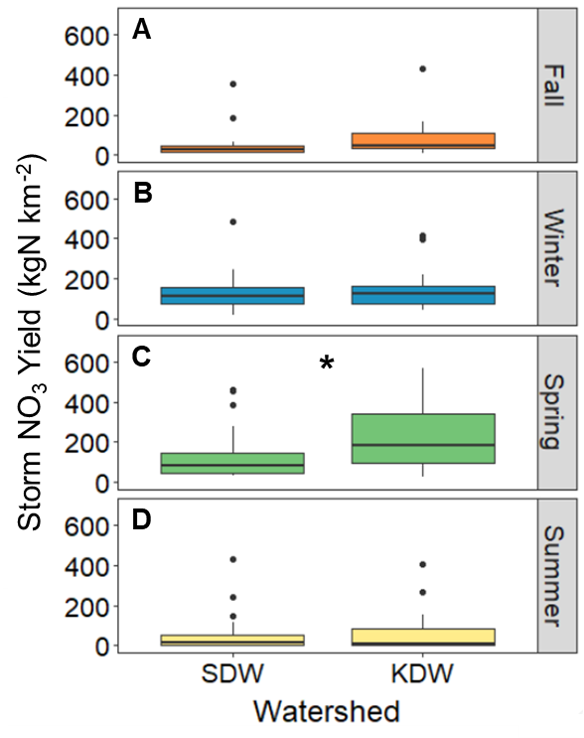
Our goal was to understand the potential role that cover crops can play in buffering storm-driven NO3--N losses will be critical for maintaining agricultural productivity by keeping fertilizer N on fields and preventing downstream impacts. I originally predicted that that the proportion of annual NO3--N export lost during storms would be lower in watershed with greater cover crop acreage. We calculated the total runoff (mm) and total NO3--N yield (kg km-2) for each of the 200 storms we captured in SDW and KDW. We then regressed NO3--N yield vs. runoff for each watershed seasonally using simple linear regression (SLR); if discharge was the primary driver of storm NO3--N yields, we would expect a strong linear relationship. Indeed, we found storm NO3--N yields were strongly driven by event-specific runoff in both watersheds (SLR, R2=0.90-0.99) and yields increased exponentially across flow intervals (Fig. S4). Our results suggest that conservation practices such as cover crops may reduce watershed-scale NO3--N loss during storms. Storm NO3--N yields were significantly lower in SDW (~65% of croppable acres) compared to KDW (average = 23% of croppable acres) in the spring only (ANOVA, p<0.05), but also trended lower in all other seasons as well.
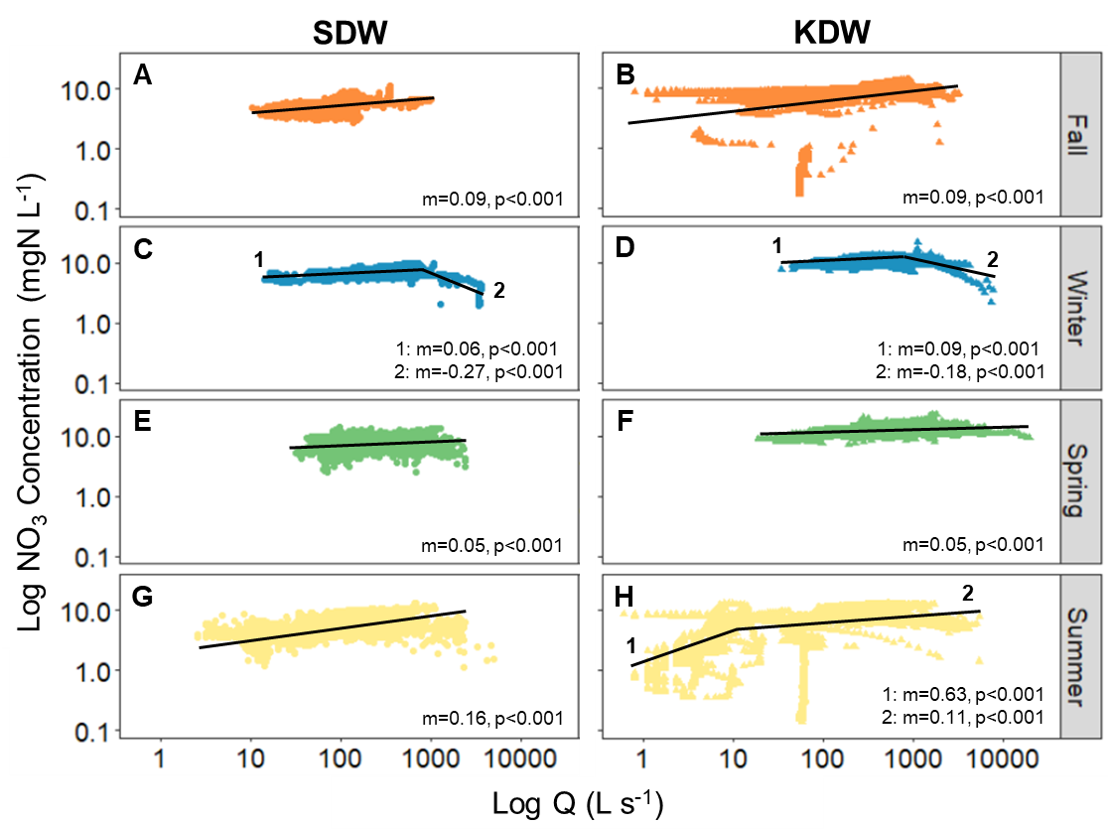
We also explored annual, seasonal, and event-based concentration-discharge (C-Q) relationships to provide insights into the balance between NO3--N retention and loss at the watershed scale. Documenting current C-Q patterns with high resolution data provides a baseline against which managers can evaluate conservation practices at various time scales, including at the scale of individual storms. Effective conservation practices should, over time, make the system more retentive of NO3--N and shift C-Q relationships from chemostatic (little variation in concentration relative to variation in discharge) to chemodynamic (increased variation in concentration relative to discharge).
As C-Q relationships are often linear in log-log space, we determined the C-Q slope (b) using SLR on log-transformed 30-minute discharge and NO3--N concentration measurements. We then classified seasonal slopes as either chemostatic, transport-limited, or source-limited using thresholds defined by Bieroza et al. (2018). We defined a slope between -0.1 to 0.1 as chemostatic. Slopes greater than 0.1 were considered to be transport-limited, indicating an enrichment response across the range of flows observed (e.g., increasing Q results in increasing NO3--N concentrations), while slopes less than -0.1 were considered source-limited, indicating a dilution response across the range of flows observed (e.g., increasing Q results in decreasing NO3--N concentrations).
We found that at annual and seasonal time scales, the C-Q relationship was generally chemostatic, indicating the importance of hydrologic controls on NO3--N transport from the landscape to the stream. In contrast, the C-Q relationships of individual storms were more variable. We found that only 15% of storms exhibited chemostatic behavior (-0.1 < FI < 0.1), while 36% suggested source-limitation (FI < -0.1). Most commonly, we found transport-limitation during storms (49% storm with FI > 0.1), indicating the C-Q response for individual storms was more variable than when data were aggregated at seasonal or annual timescales. The sequence of storms (e.g., back-to-back events) and timing of flow path connectivity during storms may drive event-based C-Q variability. The distinct C-Q slopes at short vs. long times scales is of critical importance for accurately estimating watershed-scale NO3--N loads, and has strong implications for downstream water quality, given that the majority of NO3--N export from these agricultural watersheds occurred under high flow conditions.
We then analyzed flow duration curves to determine the significance of high flows (i.e., storms) in driving NO3--N loss from each watershed (USEPA 2007). To determine the relative contributions of each flow interval to annual NO3--N yield, we also calculated the total NO3--N load for all days in each flow interval category. The majority of annual NO3--N export from SDW (79-88%) and KDW (81-95%) occurred at in the top 40% of flows (60-100th percentile), highlighting the importance of stormflow in driving NO3--N loss in both watersheds. Unexpectedly, the mean contribution of a given storm to annual NO3--N yield was comparable in both watersheds; individual events contributed an average of 3.1% and 3.7% of annual NO3--N yield in SDW and KDW, respectively. However, it is important to note that the impact of a given storm on annual NO3--N yield was variable, with storm contributions ranging from 0.1-43.6% of annual yield in SDW and 0.1-25.6% in KDW during the study period; the maximum in each watershed includes the contribution of the extreme storm in February 2018.
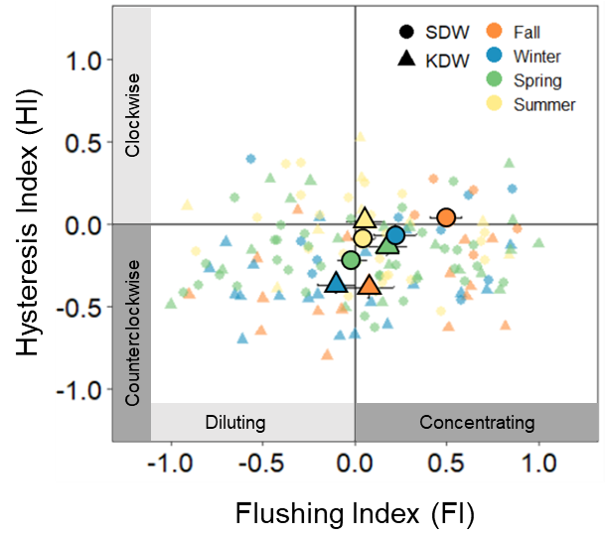
To explore patterns in NO3--N export during individual storms, we identified 143 storms in both SDW and KDW with suitable data for comparative analysis (e.g., no missing data due to high turbidity), for which we calculated both hysteresis and flushing indices. We calculated the hysteresis index (HI) for each storm, where a positive HI indicates a clockwise hysteresis loop, indicating NO3--N is delivered from a source near the stream (i.e., proximal source) during the storm, reflecting rapid source mobilization. In contrast, a negative HI reflects a counterclockwise hysteresis loop, where NO3--N is derived from a distal source or via flow paths that are activated later in the storm progression (i.e., slow source mobilization). In general, over the four-year dataset, we observed counterclockwise patterns in hysteresis in 77% of all storms (Fig. 4, S3A-B), indicating that distal NO3--N sources dominated storm delivery to the streams. The prevalence of counterclockwise hysteresis was likely an artifact of extensive tile drainage in both watersheds.
We also calculated the flushing index (FI) for each storm. For FI, a positive value indicates NO3--N enriches on the rising limb of the storm, suggesting that NO3--N delivery to the stream is transport-limited. In contrast, a negative FI indicates NO3--N concentrations dilute on the rising limb of the storm, suggesting NO3--N delivery is source-limited. In contrast, FI patterns were more evenly distributed among categories with 43% of storms exhibiting dilution at peak Q and 57% exhibiting NO3--N concentration at peak Q. Patterns in FI likely reflect the control of near-term controls on NO3--N transport, such as time since last fertilizer application or antecedent moisture conditions.
Educational & Outreach Activities
Participation summary:
Speir_SARE_Storm One-Pager_6.21.21
In the original proposal, I expected to have three types of learning outcomes: peer-reviewed article, presentations at regional/national conferences, and brief summaries (“one-pagers”). We were able to achieve each of the three learning outcomes successfully during the granting period. The research outcomes derived this grant were written up in a manuscript that is currently in revision in the journal Biogeochemistry. We expect this work to be published by the end of Summer 2021. I also presented this research at 3 national and 1 international conferences during the granting period, where attendees ranged from approximately 50-100 viewers per conference. The national conferences were the Society for Freshwater Science Meeting, the American Geophysical Union (AGU) Fall Meeting, and the Association for the Sciences of Limnology and Oceanography. The international conference was the Fourth International Workshop on High-Resolution Water Quality Monitoring and Analysis hosted by the Swedish University of Agricultural Sciences. Finally, I also created a one-pager outlining the role of watershed-scale planting of cover crops in reducing storm-driven NO3--N export and enhancing resilience to extreme events. This will be available on the Indiana Watershed Initiative website, and we will distribute the one-pager at future farmer field days and to the local SWCD.
In the original proposal, I expected to have three types of action outcomes that focused on outreach: annual farmer meetings, presenting findings at regional SWCD meetings and farmer field days, and creating a YouTube video shared via social media. We were able to achieve two of the three learning outcomes successfully during the granting period as a result of the pandemic. We held one farmer field day in January 2020, with the farmers from the Shatto Ditch Watershed, where results from this study were presented. However, the pandemic prevented us from hosting a farmer meeting at the Kirkpatrick Ditch Watershed within the granting period. We were also unable to attend regional SWCD meetings/field days; however, we plan to distribute the one-pager developed for this project at future field days and will share the final publication related to this project with our SWCD partners on the Indiana Watershed Initiative to increase our impact. Finally, I created a YouTube video that highlights the potential impact of storms on downstream nutrient losses and the potential role of cover crops in retaining nutrients on the landscape during extreme events (link: https://youtu.be/ndsm5a0kD1g).
Outside of the proposed outcomes, this project was also featured in an article for the Notre Dame College of Science News: https://science.nd.edu/news/graduate-student-receives-sustainable-agriculture-grant/.
Project Outcomes
Our results highlight the variability in C-Q relationships across different temporal scales, from annual to seasonal to storm-specific events. The temporal variation in NO3--N export is especially relevant in agricultural watersheds of the midwestern U.S. given their role in nutrient loading to the Gulf of Mexico. For example, the reliance on long-term C-Q relationships as the foundation for estimating watershed-scale nutrient export is well known (e.g., the USGS model LOADEST), and improved understanding regarding potential variation in C-Q relationships across scales is necessary to avoid under- or overestimating watershed nutrient export. For example, when we used bi-monthly grab samples from SDW and KDW to estimate watershed NO3--N export using the composite model in the Loadflex package in R, our estimate of annual watershed export varied from 39% lower to 12% higher (depending on water year) compared to estimates of annual NO3--N export using high-frequency sensor measurements; both over- and underestimates can have important implications when assessing restoration success or progress in meeting goals for downstream water quality improvement.
Consistent with other studies, we documented the critical role storms play in driving nutrient loss from the agricultural landscape to adjacent waterways. Anthropogenic modifications to hydrology (e.g., tile drainage, channelization) in intensively farmed regions, combined with increased nutrient inputs required for productive agriculture, enhance the vulnerability of midwestern watersheds to altered precipitation patterns due to climate change. The current study demonstrates the importance of temporal scaling in accurately capturing C-Q dynamics in agricultural watersheds, which has direct implications for estimating downstream nutrient export. Moreover, our results from a four year, high-frequency dataset of 200 storms suggest that as event size increases, NO3--N yields from small agricultural watersheds may increase exponentially, which has significant implications for downstream water quality. In this study, >80% of annual NO3--N export occurred at the top 40% of flows, highlighting the importance of conservation strategies that buffer the impact of large storms to prevent nutrient losses from agricultural land to waterways (e.g., cover crops). In fact, our results suggest that watershed-scale saturation with cover crops may significantly reduce NO3--N loss during spring storm events. We found that high-frequency NO3--N data offered key insights into how widespread agricultural land use across the midwestern U.S. may alter spatial and temporal dynamics in NO3--N losses during storms with implications for water quality impacts as far away as the Gulf of Mexico.
Through this work, and in conjunction with our research group’s related work, we have continued to champion agricultural conservation to support downstream water quality. Our research and conversations with the farmers in our study watersheds have show us that cover crops can not only offer nutrient retention benefits, but can also provide increased resilience to variable precipitation patterns and support consistent yields. In fact, many farmers in our watersheds who planted cover crops were able to get into their fields early than those who did not in the very wet spring of 2019. Thus, the implementation of cover crops as a conservation practice may help offset any potential negative economic effects that may result from increasing storm frequency and intensity in the North Central Region. Moreover, our work has shown us how farmers can partner with researchers to create climate change solutions that work for them as well as for the downstream communities. Thus, farmers can support and preserve water quality to provide essential freshwater resources for generations to come.