Final report for GNC21-317
Project Information
There is increasing interest among farmers to manage for soil health because of its associated benefits to ecosystem services such as productivity, nutrient cycling, carbon sequestration, and water quality. Graziers in the North Central Region want to incorporate best management practices for soil health and monitor improvements in soil health on their farms. However, many questions remain unanswered: what soil health tests are most beneficial and accessible for farmers, what are the relative impacts of management and inherent soil properties on soil health indicators, and what can farmers expect from improved soil health regarding ecosystem services.
The research project “Evaluating the relationships between pasture management, soil health and ecosystem services through on-farm monitoring” will characterize biological soil health indicators across Wisconsin pastures of various management. We have collaborated with graziers, local conservationists and educators, and other stakeholders to design the project to address the following objectives:
1) Determine the value of soil health testing of pastures and regionally benchmark soil health for Wisconsin pastures
2) Evaluate the importance of management factors and inherent soil properties on indicators of soil health and develop recommendations for best management practices in pastures.
Thirty two graziers located in the Driftless and Central regions of Wisconsin participated in this research. For each farm we evaluated three pastures of different management or productivity, for a total of 96 pastures, in order to assess how the variability of management practices may impact soil health. The information generated from on-farm research will increase farmers’ and other stakeholders’ understanding of soil health indicators and what management practices can improve soil health. Greater adoption of these best management practices by farmers in the North Central Region should lead to improved productivity, reduced economic risk, greater profitability, protection of soil and water quality resources, and improved livelihoods in their communities.
The expected learning outcomes for this research are as follows: 1) participating graziers will learn how the soil health of their pastures vary within their own farms and how they compare to other pastures in their region and the state; and 2) graziers, educators, conservationists, agency, and researchers will improve their understanding of soil health indicators and testing, how the management of pastures can influence soil health and how improved soil health might impact ecosystem services
The expected action outcomes for this research are as follows: 1) producers will use reliable and cost-effective soil health tests when appropriate for their management goals, 2) producers will incorporate identified best management practices associated with higher soil health, and 3) agency, conservationists and educators will integrate this information into educational events, including field days, conferences, pasture walks, individual consulting, and others
Cooperators
- (Researcher)
- (Researcher)
Research
Study Design
The study used an on-farm, exploratory research design. Research was conducted in two regions in Wisconsin: “Kickapoo”, named after the Kickapoo watershed, and “Marathon”, comprising of sites mainly in Marathon County (Figure 1). Thirty-two farmers from these regions chose to participate in the study after discovering the project through local grazing networks, producer led groups, land and water conservation districts, and NRCS agents. A total of 92 pastures were sampled, all of which had been grazed for at least one year. Participants selected pastures based on their interests and to capture variation on their farm attributed to management, land history, soil type or productivity.
Management Data Collection & Site Descriptions
Participants completed a comprehensive management questionnaire that included questions on land use history, pasture management and grazing practices specific to sampled pastures or paddocks. The questions were used to identify long-term, short-term, and immediate factors that may influence soil health indicators. With the understanding that grazing management and systems are dynamic and adaptive, producers reported typical values or averages across the season for their current operations. Table 1 includes a complete list of inherent properties and management practices included in the analysis.
Most sites were silt loam soils (73%) and well drained (57%). Farms included dairy (17%), dairy heifers (11%), beef (including cow/calf, stocker and finishing operations) (57%), and multispecies (15%) grazing. About half of the pasture sites were less than ten years old, with the remaining pastures ranging widely from 10 to 100 years old. 88% of the sites were rotationally grazed, while the remaining sites were continuously grazed. Sites varied in pasture and grazing management practices, including outwintering, nutrient inputs, haying, and stocking and rotation factors (Tables 2-6).

Sand, silt, clay, and pH were directly measured, and drainage class was identified using the Web Soil Survey. Land use history, grazing and pasture management factors were provided by the farmer. Stocking rate, stocking density and seasonal grazing pressure were calculated using animal units (total livestock weight in kg divided by 454 kg) and paddock size (ha). *variables excluded in random forest analysis because greater than 90% of the data were the same value **variables excluded in random forest, which only included rotationally grazed pastures
Soil sampling & in-field data collection
Soil samples were collected in June and September 2021. Within each pasture, a 50m x 50-m area was selected that was a uniform soil type and representative of the pasture. Coordinates from the center of the sampling area were recorded and used to retrieve drainage class from the NRCS Web Soil Survey.
At each site, 20 soil cores were taken to a depth 0-15 cm using a probe with an internal diameter of 2.5 cm, then combined into one composite sample. Samples were kept on ice for up to 12 hours and then transferred to a refrigerator for up to three days. Roots were removed from the soil sample and samples were then air dried and ground to pass through a 1-mm sieve.
At the time of soil sampling, visual in-field estimates of percent legume cover were taken using a 0.25-m2 quadrat. Quadrats were laid out using three transects spaced 15 m apart and 5 replicates spaced 10 m apart within each transect. The 15 replicates were averaged, and this average was used for data analysis.
Soil Analysis
Soil samples were analyzed for pH, Bray-1 P, Bray-1 K, OM-loss on ignition (LOI), percent sand and clay, nitrate and ammonium, TC, TN, POXC, ACE, MinC and PMN. Samples were sent to the UW Soil and Forage Lab in Marshfield, WI for routine pH, Bray-1 P, Bray-1 K, OM-LOI, and texture analysis. Particle size analysis was conducted via the hydrometer method (Bouyoucos et al., 1962).
TC and TN were measured with a dry combustion method, using a Flash EA 1112CN Automatic Elemental Analyzer. Between 24.5 and 25.5 mg of finely ground soil was packed into 10 x 12 mm tin capsule prior to combustion. Total C was considered the same as organic carbon, after conducting an HCl fizz test, which demonstrated the lack of inorganic carbon in the samples.
Three of the soil health analyses, POXC, ACE and MinC were conducted at Ohio State University’s soil test lab as part of the “Active Organic Matter” package. POXC was measured using protocols by Culman et al. (2012), adapted from Weil et al. (2003) protocol, where the carbon is oxidized with 0.2-M KMnO4 and the color change is read on a spectrophotometer. MinC is determined through a one-day incubation. Soils were rewetted and incubated at 25°C for 24 hours, and then CO2 evolution measured using an infrared gas analyzer (Franzluebbers, Haney, et al., 2000). Lastly, ACE was measured by adding sodium citrate, autoclaving the sample, extracting protein, and quantifying the concentration compared to a standard with a spectrophotometer (Hurisso, Moebius‐Clune, et al., 2018).
PMN was analyzed in house at University of Wisconsin-Madison using the Drinkwater protocol for anaerobic PMN (1996). PMN was calculated by measuring the ammonium in soils after a 7-d anaerobic incubation and subtracting from this the amount of ammonium already in the soil. Ammonium was extracted using 2-M KCl. Nitrate and ammonium from the nonincubated sample were included as inorganic measurements of nitrogen.

Due to differences between continuous (n=11) and rotationally (n=78) grazed pastures, site descriptions are provided based on grazing category. One farm (3 sites) did not provide management and its inherent site descriptions provided under the category “unknown management”. Texture class was determined based on measured sand, silt and clay content. Drainage class and soil order were retrieved from NRCS Web Soil Survey, based on GPS coordinates recorded at the center of the sampling area.


1. Soil measurements
1.1 Summary Statistics
There was a wide range of values for bulk C and N measures, OM% (2.0-7.7%), TC% (1.1-4.2%), TN% (0.09-0.37%), C:N (9.1-15.2), as well as the labile C and N measures in June and September respectively: POXC (373-1230 and 422-1183 mg kg-1), ACE (4.5-15.5 and 4.0-13.7 g kg-1), MinC (15.7-207.8 and 6.4-168.7 mg kg-1), and PMN (36.9-235.9 and 37.6 mg kg-1) (Tables 7-8). OM, C:N and ACE were right skewed (0.96, 1.32, and 1.48 respectively) and had kurtosis greater than 1, indicating a peaked distribution. These deviations in normality were minor, so no transformations were performed and the non-transformed response variables were used in statistical analyses. The other metrics had normal distributions.


1.2 Correlations among biological indicators of soil health
Positive correlations among biological indicators of soil health (POXC, ACE, MinC, and PMN) ranged from r=0.39 to r=0.82 (Figure 2). While the correlations among indicators were slightly weaker in September compared to June, the trends were consistent. Correlations between the two chemical extractions POXC and ACE and between the two biological incubations MinC and PMN were stronger than those between C indicators or N indicators. This study revealed positive correlations of varying strength among biological indicators of soil health, consistent with previous research (B. S. Crookston et al., 2021; Culman et al., 2013; Fine et al., 2017; Hurisso, Culman, et al., 2018; Hurisso et al., 2016; Morrow et al., 2016). Weaker correlations between POXC and MinC have been observed in other on-farm survey work, due to site specific factors and variability (Hurisso et al., 2016).
1.3 Effect of sampling time
The paired t-test revealed significant differences between June and September for all biological indicators of soil health (Table 10). While POXC was greater in September (with a mean difference of 35.12 mg kg-1), the other indicators were lower in September, on average. Sampling time had the largest effect on MinC, with a mean difference of -45.78 mg kg-1. When considering the difference between the sampling times relative to the June measurement, the average percent change in POXC, ACE, and PMN was small (3-7% with a standard deviation approximately 15%), compared to MinC, which had an average change of 32%, with a standard deviation of 31%. Previous research has demonstrated these biological indicators, particularly MinC, vary with sampling time (Culman et al., 2013; Diederich et al., 2019; Hurisso et al., 2018; Morrow et al., 2016). Heightened biological soil health during the June sampling time is attributed to direct effects of conducive temperature and precipitation on microbial activity and indirect effects of plant growth stages (Culman et al., 2013; Diederich et al., 2019; Stevenson et al., 2014; Wade et al., 2018)

Positive values indicate that September measurements were greater than June; Negative values indicate that September measurements were less than June. The test statistic, p-value, mean of difference and 95% confidence interval for the difference are included. To provide relative magnitude of the effect size, the table includes “% Difference”, or the change in indicator values (%), calculated as: (September-June)/June. For the percent difference, the table includes mean, standard deviation (SD), and the range with minimum (min) and maximum (max) values). n=92
1.4 Interrelationships between biological indicators of soil health and other soil properties
Bulk C and N
Biological indicators were positively related with total C and N; POXC had the strongest relationships with bulk pools, R2 ranging 0.54-0.66 and MinC had the weakest relationships with bulk pools, R2 ranging 0.14-0.37 (Table 10). Generally, bulk C and N explained greater variation in the chemical extractions (POXC and ACE), relative to the biological incubations (MinC and PMN). September measures of ACE, MinC, and PMN had slightly weaker relationships with bulk C and N compared to June measures. Across sampling times, OM, TC and TN only explained 14-66% of the variation in POXC, ACE, MinC, and PMN, which supports prior research that bulk pools account for some, but not all, variation in the labile pools (Culman et al., 2013; Hurisso et al., 2016; Hurisso et al., 2018; Morrow et al., 2016). As in this study, previous research found chemical extractions had stronger relationships to bulk pools compared to biological incubations (Morrow et al., 2016; Sikora, 2020).

pH & macronutrients
pH was positively correlated with POXC at both sampling times (r=0.35 and r=0.45 in June and September), and OM (r=0.21). Generally, there were moderate to strong correlations between P, K, NO3- -N, and NH4+-N, and bulk C and N and chemical extractions (r > 0.3), but not with biological incubations. Correlations between biological indicators and inorganic N were strongest between June measures of nitrate and chemical extractions, POXC and ACE (r=0.58). While there were moderate to strong correlations between NH4+-N and chemical extractions in June, in September, NH4+-N was not correlated with any measures of C and N.
Texture
Clay, silt, and sand content were strongly correlated with MinC and PMN, but only weakly or not correlated with the other soil C and N values. However, sampling in September resulted in a weaker association between MinC and soil texture, compared to June. Soil texture was a strong driver for biological incubations, MinC and PMN, but contrary to other research, not for total C and N measures or chemical extractions. Negative relationships between MinC and PMN and sand content can be attributed to the challenge of forming organo-mineral complexes with sand particles (Arndt et al., 2022; Six et al., 2002; W. J. Wang et al., 2003).

*= p<0.05, **= p<0.01, ***= p<0.001
2. Land Use Effects
Pasture age & land use history
Pasture age had positive relationships will all measures except September MinC, representing up to 37% of the variation across response variables (Figure 3). The relationship between bulk pools produced slightly greater R2 values (0.33-0.37) compared to labile pools in June (0.19 – 0.28) or September (0.03-0.17). Sites previously fallowed had greater bulk and labile C and N (except for September MinC) compared to sites previously cropped. ACE was greater in sites previously in a row crop/hay rotation, compared to those that were exclusively hay, but no other soil metrics differed with prior agricultural system (Figure 4).
Points are colored blue for rotationally grazed pastures and red for continuously grazed. Regression lines and coefficient of determination (R2) between pasture age and soil metrics are included for significant relations (p<0.05). All but the relationship between C:N and pasture age were significant.
OM= organic matter (%); TC= total carbon (%); TN= total nitrogen (%); C:N= carbon-to-nitrogen ratio; POXC = permanganate oxidizable carbon (mg kg-1); ACE = autoclaved-citrate extractable protein (g kg-1); MinC = mineralizable carbon (mg kg-1); PMN = potentially mineralizable nitrogen (mg kg-1); NS=not significant
3. Management
3.1 Continuous vs. Rotational Grazing
Pastures that were continuously grazed had higher values for total C and N pools (OM, TC and TN), as well as labile pools (POXC, ACE, MinC, PMN) (Figure 5). In September, only POXC and PMN were greater in continuously grazed compared to rotationally grazed pastures, whereas in June, all labile C and N measurements were greater in continuously grazed pastures compared to those rotationally grazed (Figure 5). Greater C and N pools in continuously grazed pastures over rotationally grazed pastures contrasts to substantial evidence on the benefits of rotational grazing over continuous grazing for pasture productivity and soil quality (Byrnes et al., 2018; Conant et al., 2017; Mosier et al., 2021; Oates et al., 2011; Oates & Jackson, 2014; Rowntree et al., 2020; Teague et al., 2013; T. Wang et al., 2018).
Our findings are likely due to the nature of this dataset. In this dataset, the continuously grazed pastures were often older pastures that had never been tilled for agricultural production. Additionally, continuously grazed pastures in this study had low stocking rates which can help prevent overgrazing and soil degradation (Briske et al., 2008; Chen et al., 2015; Franzluebbers & Stuedemann, 2010; M. Zhang et al., 2018). Generally, greater C inputs and manure deposition, through outwintering, inputs of bedding and feed, and manure deposition can contribute to soil C and N (Yang et al., 2019).
A paired t-test was conducted on continuously and rotationally grazed pastures separately to evaluate the effect of sampling time on biological indicators of soil health (Table 12). In continuously grazed pastures, there was no change in POXC and decreases in ACE (average= -1.26 g kg-1), MinC (-74.84 mg kg-1), and PMN (-18.90 mg kg-1) from June to September. Comparatively, in rotationally grazed pastures, POXC increased (32.37 mg kg-1), ACE and PMN were unchanged, and MinC decreased (-43.14 mg kg-1), but to a lower magnitude than in continuously grazed sites, from June to September. On average, rotationally grazed pastures had an increase in POXC throughout the season and maintained ACE and PMN between sampling times. This change in biological indicators during the grazing season may support the benefits of well-managed rotational grazing compared to continuous grazing. Well-managed rotational grazing stimulates nutrient cycling, increases forage quantity and quality, improves plant community composition, and evenly distributes nutrient deposition from livestock, thus supporting C storage in the soil surface (Byrnes et al., 2018; Conant et al., 2017; Mosier et al., 2021; Oates et al., 2011; Paine et al., 1999; Teague & Kreuter, 2020; Wang et al., 2016).
Continuously and rotationally grazed systems are inherently very different, and many grazing management practices do not apply to continuously grazed pastures. To effectively evaluate pasture and grazing management decisions that apply to rotationally grazed pastures, just those pastures (n=78) are evaluated in the random forest statistical analysis.
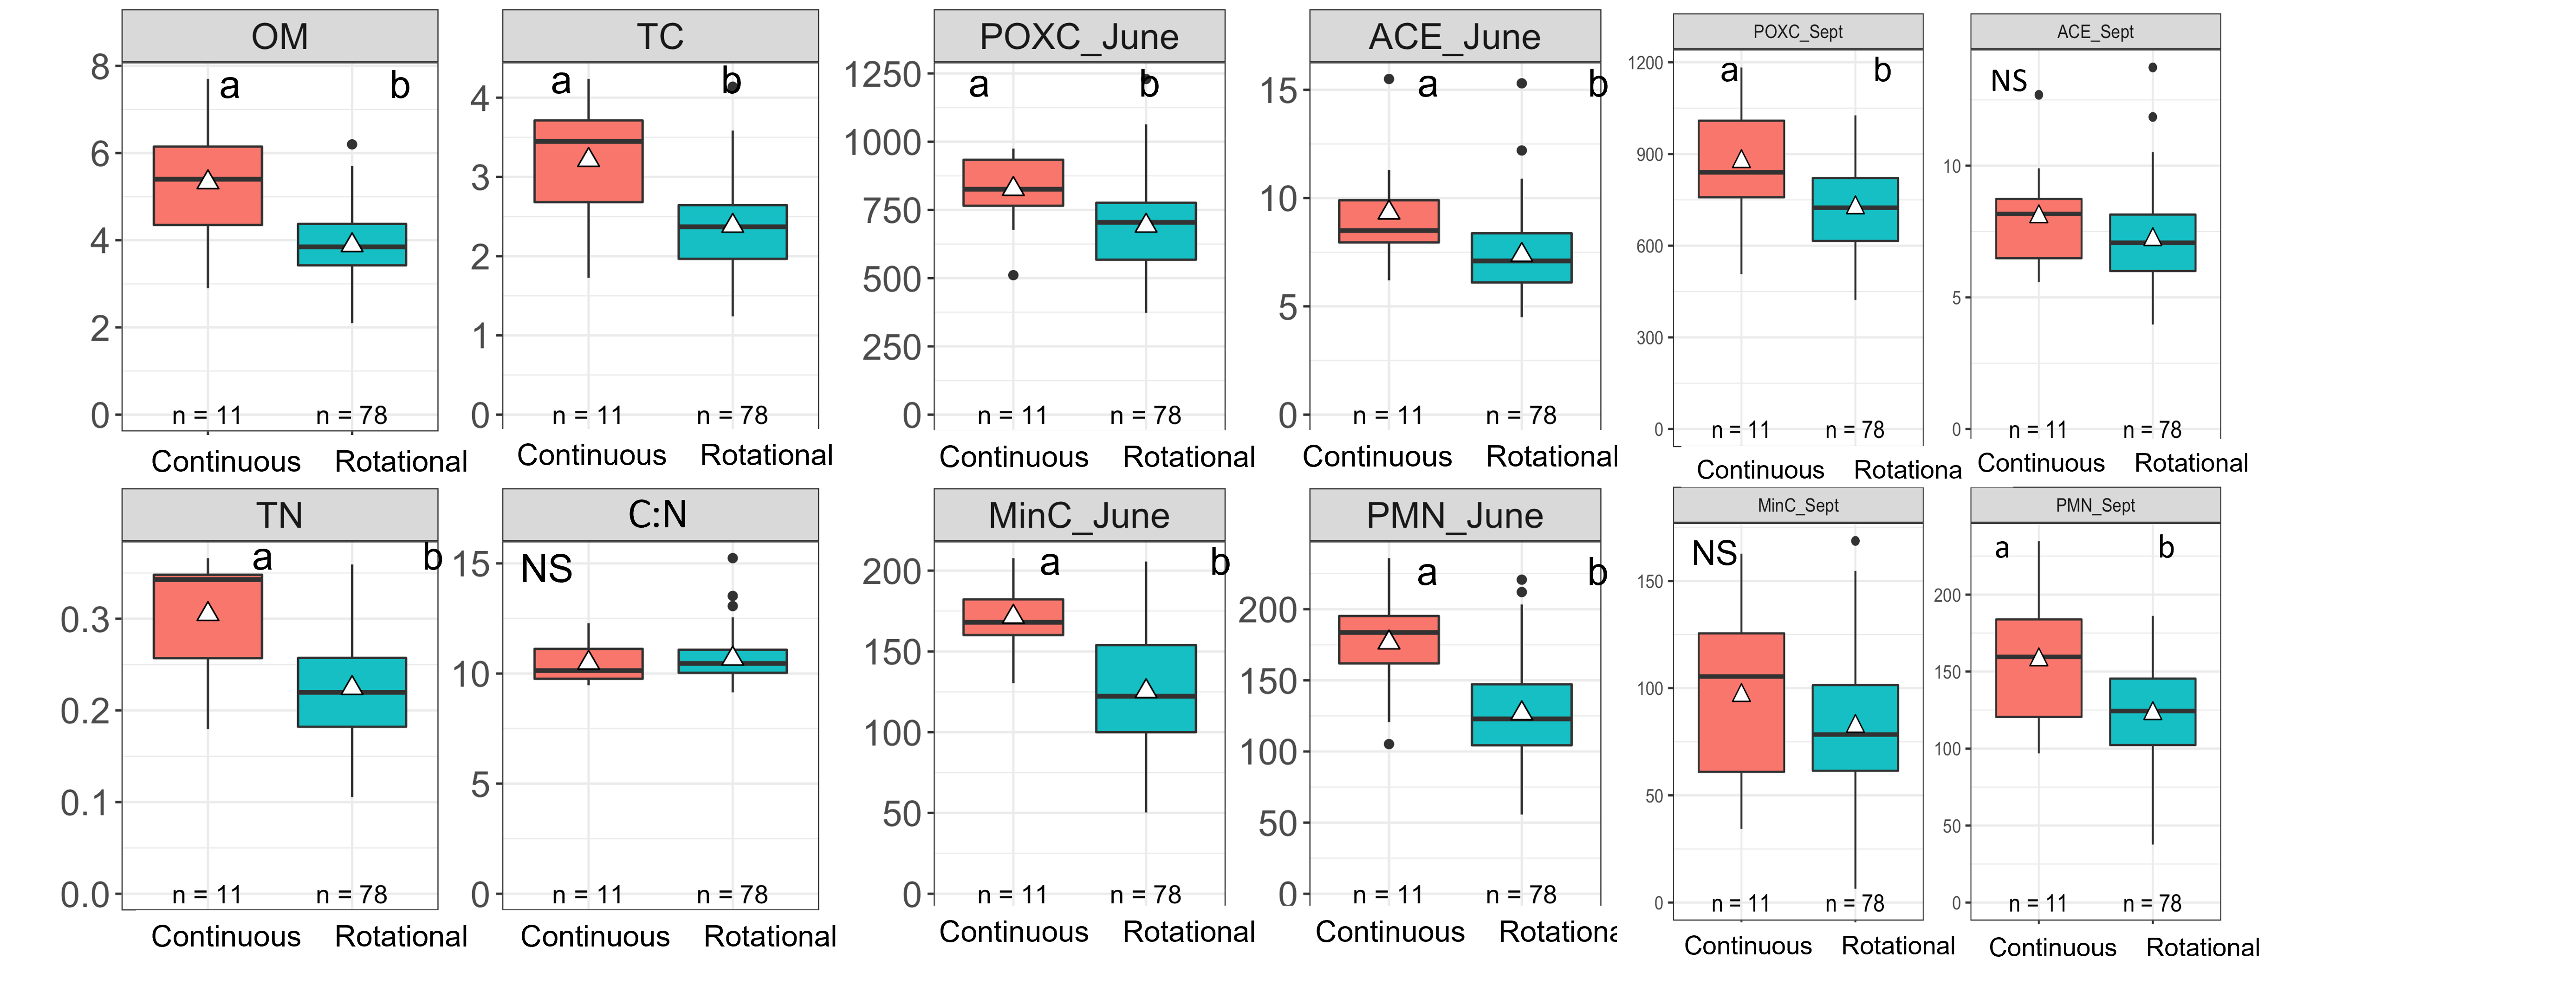
Sites were categorized as continuously or rotationally grazed pastures based on management data provided by the farmer. In the boxplot, the middle line indicates the median and boxes delimit first and third quartiles. Upper and lower whiskers represent 1.5 times the interquartile range or, if there were no observations beyond that range, the maximum and minimum values. Letters indicate significant differences (p-value < 0.05) among grazing category, determined through ANOVA and Fisher’s LSD.

Paired t-test analysis was conducted on continuously grazed (n=11) and rotationally grazed (n=78) pastures to evaluate if results differed based on grazing system. Positive values indicate that September measurements were greater than June; Negative values indicate that September measurements were less than June. The test statistic, p-value, mean of difference and 95% confidence interval for the difference are included. A p-value < 0.05 was significant; when p-value > 0.05, we did not reject the null hypothesis that the June and September values were equal and did not report a mean difference or 95% CI.
3.2 Management in rotationally grazed pastures
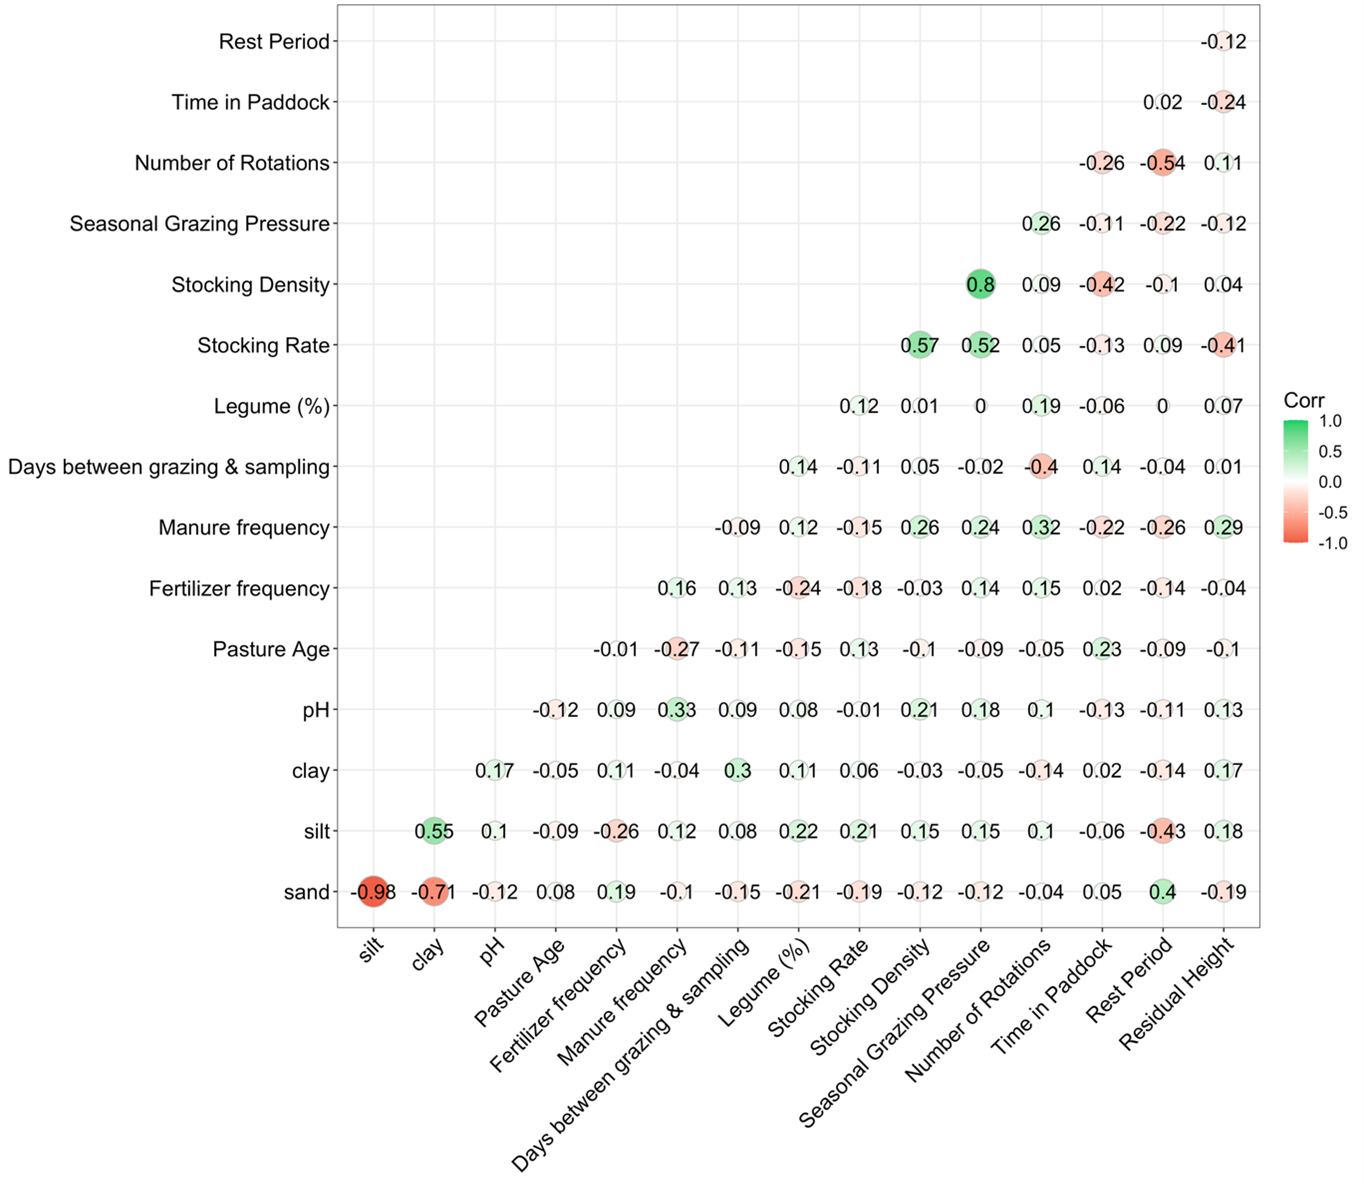
To evaluate grazing management practices specific to rotationally grazed pastures, the remaining analysis was conducted exclusively on rotationally grazed pastures (n=78). Among rotationally grazed pastures, stocking rate, stocking density and seasonal grazing pressure were strongly correlated (r³ 0.52) (Figure 6). Stocking density and time in paddock are negatively correlated (r=-0.42) since it is common to have higher stocking density for a shorter duration, or lower grazing pressure for a longer duration. Similarly, the number of rotations and rest period are negatively correlated (r=-0.54), since there are typically fewer grazing events if the paddock rests longer between grazing events. Higher stocking rate is associated with lower residual pasture height (r=-0.41), but this trend is not observed for stocking density. Pasture age has a moderate negative correlation with manure frequency (r=-0.27) and positive correlation with time in paddock (r=0.23). Accounting for inherent soil properties, there are also low to moderate correlations between sand content and legume composition (r=-0.21), stocking rate (r=-0.19), fertilizer frequency (r=0.19), and rest period (r=0.40).
3.3 Random Forest Analysis
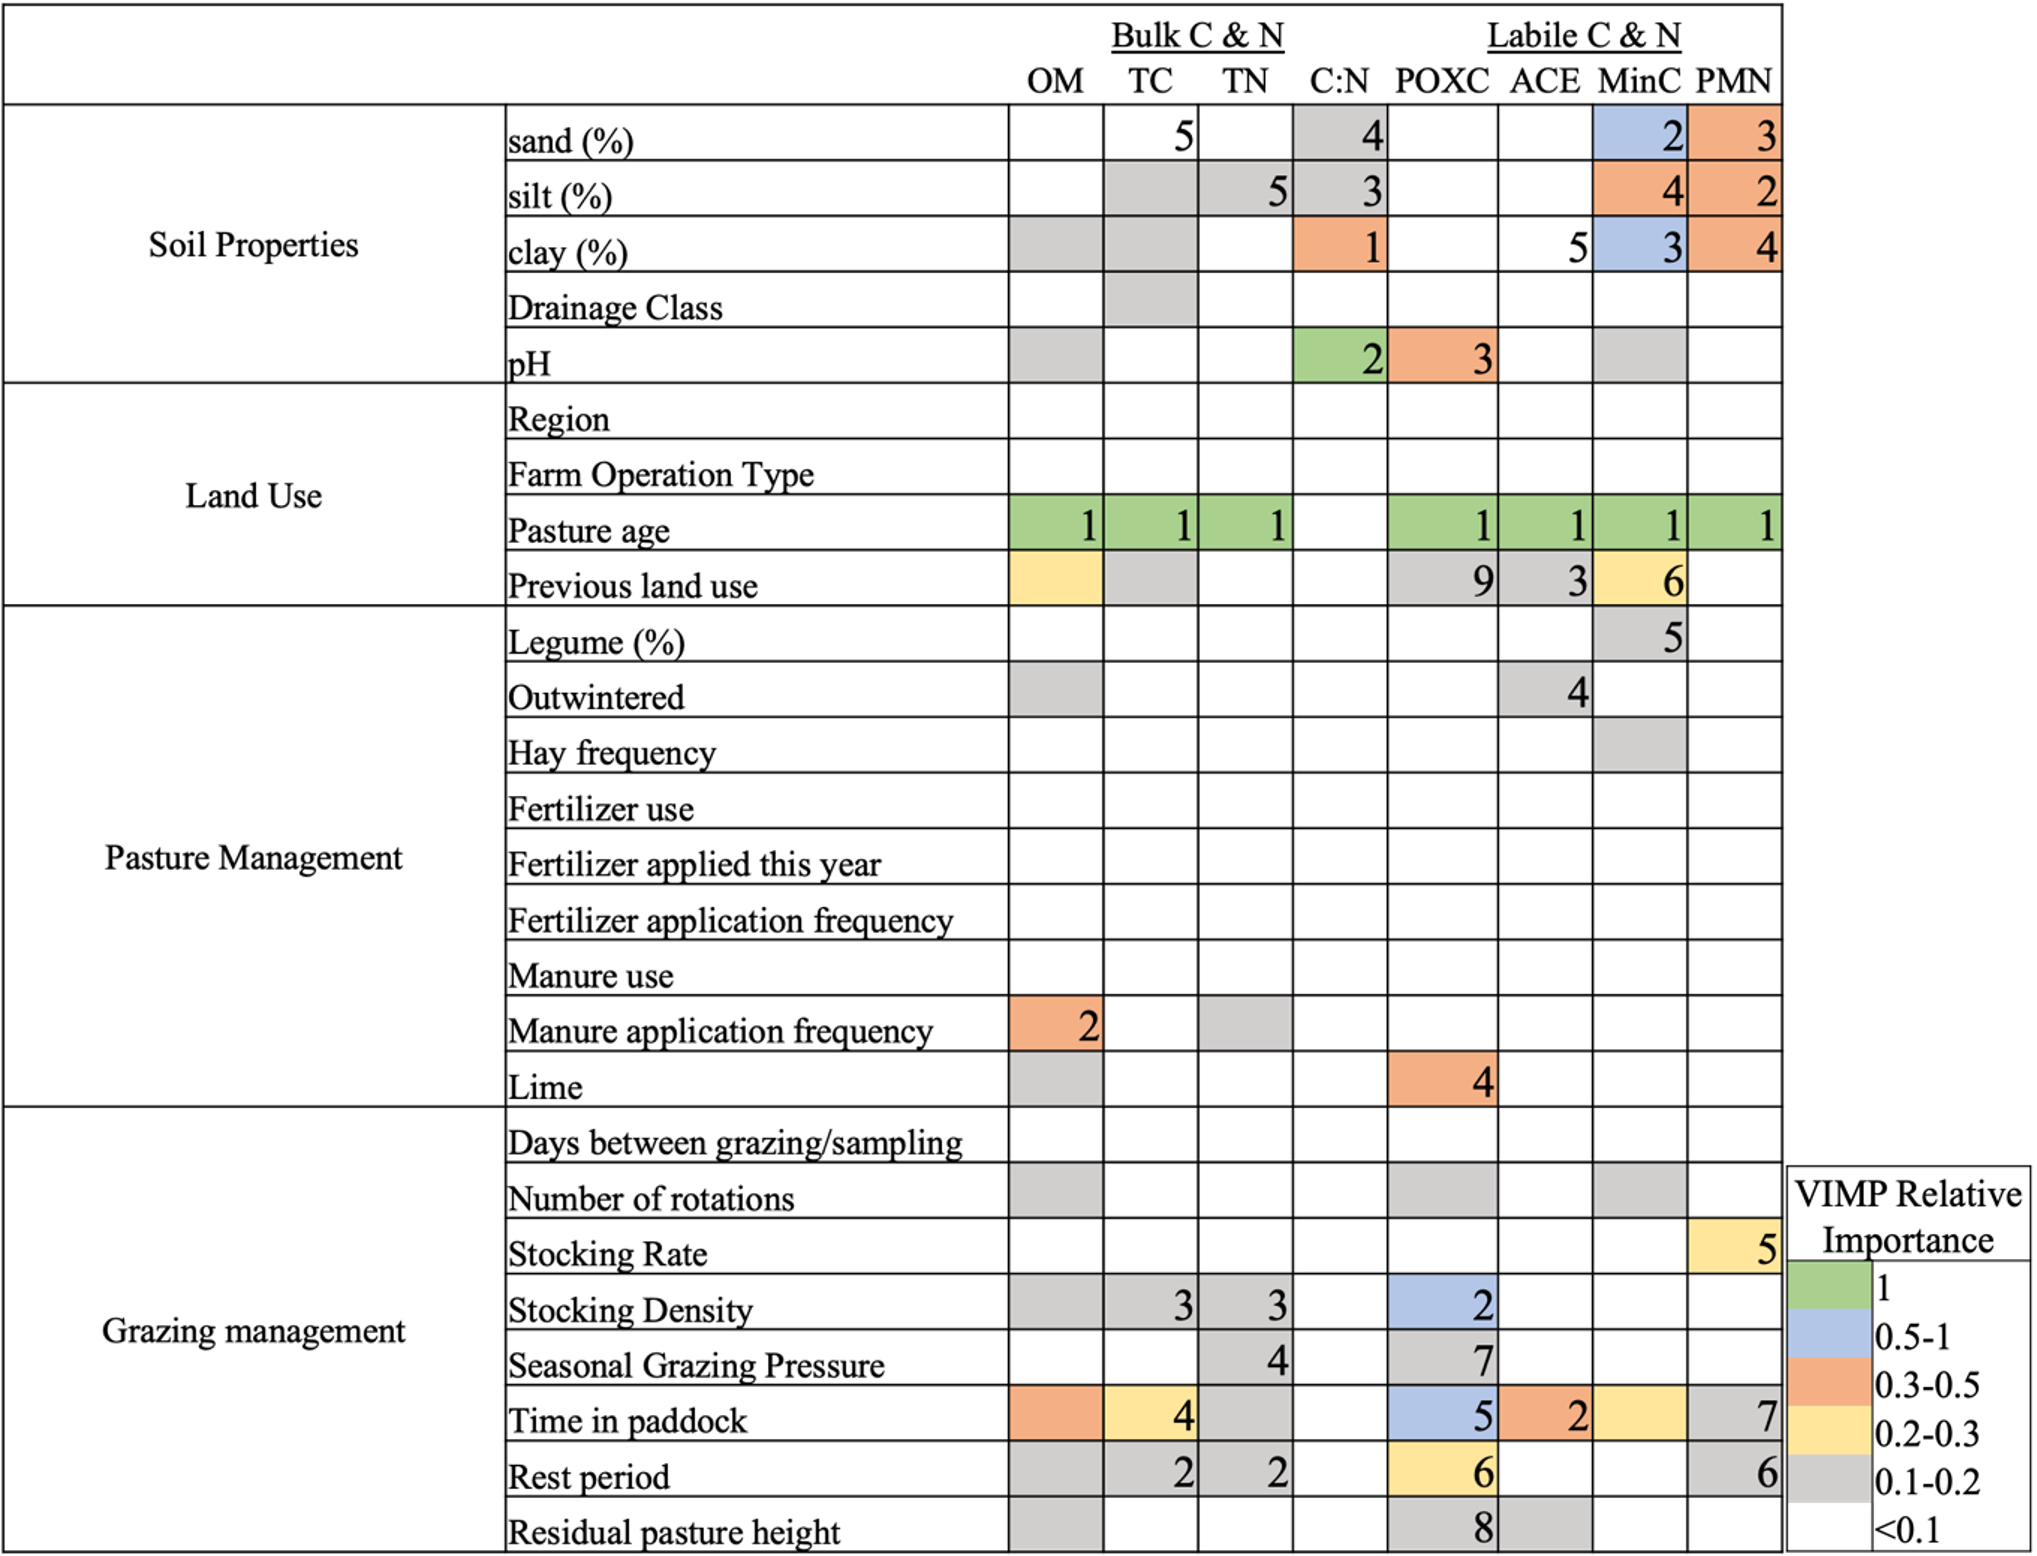
For each soil C and N measurement (column), the influence of each exploratory variable included in the analysis (rows) was determined by variable importance (VIMP) and average minimal depth (MD). VIMP represents how much the variable strengthened the model and corresponds to the cell color. The most important variable is assigned importance of 1 (colored green) and all other variables are given a relative importance based on how much it improved the model compared to the most important variable. Boxes are color coded based on VIMP for ease of interpretation (see key). The numbers in the cells correspond to ranking of importance according to average minimal depth (MD). MD reflects how close to the regression tree root node a variable appeared on average. Being closer to the root node signifies that, as a single split in the data, the variable explained larger variation in the dataset. Variables are ranked so that 1 corresponds with the variables closest to the root node. Only variables with minimal depth < 5 are numbered on the graph, as these are the most influential.
OM= organic matter (%); TC= total carbon (%); TN= total nitrogen (%); C:N= carbon-to-nitrogen ratio; POXC = permanganate oxidizable carbon (mg kg-1); ACE = autoclaved-citrate extractable protein (g kg-1); MinC = mineralizable carbon (mg kg-1); PMN = potentially mineralizable nitrogen (mg kg-1)
Variables of importance
Random forest analysis was run on June measurements of bulk and labile C and N. For all soil measurements the random forest analysis out of bag (OOB) R2 ranged from 0.32-0.45, POXC and PMN having the highest R2. Pasture age was the most important factor according to VIMP and minimal depth for all soil measurements except for C:N, which was most influenced by pH and texture (Figure 7). Grazing and pasture management practices were more important for OM, TC, TN, POXC and ACE, whereas texture factors more were important for MinC and PMN. Compared to bulk measurements of C and N, biological indicators of soil health had more factors with VIMP relative importance greater than 0.2. Time in paddock was identified as the most important grazing variable, ranging in relative importance from 0.2-0.6 for MinC, TC, ACE, OM, and POXC, in increasing order. Time in paddock was typically ranked higher by VIMP compared to minimal depth, signifying its importance at lower branches of the regression trees due to its interaction with other factors, rather than being highly predictive for the entire dataset. After time in paddock, other important grazing and management practices include stocking density or rate, rest period, manure application frequency, and residual pasture height. Sand, silt, and clay content had relative importance between 0.35-0.80 for MinC and PMN, but less than or equal to 0.1 for OM, TC, TN, POXC and ACE. pH was an important variable for POXC and C:N. Random forest analysis elucidates the responsiveness of biological indicators to management properties compared to bulk pools, since they had more variables of higher relative importance. This response is a reflection that soil health indicators are more sensitive than OM or SOC to management (Culman et al., 2012, 2013; Hurisso et al., 2016; Wander & Drinkwater, 2000).
Pasture Age
Pasture age was the most important factor for all June measures of soil C and N pools. The partial effect of pasture age shows rapid increases in predicted soil C and N values in the first 0-30 years after pasture establishment (Figure 8). However, over time the trend between pasture age and soil value differs by measurement. While predicted TN, POXC, MinC and PMN plateaued between 20-40 years, predicted OM, ACE and TC continued to increase with pasture age. These findings support previous studies that demonstrate gains in C in the soil surface with the duration of well-managed pasture (Becker et al., 2020; Rowntree et al., 2020; Sanford et al., 2012). Corresponding with trend lines in the random forest partial effect plots, other studies found rapid increases in soil C and N measures after conversion of cropland to pasture, with decreasing gains over time (Franzluebbers, Stuedemann, et al., 2000; Guillaume et al., 2021). As SOC and soil health increases, it becomes more challenging to maintain comparable increases (Abdalla et al., 2018; Arndt et al., 2022; Guillaume et al., 2021; McSherry & Ritchie, 2013). While this study includes a range of pastures 1-100 years in age, there is a substantial skew towards younger pastures and greater research on pastures between 20-100 years old is necessary to understand the nature of the trend line between soil health and pasture age among older pastures.
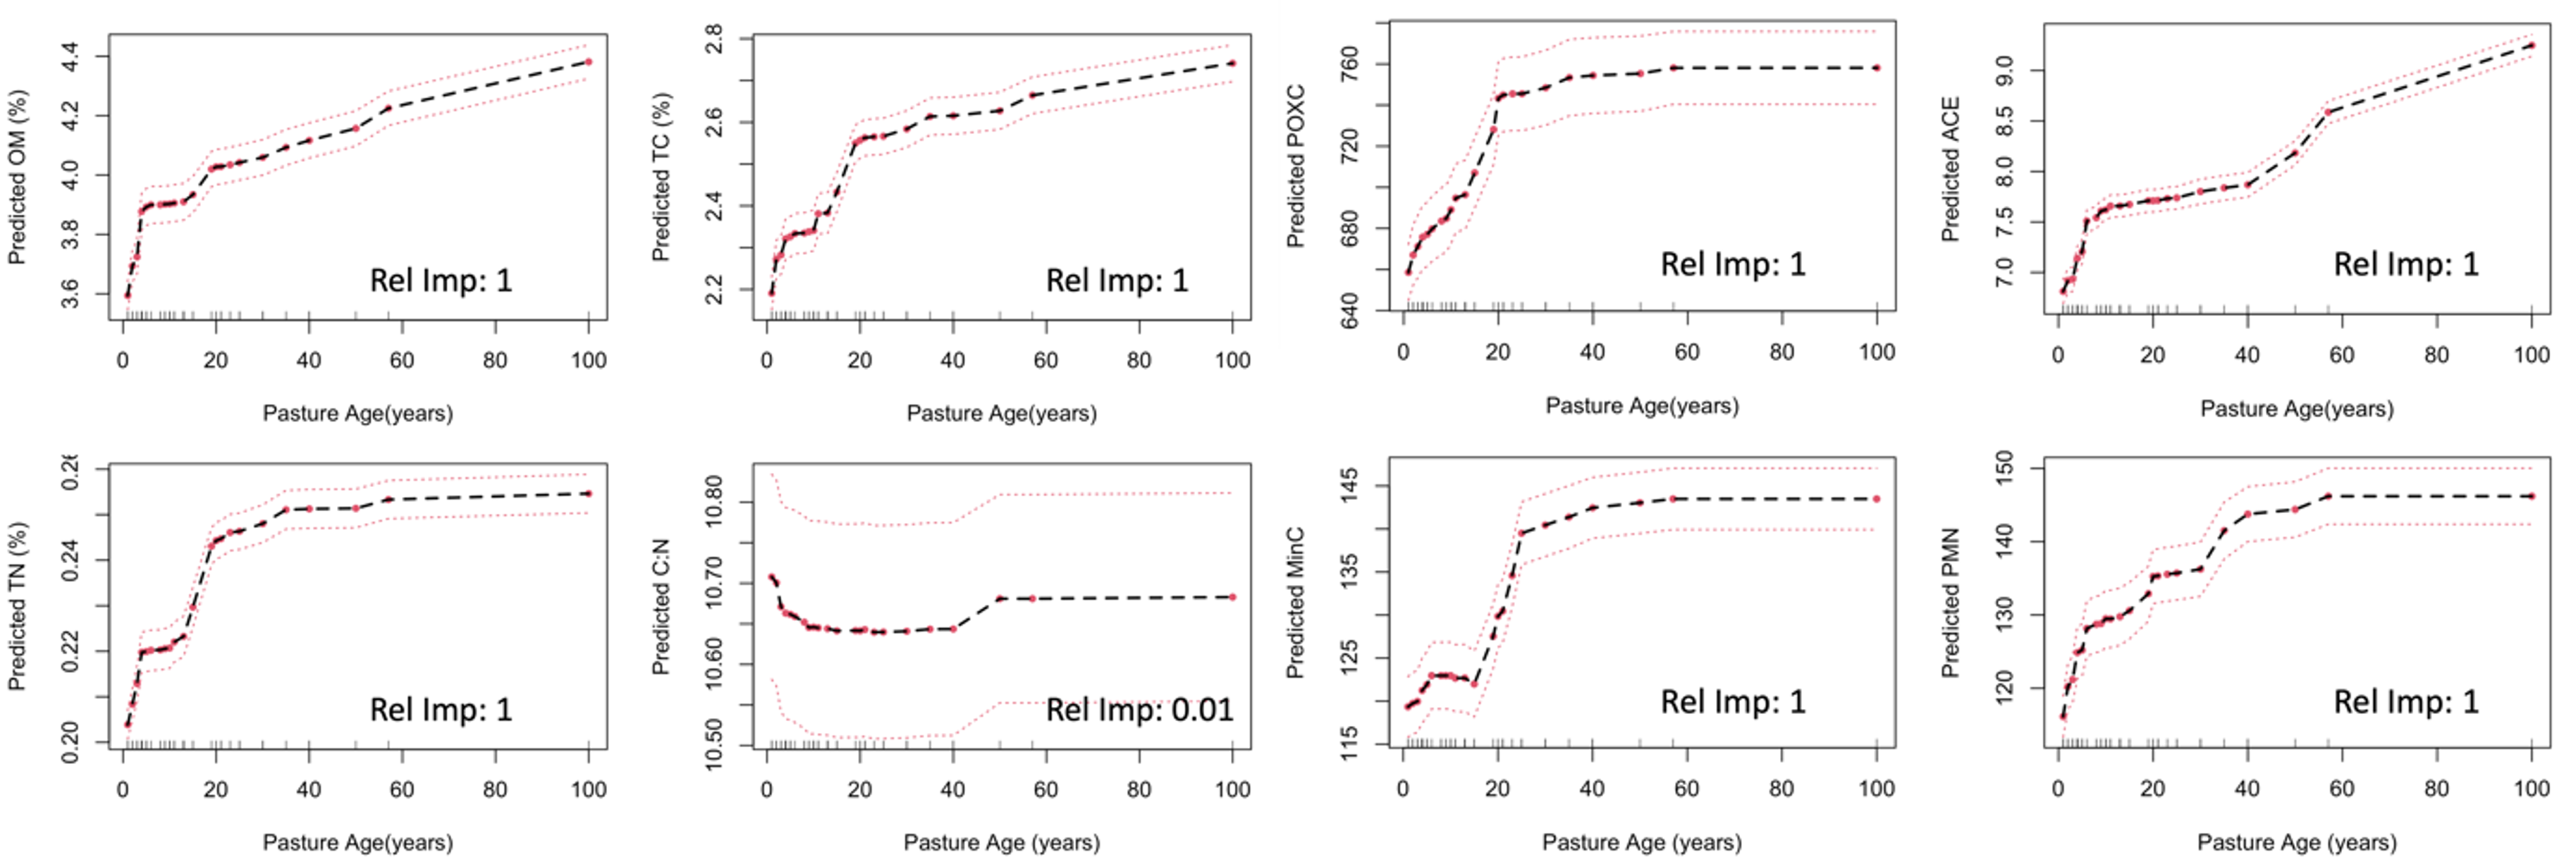
Predicted values are calculated as pasture age varies over observed values. Values are calculated over all remaining covariates, averaged, and plotted. Dashed red lines indicate +/- two standard deviations. Rel Imp= relative importance according to VIMP
Inherent soil properties
Texture content had similar trends in partial effect plots for all bulk and labile C and N measurements however, the importance of these texture properties is greater for MinC and PMN compared to the other soil measurements (Figure 9). Predicted values increased with clay content, plateauing between 10-20% clay content. Sand had a negative linear trendline and silt had a positive linear relationship with predicted MinC and PMN.
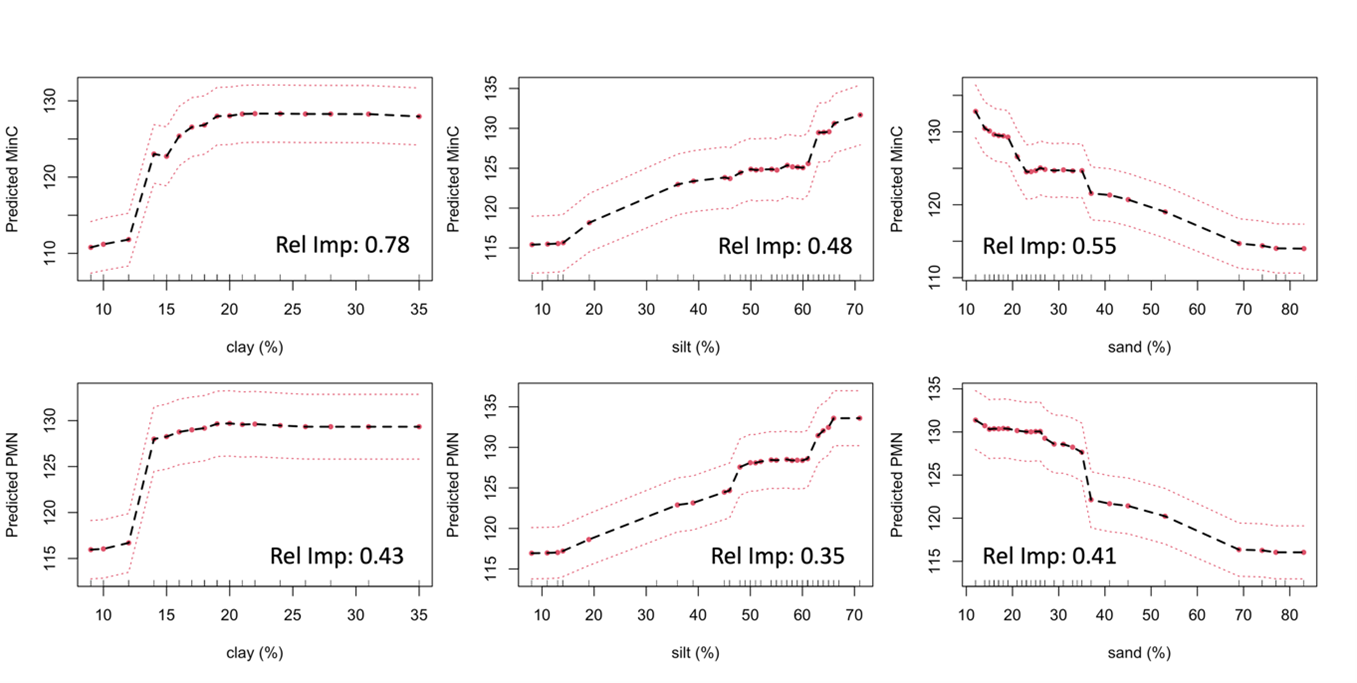
Predicted values of MinC and PMN are calculated as clay, silt and sand vary over observed values. Values are calculated over all remaining covariates, averaged, and plotted. Dashed red lines indicate +/- two standard deviations. Rel Imp= relative importance according to VIMP
Grazing management
Time in paddock less than one day was associated with greater predicted OM, TC, TN, POXC and ACE, but once grazing events were greater than 1d, there was no effect on predicted soil values (Figure 10). Comparatively, biological incubations, MinC and PMN, had weaker trends with time in paddock. Lower stocking density or stocking rate corresponded with lower predicted OM, TC, TN, POXC, and PMN (Figure 11). Predicted values for OM, TC, TN, and POXC increased until a stocking density of 50-100 AU/ha, at which point they plateaued. Predicted PMN and stocking rate followed the same trend, plateauing at 3 AU/ha. Predicted soil values increased with rest period, peaking around a rest period of 25-30 days, and then declining (Figure 12).
Partial effect plots demonstrated that greater soil health values corresponded with management intensive rotational grazing (MIRG) practices: medium to high grazing pressure, shorter grazing events, and adequate residual height, rest, and regrowth. In Wisconsin, studies have shown these practices to be beneficial to pasture health and productivity (Oates et al., 2011; Paine et al., 1999; Paine & Gildersleeve, 2011). The potential for plant health, C and N inputs, and soil quality to improve under these management practices is reflected in the partial effect trends between grazing management and biological soil health. A shorter grazing event with higher stocking densities and sufficient rest, can facilitate greater forage production, equal manure distribution, and weed suppression (Franzluebbers et al., 2012; Oates et al., 2011; L. K. Paine et al., 1999; Teague & Kreuter, 2020; T. Wang et al., 2016). Teague et al. (2015) corroborated this study’s findings that excessively long grazing events or recovery periods resulted in poorer plant recovery, which in turn may deter soil health.
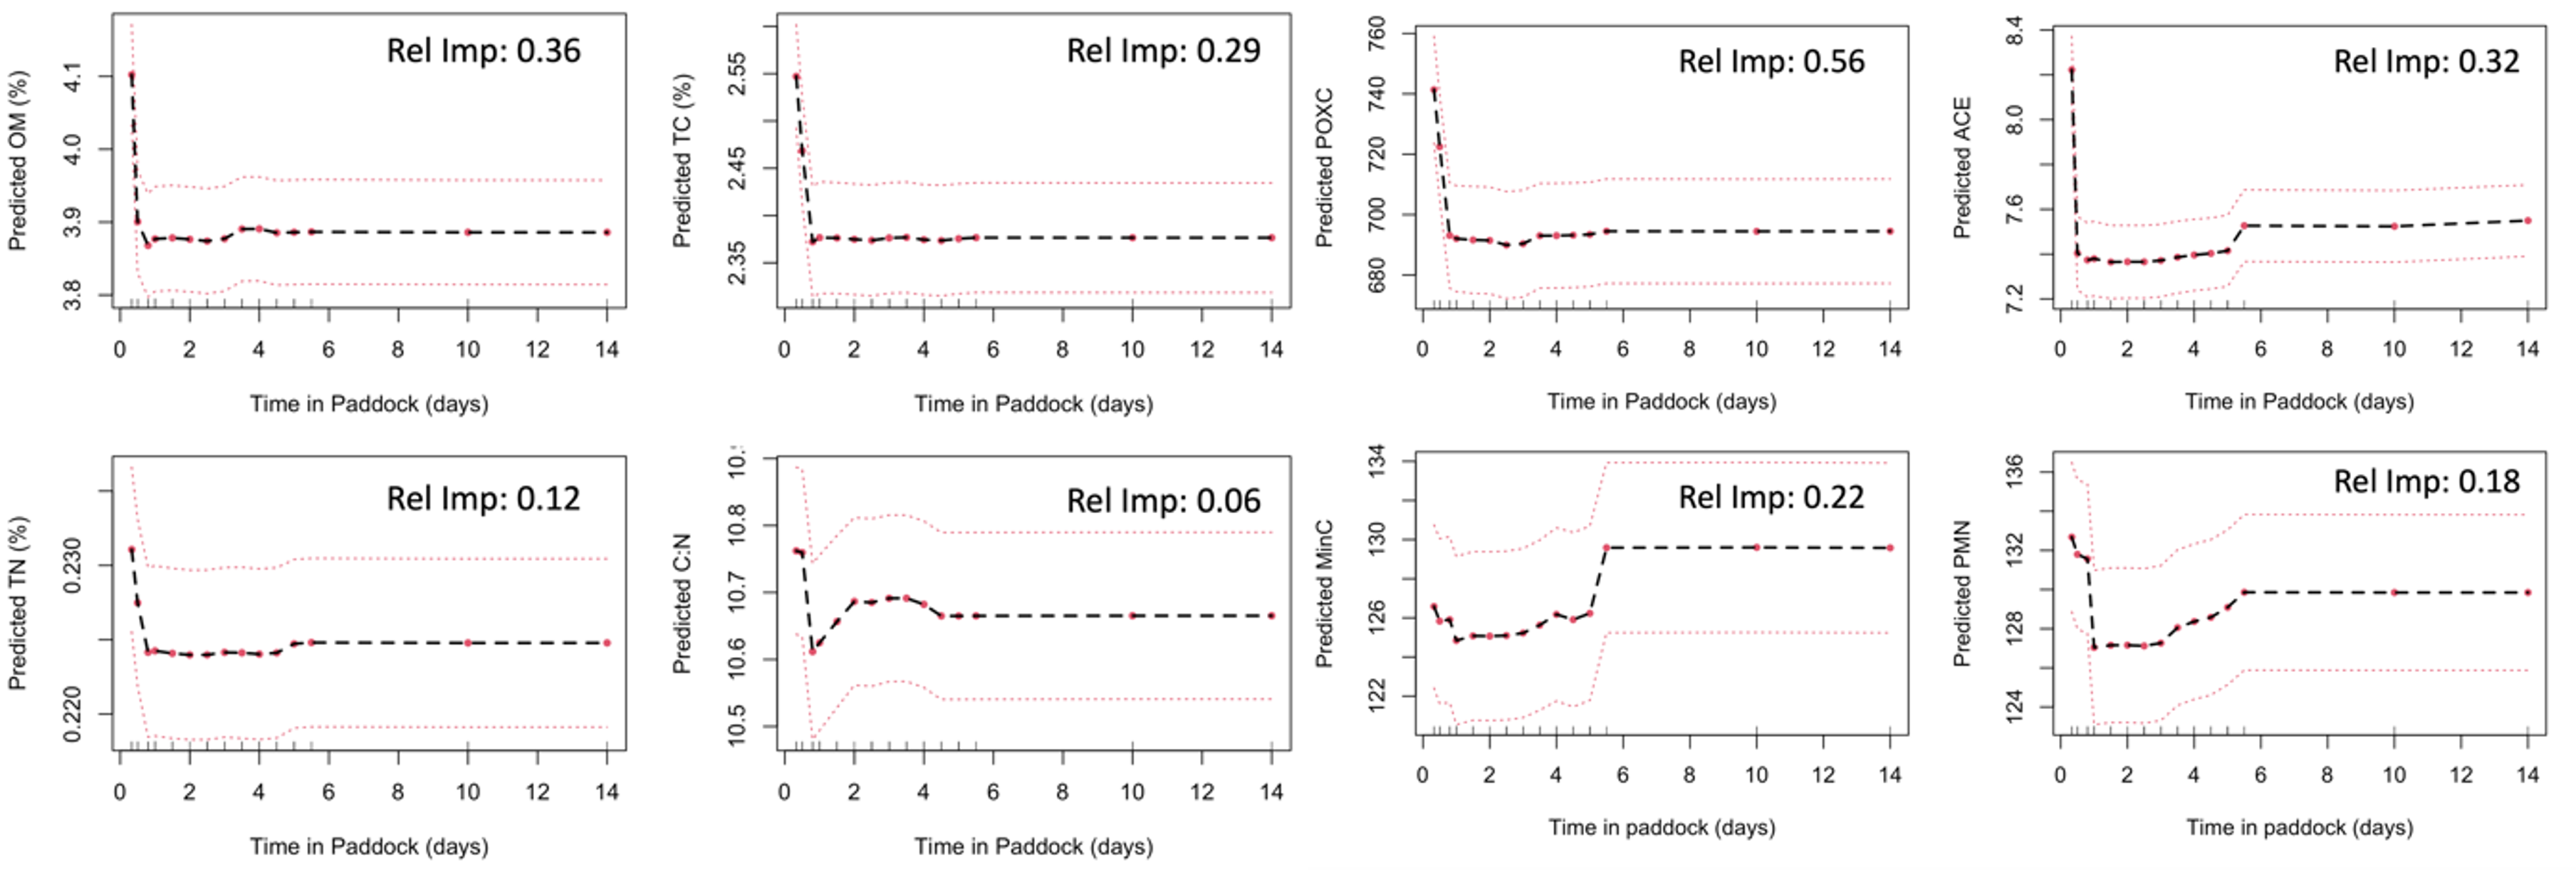
Predicted values are calculated as time in paddock per grazing event varies over observed values. Values are calculated over all remaining covariates, averaged, and plotted. Dashed red lines indicate +/- two standard deviations. Rel Imp= relative importance according to VIMP
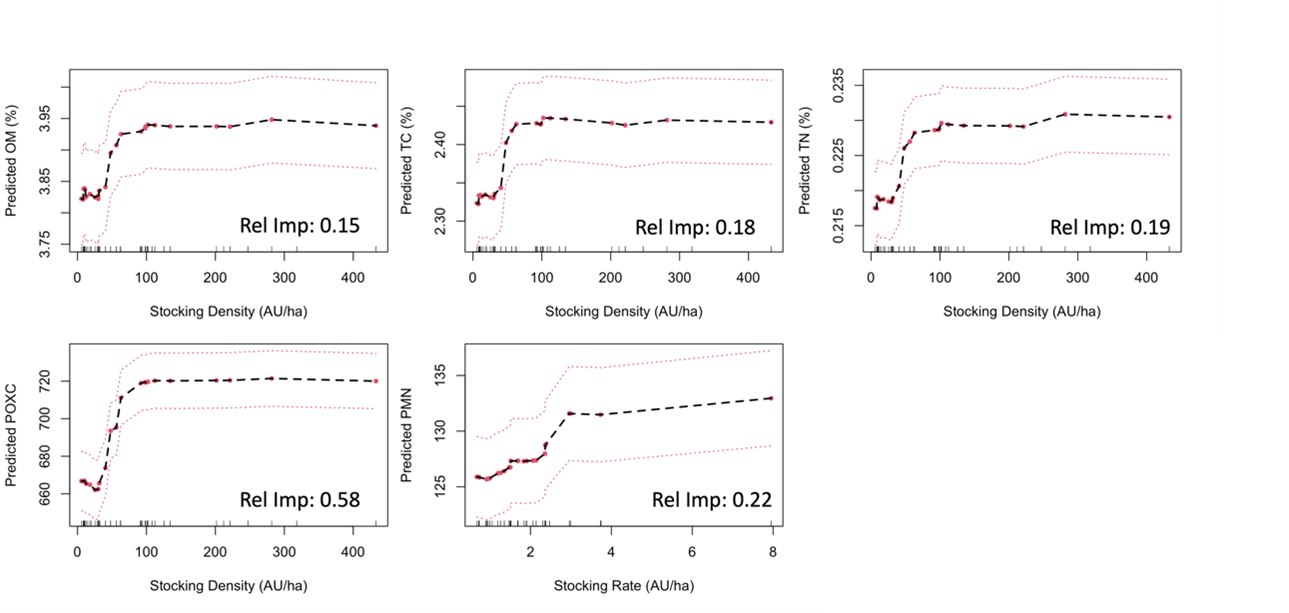
Predicted values are calculated as stocking density or stocking rate varies over observed values. Values are calculated over all remaining covariates, averaged, and plotted. Dashed red lines indicate +/- two standard deviations. Rel Imp= relative importance according to VIMP
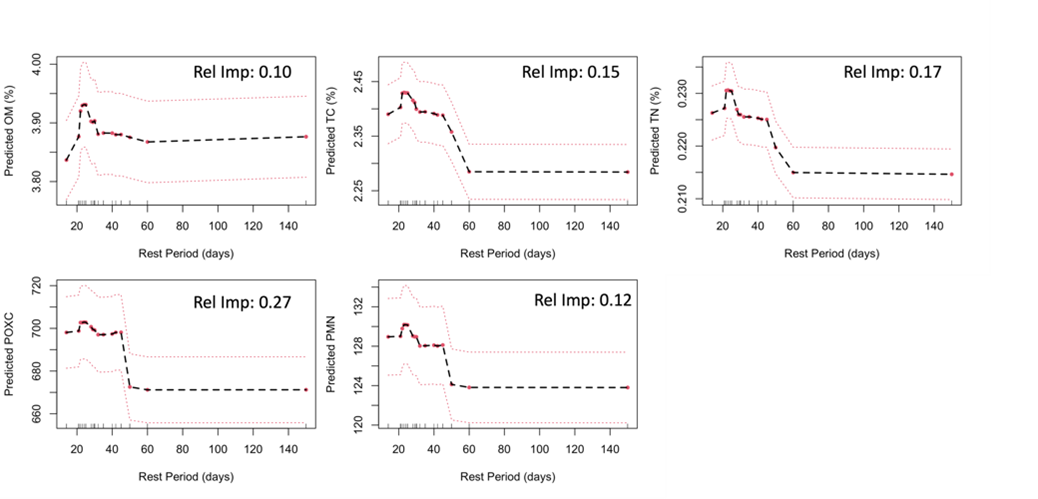
Predicted values are calculated as rest period varies over observed values. Values are calculated over all remaining covariates, averaged, and plotted. Dashed red lines indicate +/- two standard deviations. Rel Imp= relative importance according to VIMP
Pasture management
Pasture management practices, including outwintering, haying, pasture composition, manure applications and synthetic fertilizer use, were not as important to soil C and N values as other factors.
Conclusion
This Wisconsin pasture soil health assessment demonstrated that biological indicators of soil health reveal information into carbon and nitrogen pools that is not captured by total C and N measures nor soil nutrient tests. Further, moderate positive correlations between chemical extractions and biological incubations, and other soil proprieties reaffirm that POXC, ACE, MinC and PMN are not redundant measures. Our results also highlight the seasonal sensitivity of biological indicators of soil health and the relationship between soil texture and biological indicators, emphasizing the need to standardize sampling time and benchmark pasture soil health across texture groups.
This assessment demonstrated that there is a wide range of soil health values on pastures that is not explained by soil texture or total C and N pools. This unexplained variation may be attributed to land use and pasture management. Pasture age, grazing management and soil texture were the most important factors in explaining variation in soil C and N measures. Results suggest that pasture age drives total and labile C and N pools and due to decreasing gains in predicted soil values over time, future research should explore whether there is a maximum threshold of these measurements in pastures. There is also evidence that within rotationally grazed systems, MIRG practices, such as higher stocking densities with shorter grazing intervals and sufficient recovery time, are associated with greater biological indicators of soil health.
This study demonstrated that within pasture systems, biological indicators of soil health are variable, and sensitive to management as well as soil properties. But further value in soil health testing is dependent on the relationship between biological indicators of soil health and agronomic, economic, or environmental benefits. Therefore, it is important for soil health research to utilize a framework that links soil health indicators to desired soil functions and specific and pertinent outcomes, such as productivity, nutrient efficiency, soil C storage, greenhouse gas emissions, and water quality (Wade et al., 2022). Thus far, soil health research has been predominantly in row cropping systems, and it is imperative that pastures are represented in future research that evaluates relationships between soil health indicators, soil function and desired outcomes. Understanding the relationship between soil health indicators and essential ecosystem services is necessary to improve soil health in pasture soils and the broader agricultural landscape.
References
Abdalla, M., Hastings, A., Chadwick, D. R., Jones, D. L., Evans, C. D., Jones, M. B., Rees, R. M., & Smith, P. (2018). Critical review of the impacts of grazing intensity on soil organic carbon storage and other soil quality indicators in extensively managed grasslands. Agriculture, Ecosystems & Environment, 253, 62–81. https://doi.org/10.1016/j.agee.2017.10.023
Arndt, K. A., Campbell, E. E., Dorich, C. D., Grandy, A. S., Griffin, T. S., Ingraham, P., Perry, A., Varner, R. K., & Contosta, A. R. (2022). Initial soil conditions outweigh management in a cool-season dairy farm’s carbon sequestration potential. Science of The Total Environment, 809, 152195. https://doi.org/10.1016/j.scitotenv.2021.152195
Becker, A. E., Horowitz, L. S., Ruark, M. D., & Jackson, R. D. (2022). Surface‐soil carbon stocks greater under well‐managed grazed pasture than row crops. Soil Science Society of America Journal, 86(3), 758–768. https://doi.org/10.1002/saj2.20388
Bouyoucos, G.J. 1962. Hydrometer method improved for making particle size analysis of soils. Agron. J. 54:464-465.
Briske, D. D., Derner, J. D., Brown, J. R., Fuhlendorf, S. D., Teague, W. R., Havstad, K. M., Gillen, R. L., Ash, A. J., & Willms, W. D. (2008). Rotational Grazing on Rangelands: Reconciliation of Perception and Experimental Evidence. Rangeland Ecology & Management, 61(1), 3–17. https://doi.org/10.2111/06-159R.1
Byrnes, R. C., Eastburn, D. J., Tate, K. W., & Roche, L. M. (2018). A Global Meta-Analysis of Grazing Impacts on Soil Health Indicators. Journal of Environmental Quality, 47(4), 758–765. https://doi.org/10.2134/jeq2017.08.0313
Chen, W., Huang, D., Liu, N., Zhang, Y., Badgery, W. B., Wang, X., & Shen, Y. (2015). Improved grazing management may increase soil carbon sequestration in temperate steppe. Scientific Reports, 5(1), 10892. https://doi.org/10.1038/srep10892
Conant, R. T., Cerri, C. E. P., Osborne, B. B., & Paustian, K. (2017). Grassland management impacts on soil carbon stocks: A new synthesis. Ecological Applications, 27(2), 662–668. https://doi.org/10.1002/eap.1473
Crookston, B. S., Yost, M. A., Bowman, M., Veum, K., Cardon, G., & Norton, J. (2021). Soil health spatial-temporal variation influence soil security on Midwestern, U.S. farms. Soil Security, 3, 100005. https://doi.org/10.1016/j.soisec.2021.100005
Culman, S. W., Snapp, S. S., Freeman, M. A., Schipanski, M. E., Beniston, J., Lal, R., Drinkwater, L. E., Franzluebbers, A. J., Glover, J. D., Grandy, A. S., Lee, J., Six, J., Maul, J. E., Mirksy, S. B., Spargo, J. T., & Wander, M. M. (2012). Permanganate Oxidizable Carbon Reflects a Processed Soil Fraction that is Sensitive to Management. Soil Science Society of America Journal, 76(2), 494–504. https://doi.org/10.2136/sssaj2011.0286
Culman, S. W., Snapp, S. S., Green, J. M., & Gentry, L. E. (2013). Short‐ and Long‐Term Labile Soil Carbon and Nitrogen Dynamics Reflect Management and Predict Corn Agronomic Performance. Agronomy Journal, 105(2), 493–502. https://doi.org/10.2134/agronj2012.0382
Diederich, K. M., Ruark, M. D., Krishnan, K., Arriaga, F. J., & Silva, E. M. (2019). Increasing Labile Soil Carbon and Nitrogen Fractions Require a Change in System, Rather Than Practice. Soil Science Society of America Journal, 83(6), 1733–1745. https://doi.org/10.2136/sssaj2018.11.0458
Drinkwater, L. E., Cambardella, C. A., Reeder, J. D., & Rice, C. W. (1996). Methods for Assessing Soil Quality (pp. 217–229). Soil Science Society of America. https://doi.org/10.2136/sssaspecpub49.c13
Fine, A. K., van Es, H. M., & Schindelbeck, R. R. (2017). Statistics, Scoring Functions, and Regional Analysis of a Comprehensive Soil Health Database. Soil Science Society of America Journal, 81(3), 589–601. https://doi.org/10.2136/sssaj2016.09.0286
Franzluebbers, A. J., Haney, R. L., Honeycutt, C. W., Schomberg, H. H., & Hons, F. M. (2000). Flush of Carbon Dioxide Following Rewetting of Dried Soil Relates to Active Organic Pools. Soil Science Society of America Journal, 64(2), 613–623. https://doi.org/10.2136/sssaj2000.642613x
Franzluebbers, A. J., Paine, L. K., Winsten, J. R., Krome, M., Sanderson, M. A., Ogles, K., & Thompson, D. (2012). Well-managed grazing systems: A forgotten hero of conservation. Journal of Soil and Water Conservation, 67(4), 100A-104A. https://doi.org/10.2489/jswc.67.4.100A
Franzluebbers, A. J., & Stuedemann, J. A. (2010). Surface Soil Changes during Twelve Years of Pasture Management in the Southern Piedmont USA. Soil Science Society of America Journal, 74(6), 2131–2141. https://doi.org/10.2136/sssaj2010.0034
Franzluebbers, A. J., Stuedemann, J. A., Schomberg, H. H., & Wilkinson, S. R. (2000). Soil organic C and N pools under long-term pasture management in the Southern Piedmont USA. Soil Biology and Biochemistry, 32(4), 469–478. https://doi.org/10.1016/S0038-0717(99)00176-5
Guillaume, T., Bragazza, L., Levasseur, C., Libohova, Z., & Sinaj, S. (2021). Long-term soil organic carbon dynamics in temperate cropland-grassland systems. Agriculture, Ecosystems & Environment, 305, 107184. https://doi.org/10.1016/j.agee.2020.107184
Hurisso, T. T., Culman, S. W., Horwath, W. R., Wade, J., Cass, D., Beniston, J. W., Bowles, T. M., Grandy, A. S., Franzluebbers, A. J., Schipanski, M. E., Lucas, S. T., & Ugarte, C. M. (2016). Comparison of Permanganate-Oxidizable Carbon and Mineralizable Carbon for Assessment of Organic Matter Stabilization and Mineralization. Soil Science Society of America Journal, 80(5), 1352–1364. https://doi.org/10.2136/sssaj2016.04.0106
Hurisso, T. T., Culman, S. W., & Zhao, K. (2018). Repeatability and Spatiotemporal Variability of Emerging Soil Health Indicators Relative to Routine Soil Nutrient Tests. Soil Science Society of America Journal, 82(4), 939–948. https://doi.org/10.2136/sssaj2018.03.0098
Hurisso, T. T., Moebius‐Clune, D. J., Culman, S. W., Moebius‐Clune, B. N., Thies, J. E., & Es, H. M. (2018). Soil Protein as a Rapid Soil Health Indicator of Potentially Available Organic Nitrogen. Agricultural & Environmental Letters, 3(1), 180006. https://doi.org/10.2134/ael2018.02.0006
McSherry, M. E., & Ritchie, M. E. (2013). Effects of grazing on grassland soil carbon: A global review. Global Change Biology, 19(5), 1347–1357. https://doi.org/10.1111/gcb.12144
Morrow, J. G., Huggins, D. R., Carpenter-Boggs, L. A., & Reganold, J. P. (2016). Evaluating Measures to Assess Soil Health in Long‐Term Agroecosystem Trials. Soil Science Society of America Journal, 80(2), 450–462. https://doi.org/10.2136/sssaj2015.08.0308
Mosier, S., Apfelbaum, S., Byck, P., Calderon, F., Teague, R., Thompson, R., & Cotrufo, M. F. (2021). Adaptive multi-paddock grazing enhances soil carbon and nitrogen stocks and stabilization through mineral association in southeastern U.S. grazing lands. Journal of Environmental Management, 288, 112409. https://doi.org/10.1016/j.jenvman.2021.112409
Oates, L. G., & Jackson, R. D. (2014). Livestock Management Strategy Affects Net Ecosystem Carbon Balance of Subhumid Pasture. Rangeland Ecology & Management, 67(1), 19–29. https://doi.org/10.2111/REM-D-12-00151.1
Oates, L. G., Undersander, D. J., Gratton, C., Bell, M. M., & Jackson, R. D. (2011). Management-Intensive Rotational Grazing Enhances Forage Production and Quality of Subhumid Cool-Season Pastures. Crop Science, 51(2), 892–901. https://doi.org/10.2135/cropsci2010.04.0216
Paine, L., & Gildersleeve, R. (2011). A Summary of Dairy Grazing Practices in Wisconsin. 8.
Paine, L. K., Undersander, D., & Casler, M. D. (1999). Pasture Growth, Production, and Quality Under Rotational and Continuous Grazing Management. Journal of Production Agriculture, 12(4), 569–577. https://doi.org/10.2134/jpa1999.0569
Rowntree, J. E., Stanley, P. L., Maciel, I. C. F., Thorbecke, M., Rosenzweig, S. T., Hancock, D. W., Guzman, A., & Raven, M. R. (2020). Ecosystem Impacts and Productive Capacity of a Multi-Species Pastured Livestock System. Frontiers in Sustainable Food Systems, 4, 544984. https://doi.org/10.3389/fsufs.2020.544984
Sanford, G. R., Posner, J. L., Jackson, R. D., Kucharik, C. J., Hedtcke, J. L., & Lin, T.-L. (2012). Soil carbon lost from Mollisols of the North Central U.S.A. with 20 years of agricultural best management practices. Agriculture, Ecosystems & Environment, 162, 68–76. https://doi.org/10.1016/j.agee.2012.08.011
Sikora, M. (2020). Inherent soil properties, farm management, and biological soil health in grain systems [Master's Thesis]. University of Wisconsin-Madison.
Six, J., Conant, R. T., Paul, E. A., & Paustian, K. (2002). Stabilization mechanisms of soil organic matter: Implications for C-saturation of soils. 22.
Stevenson, B. A., Hunter, D. W. F., & Rhodes, P. L. (2014). Temporal and seasonal change in microbial community structure of an undisturbed, disturbed, and carbon-amended pasture soil. Soil Biology and Biochemistry, 75, 175–185. https://doi.org/10.1016/j.soilbio.2014.04.010
Teague, R., & Kreuter, U. (2020). Managing Grazing to Restore Soil Health, Ecosystem Function, and Ecosystem Services. Frontiers in Sustainable Food Systems, 4, 534187. https://doi.org/10.3389/fsufs.2020.534187
Teague, R., Provenza, F., Kreuter, U., Steffens, T., & Barnes, M. (2013). Multi-paddock grazing on rangelands: Why the perceptual dichotomy between research results and rancher experience? Journal of Environmental Management, 128, 699–717. https://doi.org/10.1016/j.jenvman.2013.05.064
Wade, J., Culman, S. W., Hurisso, T. T., Miller, R. O., Baker, L., & Horwath, W. R. (2018). Sources of Variability that Compromise Mineralizable Carbon as a Soil Health Indicator. Soil Science Society of America Journal, 82(1), 243–252. https://doi.org/10.2136/sssaj2017.03.0105
Wade, J., Culman, S. W., Gasch, C. K., Lazcano, C., Maltais-Landry, G., Margenot, A. J., Martin, T. K., Potter, T. S., Roper, W. R., Ruark, M. D., Sprunger, C. D., & Wallenstein, M. D. (2022). Rigorous, empirical, and quantitative: A proposed pipeline for soil health assessments. Soil Biology and Biochemistry, 170, 108710. https://doi.org/10.1016/j.soilbio.2022.108710
Wang, T., Richard Teague, W., Park, S. C., & Bevers, S. (2018). Evaluating long-term economic and ecological consequences of continuous and multi-paddock grazing—A modeling approach. Agricultural Systems, 165, 197–207. https://doi.org/10.1016/j.agsy.2018.06.012
Wang, T., Teague, W. R., & Park, S. C. (2016). Evaluation of Continuous and Multipaddock Grazing on Vegetation and Livestock Performance—A Modeling Approach. Rangeland Ecology & Management, 69(6), 457–464. https://doi.org/10.1016/j.rama.2016.07.003
Wang, W. J., Dalal, R. C., Moody, P. W., & Smith, C. J. (2003). Relationships of soil respiration to microbial biomass, substrate availability and clay content. Soil Biology and Biochemistry, 35(2), 273–284. https://doi.org/10.1016/S0038-0717(02)00274-2
Yang, Y., Ashworth, A. J., DeBruyn, J. M., Willett, C., Durso, L. M., Cook, K., Moore, Jr., P. A., & Owens, P. R. (2019). Soil bacterial biodiversity is driven by long-term pasture management, poultry litter, and cattle manure inputs. PeerJ, 7, e7839. https://doi.org/10.7717/peerj.7839
Zhang, M., Li, X., Wang, H., & Huang, Q. (2018). Comprehensive analysis of grazing intensity impacts soil organic carbon: A case study in typical steppe of Inner Mongolia, China. Applied Soil Ecology, 129, 1–12. https://doi.org/10.1016/j.apsoil.2018.03.008
Educational & Outreach Activities
Participation summary:
Outreach activities spanned individual, local, and national levels. Each participant received individualized soil health reports and consultations. Research results were summarized into a handout (uploaded) and presented at two regional pasture walks with farmers and conservationists. Research findings were shared at presentations and webinars for Iowa Learning Farms, the Wisconsin Agribusiness Classic, and local field days. Research results were presented at the Agronomy Science of America- Crop Science Society of America- Soil Science Society of America (ASA-CSSA-SSSA) Annual Meetings in 2021 and 2022, poster and oral presentations respectively. A public thesis seminar of the work was held in person and virtually at the University of Wisconsin-Madison, and the thesis is publicly available. One journal article has been published by the Journal of Agricultural & Environmental Letters and two more journal publications will be submitted over the next year.
Project Outcomes
This project had many positive outcomes that will continue to shape pasture soil health research and outreach efforts. Through applied, one-on-one soil health testing and individualized reporting, participating graziers gained unique insight and increased understanding into their pastures’ soil health, how they compared to other farms in the region, and interpreting soil health tests. Additionally, the farming and research community gained increased understanding of how biological indicators of soil health are influenced by inherent soil properties, sampling time, land use history, and grazing and pasture management practices. This information can be used to help producers understand how their pastures may respond to the adoption of new management. It also provides evidence that researchers should continue to explore and measure soil health indicators on pastures, in hopes of understanding how to improve soil health in pastures and what ecosystem services graziers can expect with improvements in soil health. Overall, this will help identify best management practices for soil health, and the adoption of practices for improved farm economic, environmental and social wellbeing.
During the course of this project, we improved our understanding of pasture soil health, how it compared to annual cropping systems, and what factors influenced soil health indicators. We identified the importance of pasture age, soil texture, grazing management and sampling time on soil C and N measures. Results suggest that pasture age drives total and labile C and N pools and due to decreasing gains in predicted soil values over time, future research should explore whether there is a maximum threshold of these measurements in pastures. There is also evidence that within rotationally grazed systems, MIRG practices, such as higher stocking densities with shorter grazing intervals and sufficient recovery time, are associated with greater biological indicators of soil health. In addition, it was surprising to see that pasture management practices like haying frequency, manure application, percentage of legumes, and fertilizer use did not explain a lot of variation in soil C and N measures, as this may limit graziers’ management options to improve soil health values. This assessment demonstrated that pasture soil health was variable and sensitive to land management, supporting the idea that continued research to connect soil health indicators to agronomic, economic or environmental benefits in pasture systems is beneficial.
Information Products
- Cropping systems with perennial vegetation and livestock integration promote soil health
- Soil Health and Pasture Management- 2021 Report
- THE INFLUENCE OF CROPPING SYSTEM, SOIL PROPERTIES AND MANAGEMENT ON BIOLOGICAL INDICATORS OF SOIL HEALTH IN WISCONSIN PASTURES
- The influence of inherent soil properties and management on soil health indicators of Wisconsin pastures