Final Report for GNE14-076
Project Information
Commercial production of wild blueberry is heavily dependent on insect pollination. Wild bees are the most effective pollinators of wild blueberry, but we know little about their nesting and foraging habits relative to wild blueberry fields. We surveyed wild bee communities in crop and non-crop land cover to create field data-informed parameters to increase prediction accuracy of the InVEST Crop Pollination model in the wild blueberry production landscape in Maine. Accurate predictions of wild bee abundance in the Maine wild blueberry production landscape will aid crop growers and natural resource managers in decision-making regarding pollination management, such as the use of honey bee hives and habitat restoration, and inform efforts in wild bee conservation. We will share model output directly to crop growers through a collaboratively developed internet-based tool that displays predicted wild bee abundance in the landscape surrounding crop fields.
Introduction:
Wild blueberry (Vaccinium angustifolium Aiton) agriculture is an economic asset in Maine. Crop production has steadily increased over the last decade; in 2015, the harvest was 101 million pounds, an increase of 25.5 million pounds since 2006. Crop value over this period averaged $60 million (NASS 2016). Commercial production of wild blueberry is heavily dependent on insect pollination (Usui et al. 2005). Commercial production of wild blueberry (Vaccinium angustifolium Aiton) is heavily dependent on insect pollination. Wild bees are the most effective pollinators of wild blueberry, however, little is known about their nesting and foraging habits relative to wild blueberry fields, so crop growers rely on managed honey bee hives to fulfill pollination requirements. Pollination can be one of growers’ greatest management costs (Yarborough and D’Appollonio 2017). As demand for rented honey bee hives has increased with growing crop production, the average cost to rent a honey bee hive has also steadily increased owing to high rates of overwintering colony die-offs (Bee Informed Partnership 2016). These costs further motivate growers to explore the potential of wild pollinator resources. The InVEST Crop Pollination Model predicts wild bee abundance across agricultural landscapes, but we found that predictive accuracy of the model needed improvement when the model was applied to the Maine wild blueberry production landscape. The initial application of the InVEST model in Maine wild blueberry relied on expert opinion to rank the suitability of wild bee habitat for predictive purposes. While expert opinion has been used in other applications, our experience involved highly variable expert opinions, creating imprecise model parameters that affected model prediction accuracy. Therefore, we sought to inform model parameters with objective field-collected data to reduce parameter variability and improve prediction accuracy. Accurate predictions of wild bee abundance in the Maine wild blueberry production landscape will aid crop growers and natural resource managers in decision-making regarding pollination management, such as the use of honey bee hives and habitat restoration, and inform efforts in wild bee conservation. We will share model output directly to crop growers through a collaboratively developed internet-based tool that displays predicted wild bee abundance in the landscape surrounding crop fields.
Bee Informed Partnership. 2016. Results of a National Survey of Managed Honey Bee Colony Loss, 2006-2015. Accessed March 10, 2017 via https://beeinformed.org/results-categories/winter-loss/
Groff, S.C., C.S. Loftin, F.A. Drummond, S. Bushmann, and B. McGill. 2016. Parameterization of the InVEST Crop Pollination Model to spatially predict abundance of wild blueberry (Vaccinium angustifolium Aiton) native bee pollinatiors in Maine, USA. Environmental Modelling & Software 79: 1-9.
National Agricultural Statistics Service (NASS). 2016. 2015 Wild Blueberries. Accessed March 10, 2017, via https://www.nass.usda.gov/Statistics_by_State/New_England_includes/Publications/Current_News_Release/2016/2015%20Wild%20Blueberry%20Release.pdf.
Usui, M., P.G. Kevan, and M. Obbard. 2005. Pollination and breeding systems of lowbush blueberry Vaccinium angustifolium Ait. and V. myrtilloides Michx. (Ericaceae), in the boreal forest. The Canadian Field-Naturalist 119: 48-57.
Yarborough, D., and J. D’Appollonio. 2017. Wild Blueberry Enterprise Budget. University of Maine Cooperative Extension Fact Sheet No. 260. Accessible online at https://extension.umaine.edu/blueberries/factsheets/marketing-and-business-management/blueberry-enterprise-budget/
Objective 1: Quantify bee community richness and abundance in non-blueberry cover types throughout Maine’s lowbush blueberry growing region.
This objective has been completed, although additional analyses are ongoing. Bee community data were collected in 2014 and 2015 and all specimens were identified by taxonomic experts throughout winter 2015 and spring 2016. We have quantified bee communities across cover types and subsequently expanded our analyses to include the influence of varying landscape pattern found between Maine’s wild blueberry growing regions. This provides a more complete assessment of how wild bees use Maine’s wild blueberry landscape.
Objective 2: Compare predicted bee abundance from a spatially-explicit bee abundance model informed by expert opinion to abundance informed by bee community field data.
This objective is in progress. We used the bee community data completed in spring 2016 to create a series of field-data informed model parameters for the InVEST Crop Pollination model. We are running models informed by these parameters and expect to complete comparisons in spring 2017.
Objective 3: Develop a pollination tool for lowbush blueberry growers that presents information on native bee communities in and around crop fields, including an estimate of pollination service on their crop fields.
We developed BeeMapper, an internet based tool that displays output from the InVEST Crop Pollination model, in 2015-2016. We worked collaboratively with crop growers by obtaining their feedback on prototypes of the tool throughout development and incorporating their suggestions into the final tool. The official launch of the tool will follow completion of Objective 2.
Cooperators
Research
Objective 1: We conducted field surveys of wild bees, nesting resources, and foraging resources at 56 sites throughout Maine’s wild blueberry production landscape in 2014 and 2015 (Figure 1). Sites were located in two growing regions: the Downeast region, associated with large, commercially intensive blueberry fields and a coniferous forest/forested wetland matrix, and the Midcoast region, associated with small, often organically grown blueberry fields and a deciduous forest matrix with more urban and other agricultural land cover. We established seven study blocks: 2 Midcoast in 2014, 3 Midcoast in 2015, and 2 Downeast in 2015. Each block contained eight sites, one of each land cover type previously identified as important for wild bees and used in existing runs of the InVEST Crop Pollination model. We surveyed each site three times, in early, mid, and late summer to align with indices used in InVEST Crop Pollination modeling. Each survey consisted of a 24 hour bowl trapping period and 30 minutes of live netting wild bees along a 100 m transect. We also recorded species and patch area for all blooming flowers during each survey period. We assessed nesting suitability of each survey site at the beginning of the study period, for which we ranked presence of open soil and woody debris that serve as homes for wild bees.
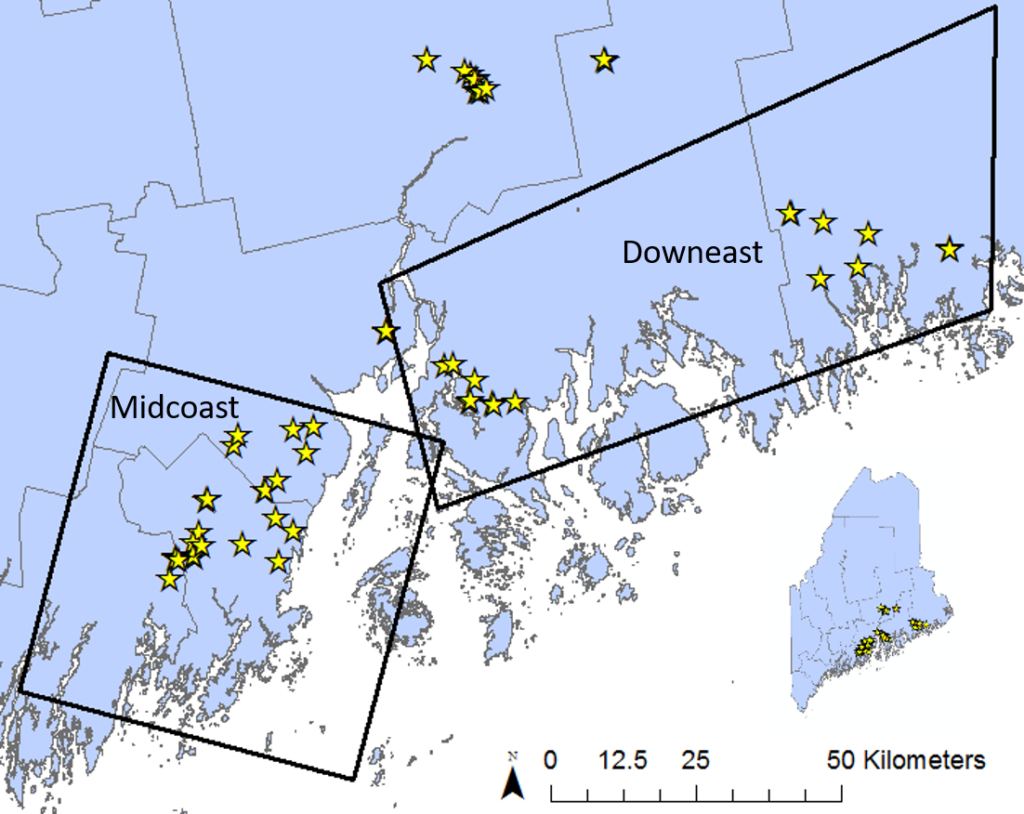
Figure 1. Study site locations across Maine’s wild blueberry landscape, 2014-2015.
Objective 2: Using the bee community data from Objective 1, we created a series of InVEST Crop Pollination model parameters informed by field-collected data. The model uses a suite of habitat suitability scores to predict bee abundance across a landscape. These scores represent ground nesting resources, cavity nesting resources, and foraging resources in early, mid, and late summer. We collected these data in the field (Objective 1), and we also are testing proxy parameters using various groupings of our bee community data. These include number of ground or cavity nesting bees found in each land cover type, bee diversity associated with each land cover type, and size of bee found in each land cover type. We will compare the output of models run using each of these parameters and choose the most accurate output for display in the BeeMapper web tool developed for Objective 3.
Objective 3: We developed a web-based tool called BeeMapper using previously developed output of the InVEST model based solely on expert opinion (Groff et al. 2016). After determining the contents of the tool during a meeting with the Maine Wild Blueberry Commission Advisory Board, I conducted six testing sessions of the initial BeeMapper prototype to solicit comments from individual growers and small groups of growers in late winter 2015. Growers selected for testing use a diverse range of crop management techniques and manage crop fields throughout Maine’s Downeast wild blueberry growing region. During these sessions, growers independently navigated BeeMapper and gave suggestions for improvement on all aspects of the tool, including ease of use, data display and interpretation, and addressing uncertainty in the data. We also asked growers to describe how they would use the data provided by BeeMapper to make pollination management decisions on their farms. We used feedback from these testing sessions to revise BeeMapper, which we then presented to growers in fall 2015. We tested this second prototype of BeeMapper with six additional growers in winter 2016. This second round of testing sessions focused on using an initial draft of tool documentation to navigate the tool and interpret the map output. We also assessed the usefulness of supporting material provided on the BeeMapper website and website navigation during these testing sessions. Launch of BeeMapper for public access is awaiting the most accurate InVEST Crop Pollination Model output as described in Objective 2 and is expected to be completed in summer 2017.
Groff, S.C., C.S. Loftin, F.A. Drummond, S. Bushmann, and B. McGill. 2016. Parameterization of the InVEST Crop Pollination Model to spatially predict abundance of wild blueberry (Vaccinium angustifolium Aiton) native bee pollinatiors in Maine, USA. Environmental Modelling & Software 79: 1-9.
Objective 1: We collected 2,094 bees from 135 species in our surveys (Table 1). These specimens were identified to species by taxonomic experts. The most common species was the orange-banded bumble bee (Bombus ternarius), with 379 specimens collected. Other common bees included the sweat bees Agapostemon virescens (153 specimens), Augochlorella aurata (126 specimens), and Lasioglossum cressonii (116 specimens). We collected two new state records for Maine: the miner bee Andrena personata and the sweat bee Lasioglossum platyparium. Both of these species are common in the Mid-Atlantic region; these records represent the furthest north these species have been reported.
Table 1. Bee species collected across Maine’s wild blueberry landscape, 2014-2015. Species are grouped by taxonomic family and listed in order of abundance. Species identifications were verified by Sara Bushmann, Sam Droege, Jason Gibbs, and Rob Jean.
|
Name |
Count |
|
Family Andrenidae |
|
|
Andrena nivalis |
30 |
|
Andrena carlini |
28 |
|
Andrena wilkella |
24 |
|
Andrena miserabilis |
17 |
|
Andrena nasonii |
13 |
|
Andrena carolina |
11 |
|
Andrena placata |
7 |
|
Calliopsis andreniformis |
7 |
|
Andrena canadensis |
6 |
|
Andrena hirticincta |
5 |
|
Andrena cressonii |
3 |
|
Andrena nigrihirta |
3 |
|
Andrena vicina |
3 |
|
Andrena crataegi |
2 |
|
Andrena rufosignata |
2 |
|
Andrena rugosa |
2 |
|
Andrena virginiana |
2 |
|
Pseudopanurgus sp. |
2 |
|
Andrena alleghaniensis |
1 |
|
Andrena bradleyi |
1 |
|
Andrena hippotes |
1 |
|
Andrena milwaukeensis |
1 |
|
Andrena miranda |
1 |
|
Andrena personata |
1 |
|
Andrena regularis |
1 |
|
Andrena spireana |
1 |
|
Andrena thaspii |
1 |
|
Andrena wheeler |
1 |
|
Trachandrena sp. |
1 |
|
Family Apidae |
|
|
Bombus ternarius |
379 |
|
Bombus impatiens |
91 |
|
Bombus vagans |
85 |
|
Bombus bimaculatus |
61 |
|
Bombus borealis |
21 |
|
Bombus perplexus |
16 |
|
Peponapis pruinosa |
16 |
|
Anthidium oblongatum |
15 |
|
Bombus terricola |
15 |
|
Ceratina mikmaqi |
12 |
|
Nomada cressonii |
9 |
|
Melissodes druriella |
6 |
|
Melissodes desponsa |
5 |
|
Nomada luteoloides |
5 |
|
Nomada maculata |
4 |
|
Bombus sandersoni |
2 |
|
Ceratina calcarata |
2 |
|
Melissodes apicata |
2 |
|
Melissodes illata |
2 |
|
Nomada denticulata |
2 |
|
Anthidium manicatum |
1 |
|
Anthophora terminalis |
1 |
|
Bombus griseocollis |
1 |
|
Epeolus scutellaris |
1 |
|
Nomada articulata |
1 |
|
Nomada bidentate group |
1 |
|
Nomada depressa |
1 |
|
Nomada illinoensis/sayi |
1 |
|
Nomada inepta |
1 |
|
Nomada nr.imbricata |
1 |
|
Nomada perplexa |
1 |
|
Nomada sayi |
1 |
|
Family Halictidae |
|
|
Agapostemon virescens |
153 |
|
Augochlorella aurata |
126 |
|
Lasioglossum cressonii |
116 |
|
Lasioglossum versatum |
85 |
|
Lasioglossum leucocomum |
72 |
|
Lasioglossum planatum |
54 |
|
Halictus confusus |
38 |
|
Halictus ligatus |
38 |
|
Halictus rubicundus |
38 |
|
Lasioglossum pectorale |
37 |
|
Lasioglossum zonulum |
35 |
|
Lasioglossum leucozonium |
27 |
|
Lasioglossum admirandum |
23 |
|
Lasioglossum tegulare |
19 |
|
Lasioglossum acuminatum |
15 |
|
Sphecodes sp. |
13 |
|
Lasioglossum versans |
12 |
|
Lasioglossum coriaceum |
11 |
|
Lasioglossum truncatum |
10 |
|
Lasioglossum oblongum |
9 |
|
Lasioglossum perpunctatum |
8 |
|
Lasioglossum subviridatum |
8 |
|
Lasioglossum ephialtum |
6 |
|
Lasioglossum hitchensi |
6 |
|
Lasioglossum timothyi |
6 |
|
Lasioglossum weemsi |
6 |
|
Augochlora pura |
5 |
|
Lasioglossum ellisiae |
5 |
|
Lasioglossum macoupinense |
5 |
|
Sphecodes davisii |
5 |
|
Agapostemon texanus |
4 |
|
Augochloropsis metallica fulgida |
4 |
|
Lasioglossum albipenne |
4 |
|
Lasioglossum cinctipes |
4 |
|
Lasioglossum lineatulum |
4 |
|
Lasioglossum nigroviride |
4 |
|
Lasioglossum heterognathum |
3 |
|
Lasioglossum nymphaearum |
3 |
|
Lasioglossum quebecense |
3 |
|
Lasioglossum smilacinae |
3 |
|
Lasioglossum subversans |
3 |
|
Lasioglossum imitatum |
2 |
|
Lasioglossum pilosum |
2 |
|
Lasioglossum trigeminium |
2 |
|
Dialictus sp. |
1 |
|
Lasioglossum abanci |
1 |
|
Lasioglossum anomalum |
1 |
|
Lasioglossum foxii |
1 |
|
Lasioglossum katherineae |
1 |
|
Lasioglossum laevissimum |
1 |
|
Lasioglossum paradmirandum |
1 |
|
Lasioglossum platyparium |
1 |
|
Sphecodes cressonii/atlantis |
1 |
|
Family Colletidae |
|
|
Hylaeus modestus |
23 |
|
Hylaeus affinis |
14 |
|
Colletes simulans |
7 |
|
Hylaeus annulatus |
5 |
|
Hylaeus mesillae |
5 |
|
Colletes americanus |
1 |
|
Family Megachilidae |
|
|
Megachile latimanus |
12 |
|
Megachile gemula |
9 |
|
Megachile relativa |
7 |
|
Osmia atriventris |
5 |
|
Hoplitis producta |
4 |
|
Megachile inermis |
4 |
|
Megachile rotundata |
3 |
|
Osmia bucephala |
2 |
|
Osmia pumila |
2 |
|
Heriades carinata |
1 |
|
Megachile melanophaea |
1 |
|
Osmia inermis |
1 |
|
Osmia inspergens |
1 |
|
Osmia lignaria |
1 |
|
Osmia virga |
1 |
We found significantly different bee communities across growing regions (p=0.008) and between land cover types (p<0.001). Sites in the Midcoast region harbored slightly fewer bees than sites Downeast (p=0.05), though this relationship may be caused by very high bee abundance and richness collected at two Downeast sites. Wild blueberry fields held the most abundant bee communities (484 specimens) followed by urban areas (477 specimens) and forest edge (359 specimens) (Figure 2). Forest edge cover had the greatest bee species diversity (71 species) followed by wild blueberry fields (69 species) and emergent wetland (61 species) (Figure 3). Further analysis of wild bee communities across cover types revealed reduced wild bee abundance and species richness in forested land cover with no significant difference in wild bee abundance or richness across non-forested land cover types. These relationships were the same in both wild blueberry growing regions.
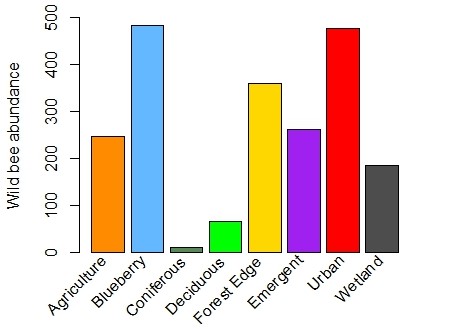
Figure 2. Wild bee abundance across crop and non-crop land cover types in Maine’s wild blueberry landscape, 2014-2015.
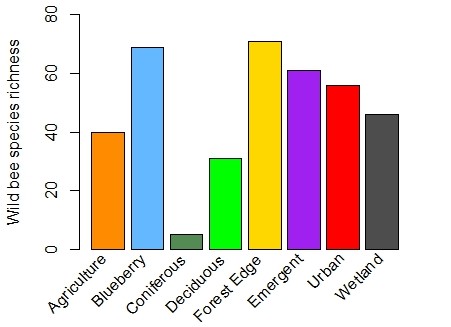
Figure 3. Wild bee species richness across crop and non-crop land cover types in Maine’s wild blueberry landscape, 2014-2015.
Wild bee communities shifted over the growing season, reaching greatest bee abundance in mid-summer (Figure 4) and the greatest bee species richness in early summer (Figure 5). Blueberry fields had the most abundant bee communities in early and mid-summer; late season abundance was greatest in emergent wetland. Species richness was greatest in wild blueberry fields throughout the growing season (Table 2).
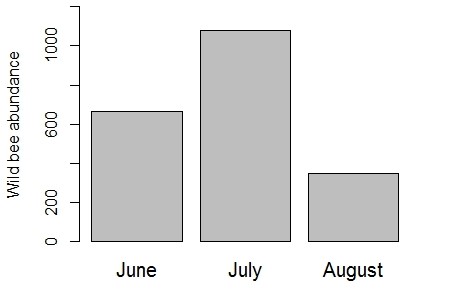
Figure 4. Bee abundance throughout Maine’s wild blueberry growing season, 2014-2015.
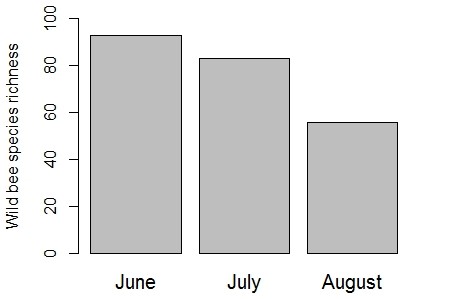
Figure 5. Bee species richness throughout Maine’s wild blueberry growing season, 2014-2015.
Table 2. Wild bee abundance and species richness by land cover type and month of growing season.
|
Abundance |
Richness |
|||||
|
June |
July |
August |
June |
July |
August |
|
|
Agriculture |
71 |
119 |
58 |
24 |
28 |
10 |
|
Blueberry |
166 |
250 |
68 |
43 |
40 |
26 |
|
Coniferous |
9 |
1 |
1 |
3 |
1 |
1 |
|
Deciduous |
39 |
23 |
5 |
21 |
13 |
3 |
|
Forest Edge |
128 |
170 |
61 |
38 |
38 |
24 |
|
Emergent |
67 |
125 |
70 |
29 |
32 |
20 |
|
Urban |
134 |
293 |
50 |
34 |
33 |
17 |
|
Wetland |
53 |
98 |
35 |
21 |
33 |
14 |
Ongoing analyses will determine relationships between wild bee communities and landscape pattern. Previous research suggests that landscape complexity is associated with greater wild bee abundance and species richness, and though the Maine wild blueberry production landscape is generally more complex than many conventional agricultural landscapes, the two growing regions in the state differ in landscape pattern and therefore offer a novel comparison.
Objective 3: The 12 grower testing sessions for BeeMapper demonstrated that wild blueberry growers are interested in promoting wild bee populations around their fields for crop pollination and conservation purposes. We established a relationship with growers around BeeMapper through a transparent participatory development process, which has encouraged positive reception of the tool throughout the grower community. Grower feedback led to drastic improvements to the initial prototype of BeeMapper and ultimately made a more grower-friendly tool. BeeMapper will close an information gap regarding wild bees across Maine’s wild blueberry landscape and help growers pursue pollinator conservation practices. Additionally, our field-collected bee community data will more accurately inform the application of the InVEST Crop Pollination model to the wild blueberry production landscape in Maine.
Few studies follow wild bee communities outside of crop bloom and assess season-long abundance and species richness. Our field surveys were designed not only to provide better parameters for the InVEST Crop Pollination model, which relies on season-long estimates, but also to determine wild bee habitat use post-crop bloom. Wild bees were overwhelmingly abundant and diverse in wild blueberry fields in the early summer, during and just after crop bloom. While we expected this, we were surprised to discover that bee communities in wild blueberry fields remained highly abundant and diverse throughout the summer compared to other land cover types, marking a distinct departure from our expert opinion-informed InVEST Crop Pollination model parameters. Bumble bees, particularly the orange-banded bumble bee, were very abundant in our field surveys throughout the growing season. Bumble bees are the most effective pollinator of wild blueberry (Javorek et al. 2002); establishing their prominence in the wild bee community is encouraging for sustainable crop pollination.
Most agriculturally-focused bee studies have surveyed bee communities in crop fields, or if outside of crop fields, have surveyed field edges or nearby restored habitat. Wild bees forage extensively in blooming wild blueberry fields, however, they need forage through the remainder of the growing season to sustain themselves and produce future generations. This study is one of very few that has surveyed multiple non-crop land cover types in an agricultural landscape and the only study we have found that connects wetland based bee communities to nearby crop fields. Emergent wetland land cover is closely associated with wild blueberry production, particularly in Maine’s Downeast growing region, and our surveys revealed unexpectedly high wild bee abundance and species richness in these areas. This potentially has profound implications for wild pollinator resources in Maine’s wild blueberry agroecosystem as well as improved predictive accuracy of the InVEST Crop Pollination model when applied in this system. Additionally, the Maine wild blueberry production landscape differs from conventional agricultural landscapes in that it is dominated by non-crop land cover, and the crop fields are irregularly shaped and surrounded by non-cultivated habitat. Understanding how bees use more complex agricultural landscapes will enable growers to more effectively tailor conservation practices in these areas, ultimately enhancing wild pollinator populations and increasing wild pollinator contribution to crop production. Assessing the influence of landscape pattern on wild bee communities in more complex landscapes contributes to a growing body of literature that has yet to reach a consensus on the nature of these relationships.
We intend to complete a final round of BeeMapper outreach and education to wild blueberry growers when the tool is launched for public access in summer 2017. The development process was completed in a timely manner, however, updating model parameterization has taken longer than expected and is delaying the tool launch date. Producing accurate InVEST Crop Pollination model output is our highest priority, as it is important for establishing credibility among crop growers and encouraging tool use. BeeMapper has also garnered interest from Maine’s hobby beekeeping and pollinator conservation communities, who can use the tool to site honey bee apiaries or determine locations for pollinator gardens. We expect a diverse user group for BeeMapper and interest in developing derivatives of the tool as BeeMapper becomes web-accessible.
Javorek, S.K., K.E. MacKenzie, and S.P Vander Kloet. 2002. Comparative Pollination Effectiveness Among Bees (Hymenoptera: Apoidea) on Lowbush Blueberry (Ericaceae: Vaccinium angustifolium). Annals of the Entomological Society of America, 95(3):345-351.
Education & outreach activities and participation summary
Participation summary:
We anticipate three peer-reviewed publications from this work, one from each project objective. These manuscripts will: 1) detail bee communities associated with crop and non-crop land cover types throughout the growing season and relate bee communities to landscape pattern; 2) compare field data-informed InVEST Crop Pollination model parameters to expert opinion-informed parameters for model prediction accuracy; and 3) describe the collaborative, iterative development process of BeeMapper.
When launched, BeeMapper will be available for public access at www.extension.umaine.edu/beemapper. We will publish the BeeMapper User’s Guide and the methodology used to create the tool in a Technical Bulletin through the Maine Agricultural and Forest Experiment Station. This publication will be freely available to the public.
We gave multiple presentations for this project in both academic and non-academic settings. Collaborating with stakeholders to disseminate scientific output is an exciting process; demonstrating our experiences to other academics has been fruitful and has validated our science, and connecting with the public has motivated us to pursue other arenas of outreach using our data.
Academic presentations:
Du Clos, B., Loftin, C.S., and F.A. Drummond. Wild bee communities in non-crop land cover in the Maine (USA) wild blueberry production landscape. XXV International Congress of Entomology, 9/2016. Orlando, FL.
Du Clos, B., Loftin, C.S., and F.A. Drummond. Wild bee communities in non-crop land cover in the Maine (USA) wild blueberry production landscape. 3rd International Conference on Pollinator Biology, Health, and Policy, 7/2016. University Park, PA. Poster.
Hanes, S.P., and B. Du Clos. Lessons from the BeeMapper. Senator George J. Mitchell Center for Sustainability Solutions Seminar, 2/2016. Orono, ME. Invited speakers.
Du Clos, B., Hanes, S.P., Groff, S.C., Loftin, C.S., and F.A. Drummond. A tool for grower assessment of wild bee abundance in the Maine wild blueberry landscape. Student Conference on Conservation Science-New York, 10/2015. New York, NY. Poster.
Du Clos, B., Hanes, S.P., Groff, S.C., Loftin, C.S., and F.A. Drummond. Development of a Pollinator Habitat Assessment Tool in Maine’s Wild Blueberry Landscape. Northeast Natural History Conference, 4/2015. Springfield, MA.
Hanes, S.P., and B. Du Clos. How Maine Blueberry Growers Use Wild Bees: Learning from a Sustainability Transition in Progress. Senator George J. Mitchell Center for Sustainability Solutions Seminar, 3/2015. Orono, ME. Invited speakers.
Presentations to growers:
Du Clos, B., Hanes, S.P., Loftin, C.S., and F.A. Drummond. BeeMapper web tool: Update and testing. University of Maine Cooperative Extension Spring Wild Blueberry Growers Meetings, 3/2016. Ellsworth, ME and Machias, ME.
Du Clos, B., Hanes, S.P., Groff, S.C., Loftin, C.S., and F.A. Drummond. BeeMapper: a tool for grower assessment of wild bee abundance. Wild Blueberry Research and Extension Workers 2015 Annual Conference. 10/2015. Bar Harbor, ME.
The BeeMapper web tool: assessing bee habitat around wild blueberry fields. University of Maine Cooperative Extension Wild Blueberry Field Day, 7/2015. Jonesboro, ME.
Du Clos, B., Hanes, S.P., Loftin, C.S., and F.A. Drummond. A web-based tool for grower assessment of native bee abundance in the wild blueberry production landscape. Maine State Wild Blueberry Growers Meeting, 3/2015. Bangor, ME. Poster.
Du Clos, B., Hanes, S.P., Loftin, C.S., and F.A. Drummond. A landscape-level pollinator habitat assessment tool for wild blueberry growers. Wild Blueberry Commission Advisory Board Meeting, 11/2014. Brunswick, ME.
Public outreach talks:
Mapping how wild bees use Maine’s landscape. Portland Pollinators Partnership, 2/2016. Portland, ME.
Honey bees and the landscape: Choosing an optimal apiary site. Maine State Beekeepers Association, 11/2015. Hampden, ME.
Mapping bees in Maine’s landscape. Androscoggin Beekeepers Club, 4/2015. Auburn, ME.
Project Outcomes
Accurate predictions of wild bee abundance in the Maine wild blueberry production landscape shared with growers through the BeeMapper web tool may lead to shifts in crop pollination practices, including changing the number of honey bee hives rented or purchasing commercial bumble bee colonies for crop pollination. This new information can also aid growers in determining the need for and installation of pollinator enhancement habitat near their crop fields. Understanding where wild bee habitat is located in the landscape surrounding a crop field may also change pesticide application routines; growers may change the direction, area, or timing of pesticide applications to promote nearby wild bee communities in non-crop land cover.
Farmer Adoption
Our initial presentation of a conceptual prototype of BeeMapper was positively received by a group of influential, actively engaged wild blueberry growers, researchers, and industry advocates. It was critical to confirm interest in a tool of this nature before beginning active development to establish a) a collaborative, mutually beneficial working relationship and b) scientific credibility to the crop growers. We worked with growers to choose basic components such as map color scheme, language and definitions of scientific terms, and interactive layout; this promoted our working relationship and ensured clear interpretation of InVEST Crop Pollination model output.
We tested two iterative prototypes with growers in 12 one-on-one or small group (2-5 growers) sessions. This is where we received the bulk of grower feedback on tool development concerning everything from map accuracy to clarity of instructions and accompanying documentation. All growers, regardless of growing experience or management practices, were able to successfully navigate BeeMapper and list multiple uses for the information provided in the tool. Many growers asked for tool capabilities beyond those that the InVEST Crop Pollination model can provide, particularly interactive change to the landscape and subsequent recalculation of pollinator abundance. Growers are also interested in explicit economic breakdowns of wild pollinator contribution, and while this is beyond the scope of this project, other researchers are actively pursuing this information, which could be incorporated into a future version of BeeMapper. Consistent communication practices with the greater grower community promoted interest and acceptance of the tool during the development process, and we anticipate wide use by Maine wild blueberry growers when BeeMapper is launched for public access.
Areas needing additional study
The diverse objectives of this work revealed many new avenues of additional study. The abundance and diversity of wild bee communities in wetland land cover types warrants further investigation, particularly into the nesting and foraging resources available to wild bees. Most of the bees we collected are ground nesting bees, however, wetland soils are thought to be too waterlogged and finely textured for wild bee nest establishment. Maine lacks expansive soils data, and assessing wetland soil content and texture could improve our understanding of their bee nest suitability and distribution in the crop landscape. Woody shrubs and debris in wetlands likely provide ample nesting space for cavity nesting bees; this is an avenue for future research. Foraging resources for wild bees in wetland land cover likely differ from those offered in the grassland/pasture habitat commonly associated with bee communities, however, this is also under-studied.
Studying bees and the landscape often is limited to the available spatial data. We used 10m spatial resolution data to connect wild bee abundance and species richness to landscape pattern and make predictions with the InVEST Crop Pollination model. While 10m data is a finer resolution than most studies of landscape use by wild bees, it may be too coarse to represent how bees perceive the landscape. Finer spatial resolution would require careful consideration of landscape extent for InVEST Crop Pollination model computational requirements, however, the tradeoff would be model output that more realistically reflects bee behavior in the landscape.
There have been multiple documented declines in pollinator populations attributed to land use change, pesticide use, and a suite of pathogens that reduce bee habitat and bee health. Population monitoring is a crucial component of pollinator conservation programs, and our field surveys established baseline population data, particularly in non-crop land cover, that can be referenced in future monitoring efforts. In particular, Maine was in the historic range of the rusty-patched bumble bee (Bombus affinis), a bee once commonly associated with wild blueberry fields but now eliminated from 95% of its historic range.
When using BeeMapper, crop growers wanted explicit economic valuation of wild bee contribution to crop pollination. We know that wild bees are more effective pollinators of wild blueberry than managed honey bees, however, we have yet to obtain an economic valuation of their contribution to crop pollination. Estimates based on multiple years of survey data during crop bloom suggest wild bees are responsible for up to 30% of fruit set. We are sharing these estimates with growers through BeeMapper, and we aim to use the full capability of the InVEST Crop Pollination model, which can calculate economic values of wild bee pollination, to give growers the information they need to make pollination management decisions.