Final report for GNE15-106
Project Information
The project, “On-farm and isotopic evaluation of deep soil nitrogen capture and cycling by cover crop mixtures” is an expansion of a study started under the “Deep soil nitrogen: A resource for sustainability in the mid-Atlantic using early cover crops” grant funded by Northeast SARE in 2014. We are investigating if deep-rooted, early planted cover crops can capture N remaining in the upper 2 m of soil following a summer crop. (As part of a related study, we found on average 253 kg/ha mineral N remain in the 0-210 cm profile following a summer crop.) In August 2015, we set-up an experiment with 29 treatments, repeated in three replications, at two sites (6 replications total). There were four cover crop species treatments: 1) forage radish (Raphanus sativus), 2) rye (Secale cereale), 3) forage radish + rye, and 4) forage radish + rye + Crimson clover (Trifolium incarnatum), and two cover crop planting date treatments: 1) 3-Sep, and 2) 8-Oct. The plots had KNO3 isotopic tracer 99% enriched in 15N buried at either 60, 120, or 180 cm depths to simulate N that remains after a corn crop. In late December 2015, we sampled the cover crops (radish shoot, radish taproot, rye shoot, clover shoot) using minimally destructive methods. In early May 2016, we re-sampled the rye and Crimson Clover cover crops using the same minimally destructive sampling methods. The cover crops were then chemically terminated and corn was planted in late May 2016. We sampled corn at the V5 stage in June 2016, and we sampled corn grain in September-October 2016. We also took deep soil cores (0-210 cm) three times during 2016 (spring, summer, fall) in select plots at each site in order to gain understanding about the leaching rate for the N in the soil. Biomass and soil samples were sent to Cornell’s stable isotope lab (COIL) to test for 15N.
We found that there was no significant differences among cover crop species in the amount of 15N recovered. Adding clover to the cover crop mix did not hinder the N uptake of radish or rye, a concern of some practitioners and policy makers. Planting-date had a large impact on the amount of recovered 15N. In the fall, early-planted cover crops captured on average 14.46% of the buried 15N from 60 cm, 2.67% of the buried 15N from 120 cm, and 0.31% of the buried 15N from 180 cm, while late-planted cover crops captured on average 1.36% of the buried 15N from 60 cm and 0.07% of the buried 15N from 120 cm. While there was evidence that late-planted rye captured additional 15N from 120 cm burial, the percent recovered was still < 1% of the burial 15N and therefore would not be expected to have an impact on reducing NO3 leaching or supplying N to a following crop. There was evidence that corn following a cover crop was more likely to be enriched in 15N or have greater uptake of 15N than corn that did not follow a cover crop. However, the percent recoveries of corn that we observed were very low (< 1%) regardless of whether there was a previous cover crop or not.
Overall, this study provided clear evidence that cover crops can be effective at scavenging N from 1+ m deep, but they must be planted by early-September; spring cover crop growth will not compensate for a late-planting date. Cover crop species of radish, rye, radish + rye, and radish + rye + clover all proved effective at capturing deep soil N. However, related research that we performed indicated that rye monoculture causes reduced corn yield and/or higher corn N fertilizer requirements. The work funded by this grant and the closely related SARE grant LNE14-338 (Deep soil nitrogen: A resource for sustainability in the mid-Atlantic using early cover crops) has reached thousands of people including farmers, farm advisers, policy makers, and others, through 4 farm magazine articles, 5 publications/newsletters, 3 field-days, 1 webinar, 4 videos/podcasts, 18 Extension meeting presentations, and 6 professional meeting presentations. We have learned through participant questionnaires at various Extension events and informal conversations, that farmers are aware of the N capturing benefits of early-planted cover crops and are striving to incorporate early-planted cover crops on their farms. The most common question/concern we have received from farmers is how to plant cover crops by early September following corn or soybean crops that are not harvested until October. We are continuing to perform research to address this concern; for example, we are investigating systems of interseeding and aerially seeding cover crops into a standing corn or soybean crop.
Introduction:
The purpose of this project is to develop cover crop systems to capture and recycle deep soil nitrogen (N), therein reducing N leaching losses and reducing the amount of fertilizer necessary for subsequent crops. In addition to how much N cover crops take up, it is important, but little studied, where in the profile N came from. In order to answer farmer questions about this, we need to expand our previously planned N tracer work.
Due to the extent of cover crops on the landscape, for example approximately 639,700 acres in Maryland in 2017 (http://news.maryland.gov/mda/press-release/2017/07/31/agriculture-department-announces-cover-crop-sign-up-totals-for-fall-2017/), improvements in the ability of cover crops to reduce N leaching from the land through N uptake and recycling to subsequent crops would have a huge impact on reducing the N load into bodies of water (e.g., Chesapeake Bay), while saving farmers money (e.g., fertilizer costs). Cover crops serve many functions, such as preventing soil erosion, reducing weeds, and providing a “green manure”. In addition, we hypothesize that deep-rooted cover crops can access N from deep soil layers that was not used by previous crops and would leach over winter beyond the rooting range of subsequent crops. In other words, cover crops can fill the gap between the relatively short time periods and limited depths in which cash crops are taking up N, and foster a more sustainable, cycling system.
Currently the most common management practice is to plant cereal rye in October or November after summer crop harvest, and terminate the cover crop early in spring, a week or two before planting. Such late-planted cover crops are unable to access deep soil N. The ability of cover crop systems to capture and recycle deep soil N largely depends on when cover crops are planted, what species are planted, and soil characteristics. In order for cover crops to maintain N in the cropping system, their growth must be closely coordinated with the cash crop cycle. After cash crops senesce, unused N begins leaching downward, and cover crop roots must catch up with the soil N before it leaches from the system. The proposed study is part of a larger project, initiated in summer 2014, investigating deep-soil N dynamics and early-planted, deep-rooted cover crops, primarily through 1) deep-soil N surveys (0-210 cm deep soil cores) on Maryland and Pennsylvania farms in late-summer to investigate the depth and amount of N throughout the soil profile after the summer crop uptake ceases, 2) on-farm cover crop plots to investigate how various cover crop systems affect the location and amount of this N pool, and 3) research plots in which 15N isotope tracer is buried to investigate deep soil N uptake of forage radish and rye cover crops.
The proposed project would allow us to expand on this research, with a focus on tracking N movement in cover crop systems to learn how cover crop species in monoculture and in mixtures obtain and transfer deep soil N. Specifically, we will use 15N isotope tracers to investigate patterns of nitrate uptake of cover crop species within different functional groups—brassica, winter cereal, legume—planted in monoculture and in mixtures. Cover crop mixtures are currently gaining in popularity, and recognized as being multifunctional. In this project, we will determine the depth of N uptake of each species within the mixture and the fate of that N—whether it is being transferred to the subsequent crop or not. We will consider the critical variable of cover crop planting date, at two sites with contrasting soil types. This project will address many pressing questions about: the depth at which various species can access N, the influence of a legume on the N uptake of other species in the mix, the immobilization versus release of N from a rye winter cereal cover crop, and the rate at which N leaches down in the soil profile at a sandy soil and clayey soil site. A better understanding of N movement and cycling between soil, cover crops, and cash crops will enable us to design optimal cover crop systems. Concurrently, we are working with interested farmers to investigate and employ early-planted cover crop systems on their land.
- Compare deep (60, 120, and 180 cm) soil N uptake by 1) forage radish, 2) rye, 3) forage radish + rye, and 4) forage radish + rye + Crimson clover in late fall, before cover crops die or go dormant for the winter, and again in spring, before cash crop planting.
- Evaluate the influence of planting date (3-Sep vs. 8-Oct) on deep N uptake.
- Differentiate the N uptake of individual species within the cover crop mixture and better understand N patterns in monoculture and mixed cover crop systems.
- Determine if adding a legume to a cover crop mixture will influence the N uptake and transfer of other species in the mixture.
- Compare cover crops in terms of their ability to transfer N to the subsequent corn crop.
- Evaluate patterns of N leaching from burial to one year later.
- Investigate the applicability of various deep-rooted cover crop systems on farms—examine the cover crop systems on a broader range of soil types, geographic areas, and management regimes to determine N patterns in the upper 2 m of soil, in the cover crop biomass, and in subsequent crop yield.
- Integrally involve farmers and extension educators in the research project through encouraging farmers to help design cover crop systems that will provide the most benefits for their operation and to share research findings and experiences with their community through informal conversation and hosting events such as field days. Through field days, workshops for farmers and farm advisers, and publications, educate and engage the broader agricultural community, with the goal of motivating farmers to adopt cropping systems that include cover crops capable of capturing deep soil N.
Cooperators
Research
Location
The study was located at the Central Maryland Research and Education Center—Beltsville Facility in Laurel, Maryland USA. The region has a humid climate with annual rainfall relatively uniformly distributed throughout the entire year. The temperature and precipitation for the study period is found in Figure 1. The experiment was performed from September 2015 to October 2016 during the cover crop-cash crop cycle. The study contained six blocks, three at each of two sites located 1.06 km away from each other. The two sites were SANDY (39.01162, -76.83167) and CLAYEY (39.0183, -76.8229). Prior to the study, both fields were planted in winter wheat fall 2014-summer 2015. The fields were in corn in 2014, and in fall 2012-summer 2013 the fields were in winter wheat with a double crop of soybean. Soil characteristics are listed in Table 1.
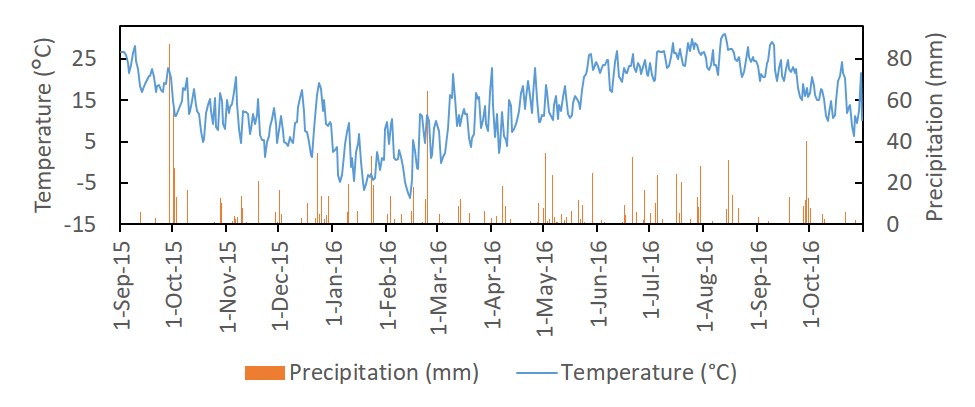
Table 1. Soil percent sand, silt, clay, pH, percent C and N, NO3-N (kg N/ha) and NH4-N (kg N/ha). NO3-N and NH4-N values are from soil samples taken in 15 plots (five cores per rep).
|
|
|
pH |
Sand |
Silt |
Clay |
C |
N |
NH4-N |
NO3-N |
|
|
Soil depth |
|
% |
kg N/ha |
|||||
|
SANDY SITE |
0-15 |
6.14 |
77.0 |
19.6 |
3.4 |
0.654 |
0.054 |
15.2 |
43.1 |
|
15-30 |
6.29 |
74.6 |
19.9 |
5.5 |
0.275 |
0.023 |
|||
|
30-45 |
6.48 |
65.6 |
26.2 |
8.2 |
0.158 |
0.014 |
8.65 |
8.68 |
|
|
45-60 |
6.52 |
65.6 |
24.9 |
9.5 |
0.126 |
0.014 |
|||
|
60-75 |
6.38 |
69.3 |
22.1 |
8.5 |
0.103 |
0.010 |
9.13 |
12.2 |
|
|
75-90 |
6.38 |
75.0 |
18.9 |
6.1 |
0.053 |
0.001 |
|||
|
90-105 |
6.32 |
79.1 |
13.9 |
6.9 |
0.050 |
0.004 |
7.68 |
3.57 |
|
|
105-120 |
5.95 |
75.6 |
14.7 |
9.7 |
0.051 |
0.002 |
|||
|
120-135 |
5.99 |
63.8 |
22.9 |
13.2 |
0.098 |
0.011 |
8.65 |
8.54 |
|
|
135-150 |
5.85 |
68.5 |
19.0 |
12.5 |
0.067 |
0.006 |
|||
|
150-165 |
5.84 |
63.6 |
23.5 |
13.0 |
0.038 |
0.004 |
9.58 |
3.95 |
|
|
165-180 |
5.46 |
57.5 |
27.8 |
14.7 |
0.036 |
0.008 |
|||
|
180-195 |
5.39 |
51.2 |
32.4 |
16.5 |
0.038 |
0.010 |
. |
. |
|
|
195-210 |
4.83 |
47.7 |
32.1 |
20.2 |
0.044 |
0.011 |
|||
|
CLAYEY SITE |
0-15 |
6.05 |
64.8 |
28.5 |
6.7 |
0.883 |
0.071 |
36.6 |
55.1 |
|
15-30 |
6.09 |
61.4 |
29.7 |
8.9 |
0.368 |
0.032 |
|||
|
30-45 |
6.05 |
58.2 |
29.7 |
12.1 |
0.154 |
0.016 |
24.5 |
10.4 |
|
|
45-60 |
5.50 |
55.3 |
28.7 |
15.9 |
0.103 |
0.013 |
|||
|
60-75 |
5.06 |
47.4 |
34.6 |
18.0 |
0.134 |
0.015 |
24.7 |
8.99 |
|
|
75-90 |
4.75 |
41.1 |
40.9 |
18.0 |
0.074 |
0.014 |
|||
|
90-105 |
4.34 |
39.9 |
39.3 |
20.8 |
0.083 |
0.015 |
24.5 |
12.2 |
|
|
105-120 |
4.20 |
27.7 |
50.4 |
21.9 |
0.073 |
0.016 |
|||
|
120-135 |
4.23 |
28.2 |
50.3 |
21.5 |
0.095 |
0.019 |
28.4 |
16.0 |
|
|
135-150 |
4.17 |
26.1 |
54.1 |
19.8 |
0.068 |
0.016 |
|||
|
150-165 |
4.20 |
25.9 |
55.8 |
18.3 |
0.058 |
0.013 |
28.0 |
14.9 |
|
|
165-180 |
4.07 |
25.9 |
56.2 |
17.8 |
0.064 |
0.016 |
|||
|
180-195 |
4.12 |
34.3 |
47.8 |
18.0 |
0.066 |
0.016 |
. |
. |
|
|
195-210 |
4.07 |
27.9 |
55.5 |
16.5 |
0.058 |
0.017 |
|||
Experimental design and treatments
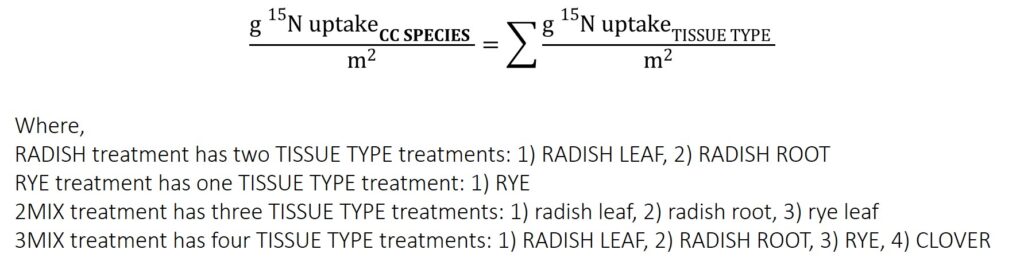
The study included 29 treatments in a randomized complete block design with six replications. Plots were 3 m x 3 m in size. Experimental factors that defined the treatments included cover crop planting date (CC DATE), cover crop species (CC SPECIES), and burial depth of the 15N tracer (15N DEPTH). The treatments were in an incomplete factorial combination of these factors. The CC SPECIES treatment included: 1) forage radish (RADISH), 2) cereal rye (RYE), 3) forage radish + cereal rye (2MIX), 4) forage radish + cereal rye + Crimson clover (3MIX), and 5) control treatment in which no cover crop was planted (NO CC). These species treatments were chosen in order to investigate how forage radish and cereal rye perform together versus in monoculture, and to asses if the 15N RECOVERY of the rye-radish mix would change with the presence of a legume in the mix.
The CC DATE treatments included: 1) an early planting date of 3-Sep (EARLY PLANTING) and 2) a late planting date of 8-Oct (LATE PLANTING). There was no 2MIX x LATE PLANTING treatment combination, as we did not expect an interaction between CC DATE and the influence of clover on the cover crop mixture. The 15N DEPTH treatments included: 1) 60 cm burial (60 CM), 2) 120 cm burial (120 CM), 3) 180 cm burial (180 CM), or 4) a no burial control treatment (NO BURIAL). There was no 180 CM x LATE PLANTING treatment combination, as we did not anticipate root from the LATE PLANTING reaching even the 120 cm depth (Table 2).
Table 2. Experimental treatment combinations. Experimental factors that defined the treatments included CC DATE, CC SPECIES, and 15N DEPTH. The CC SPECIES indicated in bold text had treatments for EARLY PLANTING and LATE PLANTING. The CC SPECIES indicated in non-bold text had treatments for only EARLY PLANTING.
|
CC SPECIES |
15N DEPTH |
|
Radish |
60 cm |
|
Radish |
120 cm |
|
Radish |
180 cm |
|
Radish |
NO BURIAL |
|
Rye |
60 cm |
|
Rye |
120 cm |
|
Rye |
180 cm |
|
Rye |
NO BURIAL |
|
2MIX |
60 cm |
|
2MIX |
120 cm |
|
2MIX |
180 cm |
|
2MIX |
NO BURIAL |
|
3MIX |
60 cm |
|
3MIX |
120 cm |
|
3MIX |
180 cm |
|
3MIX |
NO BURIAL |
|
NO CC |
60 cm |
|
NO CC |
120 cm |
|
NO CC |
180 cm |
|
NO CC |
NO BURIAL |
Field operations
Winter wheat was harvested from the plots mid-July, and weeds were killed on 1 Sep 2015 using Glyphosate, N-(phosphonomethyl)glycine at the rate of 2.31 kg active ingredient/ha. The EARLY PLANTING were fertilized with 9.07 kg N as urea and ammonium nitrate (UAN) on 3 Sep 2015, and cover crops were planted 3 Sep 2015. The LATE PLANTING were fertilized with 9.07 kg N (as UAN) 28 Sep 2015, and cover crops were planted 8 Oct 2015. Cover crops were chemically terminated using Glyphosate, N-(phosphonomethyl) glycine on 18 May 2016.
At the SANDY site, corn was planted 16 May 2016. Fertilizer was applied 14 June 2016 as 31.8 and 7.3 kg/ha of N and S, respectively in 115 liters of fertilizer solution. At the CLAYEY site, corn was planted 7 June 2016. On 8 June 2016, herbicides were applied (1.85 kg/ha 2-chloro-4-ethylamino-6-isopropylamino-s-triazine (Atrazine), 2.3 L/ha 1,1’-dimethyl-4,4’-bipyridinium dichloride (Paraquat), 4.7 L/ha Acetochlor (Warrant), 0.56 kg/ha Sticker). Fertilizer was applied 29 June 2016 as 31.8 and 7.3 kg/ha of N and S, respectively in 115 liters of fertilizer solution.
15N solution and burial
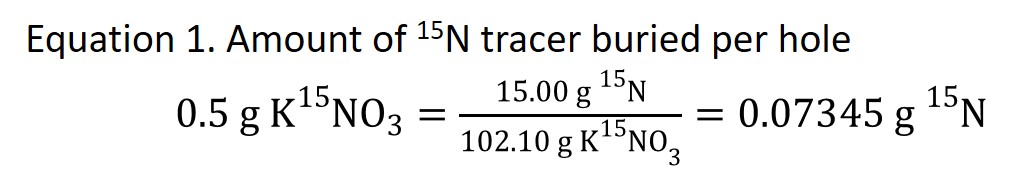
Each plot had 0.5 g KNO3 isotopic tracer 99% enriched in 15N, which is equal to 0.07345 g 15N (Equation 1), buried per plot.
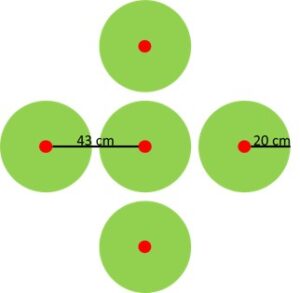
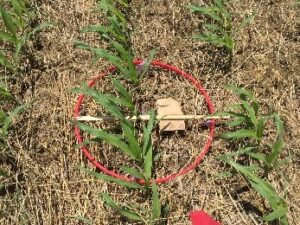
The 15N tracer was divided among five points per plot. Bore holes 2 cm in diameter were made vertically in the soil using a Veihmeyer probe. Five holes were spatially arranged in the shape of an x, with one hole at the intersection and one at the end of each arm with a distance of 43 cm between the center point and the end of each arm (Figure 2).
Immediately following the creation of the five holes in a plot, a PVC pipe was inserted into each hole. Using a funnel, 50 mL of the K15NO3 solution was poured in each of the five holes, followed by 10 ml of DI water to rinse the pipe. A total of 250 mL K15NO3 solution was buried per plot. Each hole was filled with clean quartz sand to approximately 15 cm above the K15NO3, followed by a 2:1 sand/bentonite mix until the hole was filled up to within 30 cm from the surface. The bentonite mix was used to prevent preferential root growth down the backfilled hole. The top 30 cm of the hole was filled with topsoil from the plot.
Cover crop biomass sampling at 15N burial points and preparation for analysis
Cover crop biomass was sampled between 14 Dec 2015 and 31 Dec 2015. Weeds were not collected because they were estimated to be < 5% of biomass. Spring biomass was sampled between 30 April 2016 and 7 May 2016. A plants was sampled if the point where it emerged from the soil fell within a 20 cm radius of each of the five burial points (Figure 2). The tissue types of radish shoot (RADISH LEAF), radish fleshy taproot (RADISH ROOT), rye shoot (RYE), and clover shoot (CLOVER) were sampled within all treatments.
Forage radish was expected to naturally winter kill within one month of the fall sampling date. Therefore we destructively sampled the radish, but returned >95% of the biomass to the plot to decompose. Forage radish was harvested by hand-pulling the fleshy root from the soil. The RADISH ROOT and RADISH LEAF were separated. The RADISH ROOT was thoroughly washed to remove all soil and then weighed. A 4.40 mm diameter bore was taken horizontally through the RADISH ROOT (perpendicular) at the vertical midpoint of the root. The RADISH ROOT (minus the bore hole) was returned to the exact point in the soil from which it came. The RADISH LEAF was weighed. The RADISH LEAF was split into two equal parts down the midline of the plant. One half of the RADISH LEAF was scattered over the replaced RADISH ROOT. The other half of the RADISH LEAF was blended with 30 ml of DI water until liquefied using a food processor. A sample of 30 ml of the blended RADISH LEAF was saved. The remaining RADISH LEAF puree was immediately stored in the refrigerator and scattered within 48 hours over the burial points from the plot harvested. The RADISH biomass was estimated using percent moisture estimates from a previous study.
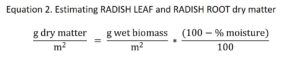
Where,
Wet biomass = values taken in field measurements
Percent moisture = values estimated based on a 2012 radish variety trial; average RADISH LEAF percent moisture = 97.07% (N = 20; SD = 1.09), average RADISH ROOT percent moisture = 93.55% (N = 20; SD = 1.89) (Lounsbury and Weil, unpublished)
RYE and CLOVER are expected to overwinter in the study region. Therefore we took non-destructive samples of the biomass of these species in the fall and in the spring. One leaf was sampled from each RYE clump. A “clump” was defined as all rye leaves coming from a single shoot off a tiller. On areas outside of the plots, we harvested areas using the minimally destructive technique and then completely harvested the area to compare the average % N for the two harvest techniques. For the fall samples (N = 20), the ratio of % N from sample/total harvest was on average 0.991, with each sample differing on average 7.86% from the total harvest. For the spring samples (N = 40), the ratio of % N from sample/total harvest was on average 1.01, with each sample differing on average 10.4% from the total harvest.
We took measurements of rye patchiness, height, and percent cover that could be used to estimate biomass. Patchiness was determined by counting the number of clumps. Height was estimated to be the average height of rye leaves within each clump. The leaves were pulled vertical beside a measuring stick to determine the average height. To reduce human error, a single investigator determined the patchiness and height of all plots within a block. To estimate percent cover, a bird’s eye photo was taken of each sampling point; any RADISH in the plot was removed before the photo was taken. Two investigators made independent visual estimates of percent cover from the photo images; the two estimates were averaged for each point.
On areas outside of the plots, we measured rye patchiness, height, and percent cover and then harvested the area and dried and weighed the biomass in order to correlate measurements to actual biomass. We ran a regression analysis to correlate the measured rye parameters to the dry biomass. The analysis selected for the combination of independent variables with the highest adjusted R2. We forced the equation to pass through the origin (i.e., have no y intercept) (Eisenhauer, 2003). Correlation curves were made for each sampling group.
One stem was collected at its base from each CLOVER clump. A “clump” was defined as all clover stems coming from what appeared to be a single root. To reduce human error, a single investigator identified “clumps” for all plots within a replication. Crimson clover biomass was not estimated as we did not expect Crimson clover to pick up 15N tracer.
For all treatments, TISSUE TYPE dry matter per m2 and CC SPECIES dry matter per m2 was calculated. The samples of cover crop biomass was dried at 40° C and ground to < 0.1 mm size.
Corn sampling at 15N burial points and preparation for analysis
Corn plants were sampled at SANDY site on 8 Jun 2016 and at CLAYEY site on 29 Jun 2016, when plants had reached the five leaf collar growth stage (CORN V5). Corn grain (CORN GRAIN) was sampled at SANDY site on 2 Sep 2016 and at CLAYEY site on 7 Oct 2016. Corn was sampled from a 1.8012 m2 circular area (0.7572 cm radius) encompassing the five sampling points. The sampling area was split in half; the corn from one half was harvested at V5 stage and the corn from the other half was harvested for grain (Figure 5). The corn biomass was dried at 40° C and weighed. The dried biomass was ground to < 0.1 mm size.
Soil sampling at 15N burial points and preparation for analysis
In order to investigate NO3 leaching patterns, we took soil cores at either 10 cm or 20 cm distance to the side of the buried 15N (DISTN15) at several times during the year (Table 4). The first set of samples was taken on the sandy site on 20 February 2016 and on the clayey site on 10 April 2016. We intended to take these soil cores in late fall, but were delayed until February and April by weather and field soil conditions. Soil cores were taken to 210 cm deep and divided into 15 cm increments. Soil samples were dried at 40°C for at least 48 hours. The weight of the soil at the field moisture level, the weight of the soil after drying and the weight of the gravel that did not pass through the 2 mm sieve was determined. The soil was sieved through a 2 mm sieve and then ground to < 0.1 mm size. We analyzed soil samples from selected depths for AT% 15N/14N (Table 4).
Table 4 Soil samples taken (and depths analyzed in parentheses) per block. The number of asterisks indicate the number of composite cores per sample. Two cores from the same DISTN15 were from two different burial points within a plot; two cores from different DISTN15 were from one burial point within the plot. The letter m indicates samples taken in 3MIX treatment; the letter r indicates samples taken in RYE treatment
|
CC SPECIES |
NO CC |
3MIX or RYE |
||||||
|
15N DEPTH |
60 CM |
120 CM |
60 CM |
120 CM |
||||
|
DISTN15 |
10 cm |
20 cm |
10 cm |
20 cm |
10 cm |
20 cm |
10 cm |
20 cm |
|
Feb (SANDY site)/Apr (CLAYEY site) cores |
* (30-120 cm) |
* (30-120 cm) |
* * (60-210 cm) |
*m *m (0-210 cm) |
*m *m (0-60, 105-210 cm) |
|||
|
Jun cores |
** (45-210 cm) |
** (45-210 cm) |
|
|
|
|
|
|
|
Oct cores |
** (45-210 cm) |
** (45-210 cm) |
|
|
** r ** r (0-60 cm) |
|
|
|
15N analysis and calculations
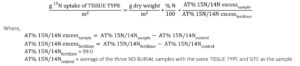
Biomass and soil samples were analyzed for 15N at Cornell University Stable Isotope Laboratory using an isotope ratio mass spectrometer (ThermoFinnigan Delta Plus) integrated with an elemental analyzer (Carlo Erba NC2500) through an open split interface (Conflo II). The 15N is reported as atom AT% 15N/14N. The 15N UPTAKE was calculated using Equation 3 and 4. The 15N RECOVERY was calculated using Equation 5 and 6.
Equation 3. TISSUE TYPE 15N UPTAKE
Equation 4. CC SPECIES 15N UPTAKE
Equation 5. TISSUE TYPE 15N RECOVERY
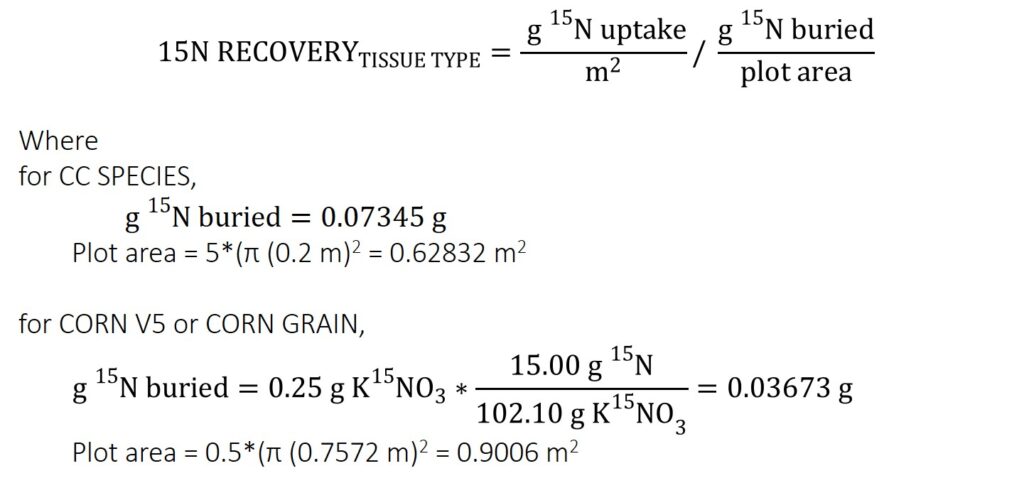
Equation 6. CC SPECIES 15N RECOVERY

Data analysis
Evaluating if cover crops from experimental treatments contain higher AT% 15N/14N than background level— The background levels (unenriched) of AT% 15N/14N of cover crop tissue were determined by measuring the AT% 15N/14N for each TISSUE TYPE in NO BURIAL plots. We performed an ANOVA for EARLY PLANTING and for LATE PLANTING to test if the background AT% 15N/14N differed according to SITE, TISSUE TYPE, or TISSUE TYPE within CC SPECIES (e.g., RADISH LEAF in RADISH compared to RADISH LEAF in 3MIX).
The AT% 15N/14N of the TISSUE TYPE in an enriched plot was compared to the AT% 15N/14N of the same TISSUE TYPE, SITE, and SAMPLE DATE in an unenriched plot (background level). A one-sample t-test was performed to determine if an experimental treatment value of AT% 15N/14N was significantly higher than the background level. Because we were only interested in knowing if cover crops from experimental treatments had a higher AT% 15N/14N than the background level (not lower), we used a “lower one-sided t-test”, with the null value (H0) being the AT% 15N/14N of the experimental plot in question. The null hypothesis is that the mean of control values is equal to the H0; the alternative hypothesis is that the mean of control values is less than the H0 (SAS help, T-Test procedure, syntax). Levels of AT% 15N/14N significantly above the NO BURIAL AT% 15N/14N values were interpreted to mean that the cover crop captured some of the buried 15N tracer.
Evaluating how much 15N buried tracer the cover crops captured—Due to the incomplete factorial design (no LATE PLANTING x 2MIX treatment and no 180 CM 15N DEPTH x LATE PLANTING treatment), EARLY PLANTING and LATE PLANTING results were analyzed separately. For the EARLY PLANTING 15N RECOVERY and the LATE PLANTING 15N RECOVERY, an ANOVA was performed including the independent variables of CC SPECIES, 15N DEPTH, the interaction of CC SPECIES x 15N DEPTH, and the interaction of SITE x CC SPECIES, SITE x 15N DEPTH, and SITE x CC SPECIES x 15N DEPTH. The 15N RECOVERY data were not normally distributed so it was log10 transformed; the log10 transformation normalized the distribution. Thus the dependent variable in the ANOVA was LOG10 15N RECOVERY.
To test for differences of 15N RECOVERY between CC DATE treatments, an ANOVA was performed including the independent variables of CC DATE, CC SPECIES, 15N DEPTH, all possible interactions, and the interaction of SITE with all of the above factors. The 3MIX CC SPECIES treatment and the 180 CM 15N DEPTH treatment were not included since they were not represented in the LATE PLANTING treatment. The dependent variable was LOG10 15N RECOVERY.
To test if RYE from spring sampling (SPRING) had higher 15N RECOVERY than RYE from fall sampling (FALL), an ANOVA was performed including the independent variables of cover crop sampling date (SAMPLE DATE) and the interaction of SAMPLE DATE x SITE. A separate analysis was performed for EARLY PLANTING 60 CM, EARLY PLANTING 120 CM, EARLY PLANTING 180 CM, LATE PLANTING 60 CM, and LATE PLANTING 120 CM. The dependent variable was LOG10 15N RECOVERY. For all ANOVA tests, the level of probability considered significant is p < 0.05, unless otherwise stated.
Evaluating if corn from experimental treatments contain higher AT% 15N/14N than background level—A one-sample t-test was performed to determine if 1) CORN V5 and 2) CORN GRAIN samples had significantly higher AT% 15N/14N than the background level. We analyzed CORN V5 and CORN GRAIN for the presence of AT% 15N/14N in plots from all EARLY PLANTING treatments and all NO CC treatments. In addition, for the EARLY PLANTING, 3MIX, 60 CM treatment, a one-sample t-test was performed to determine if corn stalk (at corn grain harvest time) had significantly higher AT% 15N/14N than the background level.
For CORN V5 and CORN GRAIN 15N RECOVERY, an ANOVA was performed using the 60 CM treatment N15 DEPTH data including the independent variables of CC SPECIES and the interaction of SITE x CC SPECIES. A separate ANOVA was performed using the NO CC treatment CC SPECIES data including the independent variables of 15N DEPTH and the interaction of SITE with 15N DEPTH. The level of probability considered significant is p < 0.05, unless otherwise stated.
Presence of buried 15N tracer in cover crops
The significance levels of AT% 15N/14N for a TISSUE TYPE above the background AT% 15N/14N is indicated in Table 5 (RADISH), Table 6 (RYE), Table 7 (2MIX), and Table 8 (3MIX).
Table 5 FALL RADISH LEAF and RADISH ROOT samples AT% 15N/14N compared to background level. The symbols ***, **, *, †, ns indicate P < 0.001, 0.01, 0.05, 0.1, and not significant.
|
60 CM 15N DEPTH |
120 CM 15N DEPTH |
180 CM 15N DEPTH |
|||||
|
RADISH LEAF |
RADISH ROOT |
RADISH LEAF |
RADISH ROOT |
RADISH LEAF |
RADISH ROOT |
||
|
EARLY PLANTING |
CLAYEY site |
*** |
*** |
*** |
*** |
*** |
*** |
|
*** |
*** |
*** |
*** |
*** |
*** |
||
|
*** |
*** |
*** |
*** |
*** |
*** |
||
|
SANDY site |
*** |
*** |
*** |
*** |
*** |
*** |
|
|
*** |
*** |
*** |
*** |
*** |
*** |
||
|
*** |
*** |
*** |
*** |
*** |
*** |
||
|
LATE PLANTING |
CLAYEY site |
*** |
*** |
ns |
ns |
||
|
*** |
*** |
*** |
*** |
||||
|
*** |
*** |
*** |
*** |
||||
|
SANDY site |
*** |
*** |
*** |
*** |
|||
|
*** |
*** |
*** |
*** |
||||
|
*** |
*** |
*** |
*** |
||||
Table 6 FALL and SPRING RYE samples AT% 15N/14N compared to background level. The symbols ***, **, *, †, ns indicate P < 0.001, 0.01, 0.05, 0.1, and not significant.
|
|
60 CM 15N DEPTH |
120 CM 15N DEPTH |
180 CM 15N DEPTH |
||||
|
RYE |
RYE |
RYE |
|||||
|
fall |
spring |
fall |
spring |
fall |
spring |
||
|
EARLY PLANTING |
CLAYEY site |
*** |
*** |
*** |
*** |
*** |
** |
|
*** |
*** |
*** |
*** |
*** |
*** |
||
|
*** |
*** |
*** |
*** |
*** |
** |
||
|
SANDY site |
*** |
*** |
*** |
*** |
*** |
*** |
|
|
*** |
*** |
*** |
*** |
*** |
*** |
||
|
*** |
*** |
*** |
*** |
*** |
*** |
||
|
LATE PLANTING |
CLAYEY site |
*** |
*** |
*** |
*** |
|
|
|
*** |
*** |
*** |
*** |
|
|
||
|
*** |
*** |
*** |
*** |
|
|
||
|
SANDY site |
*** |
*** |
*** |
*** |
|
|
|
|
*** |
*** |
*** |
*** |
|
|
||
|
*** |
*** |
*** |
*** |
|
|
||
Table 7 FALL and SPRING EARLY PLANTING 2MIX RADISH LEAF, RADISH ROOT, and RYE samples AT% 15N/14N compared to background level. The symbols ***, **, *, †, ns indicate P < 0.001, 0.01, 0.05, 0.1, and not significant.
|
|
60 CM 15N DEPTH |
120 CM 15N DEPTH |
180 CM 15N DEPTH |
|||||||||
|
RYE |
RADISH LEAF |
RADISH ROOT |
RYE |
RADISH LEAF |
RADISH ROOT |
RYE |
RADISH LEAF |
RADISH ROOT |
||||
|
fall |
spring |
fall |
fall |
fall |
spring |
fall |
fall |
fall |
spring |
fall |
fall |
|
|
CLAYEY site |
*** |
*** |
*** |
*** |
*** |
ns |
ns |
*** |
*** |
ns |
ns |
*** |
|
*** |
*** |
*** |
*** |
. |
*** |
*** |
*** |
*** |
ns |
† |
* |
|
|
*** |
*** |
*** |
*** |
*** |
*** |
*** |
*** |
*** |
ns |
*** |
*** |
|
|
SANDY site |
*** |
*** |
*** |
*** |
*** |
*** |
*** |
*** |
ns |
ns |
ns |
ns |
|
*** |
*** |
*** |
*** |
*** |
*** |
*** |
*** |
*** |
*** |
*** |
*** |
|
|
*** |
*** |
*** |
*** |
*** |
*** |
*** |
*** |
*** |
*** |
*** |
*** |
|
Table 8 FALL and SPRING 3MIX RADISH LEAF, RADISH ROOT, RYE, and CLOVER samples AT% 15N/14N compared to background level. The symbols ***, **, *, †, ns indicate P < 0.001, 0.01, 0.05, 0.1, and not significant. FALL abbreviated as F; SPRING abbreviated as S
|
|
60 CM 15N DEPTH |
120 CM 15N DEPTH |
180 CM 15N DEPTH |
||||||||||||||||
|
CLOVER |
RYE |
RADISH LEAF |
RADISH ROOT |
CLOVER |
RYE |
RADISH LEAF |
RADISH ROOT |
CLOVER |
RYE |
RADISH LEAF |
RADISH ROOT |
||||||||
|
F |
S |
F |
S |
F |
F |
F |
S |
F |
S |
F |
F |
F |
S |
F |
S |
F |
F |
||
|
EARLY PLANTING |
CLAYEY site |
*** |
*** |
*** |
*** |
*** |
*** |
ns |
*** |
*** |
ns |
*** |
*** |
ns |
*** |
ns |
ns |
ns |
ns |
|
*** |
*** |
*** |
*** |
*** |
*** |
ns |
** |
*** |
*** |
*** |
*** |
ns |
ns |
*** |
ns |
*** |
*** |
||
|
*** |
*** |
*** |
*** |
*** |
*** |
ns |
. |
*** |
ns |
*** |
*** |
ns |
ns |
*** |
† |
*** |
*** |
||
|
SANDY site |
*** |
*** |
*** |
*** |
*** |
*** |
ns |
*** |
*** |
*** |
*** |
*** |
*** |
** |
*** |
*** |
*** |
*** |
|
|
*** |
*** |
*** |
*** |
*** |
*** |
*** |
*** |
*** |
*** |
*** |
*** |
** |
ns |
*** |
*** |
*** |
*** |
||
|
*** |
*** |
*** |
*** |
*** |
*** |
** |
*** |
*** |
*** |
*** |
*** |
** |
*** |
*** |
*** |
*** |
** |
||
|
LATE PLANTING |
CLAYEY site |
*** |
*** |
*** |
*** |
*** |
*** |
ns |
*** |
*** |
* |
* |
*** |
|
|||||
|
*** |
*** |
*** |
*** |
*** |
*** |
*** |
ns |
*** |
*** |
*** |
*** |
||||||||
|
*** |
*** |
*** |
*** |
*** |
*** |
** |
ns |
*** |
*** |
*** |
*** |
||||||||
|
SANDY site |
*** |
*** |
*** |
*** |
*** |
*** |
*** |
* |
*** |
*** |
*** |
*** |
|||||||
|
*** |
*** |
*** |
*** |
*** |
*** |
* |
ns |
*** |
*** |
*** |
*** |
||||||||
|
ns |
*** |
*** |
*** |
*** |
*** |
ns |
** |
*** |
*** |
*** |
*** |
||||||||
Percent recovery of buried 15N in cover crops
For the EARLY PLANTING treatment FALL samples, there were differences in the 15N RECOVERY among 15N DEPTH treatments (p < 0.0001), with 60 CM burial > 120 CM burial (p < 0.0001) > 180 cm burial (p = 0.0001). There was no difference among CC SPECIES treatments (p = 0.9897). There was no difference in the 15N RECOVERY between 2MIX and 3MIX for the 60 CM 15N DEPTH (p = 1.0000), 120 CM 15N DEPTH (p = 1.0000), or 180 CM 15N DEPTH (p = 1.0000).
For the LATE PLANTING treatment FALL samples, there were differences in the 15N RECOVERY between 15N DEPTH treatments (p < 0.0001), with 60 CM burial > 120 CM (p < 0.0001). There was no difference among CC SPECIES (p = 0.308).
For FALL growth, there were difference in the 15N RECOVERY between the EARLY PLANTING and LATE PLANTING treatments (p < 0.0001). For fall growth, early-planted cover crops captured on average 14.46% of the buried 15N from 60 cm, 2.67% of the buried 15N from 120 cm, and 0.31% of the buried 15N from 180 cm. Late-planted cover crops captured on average 1.36% of the buried 15N from 60 cm and 0.07% of the buried 15N from 120 cm (Figure 4). Figure 5 depicts FALL sample 15N RECOVERY for all SITE x CC SPECIES x CC DATE x 15N DEPTH treatment combinations.
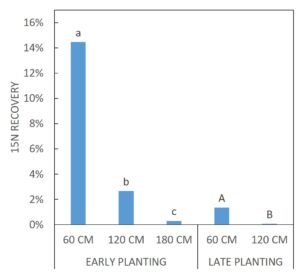
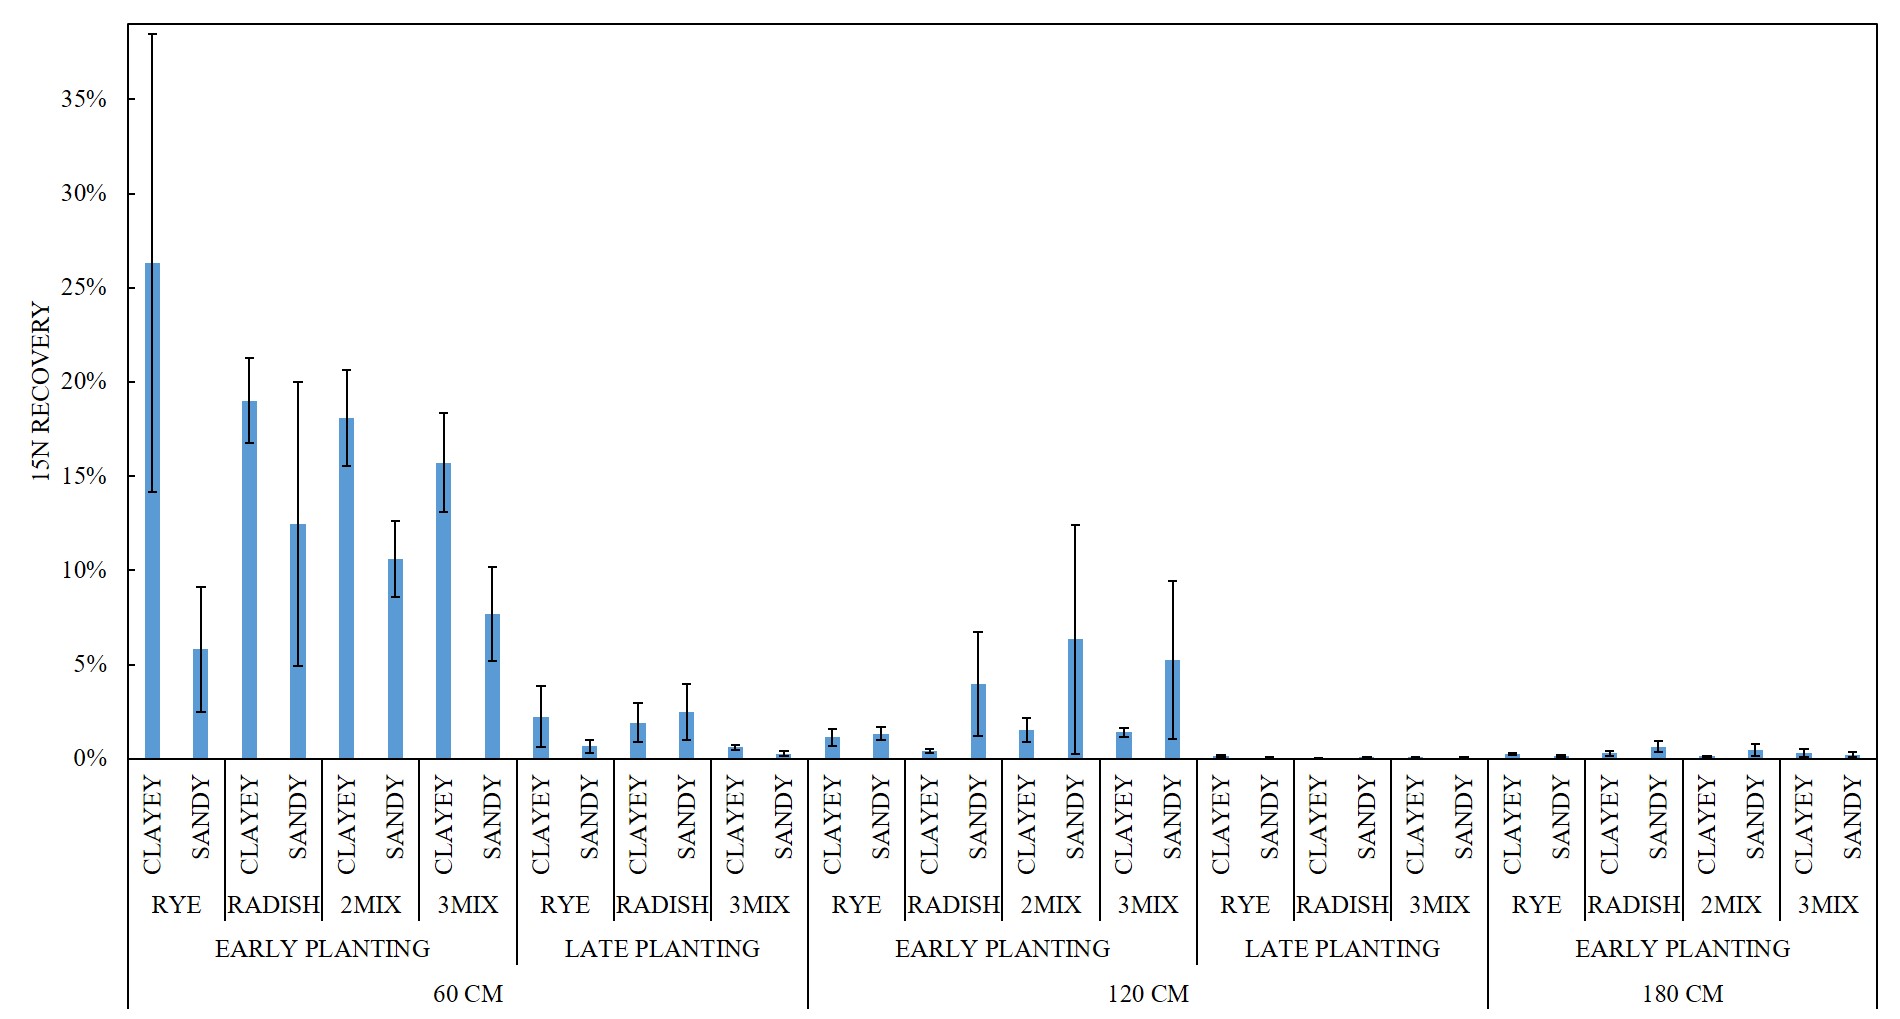
Table 9 and Table 10 list the mean, standard deviation, minimum and maximum 15N RECOVERY for every treatment combination for FALL samples from experiment #1 (prior to this grant) and for FALL and SPRING samples from experiment #2 (the current experiment).
Table 9 Percent recovery of 15N for December sampled cover crops, showing the number of observations per reported value (N), mean, standard deviation (SD), minimum value (Min) and maximum value (max)
|
Exp. # |
Site |
Planting date |
Cover crop |
N |
Mean |
SD |
Min |
Max |
|
100 cm 15N burial |
||||||||
|
Exp. #1 |
Clay |
Early |
Radish |
3 |
4.68% |
0.062228 |
0.55% |
11.84% |
|
Exp. #1 |
Sandy |
Early |
Radish |
3 |
35.75% |
0.158387 |
22.27% |
53.20% |
|
Exp. #1 |
Clay |
Early |
Rye |
3 |
3.32% |
0.027291 |
0.46% |
5.89% |
|
Exp. #1 |
Sandy |
Early |
Rye |
3 |
10.90% |
0.109122 |
0.50% |
22.26% |
|
Exp. #1 |
Clay |
Late |
Radish |
3 |
0.97% |
0.016172 |
0.01% |
2.84% |
|
Exp. #1 |
Sandy |
Late |
Radish |
3 |
0.03% |
0.000093 |
0.02% |
0.04% |
|
Exp. #1 |
Clay |
Late |
Rye |
3 |
0.05% |
0.000605 |
0.01% |
0.12% |
|
Exp. #1 |
Sandy |
Late |
Rye |
3 |
0.01% |
0.000029 |
0.00% |
0.01% |
|
Exp. #1 |
||||||||
|
Exp. #1 |
Clay |
Early |
Radish |
3 |
0.05% |
0.000234 |
0.03% |
0.07% |
|
Exp. #1 |
Sandy |
Early |
Radish |
3 |
0.64% |
0.004601 |
0.34% |
1.17% |
|
Exp. #1 |
Clay |
Early |
Rye |
3 |
0.10% |
0.001408 |
0.00% |
0.26% |
|
Exp. #1 |
Sandy |
Early |
Rye |
3 |
0.07% |
0.000525 |
0.01% |
0.11% |
|
Exp. #1 |
Clay |
Late |
Radish |
3 |
0.09% |
0.000404 |
0.05% |
0.13% |
|
Exp. #1 |
Sandy |
Late |
Radish |
3 |
0.07% |
0.000174 |
0.05% |
0.08% |
|
Exp. #1 |
Clay |
Late |
Rye |
3 |
0.02% |
0.000260 |
0.01% |
0.05% |
|
Exp. #1 |
Sandy |
Late |
Rye |
3 |
0.03% |
0.000196 |
0.01% |
0.05% |
|
60 cm 15N burial |
||||||||
|
Exp. #2 |
Clay |
Early |
2mix |
3 |
18.09% |
0.044421 |
13.03% |
21.36% |
|
Exp. #2 |
Sandy |
Early |
2mix |
3 |
10.61% |
0.035192 |
7.27% |
14.29% |
|
Exp. #2 |
Clay |
Early |
3mix |
3 |
15.72% |
0.045223 |
12.23% |
20.83% |
|
Exp. #2 |
Sandy |
Early |
3mix |
3 |
7.68% |
0.043497 |
3.16% |
11.84% |
|
Exp. #2 |
Clay |
Early |
Radish |
3 |
19.00% |
0.039068 |
14.49% |
21.42% |
|
Exp. #2 |
Sandy |
Early |
Radish |
3 |
12.44% |
0.130449 |
1.53% |
26.89% |
|
Exp. #2 |
Clay |
Early |
Rye |
3 |
26.33% |
0.210619 |
2.98% |
43.89% |
|
Exp. #2 |
Sandy |
Early |
Rye |
3 |
5.81% |
0.057153 |
2.06% |
12.38% |
|
Exp. #2 |
Clay |
Late |
3mix |
3 |
0.60% |
0.002297 |
0.46% |
0.87% |
|
Exp. #2 |
Sandy |
Late |
3mix |
3 |
0.27% |
0.002191 |
0.14% |
0.52% |
|
Exp. #2 |
Clay |
Late |
Radish |
3 |
1.91% |
0.017746 |
0.12% |
3.67% |
|
Exp. #2 |
Sandy |
Late |
Radish |
3 |
2.48% |
0.025630 |
0.50% |
5.37% |
|
Exp. #2 |
Clay |
Late |
Rye |
3 |
2.24% |
0.028191 |
0.34% |
5.48% |
|
Exp. #2 |
Sandy |
Late |
Rye |
3 |
0.67% |
0.006089 |
0.03% |
1.25% |
|
120 cm 15N burial |
||||||||
|
Exp. #2 |
Clay |
Early |
2mix |
3 |
1.53% |
0.010753 |
0.30% |
2.26% |
|
Exp. #2 |
Sandy |
Early |
2mix |
3 |
6.34% |
0.105510 |
0.12% |
18.52% |
|
Exp. #2 |
Clay |
Early |
3mix |
3 |
1.41% |
0.004084 |
0.98% |
1.80% |
|
Exp. #2 |
Sandy |
Early |
3mix |
3 |
5.26% |
0.072671 |
0.16% |
13.58% |
|
Exp. #2 |
Clay |
Early |
Radish |
3 |
0.41% |
0.002073 |
0.28% |
0.65% |
|
Exp. #2 |
Sandy |
Early |
Radish |
3 |
3.95% |
0.047937 |
0.03% |
9.30% |
|
Exp. #2 |
Clay |
Early |
Rye |
3 |
1.13% |
0.007414 |
0.43% |
1.91% |
|
Exp. #2 |
Sandy |
Early |
Rye |
3 |
1.31% |
0.005968 |
0.68% |
1.87% |
|
Exp. #2 |
Clay |
Late |
3mix |
3 |
0.07% |
0.000257 |
0.04% |
0.08% |
|
Exp. #2 |
Sandy |
Late |
3mix |
3 |
0.05% |
0.000405 |
0.01% |
0.09% |
|
Exp. #2 |
Clay |
Late |
Radish |
3 |
0.04% |
0.000333 |
0.00% |
0.06% |
|
Exp. #2 |
Sandy |
Late |
Radish |
3 |
0.07% |
0.000607 |
0.03% |
0.14% |
|
Exp. #2 |
Clay |
Late |
Rye |
3 |
0.13% |
0.000894 |
0.03% |
0.20% |
|
Exp. #2 |
Sandy |
Late |
Rye |
3 |
0.06% |
0.000332 |
0.02% |
0.08% |
|
180 cm 15N burial |
||||||||
|
Exp. #2 |
Clay |
Early |
2mix |
3 |
0.12% |
0.000479 |
0.07% |
0.16% |
|
Exp. #2 |
Sandy |
Early |
2mix |
3 |
0.48% |
0.005388 |
0.02% |
1.08% |
|
Exp. #2 |
Clay |
Early |
3mix |
3 |
0.32% |
0.003768 |
0.01% |
0.74% |
|
Exp. #2 |
Sandy |
Early |
3mix |
3 |
0.22% |
0.002259 |
0.08% |
0.48% |
|
Exp. #2 |
Clay |
Early |
Radish |
3 |
0.29% |
0.002293 |
0.07% |
0.53% |
|
Exp. #2 |
Sandy |
Early |
Radish |
3 |
0.65% |
0.004909 |
0.25% |
1.20% |
|
Exp. #2 |
Clay |
Early |
Rye |
3 |
0.24% |
0.000795 |
0.16% |
0.32% |
|
Exp. #2 |
Sandy |
Early |
Rye |
3 |
0.15% |
0.001021 |
0.07% |
0.26% |
Table 10 Percent recovery of 15N for April sampled cover crops, showing the number of observations per reported value (N), mean, standard deviation (SD), minimum value (Min) and maximum value (max)
|
Site |
Planting date |
Cover crop |
N |
Mean |
SD |
Min |
Max |
|
60 cm 15N burial |
|||||||
|
Clay |
Early |
2mix |
3 |
2.73% |
0.023644 |
0.90% |
5.40% |
|
Sandy |
Early |
2mix |
3 |
0.97% |
0.001925 |
0.78% |
1.16% |
|
Clay |
Early |
3mix |
3 |
2.02% |
0.013091 |
0.68% |
3.29% |
|
Sandy |
Early |
3mix |
3 |
0.63% |
0.002919 |
0.30% |
0.81% |
|
Clay |
Early |
Rye |
3 |
11.20% |
0.022208 |
9.40% |
13.68% |
|
Sandy |
Early |
Rye |
3 |
2.68% |
0.017060 |
1.65% |
4.65% |
|
Clay |
Late |
3mix |
3 |
5.80% |
0.053966 |
2.50% |
12.03% |
|
Sandy |
Late |
3mix |
3 |
0.14% |
0.000551 |
0.08% |
0.19% |
|
Clay |
Late |
Rye |
3 |
12.48% |
0.103993 |
0.74% |
20.54% |
|
Sandy |
Late |
Rye |
3 |
0.68% |
0.006721 |
0.05% |
1.39% |
|
120 cm 15N burial |
|||||||
|
Clay |
Early |
2mix |
3 |
0.11% |
0.000798 |
0.02% |
0.16% |
|
Sandy |
Early |
2mix |
3 |
1.20% |
0.019604 |
0.07% |
3.46% |
|
Clay |
Early |
3mix |
3 |
0.16% |
0.001969 |
0.04% |
0.38% |
|
Sandy |
Early |
3mix |
3 |
0.62% |
0.008736 |
0.03% |
1.62% |
|
Clay |
Early |
Rye |
3 |
0.54% |
0.000639 |
0.48% |
0.61% |
|
Sandy |
Early |
Rye |
3 |
1.02% |
0.009473 |
0.39% |
2.11% |
|
Clay |
Late |
3mix |
3 |
0.31% |
0.003084 |
-0.04% |
0.53% |
|
Sandy |
Late |
3mix |
3 |
0.37% |
0.005120 |
0.04% |
0.96% |
|
Clay |
Late |
Rye |
3 |
0.47% |
0.002995 |
0.28% |
0.81% |
|
Sandy |
Late |
Rye |
3 |
0.15% |
0.000499 |
0.09% |
0.19% |
|
180 cm 15N burial |
|||||||
|
Clay |
Early |
2mix |
3 |
0.04% |
0.000240 |
0.02% |
0.07% |
|
Sandy |
Early |
2mix |
3 |
0.09% |
0.001291 |
0.00% |
0.23% |
|
Clay |
Early |
3mix |
3 |
0.03% |
0.000387 |
0.00% |
0.07% |
|
Sandy |
Early |
3mix |
3 |
0.02% |
0.000115 |
0.01% |
0.03% |
|
Clay |
Early |
Rye |
3 |
0.12% |
0.000559 |
0.08% |
0.19% |
|
Sandy |
Early |
Rye |
3 |
0.07% |
0.000338 |
0.05% |
0.11% |
Cover crop sampling season differences
We assessed the 15N RECOVERY for RYE for the FALL sampling versus the SPRING. For the LATE PLANTING RYE with 120 CM 15N DEPTH, the 15N RECOVERY for SPRING RYE was higher than for FALL RYE. For all other CC DATE x 15N DEPTH treatment combinations, the 15N RECOVERY for SPRING RYE was not different than for FALL RYE or the FALL RYE had higher 15N RECOVERY than the SPRING RYE (Table 11).
Table 11 The 15N RECOVERY for FALL and SRPING RYE. The p-values indicated differences between FALL and SPRING LOG10 15N RECOVERY.
|
CC DATE |
15N DEPTH |
FALL 15N RECOVERY |
SPRING 15N RECOVERY |
p-value |
|
EARLY PLANTING |
60 cm |
16.07% |
6.94% |
0.30 |
|
120 cm |
1.22% |
0.78% |
0.11 |
|
|
180 cm |
0.19% |
0.10% |
0.036 |
|
|
LATE PLANTING |
60 cm |
1.45% |
6.58% |
0.10 |
|
120 cm |
0.09% |
0.31% |
0.032 |
Presence of buried 15N in corn
The fraction of plots (out of 3 possible) in the NO CC treatment with CORN V5 or CORN GRAIN AT% 15N/14N above the background level is indicated in (Table 12). In the NO CC treatments, the 15N RECOVERY of CORN V5 and of CORN GRAIN was not different between 15N DEPTH or SITE x 15N DEPTH treatments.
The fraction of plots (out of 3 possible) in each CC SPECIES treatment with CORN V5 or CORN GRAIN AT% 15N/14N above the background level is indicated in (Table 13). For the CORN V5, there were differences in the 15N RECOVERY among CC SPECIES treatments (p = 0.0237) and CC SPECIES x SITE treatments (p = 0.0064). Therefore, sites were analyzed separately. The distribution of the data was less skewed when sites were analyzed separately. For the CLAYEY site, the 15N RECOVERY of the CORN V5 in the 3MIX treatment (0.399%) was greater than the CORN V5 in the NO CC treatment (0.064%) (p = 0.0885). For the SANDY site, the 15N RECOVERY of the CORN V5 in the 3MIX treatment (0.0989%) was greater than the CORN V5 in the NO CC treatment (0. 0061%) (p = 0.0945). For the CORN GRAIN, there were no differences in the 15N RECOVERY among CC SPECIES treatments (p = 0.4389) and CC SPECIES x SITE treatments (p = 0.1184).
Table 12 Fraction of plots with CORN V5 or CORN GRAIN AT% 15N/14N above background. All plots were in NO CC treatment.
|
15N DEPTH |
SITE |
CORN V5 |
CORN GRAIN |
|
60 CM |
CLAYEY |
2/3 |
2/3 |
|
SANDY |
1/3 |
2/3 |
|
|
120 CM |
CLAYEY |
1/3 |
2/3 |
|
SANDY |
1/3 |
2/3 |
|
|
180 CM |
CLAYEY |
2/3 |
0/3 |
|
SANDY |
1/3 |
1/3 |
Table 13 Fraction of plots with CORN V5 or CORN GRAIN AT% 15N/14N above background. All plots were in EARLY PLANTING CC DATE treatment and 60 CM 15N DEPTH treatment.
|
SITE |
CC SPECIES |
CORN V5 |
CORN GRAIN |
CORN STALK |
|
CLAYEY |
RADISH |
3/3 |
3/3 |
|
|
RYE |
3/3 |
3/3 |
|
|
|
2MIX |
3/3 |
3/3 |
|
|
|
3MIX |
3/3 |
3/3 |
3/3 |
|
|
NO CC |
2/3 |
2/3 |
|
|
|
SANDY |
RADISH |
3/3 |
3/3 |
|
|
RYE |
3/3 |
3/3 |
|
|
|
2MIX |
2/3 |
3/3 |
|
|
|
3MIX |
3/3 |
3/3 |
3/3 |
|
|
NO CC |
1/3 |
2/3 |
|
Discussion
Presence of buried 15N—Levels of AT% 15N/14N above the background level indicates that the tissue contained 15N that originated from the buried tracer, either through the plant scavenging the tracer or the tracer being transferred between plants within a plot. We were surprised to find that in both the preliminary experiment and the current experiment, there were no trends regarding the presence of 15N in radish and rye cover crop species, related to their planting date or the 15N burial depth. In other words, every radish and rye treatment (regardless of planting date, site, or 15N burial depth) contained levels of 15N above the background. A few plots did not contain enriched 15N; however, these exception plots were not consistent between reps in a treatment. For the late-planted cover crops and 120+ cm burial depth treatments, the 15N percent recovery amounts were negligible. However, these findings support that radish and rye species both seem capable of quick, deep, root growth and are therefore promising “catch-crops”.
Cover crop percent recovery of N—In the preliminary experiment, early-planted cover crops recovered on average 13.7% of the buried 15N in the 100 cm burial plots, 52 times more than the late-planted cover crops, which only recovered 0.26% of the buried 15N in the 100 cm burial plots. In the current experiment, the early-planted cover crops took up on average 14.5% of the 15N that was buried at 60 cm, while the late-planted cover crops took up only 1.4%. In other words, the early-planted cover crops took up 10 times more 15N than the late-planted cover crops from 60 cm deep. While the percent recovery of the buried 15N from 120 cm deep was small in all cases, the early-planted cover crops took up 38 times more 15N (2.67%) than the late-planted cover crops (0.07%) from 120 cm deep. Our estimates of percent recovery may be underestimated, as we assumed there would be no 15N in plants greater than 20 cm from the burial point. Also, we did not account for any 15N from the rye roots, clover roots, or radish fine roots.
Legume in cover crop system—We expected that clover within the 3-way mix would not be able to scavenge 15N from the deeper depths (120 cm, 180 cm). For the fall growth at the clayey site, the clover in the early-planted 3-way mix treatment did not contain enriched levels of 15N from the 120 cm burial or the 180 cm burial in any of the replications. However, at the clayey site for the late-planted 3-way mix treatment, the clover contained enriched levels of 15N in 2/3 of the replications for the 120 cm burial. (There was no 180 cm burial treatment for the late-planted cover crops.) Also, at the sandy site for the early-planted 3-way mix treatment, the clover contained enriched levels of 15N in 2/3 of the replications for the 120 cm burial and in 3/3 of the replications for the 180 cm burial. At the sandy site for the late-planted 3-way mix treatment, the clover was enriched in 2/3 of the replications for the 120 cm burial. Because we did not have a monoculture clover treatment, we cannot know for certain if the clover was actually able to reach the deep buried 15N. However, we believe it is more likely that the clover picked up 15N from its deeper rooted neighbors (radish and rye), through sloughed cells, root turnover, or N leaching from senescing leaves (Dabney, et al., 2010, Maeght, et al., 2013, Smil, 1999).
Adding clover to the mix does not seem to hinder the N uptake of radish, a concern of some practitioners and policy makers. For example, prior to 2015, farmers were not eligible for incentive payments through the cover crop program if they planted mixed species cover crops that included a legume (http://www.nascanet.org/nasca/wp-content/uploads/2015/12/2015CoverCropProgram.pdf). Both the radish and rye cover crops contained tracer from 180 cm deep regardless of whether they were part of a mixed stand with clover or not. Furthermore there was no difference in the amount of 15N taken up by the 2-way mix versus the 3-way mix cover crops when 15N was buried at 60 cm, 120 cm, or 180 cm.
Fall versus spring cover crop growth—We hypothesized that if a cover crop did not scavenge deep soil NO3 in the fall, the NO3 would be out of reach for the spring cover crop. We compared the percent recovery of the buried 15N in the fall rye growth versus spring growth. For the early-planted rye, the percent recovery was higher in the fall than the spring for 60 cm, 120 cm, and 180 cm burial depths. For the late-planted rye, the spring percent recovery (6.58%) was higher than the fall (1.45%) for the 60 cm burial, although not significantly (p = 0.1042), and the spring percent recovery (0.31%) was significantly higher than the fall (0.09%) for the 120 cm burial (p = 0.0318), although by a very small amount. Therefore, the late-planted rye does take up additional 15N during spring growth, but not amounts that would be expected to have an impact on reducing NO3 leaching or supplying N to a following crop.
Corn following cover crops—There was evidence that corn following a cover crop was more likely to be enriched in 15N or have greater uptake of 15N than corn that did not follow a cover crop. However, the percent recoveries that we observed were very low (< 1%) regardless of whether there was a previous cover crop or not.
Dabney, S.M., J.A. Delgado, J.J. Meisinger, H.H. Schomberg, M.A. Liebig, T. Kaspar, et al. 2010. Using cover crops and cropping systems for nitrogen management. Advances in nitrogen management for water quality: 231-282.
Maeght, J.L., B. Rewald and A. Pierret. 2013. How to study deep roots-and why it matters. Frontiers in plant science 4: 299. doi:10.3389/fpls.2013.00299.
Smil, V. 1999. Nitrogen in crop production: An account of global flows. Global Biogeochemical Cycles 13: 647-662.
- Cover crop species of radish, rye, radish + rye, and radish + rye + clover all proved effective at capturing deep soil N. (However, related research that we performed indicated that rye monoculture causes reduced corn yield and/or higher corn N fertilizer requirements.)
- Adding clover to the cover crop mix did not hinder the N uptake of radish or rye, a concern of some practitioners and policy makers.
- Cover crops can be effective at scavenging N from 1+ m deep, but they must be planted by early-September. In the fall, early-planted cover crops captured on average 14.46% of the buried 15N from 60 cm and 2.67% of the buried 15N from 120 cm, while late-planted cover crops captured on average 1.36% of the buried 15N from 60 cm and 0.07% of the buried 15N from 120 cm.
- Spring cover crop growth will not compensate for a late-planting date. While there was evidence that late-planted rye captured additional 15N from 120 cm burial, the percent recovered was still < 1% of the burial 15N and therefore would not be expected to have an impact on reducing NO3 leaching or supplying N to a following crop.
- The work funded by this grant and the closely related SARE grant LNE14-338 (Deep soil nitrogen: A resource for sustainability in the mid-Atlantic using early cover crops) has reached thousands of people including farmers, farm advisers, policy makers, and others, through 4 farm magazine articles, 5 publications/newsletters, 3 field-days, 1 webinar, 4 videos/podcasts, 18 Extension meeting presentations, and 6 professional meeting presentations. We have learned through participant questionnaires at various Extension events and informal conversations, that farmers are aware of the N capturing benefits of early-planted cover crops and are striving to incorporate early-planted cover crops on their farms.
Education & outreach activities and participation summary
Participation summary:
A large local and national audience of farmers learned about the basic early cover crop-planting nitrogen-capture concepts of our project via the following list of publications and events. Some items in this list are repetitive from the list in SARE grant LNE14-338 (Deep soil nitrogen: A resource for sustainability in the mid-Atlantic using early cover crops) because presentations and publications in this list discussed research done under the scope of both of these grants.
Farm magazine articles
Lancaster Farming-- "the leading Northeast and mid-Atlantic farm newspaper" with 60,000 paid subscribers in Pennsylvania and 15 other states (http://www.lancasterfarming.com/site/about.html)
- Bravo, M. 2017. Cover crop researchers converge in New York. Lancaster Farming North Edition, p. A2. Press coverage of Hirsh’s talk at Northeast Cover Crop Conference at Cornell University.
Farm Journal --the leading US farm magazine with 250,000 unique users and 1,000,000 visits per month
- Weil, R. 2016. Digging deeper: Using nitrogen in the entire soil profile. Farm Journal. Vol 6 No 4. Howard G. Buffet Foundation. http://harvestingthepotential.org/media/ Buffet Foundation
- Weil, R. 2016. Cover crop trials reveal N reduction. Farm Journal. Vol 6 No 8. Howard G. Buffet Foundation http://harvestingthepotential.org/media/pdf/H/G/B/HGBF-Vol6No8-FJ-Nov2016-Hill-Weil-LR-FINAL.pdf
Publications and Newsletters
- Hirsh, S., R. Weil. Fall 2016. Getting cover crops planted in September, despite late crop harvests. University of Maryland Extension Ag Newsletter. Volume 7, Issue 6. pp. 10-11.
- Hirsh, S., R. Weil. Fall 2015. It’s August—are your cover crops growing yet? University of Maryland Extension Ag Newsletter. Volume 6, Issue 5. pp. 2-4.
- Nutrient Management Annual Report. 2015. Nutrient management research for agronomic and vegetable crops. Page 9. https://extension.umd.edu/sites/default/files/_docs/programs/anmp/NMAR_2015.pdf. Circulated in print to 2,000 famers and ag professionals on line.
- DeVore, B. 2015. King of the cover crops: An Indiana initiative has made the state a national leader in getting continuous living cover established on crop acres. Can it change the way farmers view soil? The Land Stewardship Letter 33(4):24-27. Features Ray Weil’s week-long visit to Indiana’s Conservation Cropping Initiative.
- Graybill, Jeffrey S. December 2015. Is excessive growth effecting the winter survival of small grains? Penn State Field Crops Newsletter. http://extension.psu.edu/plants/crops/news/2015/12/is-excessive-growth-effecting-the-winter-survival-of-small-grains
Field-days (40 total attendees)
- Hirsh, Sarah and Ray Weil. 2017. Field-day: Getting the most from cover crops. Laurel, MD. 1 November 2017. 40 in attendance (17 MD Dept of Ag or USDA, 16 University of Maryland, 4 farmer, 3 other).
Webinars
- Weil, R., and S. Hirsh. 27 February 2017. Go deep, go early—effective cover cropping for nitrogen capture. On-line Webinar. 1 hour. Agricultural Nutrient Management Program, University of MD, https://www.youtube.com/watch?v=yCXoh7BqxNw&feature=youtu.be
Videos and podcasts
- Weil, R. 2015. The science of soil health: Going deeper, In B. Koots, (ed.) Unlock the Secrets in the Soil. USDA/NRCS. https://www.youtube.com/watch?v=XzfFFNG5mnQ
- Weil, R. 2015. The science of soil health: Going Deeper, part 2, In B. Koots, (ed.) Unlock the Secrets in the Soil. USDA/NRCS.https://www.youtube.com/watch?v=Qo6zvBBROL0
- Weil, R. 2015. Dr. Ray Weil’s deep nitrogen study. Fresh from the Field: On Farm Interview Series. Cover Crop Solutions. https://www.youtube.com/watch?v=X21bge_yVUY
- Weil, R. 2015. A soil scientist compares Indiana’s ‘bottom up’ approach to advancing soil health to Maryland’s ‘top down’ system. Ear to the Ground, Episode 174, Land Stewardship Project, http://landstewardshipproject.org/posts/podcast/787
Extension meetings (approx. 883 total attendees)
- Hirsh, Sarah and Ray Weil. Mid-Atlantic Crop Management School. 1 hour workshop: How strategic cover cropping doesn’t cost- it pays. 14 November 2017. Ocean City, MD. 2 workshops with 45 attendees each, 90 total.
- Hirsh, Sarah and Ray Weil. Mid-Atlantic Crop Management School. 1 hour workshop: Capturing nutrients with early planted cover crops. 15 November 2017. Ocean City, MD. 2 workshops with 100 attendees each, 200 total.
- Hirsh, Sarah and Ray Weil. Northeast Cover Crops Council. 30 minute presentation: Using cover crops to scavenge and recycle deep soil N. 8 November 2017. Ithaca, NY. 50? attendees.
- Hirsh, Sarah and Ray Weil. Delaware Agriculture Week Soil Health Workshop. Soil Health and On-Farm Research in the Mid-Atlantic Region. 12 January 2017. Harrington, DE. 163 attendees.
- Weil, Ray. Invited member of the 2nd annual Panel on “Can food production and a clean Chesapeake Bay coexist?” sponsored by the Chester and Sassafras River Keepers Associations and the Washington College Center for Environment. Washington College. Chestertown, Md. 1 November 2016. Two hour discussion with 200 members of Eastern Shore of Maryland agriculture community in attendance.
- Hirsh, Sarah and Ray Weil. 2016. Deep Soil Nutrients- a Neglected Resource for Profitability and Environmental Stewardship. Presentation at Commodity Classic Field Day. Centreville, Md. 28 July 2016. 50 farmers and agric. professionals in attendance.
- Weil, Ray. 2016. Creativity in Cover Cropping Systems for Farm Profitability and Clean Water. Invited Presentation to Howard County Extension Winter Ag Meeting. 17 February 2016. Glenwood, Md. 60 farmers and agric. professional in attendance.
- Weil, Ray. 2015. Invited paper: The Soil Health Revolution in American Agriculture and What It’s Success Could Mean for the Planet. 9th Annual Meeting of Pesticides and the Chesapeake Bay Watershed Project. Maryland Pesticide Network and The Johns Hopkins Center for a Livable Future. Pearlstone Conference Center. Reisterstown, MD. 8 October 2015. http://www.mdpestnet.org/media/ https://projects.sare.org/media/pdf/L/N/E/LNE14338Poster2018nationalSAREconferenceWeil.pdf
- Hirsh, Sarah M. and Ray Weil. 2017. Tracking deep soil nitrogen in cover crop systems: a N-15 isotope study. Soil Science Society of America/American Society of Agronomy. Annual International Meetings. 23 Oct 2017.
- Hirsh, Sarah M. and Ray Weil. 2017. Using cover crops to capture and recycle deep soil N: on-farm experiments. Soil Science Society of America/American Society of Agronomy. Annual International Meetings. 24 Oct 2017.
- Hirsh, Sarah M. and Ray Weil. 2017. How much nitrogen is left in the soil profile after summer annual crops? A deep N survey on mid-Atlantic farms. Soil Science Society of America/American Society of Agronomy. Annual International Meetings. 23 Oct 2017.
- Weil, Ray, Sarah Hirsh, and Fang Wang, 2016. Looking Deeper for Impacts of Soil Management. Soil Science Society of America/American Society of Agronomy. Annual International Meetings. Phoenix, Arizona. 7 Nov 2016.
- Hirsh, Sarah M. and Ray Weil. 2015. Isotopic Evaluation of Deep Soil Nitrogen Uptake by Cover Crop Systems. Soil Science Society of America/American Society of Agronomy. Annual International Meetings. Minneappolis, MN. 18 Nov 2015.
Project Outcomes
Through this research, we were able to investigate the amount and depth of N that was being captured by various cover crop species, with different planting dates. Subsequently, we were able to develop early-planted, deep-rooted cover crop systems that can scavenge and recycle residual soil N. We found on average that 250 kg mineral N/ha, 55% of which was 90-210 cm deep, remained in the soil after growing corn and soybean. This residual N poses an environmental risk, as the N can leach from the system and pollute bodies of water. It also poses an economic risk, because if the N leaches from the system the farmers lose a valuable N resource. On the other hand, if this N is recycled by deep-rooted cover crops to the surface soil, where it could provide a substantial amount of N to subsequent crops, it could allow farmers to reduce fertilizer applications. Cover cropping is already a widely used practice in Maryland; there were approximately 639,700 acres of cover crops in 2017 (http://news.maryland.gov/mda/press-release/2017/07/31/agriculture-department-announces-cover-crop-sign-up-totals-for-fall-2017/). Farmers in the region have been interested and receptive to modifying their cover cropping practices to include early-planted cover crops and more diverse species. For example, we had filled-to-capacity seminar sessions at Maryland Crop School and well-attended field-days. On a post field-day survey, all 23 attendees who responded indicated that they “agreed” or “strongly agreed” that the field-day increased their likelihood to “aim to plant cover crops by early September in future growing seasons or encourage others to do so”. We collaborated with 23 farmers through the course of this research, either surveying deep soil residual N or implementing cover crop trials. We formed working relationships with Extension agents at University of Maryland and Penn State University, and started a follow-up project with the Shore Rivers Association in Maryland to further investigate the N scavenging cover crop systems. The EPA Interim Evaluation of Maryland’s 2016-2017 milestones reports that the Agriculture sector in Maryland is not on-track to reach its 2017 targets for nitrogen (60% of necessary reductions compared to 2009). Cover crops are already widespread on the landscape in Maryland, and we believe that the adoption of early-planted, deep-rooted cover crop systems will reduce N leaching through cover crop N uptake and recycling to subsequent crops, and lead to improvements in reducing the N load into bodies of water (e.g., Chesapeake Bay), while saving farmers money (e.g., fertilizer costs).
During the course of this project, I have gained an in-depth understanding of cover crops, rooting patterns, and the N cycle. In addition, I have a greater appreciation of the complexity of agroecosystems, and specifically the N cycle. Improving the efficiency of N cycling in cover crop-cash crop systems involves key components of sustainable agriculture such as maintaining growing plants on the landscape as many months as possible and utilizing diverse species. I have had the opportunity to work with farmers and understand their perspectives on sustainable agriculture. The farmers that I have worked with and conversed with during Extension events have been receptive and excited about sustainable agriculture practices. They understand that the practices will be beneficial for the productivity and profitability of their farm enterprise as well as have environmental benefits. Through working and collaborating with farmers, I have learned that the economic cost-benefit analysis and practical considerations (e.g., farm equipment available) should be key considerations when developing farming systems.
I have plans to work as an Extension agent for University of Maryland. In this position, I will perform education, outreach, and research to encourage sustainable farming practices and to improve the environmental, economic, and social viability of agriculture in Maryland.
We are continuing to research early planted cover crop systems through a project sponsored by the Shore Rivers Association (duration 7/1/2017-6/30/2021), “Raising the Bar: A Comprehensive Approach to Nutrient Management on Farms”. This project involves working with 7 to 14 farms to compare early-planting of cover crops to their normal practice of drilling after crop harvest, and to compare late-killing (planting green) compared to their normal practice of early-kill. Nitrogen leaching and runoff will be monitored as well as cover crop performance and crop yields.
Through using 15N isotopic tracer, we were able to answer questions that could not be answered on our on-farm cover crop trials in which we were measuring changes in amounts of deep soil mineral N. The 15N tracer allowed us to determine that cover crops were in fact capturing N from deep soil layers by December, and to evaluate the percent recovery of N by cover crops at various soil depths. The field setting of the experiment made it challenging to assess the cycling of N from cover crops to corn using the 15N methods. A more controlled 15N laboratory study is recommended to increase the understanding of the fate of N captured by the cover crops (e.g., whether it is taken up by the following crop, immobilized, released into soil, denitrified, etc).
We now have solid evidence that radish, rye, radish + rye, and radish + rye + clover cover crops do capture substantial deep soil N, if they are planted by early September. We can confidently recommend that farmers plant early cover crops and that policies be amended to encourage the planting of early cover crops. The most common question/concern we have received from farmers is how to plant cover crops by early September following corn or soybean crops that are not harvested until October. We have an ongoing research project that is addressing this concern. For example, we are investigating systems of interseeding and aerially seeding cover crops into a standing corn or soybean crop. We also receive many questions/concerns about the financial costs or benefits of early cover crops. Future research on approaches to plant cover crop early should include economic analyses.