Final report for GNE15-111
Project Information
Historical application of manure to agricultural lands on the Delmarva Peninsula has led to accumulation of soil test phosphorus (STP) to levels that often exceed agronomic optimum. Excessive STP is linked to water quality degradation in sensitive water bodies. Farmers growing small grains on Delmarva often apply starter P fertilizers (despite excessive STP) to address early season P deficiencies, which may further enrich soils with P. Fertilization of soils with silicon (Si) is promising as a best management practice that can enhance crop P uptake, eliminate fall starter-P applications for small grains, and improve crop yields. The purpose of this project is to evaluate the effects of Si fertilizer type and rate on soil P availability and winter wheat yield and P uptake by conducting a pot study and a corresponding field trial. Results from our pot study indicated that Si application improved soil P solubility; but the effect depended on the source and rate of applied Si. Specifically, calcium silicate (CaSiO3; a commercial liming material containing Si) at optimum liming rate only significantly increased the water extractable P (WEP) of three legacy P impacted agricultural soils compared with no Si control in the first one or three month after application. In contrast, silicic acid application at a total Si rate of 2 Mg ha-1 consistently increased soil WEP over the entire growing season for all three soils. Application of silicic acid at lower total Si rate or silica gel at a total Si rate of 2 Mg ha-1 also periodically increased WEP concentrations compared with the unamended control in evaluated soils. We believe that Si fertilization increased P solubility in soils as evidenced by the increasing ratios of WEP to Mehlich-3 extractable P in soils amended with Si fertilizer compared with unamended controls. However, we did not find any significant increase in winter wheat yield and P uptake following Si application in our pot study; a higher Si application rate and/or longer application history may be needed to have a significantly impact. We also reported no significant Si treatment effects on soil WEP concentrations, wheat yield, or P uptake by winter wheat in the on-farm field trial. The lack of significant response in our field trial may be related to variability in soil properties at a larger scale. Overall, we suggest that CaSiO3 is a promising Si source that improve P availability in acidic soils at the early growing season of winter wheat and can potentially reduce the use of starter P fertilizer; more research is needed. However, CaSiO3 may only be a sufficient Si source for low pH soils with relatively high buffer capacity and may not be providing enough Si for other soils due to its liming effect.
Introduction:
Grain farmers in areas of intensive animal production, like the Delmarva Peninsula, where over 550 million broiler chickens are produced annually, face significant nutrient management issues related to historical application of manure to agricultural lands. Application of poultry litter to meet crop N requirements resulted in over-application of P, and ultimately to accumulation of P (often to levels that are several times the agronomic optimum) and saturation in many agricultural soils on Delmarva. This accumulated or “legacy” P acts as a continuous source of dissolved P from agricultural soils during runoff and/or leaching events, which can negatively impact water quality in sensitive water bodies like the Chesapeake Bay. As a result, it is important for farmers to carefully manage legacy P soils to reduce the risk of P losses that lead to water quality degradation.
While common nutrient management BMPs (e.g., filter strips, 4R nutrient stewardship, and conservation tillage) help reduce the risk of edge-of-field P losses from soils due to newly applied manures and fertilizers, they often fail to control legacy P losses. Today, land application of manures (like the poultry litter used on Delmarva) is often limited due to high soil test P levels. Farmers have adjusted to P-based rates of manure application by supplementing manure N with conventional N fertilizers, which are often applied at sidedress. However, build-up of soil test P continues in some soils (when risk assessment allows continued application of manure at N-based rates), and drawdown of soil test P on “legacy P” soils is limited due to continued application of poultry litter at P based rates (where P removal rates match P application rates). Consequently, environmental groups seek to further limit poultry litter applications on Delmarva citing continued application as a barrier to water quality improvement efforts in the Chesapeake Bay. As a result, farmers on Delmarva (and other areas of intensive animal production) will face continued pressures to reduce manure use. Yet, even if manure application on Delmarva were to stop today, a decline in soil test P levels to agronomic optimum would take decades for many legacy P soils under current grain and forage cropping systems.
Despite the prevalence of legacy P soils, local farmers indicate issues with P uptake by crops, particularly with winter wheat, which is commonly grown as part of a corn-soybean-small grain rotation. Many farmers tout (corroborated by regional research) the benefits of starter P fertilizers on winter wheat to combat early season P deficiency and ensure good fall tillering, which is vital for maximizing yield. Early season P deficiency is related to cool soil temperatures at the time winter wheat is planted and the fact that that significantly amount of P are strongly bonded with iron (Fe) and aluminum (Al) in acid soils and may not be immediately available to growing crops. However, applications of P fertilizer to legacy P soils are often considered taboo because supplemental P applications may further enrich soils with P and further drive regional water quality issues. Thus, it is crucial to identify effective BMPs that can improve early season P availability to winter wheat and enhance the crop removal of soil P over the typical three-year grain cropping cycle.
Fertilization of soils with Si may offer farmers the ability to reduce early season P deficiencies in winter wheat (and other small grains) without application of starter P fertilizers by enhancing the solubility of P already present in the soil and by increasing crop uptake. In addition, small grains may benefit from application of additional Si, which has been shown to suppress plant diseases caused by bacteria and fungi and reduce drought stress. Specifically, we seek to evaluate the potential for fall Si applications as a practice that can reduce the environmental risk of grain production on high P soils, reduce grower input costs, and increase small grain yields. This project directly addresses two of the “key themes in sustainable agriculture”: 1) the reduction of environmental and health risks in agriculture; and 2) improved productivity, the reduction of costs, and the increase of net farm income. This project extends previous research on the dynamics of Si and P in soils and cropping systems and explores a new approach to management of legacy P soils, which is a serious issue faced by grain farmers on Delmarva and in other areas of intensive animal agriculture.
The objective of this proposal was to evaluate fall Si fertilization to enhance soil P availability and uptake by winter wheat from legacy P soils (excessive soil test P due to historical P application). We proposed a pot study and a corresponding field trial to evaluate fall Si fertilization effects on soil P availability and P uptake by winter wheat grown on legacy P soils. The pot study was designed to determine the effects of Si fertilizer sources and Si rate on soil P dynamics and winter wheat response (e.g., yield, P uptake). The field trial extended the pot study to determine the utility of applying locally available Si sources to winter wheat under field conditions. The overall goal of our Si fertilization research is to develop a novel BMP that can help farmers reduce the environmental risks associated with legacy P soils, increase crop uptake of P to speed draw down of soil test P levels, and enhance winter wheat yields.
Cooperators
Research
Pot Study
Soil samples were collected from three legacy P impacted agricultural fields near Millsboro, DE. The major soil complexes for the fields were Ft. Mott-Henlopen, Ingleside-Hammonton, and Mullica-Berryland, respectively. Composite soil samples were randomly collected to a depth of 20 cm from each field using a shovel to obtain several kilograms (equivalent to 0.21 m3 soil) of soil for use in the pot study. The soils were air-dried following removal of large pieces of plant detritus and soil clods (larger than fist size).
Prior to initial chemical analysis, soil samples were ground and sieved through 2-mm screen. Soil samples were analyzed, in duplicate, using NECC (2011) standard soil testing procedures for pH (1:10 soil/deionized water), Adams-Evans buffer pH, and organic matter by loss on ignition, as well as for soil particle size using hydrometer method (Bouyoucos, 1962). Soil test P, Al, Fe, potassium (K), magnesium (Mg), manganese (Mn) and calcium (Ca) concentrations were analyzed by inductively coupled plasma optical emission spectroscopy (ICP-OES) following Mehlich-3 extraction. The degree of P saturation (DPSM3) was calculated as the molar ratio of Mehlich-3 extractable P (M3P) divided by the sum of the molar ratios of Mehlich-3 extractable Al and Fe, and converted to percentage by multiplying with 100. Initial soils were also analyzed for water extractable P (WEP; Self Davis et al., 2009) by spectrophotometer (Murphy and Riley, 1962) following reaction of 2 g of soil with 20 mL of deionized water for 1 h (centrifuged, filtered through 0.45-µm filter), and 0.5 M acetic acid extractable Si (AA-Si; Heckman and Wolf, 2011) by ICP-OES. Selected initial soil properties were summarized in Table 1.
Fifty-four pots were arranged outdoors at the University of Delaware (UD) research farm located in Newark, DE in a completely randomized design with three replicates. Air-dried soil from each of the three “legacy P” fields was added to 11.4-L plastic pots to a depth of 20 cm. Silicon fertilizers were mixed thoroughly into each of the soils as follows: 1) locally available CaSiO3 lime alternative (AgrowSil) at the rate required to raise pH to optimum growth of winter wheat based on results of the initial soil test; 2) silicic acid at the same total Si rate as in treatment 1; 3) silicic acid at two times the total Si rate as in treatment 1; 4); silicic acid at a total Si rate of 2 Mg ha-1 and 5) Si gel at a total Si rate of 2 Mg ha-1. Based on the pH and buffer pH of initial soils (Table 1), commercial lime rates of 2.2, 2.2, and 4.5 Mg ha-1 were suggested for Ft. Mott-Henlopen and Ingleside-Hammonton, and Mullica-Berryland soil series respectively to provide optimum growth of winter wheat (pH = 6.0; Shober et al., 2017). However, we were concerned that Si treatments based on application of CaSiO3 lime alternative (100% calcium carbonate equivalent) suggested rate may not provide enough Si (only about 0.27 to 0.54 Mg ha-1 based on x-ray florescence analysis) to affect plant growth and P solubility. As a result, we increased the liming rate slightly to achieve a pH of 6.5 by applying 3.4, 3.4, and 5.6 Mg ha-1 of CaSiO3, which resulted in approximately a Si application rate of 0.41, 0.41 and 0.68 Mg ha-1 for the Ft. Mott-Henlopen, Ingleside-Hammonton, and Mullica-Berryland soil series, respectively. Additionally, an unamended control (no Si) treatment was included for each soil type. Calcitic lime (CaCO3) was applied to all pots, except those receiving the agronomic CaSiO3 treatment, to achieve a pH of 6.5 for winter wheat at rates based on the initial soil test.
Before potting, ammonium sulfate (21-0-0-24S) was applied to soils at a nitrogen (N) rate of 34 kg ha-1 (Alley et al., 2009). Potassium (in the form of K2SO4, 0-0-52-18S) and manganese (Mn, in the form of MnSO4) was applied based on the initial Mehlich-3 K and Mn concentrations (Table 1) following UD fertility recommendation (Sims and Gartley, 1996). Lime, nutrient, and Si sources were thoroughly mixed into all three soils using a mixer and transferred to pots. Each pot was then thoroughly wetted on 16 Nov. 2015 and left fallow for a week to allow equilibrium of applied fertilizers and lime. Soils were sampled using a hand probe on 20 Nov. 2015 to evaluate Si and P dynamics soon after the application of Si. Soil subsamples were collected from three random locations in each pot using a hand probe and mixed to create a composite sample for each pot. Soil samples were then air-dried and sieved through 2-mm filter and analyzed for WEP and AA-Si, as described previously. Winter wheat was planted to achieve a seeding rate of 400 seeds m-2 (equal to 25 seeds per pot) in a greenhouse (to achieve rapid and uniform germination) on 24 Nov. 2015. Potted wheat was then transferred to an outdoor pot-in-pot facility at the UD Newark research farm on 1 Dec. 2015 to be grown under ambient conditions through 24 June 2016 (approximately 31 weeks). Additional N fertilizer was applied at green-up (on 1 Apr. 2016; approximately Zadocks’ growth stage 25) at a N rate of 67 kg ha-1 (Alley et al., 2009), and again on 2 May 2016 at a N rate of 34 kg ha-1 to correct visual N deficiency.
Soil samples were randomly collected from each pot using a tip-removed 10-mL syringe (5 to 10 samples from each pot) every month until post-grain harvest (12 July 2016); soil samples were analyzed for WEP and AA-Si as described previously. Additional soil samples collected from each pot at 40 d (early growth) and 209 d (post-harvest) after Si incorporation were analyzed for pH, organic matter, Mehlich-3 extractable P, Al, Fe, K, Ca, and Mg, and DPSM3 as described previously. The ratio of WEP to M3P was calculated to evaluate the solubility of soil P for soils sampled from each pot (i.e., higher ratio suggesting higher P solubility). Soil samples collected at harvest were also analyzed for P sorption characteristics to evaluate changes in P sorption capacity of soils following Si addition. Briefly, 2 g of air-dried soils were equilibrated with 30 mL of P solution (as KH2PO4 dissolved in 0.01 M CaCl2, CaCl2 being used to maintain a constant ionic environment) at P concentrations of 0, 0.1, 1, 5, 10, 35, and 50 mg L-1. Samples were shaken for 24 h, centrifuged for 10 min, and filtered through 0.45-µm filters and the extracts were analyzed for P using ICP-OES. Phosphorus sorption data was used to construct Langmuir isotherms (Bolster and Hornberger, 2007) to estimate soil maximum sorption capacity of P (Smax).
At harvest, all aboveground biomass was removed at the soil surface, oven dried at 65 ˚C and weighed. Wheat berries were then hand harvested and weighed separately, and the straw weight was calculated by subtracting the weight of the grain from the weight of the total above ground biomass for each pot. All oven-dried wheat berries and straw were ground separately using a Wiley mill. Sub-samples of straw and grain berries were analyzed separately for Si and P after microwave-assisted nitric acid digestion following the method described in Seyfferth et al. (2016). Straw weights, grain weights, and corresponding total digestible P concentrations were used to estimate the P uptake by winter wheat following application of Si treatments.
Data were analyzed using a mixed model analysis of variance procedure (PROC MIXED in SAS) with soil and treatment as fixed effects and replicate as a random effect (SAS Institute, 2008) to determine the effects of Si application on soil P status and soil treatment on wheat yield and uptake of P and Si. Effects of soil and Si treatment on soil P sorption capacity was also evaluated using PROC MIXED. All pairwise comparisons were completed using the Tukey’s honestly significant difference test with a significance level of alpha = 0.05.
On-farm Field Trial
Twelve strip plots (4.57 m × 30.5 m) were set up on a cooperator farm in a randomized complete block design at University of Delaware Carvel Research and Education Center in Georgetown, DE. The dominant soil series for the field was a Pepperbox loamy sand; initial soil properties were described in Table 1. Four treatments were randomly assigned to each plot as: 1) Standard fertility (no P) without calcitic lime, 2) Standard fertility (no P) with calcitic lime (3.36 Mg ha-1), 3) Standard fertility with starter P (56 kg ha-1) and calcitic lime (3.36 Mg ha-1), and 4) Standard fertility (no P) with AgrowSil (about 0.5 Mg Si ha-1). Both calcitic lime and AgrowSil were applied for the target pH of 6.0 according to initial soil test (Table 1). All the chemicals were mixed thoroughly into the soils on 2 Nov. 2016. Plots were seeded with Southern States 8340 winter wheat on 3 November 2016 at a rate of 123 kg ha-1. Potassium fertilizer (K2O) was applied in late October at a total rate of 123 kg ha-1. Nitrogen fertilizer (UAN 30-0-0-11S) was applied on 22 November 2016 at a N rate of 36.4 kg ha-1and again on 6 March 2017 at a N rate of 54.9 kg ha-1.
Soil samples were collected randomly to a depth of 15 cm from each plot on 1 November 2016 (prior to planting), before dormancy (21 Dec. 2016) at spring green-up (6 March 2017), and after harvest (19 July 2017) using a soil auger. Soils was air-dried, ground, passed through 2-mm screen, and analyzed for, pH, Adams-Evans pH, organic matter, WEP, AA-Si, and soil test P, Si, Al, Fe, K, Ca, and Mg (Mehlich 3 extraction) as described previously. Aboveground plant biomass was sampled early in the season (6 March 2017) and during harvest (19 June 2017) from three to four areas (1 m x 1 m) within each plot, dried, weighed, digested, and analyzed for total Si and P as described previously.
Data were analyzed using PROC MIXED in SAS with soil treatment as a fixed effect and block as a random effect (SAS Institute, 2008) to determine the effects of soil treatment on wheat yield and P and Si uptake. All pairwise comparisons were completed using the Tukey’s honestly significant difference test with a significance level of alpha = 0.05.
Pot Study
Effect of Si fertilization on soil P dynamics
We found that application of silicic acid to the Ft. Mott-Henlopen and Mullica-Berryland soils at the 2 Mg ha-1 total Si rate significantly increased soil WEP concentrations compared with the unamended soils throughout the study. The Ingleside-Hammonton soils amended with 2 Mg ha-1 silicic acid also periodically showed increased soil WEP concentrations, which persisted for at least 40 d after Si incorporation (Table 2). Application of silicic acid to the Ft. Mott-Henlopen soils at the total Si rates lower than 2 Mg ha-1 periodically increased the soil WEP concentrations compared with the unamended control, especially early in the study (at least through 40 d after Si incorporation). Application of silicic acid at two times total Si rate provided by CaSiO3 lime to the Mullica-Berryland soils also increased the soil WEP concentrations compared with the unamended control (4, 40, 80, and 129 d after Si corporation; Table 2). However, silicic acid applied at total Si rates lower than 2 Mg ha-1 did not increase soil WEP concentrations compared with unamended control for the Ingleside-Hammonton soil (Table 2). Silica gel applied at total Si rate of 2 Mg ha-1 also periodically increased soil WEP concentrations when applied to the Ft. Mott-Henlopen (4, 40, 98, 189, and 209 d after Si incorporation) and the Mullica-Berryland soils (80 and 129 d after Si incorporation) compared with the unamended control; this treatment did not increase soil WEP concentrations when applied to the Ingleside-Hammonton soils (Table 2).
Application of CaSiO3 to Ft. Mott-Henlopen and Ingleside-Hammonton soils resulted in significantly higher soil WEP concentrations compared with the unamended controls only at 4 d after Si incorporation, which was 4 d before winter wheat was planted (24 Nov. 2015). In contrast, CaSiO3 application to the Mullica-Berryland soils increased soil WEP compared with the control through the first three sampling dates (until 80 d after Si incorporation; Table 2). It is possible that the Si amount provided by the CaSiO3 application at the liming rate was not enough to sustain the P solubilization for a long period for Ft. Mott-Henlopen and Ingleside-Hammonton soils especially with the active nutrient uptake by growing wheat (approximate total Si rate is 0.41 Mg ha-1 for Ft. Mott-Henlopen and Ingleside-Hammonton soils compared with 0.68 Mg ha-1 for Mullica-Berryland soils).
There was little to no Si treatment effect on soil M3P concentrations or DPSM3 (Table 3). However, we did find that Si fertilization tended to increase the WEP to M3P ratio (i.e., increased oil P solubility) in all three evaluated soils. Specifically, application of silicic acid to Ft. Mott-Henlopen soils at a total Si rate of 2 Mg ha-1 resulted in significantly higher ratios of WEP to M3P than the unamended control throughout the study; this treatment effect was also noted for Mullica-Berryland and Ingleside-Hammonton soils at 40 and 209 d after Si application, respectively (Table 3). Application of silica gel at the 2 Mg ha-1 Si rate and/or silicic acid at lower rates to the Ft. Mott-Henlopen soils also resulted in significantly higher ratios of WEP to M3P when compared with the unamended control throughout the study. Silicic acid applied to the Mullica-Berryland soils at two times the CaSiO3 rate also resulted in significantly higher WEP to M3P ratios than unamended controls at 40 d after Si incorporation. Application of CaSiO3 only significantly increased the ratio of WEP to M3P in Mullica-Berryland soils when soils were sampled on 40 d after Si incorporation (Table 3). Previous investigations also resulted in increased soil P availability following Si application (Koski-Vahala et al., 2001; Lee et al., 2004; Owino-Gerroh and Gascho, 2005). The prevailing thought is that P desorption is enhanced due to competition between silicate and phosphate anions for sorption sites (Koski-Vahala et al., 2001; Lee et al., 2004).
Analysis on the maximum soil P sorption capacity (Smax) at the end of the study indicated that there was no Si treatment effect on Smax for the Mullica-Berryland soils, while significant treatment effect was noted in Ft. Mott-Henlopen and Ingleside-Hammonton soils (Table 4). For Ft. Mott-Henlopen soils, silicic acid applied at 2 Mg Si ha-1 significantly reduced Smax value compared with the no P control; but silicic acid applied at CaSiO3 Si rate significantly increased soil Smax compared with the control. For Ingleside-Hammonton soils, Si amendments significantly reduced Smax when compared with the control, except that soils receiving silicic acid at 2 Mg Si ha-1 was not significantly different with the control (Table 4).
We proposed to conduct sequential fractionation analysis on soils collected from each pot before Si treatment, at 30 days (early growth of winter wheat), and after harvest to evaluate the operationally-defined soil Si and P pools and estimate the interaction of Si and P in soils. We tried several batches of samples and always found very high Si concentration in the blank sample after NaHCO3 extraction; the Si concentration in the blank sample was at the same magnitude as the Si concentration in the extracted solution. We were unable to resolve this analytical issue and thus are not confident enough in the results of the sequential fractionation analysis; therefore, sequential fractionation data is not reported here.
Effect of Si Treatments on the Yield and P and Si Uptake of Winter Wheat
While Si treatments tended to improve soil P availability, Si addition did not significant increase winter wheat grain or straw yield relative to the unamended control when treatments were applied to the Ft. Mott-Henlopen or Ingleside-Hammonton soils (Table 5). There was also no significant Si treatment effect on the grain yield of winter wheat grown in Mullica-Berryland soil; but Mullica-Berryland soils receiving Si gel at 2 Mg ha-1 total Si had significantly higher straw yield than wheat grown in the unamended soil (Table 5). Other researchers also reported no significant difference in winter wheat yield (grain and/or straw) between Si-amended plots and no Si control (CaCO3 was used as the liming agent instead) in the first two years of a three-year (2006–2008) field trial (Quakertown silt loam) where CaSiO3 was added annually as a liming agent to winter wheat in New Jersey (Provance-Bowley et al., 2010). However, Si amendment significantly increased the winter wheat grain yield by 12% in the third year of the study when AA-Si concentrations in amended soils increased from 40.2 to 83.2 mg kg-1 (Provance-Bowley et al., 2010). In comparison, our soil AA-Si concentrations were typically lower than 83.2 mg kg-1 (Figure 1). Thus, it is possible that a higher Si application rate and/or longer Si application history may be needed to significantly impact on the yield of winter wheat (especially grain yield) when grown on high P Delmarva soils.
In terms of plant nutrition, we found increased Si concentrations in plant tissues (especially in the straw) for Si amended soils when compared with plants grown in the unamended soils (Table 5). However, there was no significant Si treatment effect on straw or grain tissue P concentration for any of the soils when compared with wheat grown in the unamended soil. Cumulatively, there was also no significant Si treatment effect on total crop P removal for any of the soils (Table 5), suggesting that Si amendment did not help to accelerate the drawdown of soil P stored in evaluated legacy soils through crop removal. However, we only evaluated P concentrations in aboveground plant tissues. It is possible that enhanced P uptake is reflected in the root biomass, which was not analyzed as part of this project. Root samples were collected and dried and are currently being evaluated to determine the P and Si concentrations.
On-farm Field Trial
Effect of Si fertilization on soil P dynamics
The Pepperbox loamy sand evaluated in the field study had a Mehlich-3 P concentration of approximate two times the agronomic critical level (50 mg kg-1; Shober et al., 2013), which is relatively lower than the P concentrations of soils evaluated in the pot study (three to ten times the agronomic critical level; Table 1). The pepperbox loamy sand also appeared to be less saturated with P compared with the soils evaluated in the pot study (Table 1).
Although the total Si rate (0.5 Mg ha-1) in the on-farm field trial is similar to the Si rate in the pot study (0.41–0.68 Mg ha-1) when CaSiO3 lime alternative (AgrowSil) was applied as the Si source, there was no significantly change in soil WEP concentrations in the on-farm field trial throughout one winter wheat growing season compared with the unamended control (Figure 2). In fact, application of starter P fertilizer also did not significantly increase soil WEP concentrations compared with other treatments (Figure 2). In the pot study, we mixed the fertilizers with the soils and thoroughly wetted the soils and left it fallow for one week in the green house (i.e., relatively high temperature) before the seeding of winter wheat, while we seeded the wheat right after the application of fertilizers in the field study. It is possible that the applied Si dissolved and equilibrated better in soils at our pot study and thus was more available for plant uptake compared with the field trial. As a result, we were able to see a significant increase in soil WEP concentrations early in the season when CaSiO3 was applied in the pot study. It is also possible that the active P uptake by growing winter wheat at field scale (i.e., large variability) masked the treatment effect. Results on soil routine analysis are pending from soil testing, which would be valuable in explaining the lack of treatment effect in the field trial.
Effect of Si Treatments on the Yield and P and Si Uptake of Winter Wheat
Similar to what we have seen with the pot study, there was no significant Si or P treatment effect on the yield of winter wheat after one growing season at the field scale (Table 6). There was also no significant treatment effect on the P concentration of aboveground wheat tissue. However, we did find that when sampled at early growth (6 March 2017), treatment limed with CaSiO3 had higher plant Si concentration compared with treatment limed with calcite; this effect disappeared when samples were collected at harvest (19 June 2017) due to the large variability of nutrient concentrations in plant samples (Table 6). Overall, plant sampled at early growth had much higher P concentrations compared with the plant sampled at harvest (Table 6), which suggests that P uptake is very important at the early growth of winter wheat.
Table 1. Selected initial soil properties for agricultural legacy P impacted soils that were used for a pot study and an on-farm field trial to evaluate Si application effects on P solubility.
|
Soil Series |
Texture |
pH |
Buffer pH |
Organic Matter |
Water extractable P |
Mehlich-3 P |
Mehlich-3 K |
Mehlich-3 Al |
Mehlich-3 Fe |
Mehlich -3 Mn |
Mehlich -3 Ca |
Acetic acid extractable Si |
DPSM3 |
|
|
|
|
|
g kg-1 |
———————————————— mg kg-1——————————————— |
% |
|||||||
|
|
Pot Study |
||||||||||||
|
Ft. Mott-Henlopen |
Loamy sand |
5.0 |
7.7 |
20 |
6.01 |
171 |
67.0 |
508 |
82.1 |
8.54 |
520 |
7.96 |
27 |
|
Ingleside- Hammonton |
Loamy sand |
5.0 |
7.7 |
21 |
14.1 |
349 |
94.0 |
580 |
104 |
13.1 |
540 |
4.17 |
48 |
|
Mullica-Berryland |
Loamy sand |
5.1 |
7.4 |
42 |
17.8 |
492 |
135 |
1037 |
115 |
3.84 |
751 |
6.18 |
39 |
|
|
On-farm Field Trial |
||||||||||||
|
Pepperbox |
Loamy sand* |
4.8 |
7.6 |
19 |
5.30 |
111 |
218 |
772 |
91.0 |
9.92 |
447 |
RP** |
12 |
*Described from USDA official soil series
**Results pending from soil testing
Table 2. Effect of Si treatments with time on water extractable P (WEP) in three legacy P impacted agricultural soils sampled at multiple days after Si incorporation during one growing season of winter wheat.
Treatment |
Total Si rate |
4 d |
40 d |
80 d |
98 d |
129 d |
161 d |
189 d |
209 d |
|
Mg ha-1 |
—————————————— mg kg-1——————————————— |
||||||||
|
|
Ft. Mott-Henlopen |
||||||||
|
CaSiO3 |
0.41 |
7.90 a* |
8.11 b |
8.21 c |
7.74 bc |
6.59 b |
5.76 b |
5.67 c |
5.28 c |
|
Silicic acid |
0.41 |
7.00 ab |
10.0 a |
9.53 bc |
8.29 bc |
8.37 ab |
6.17 b |
6.56 abc |
5.79 bc |
|
|
0.82 |
7.57 a |
10.2 a |
10.3 ab |
8.92 ab |
8.12 ab |
6.57 ab |
6.86 ab |
6.21 ab |
|
|
2 |
8.28 a |
11.0 a |
11.0 a |
10.2 a |
9.02 a |
7.59 a |
7.42 a |
6.96 a |
|
Silica gel |
2 |
7.76 a |
10.0 a |
9.55bc |
9.03 ab |
7.94 ab |
6.35 b |
7.35 a |
6.65 ab |
|
Control |
0 |
6.07 b |
7.55 b |
8.48 c |
7.20 c |
6.68 b |
5.83 b |
5.85 bc |
5.19 c |
|
|
Ingleside-Hammonton |
||||||||
|
CaSiO3 |
0.41 |
13.2 a |
12.0 ab |
13.7 a |
11.8 ab |
9.13 b |
8.71 a |
8.72 b |
8.27 c |
|
Silicic acid |
0.41 |
11.1 b |
11.7 ab |
12.2 a |
11.6 ab |
10.7 ab |
9.72 a |
10.1 ab |
9.51 bc |
|
|
0.82 |
11.8 ab |
11.9 ab |
13.8 a |
11.5 ab |
11.5 ab |
10.0 a |
11.0 ab |
9.76 b |
|
|
2 |
13.4 a |
13.5 a |
13.7 a |
14.2 a |
15.3 a |
17.3 a |
10.6 ab |
11.3 a |
|
Silica gel |
2 |
12.8 ab |
11.8 ab |
13.3 a |
13.0 ab |
11.7 ab |
11.3 a |
9.90 ab |
9.85 b |
|
Control |
0 |
11.1 b |
11.4 b |
12.7 a |
10.5 b |
11.1 ab |
10.2 a |
12.8 a |
8.91 bc |
|
|
Mullica-Berryland |
||||||||
|
CaSiO3 |
0.68 |
15.7 a |
16.0 a |
17.4 a |
15.1 ab |
14.4 a |
10.9 b |
11.7 c |
9.69 b |
|
Silicic acid |
0.68 |
13.5 bc |
14.9 ab |
16.8 a |
14.4 b |
13.9 ab |
11.2 b |
12.3 bc |
10.4 b |
|
|
1.36 |
14.4 ab |
15.6 a |
18.1 a |
14.8 b |
14.7 a |
11.7 b |
12.8 abc |
10.8 ab |
|
|
2 |
14.1 b |
16.0 a |
17.4 a |
17.1 a |
15.4 a |
13.6 a |
13.5 a |
11.7 a |
|
Silica gel |
2 |
13.6 bc |
14.7 ab |
17.4 a |
15.1 ab |
14.9 a |
11.7 b |
12.9 ab |
10.5 ab |
|
Control |
0 |
12.2 c |
13.1 b |
14.1 b |
13.6 b |
12.3 b |
10.5 b |
11.9 bc |
9.96 b |
*Values within each soil with different letters were statistically different using Tukey’s honestly significant difference test at P<0.05.
Table 3. Summary of pH, concentrations of Mehlich-3 extractable P (M3P), degree of P saturation (DPSM3), and the ratio of water extractable P (WEP) to Mehlich-3 extractable P (M3P) of soil samples collected on 40 and 209 d after Si incorporation from evaluated three legacy P impacted agricultural soils.
Treatment |
Total Si rate |
pH |
M3P |
DPSM3 |
WEP/M3P |
||||
|
|
|
40 d |
209 d |
40 d |
209 d |
40 d |
209 d |
40 d |
209 d |
|
|
Mg ha-1 |
|
|
—mg kg-1— |
———————%——————— |
||||
|
|
|
Ft. Mott-Henlopen |
|||||||
|
CaSiO3 |
0.41 |
6.23 b* |
7.17 a |
220 a |
194 ab |
27.0 b |
27.5 a |
3.69 cd |
2.72 cd |
|
Silicic acid |
0.41 |
6.30 ab |
7.00 a |
207 a |
186 ab |
28.3 ab |
27.9 a |
4.85 ab |
3.11 bcd |
|
|
0.82 |
6.23 b |
6.90 a |
212 a |
188 ab |
28.5 ab |
28.3 a |
4.81 ab |
3.31 bc |
|
|
2 |
6.27 ab |
6.90 a |
194 a |
170 b |
28.1 ab |
30.0 a |
5.67 a |
4.10 a |
|
Silica gel |
2 |
6.30 ab |
6.93 a |
220 a |
188 ab |
29.1 a |
30.4 a |
4.52 bc |
3.55 ab |
|
Control |
0 |
6.37 a |
6.50 b |
209 a |
203 a |
27.3 b |
27.9 a |
3.63 d |
2.57 d |
|
|
|
Ingleside- Hammonton |
|||||||
|
CaSiO3 |
0.41 |
6.00 c |
6.30 a |
415 a |
361 a |
47.2 a |
48.1 a |
2.89 a |
2.32 b |
|
Silicic acid |
0.41 |
6.23 b |
6.27 a |
419 a |
386 a |
48.5 a |
51.9 a |
2.80 a |
2.48 ab |
|
|
0.82 |
6.33 ab |
6.20 a |
405 a |
372 a |
44.3 a |
51.0 a |
2.95 a |
2.62 ab |
|
|
2 |
6.33 ab |
6.33 a |
388 a |
376 a |
42.6 a |
49.8 a |
3.55 a |
3.00 a |
|
Silica gel |
2 |
6.33 ab |
6.17 a |
396 a |
348 a |
48.9 a |
48.5 a |
2.98 a |
2.83 ab |
|
Control |
0 |
6.47 a |
6.37 a |
352 a |
397 a |
42.2 a |
48.9 a |
3.24 a |
2.26 b |
|
|
|
Mullica-Berryland |
|||||||
|
CaSiO3 |
0.68 |
5.53 c |
6.47 a |
646 a |
577 a |
39.2 a |
33.0 a |
2.47 a |
1.68 a |
|
Silicic acid |
0.68 |
5.67 bc |
6.40 a |
632 a |
573 a |
40.1 a |
35.1 a |
2.36 ab |
1.81 a |
|
|
1.36 |
5.73 abc |
6.27 abc |
621 a |
633 a |
38.3 a |
37.6 a |
2.52 a |
1.70 a |
|
|
2 |
5.80 ab |
6.13 bc |
634 a |
602 a |
38.6 a |
37.2 a |
2.53 a |
1.95 a |
|
Silica gel |
2 |
5.87 ab |
6.33 ab |
639 a |
588 a |
39.3 a |
38.0 a |
2.30 ab |
1.79 a |
|
Control |
0 |
5.93 a |
6.10 c |
623 a |
610 a |
37.6 a |
38.0 a |
2.1 b |
1.64 a |
*Values within each soil with different letters were statistically different using Tukey’s honestly significant difference test at P<0.05.
Table 4. Effect of Si treatments on the maximum soil sorption capacity (Smax) in three legacy P impacted agricultural soils after one winter wheat growing season as determined by Langmuir isotherms.
|
Treatment |
Ft. Mott-Henlopen |
Ingleside- Hammonton |
Mullica-Berryland |
|
——————————mg kg-1—————————— |
|||
|
CaSiO3 |
84 ab* |
43 b |
272 a |
|
Silicic acid at CaSiO3 Si rate |
87 a |
31 b |
290 a |
|
Silicic acid at two times CaSiO3 Si rate |
63 cd |
40 b |
283 a |
|
Silica gel at Si rate of 2 Mg ha-1 |
68 c |
33 b |
332 a |
|
Silicic acid at Si rate of 2 Mg ha-1 |
51 d |
61 ab |
280 a |
|
No Si control |
72 bc |
87 a |
284 a |
*Values within each soil with different letters were statistically different using Tukey’s honestly significant difference test at P<0.05.
Table 5. Effect of Si treatments on the yield of winter wheat and P and Si concentration of straw and grain in three legacy P impacted agricultural soils after one winter wheat growing season.
|
Treatment |
Total Si rate |
Yield |
P concentration |
Si concentration |
Total crop P removal |
|||
|
Straw |
Grain |
Straw |
Grain |
Straw |
Grain |
|||
|
|
—————Mg ha-1————— |
—————g kg-1——————— |
kg ha-1 |
|||||
|
|
|
|
Ft. Mott-Henlopen |
|||||
|
CaSiO3 |
0.41 |
7.68 a† |
3.78 a |
0.66 b |
2.21 a |
8.38 b |
0.10 a |
13.4 a |
|
Silicic acid |
0.41 |
5.82 b |
3.50 a |
0.79 ab |
2.27 a |
8.34 b |
0.07 ab |
12.6 a |
|
|
0.82 |
6.83 ab |
3.18 a |
0.89 ab |
2.40 a |
11.2 b |
0.04 ab |
13.7 a |
|
|
2 |
6.93 ab |
3.69 a |
0.99 a |
1.57 a |
18.3 a |
0.03 b |
12.8 a |
|
Silica gel |
2 |
7.07 ab |
3.53 a |
0.85 ab |
2.25 a |
15.2 a |
0.05 ab |
13.9 a |
|
Control |
0 |
7.25 ab |
4.32 a |
0.68 ab |
1.48 a |
2.74 c |
0.02 b |
11.2 a |
|
|
|
|
Ingleside- Hammonton |
|||||
|
CaSiO3 |
0.41 |
7.23 a |
3.28 a |
1.25 a |
2.48 ab |
7.14 cd |
0.03 a |
17.2 a |
|
Silicic acid |
0.41 |
6.71 a |
3.28 a |
1.37 a |
2.74 a |
6.50 cd |
0.03 a |
18.2 a |
|
|
0.82 |
7.70 a |
4.21 a |
1.21 a |
2.29 b |
9.56 bc |
0.04 a |
19.0 a |
|
|
2 |
8.05 a |
3.84 a |
1.62 a |
2.52 ab |
16.6 a |
0.04 a |
22.9 a |
|
Silica gel |
2 |
8.02 a |
3.71 a |
1.17 a |
2.39 ab |
15.4 ab |
0.04 a |
18.4 a |
|
Control |
0 |
6.67 a |
3.60 a |
1.19 a |
2.47 ab |
1.47 d |
0.01 b |
16.8 a |
|
|
|
|
Mullica-Berryland |
|||||
|
CaSiO3 |
0.68 |
8.04 ab |
3.99 a |
1.05 a |
3.24 a |
11.0 a |
0.05 a |
21.7 a |
|
Silicic acid |
0.68 |
8.58 ab |
4.43 a |
1.01 a |
2.65 a |
5.89 bc |
0.03 b |
20.3 a |
|
|
1.36 |
7.80 ab |
3.70 a |
1.06 a |
2.36 a |
9.30 ab |
0.03 ab |
17.1 a |
|
|
2 |
8.82 ab |
3.89 a |
1.00 a |
2.16 a |
11.0 a |
0.03 b |
17.2 a |
|
Silica gel |
2 |
9.43 a |
4.72 a |
1.04 a |
2.30 a |
11.2 a |
0.03 ab |
20.4 a |
|
Control |
0 |
7.11 b |
4.04 a |
1.15 a |
2.47 a |
1.95 c |
0.02 b |
18.1 a |
*Values within each soil with different letters were statistically different using Tukey’s honestly significant difference test at P<0.05.
Table 6. The final yield of winter wheat, and P and Si concentration of aboveground tissues sampled at early growth (6 March 2017) and harvest (19 June 2017) in a legacy P impacted agricultural soil receiving different fertilization treatments during one growing season in an on-farm field trial.
|
Treatment |
Final yield |
P concentration |
Si concentration |
||
|
|
|
6 March 2017 |
19 June 2017 |
6 March 2017 |
19 June 2017 |
|
|
Mg ha-1 |
——————————g kg-1———————————— |
|||
|
Standard fertility (no P) without calcitic |
7.25 a* |
5.95 a |
1.83 a |
1.24 ab |
1.95 a |
|
Standard fertility (no P) with calcitic lime |
7.28 a |
5.43 a |
1.72 a |
0.93 b |
2.66 a |
|
Standard fertility with starter P and calcitic lime |
7.09 a |
5.54 a |
2.84 a |
1.04 b |
1.93 a |
|
Standard fertility (no P) with AgrowSil lime |
7.57 a |
5.67 a |
1.85 a |
1.90 a |
3.34 a |
*Values within each soil with different letters were statistically different using Tukey’s honestly significant difference test at P<0.05.
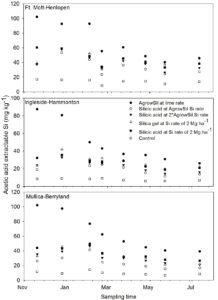
Figure 1. Temporal trends in acetic acid extractable Si concentrations in three legacy P impacted agricultural soils receiving Si fertilization during one winter wheat growing season in a pot study.
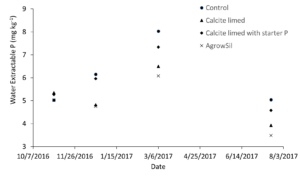
Figure 2. Temporal trends in water extractable P concentrations in a legacy P impacted agricultural soil receiving Si fertilization during one winter wheat growing season in an on-farm field trial. No significant treatment effect was noted at any of the sampling date.
REFERENCE
Alley, M.M. 2009. Nitrogen management for winter wheat: principles and recommendations. Available at: http://pubs.ext.vt.edu/424/424-026/424-026.html.
Bolster, C.H., and G.M. Hornberger. 2007. On the use of linearized Langmuir equations. Soil Sci. Soc. Am. J. 71: 1796–1806.
Bouyoucos, G.J. 1962. Hydrometer method improved for making particle size analysis of soils. Agron. J. 54: 464–465.
Heckman, J., and A. Wolf. 2011. Recommended soil test for silicon. Recommended Soil Testing Procedures for the Northeastern United States, 3rd ed.; Northeast Coordinating Committee for Soil Testing (NEC-1012); p99–102.
Koski-Vahala, J., H. Hartikainen, and P. Tallberg. 2001. Phosphorus mobilization from various sediment pool in response to increase pH and silicate concentration. J. Environ. Qual. 30: 546–552.
Lee, Y.B., C. Hoon, J.Y. Hwang, I.B. Lee, and P.J. Kim. 2004. Enhancement of phosphate desorption by silicate in soils with salt accumulation. Soil Sci. Plant Nutr. 50(4): 493–499.
Murphy, L.J., and J.R. Riley. 1962. A modified single solution method for determination of phosphate in natural water. Anal. Chim. Acta. 27: 31–33.
NECC-1312. 2011. Recommended soil testing procedures for the Northeastern United States. Northeastern Regional Publication No. 493. 3rd Edition.
Owino-Gerroh, C., and G.J. Gascho. 2005. Effect of silicon on low pH soil phosphorus sorption and on uptake and growth of maize. Commun. in Soil Sci. Plant Anal. 35(15-16): 2369–2378.
Provance-Bowley, M., J.R. Heckman, and E.F. Durner. 2010. Calcium Silicate Suppresses Powdery Mildew and Increases Yield of Field Grown Wheat. Soil Sci. Soc. Am. J. 74:1652-–1661.
SAS Institute. 2008. SAS/STAT 9.2 user’s guide. SAS Inst., Cary, NC.
Self-Davis, M.L., P.A. Moore, Jr., and B.C. Joern. 2009. Determination of water- and/or dilute salt-extractable phosphorus. In Methods of Phosphorous Analysis for Soils, Sediments, Residuals, and Waters (G.M. Pierzynski, Ed.), pp. 24–26. Southern Cooperative Series Bulletin no. 396. Southern Extension/Research Activity-Information Exchange Group 17, U.S. Department of Agriculture and North Carolina State University, Raleigh.
Seyfferth, A.L., A. H. Morris, R. Gill, K.A. Kearns, J.N. Mann, M. Paukett, and C. Leskanic. 2016. Soil incorporation of silica-rich rice husk decreases inorganic arsenic in rice grain. J. Agric. Food Chem. 64: 3760–3766.
Sims, J.T. and K.L. Gartley. 1996. Nutrient Management Handbook for Delaware. Cooperative Bulletin #59. University of Delaware, Newark, DE.
Shober, A.L., J.T. Sims, and K.L. Gartley. 2013. Interpreting soil phosphorus and potassium tests. Available at: http://extension.udel.edu/factsheets/interpreting-soil-phosphorus-and-potassium-tests/.
Shober, A.L., R.W. Taylor, K.L. Gartley, and J.T. Sims. 2017. Nutrient management recommendations-agronomic crops. Available at: http://extension.udel.edu/factsheets/agronomic-crops/.
Our results suggested that Si fertilization is a promising BMP that can potentially improve early-season soil P availability and reduce the use of starter fertilizer for the growth of winter wheat on high P legacy soils in Delmarva Peninsula. But a specific Si application rate is needed to trigger the positive effect depending on soil properties; total Si rate of 2 Mg ha-1 seemed efficient for all three evaluated high P soils. Although silicic acid and silica gel were the most effective Si sources in improving P availability in our study, they are not commercially-available and would be cost-prohibitive for farmers to purchase. We suggest that Delmarva grain farmers could choose to apply locally-available CaSiO3 liming alternative to adjust soil pH when needed (provided the material is high quality based on fineness and low trace element concentrations), which will supply Si at the same time and thus will potentially improve soil P availability early in the growing season. Increased soil P availability early in the season (i.e., from planting through the forming of tillers) should help seedlings to access enough P when soil temperatures are cold to produce a vigorous root system and more fertile tillers. However, CaSiO3 may only be a sufficient Si source for low pH soils with relatively high buffering capacity and may not be providing enough Si for other soils due to its liming effect. Future research should evaluate other Si alternatives (e.g., wheat residues) that can be easily used by farmers.
Education & outreach activities and participation summary
Participation summary:
We presented a poster presentation describing the results of the pot trials at the 2017 Maryland Commodity Classic, an annual event targeting regional growers that is hosted by the Maryland Grain Producers Association, Maryland Soybean Board, Maryland Grain Producers Utilization Board, and Mid-Atlantic Soybean Association. Growers and agribusiness professionals can learn about the latest research and industry advances. More than 150 people attended this meeting and were able to view and interact with me to learn about the effects of Si on soil P solubility and small grain yields. In addition, results of the SARE study were shared with the Maryland Grain Producers Utilization Board at their annual funding meetings in 2016 and 2017. Scientific manuscripts and extension/public press publications are currently in preparation.
Project Outcomes
At this time, we suggest that Delmarva grain farmers could choose to apply locally-available CaSiO3 liming alternative to adjust soil pH when needed (provided the material is high quality based on fineness and low trace element concentrations), which will supply Si at the same time and thus will potentially improve soil P availability early in the growing season. However, CaSiO3 may only be a sufficient Si source for low pH soils with relatively high buffering capacity and may not be providing enough Si for other soils due to its liming effect. Future research should evaluate other Si alternatives (e.g., wheat residues) that can be easily used by farmers.
We will be completing additional research to determine if Si amendments affected root Si concentrations. Also, we will be looking for alternative sources of Si that do not affect soil pH and could distributed more widely throughout the agronomic community. If continued research suggests value of Si application, we could potentially reduce starter P applications to small grains. A total of 321,796 acres of wheat and barley were grown on the Delmarva Peninsula base on the 2012 US Census data. If we assume that 28% of these acres test in the "excessive" range for soil test P (based on data presented by the Maryland Department of Agriculture), and that half of those acres would receive 30 lb P2O5 per acre as starter to small grains, we could reduce application of P2O5 to high soil test P soils by up to 901 tons. However, these types of reductions would be dependent on availability of soluble Si sources and research that shows more consistent benefits of application.
Based on this project, we proposed another study that looks at the interaction between Si and P in soils by conducting a soil-only incubation experiment. We evaluated three Si sources (CaSiO3 liming alternative, switchgrass ash, and silicic acid) and four application rates (0, 0.25, 0.5, 1, and 2 Mg Si ha-1) with the same three legacy P impacted agricultural soils as evaluated in this project. The purpose of the incubation study is to evaluate the ability of Si fertilization (different sources and rates) to enhance soil P availability from legacy P soils without the interference of plant growth.