Final report for GNE19-205
Project Information
Tarps, impermeable plastic covers applied over crop beds before planting to suppress weeds, are rising in popularity in the northeastern United States. However, there are many unknown impacts of tarps on the agricultural ecosystem, including on the diversity of soil arthropods. Shedding light on tarps’ impacts is important because negative biophysical effects could affect both ecosystem and farm functioning.
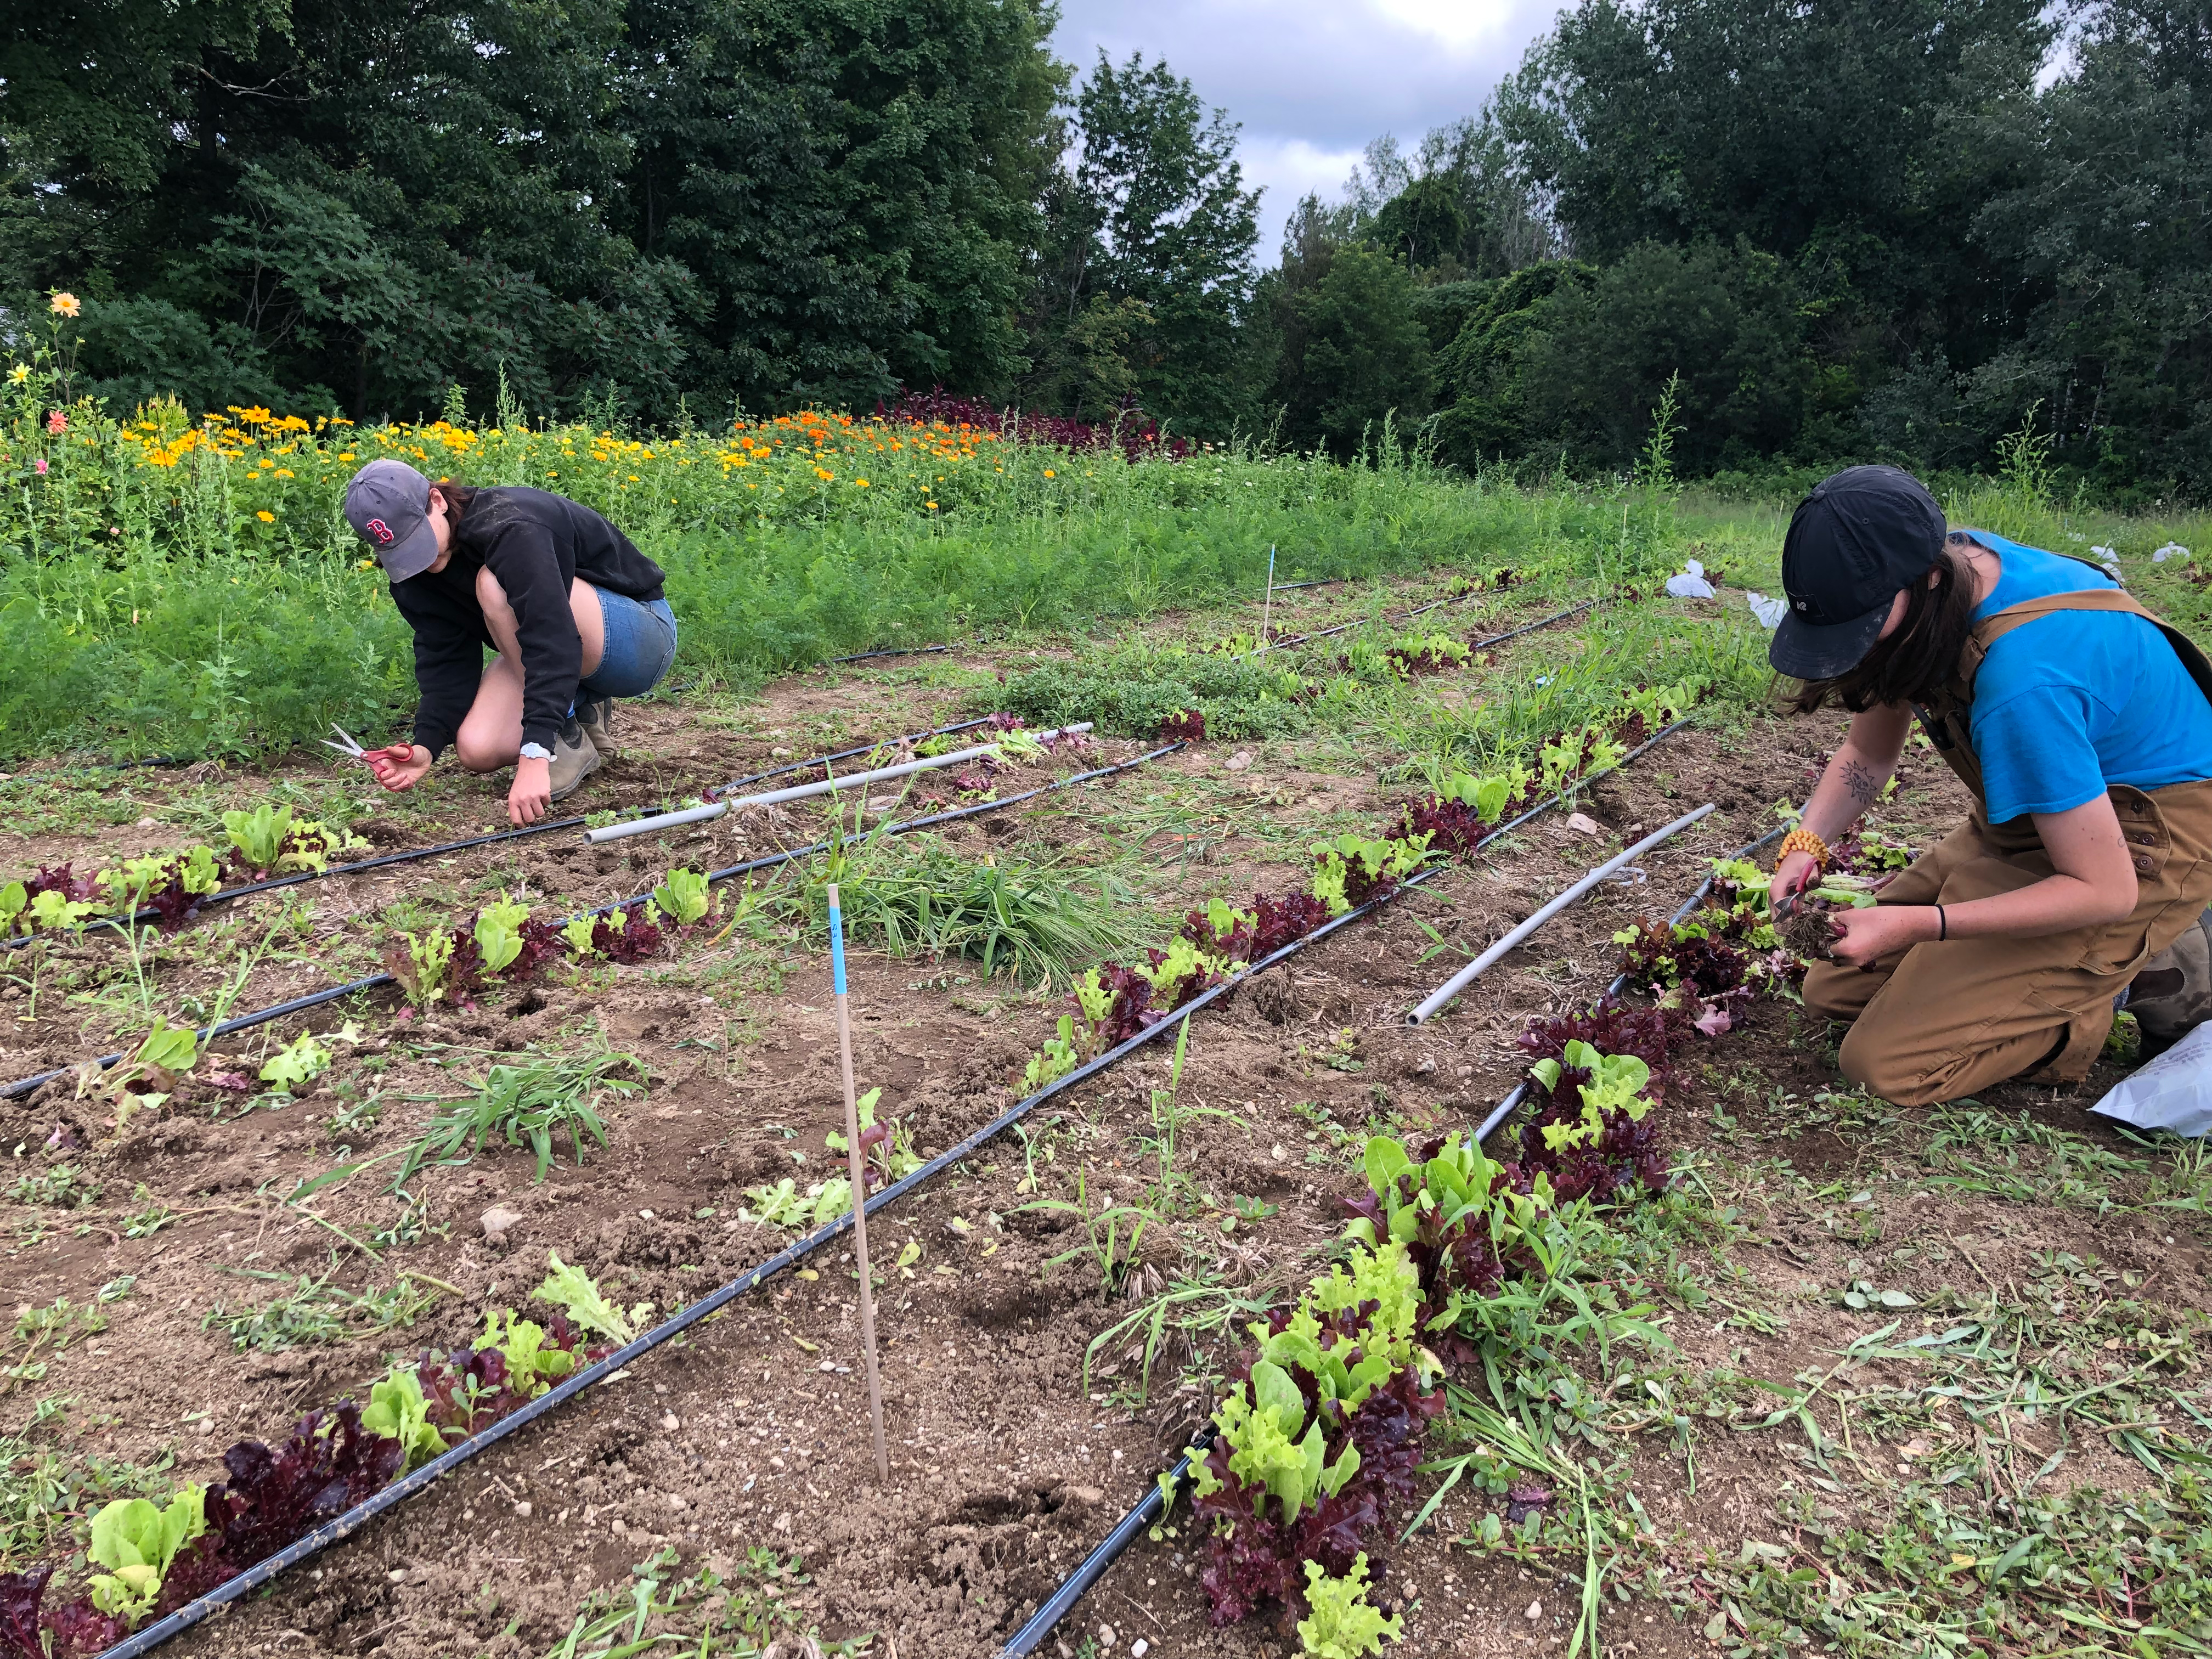
In our study, we first used participatory action research to work with farmers to identify variables of interest and choose a research methodology that would yield relevant and actionable results for the farming community. We then conducted our field experiment in 2021 at three farms in Chittenden County, Vermont. We tested two tarp types, silage tarps (black plastic) and clear plastic tarps, along with an untarped control. We measured the immediate impacts of tarps on soil temperature, soil moisture, available soil nitrate, and surface-active and soil-dwelling arthropod diversity. After tarps were removed, we continued to measure surface-active and soil-dwelling arthropod diversity and additionally measured weed cover and crop (lettuce) growth for five weeks.
We found that tarps heated soils and had inconsistent impacts on soil moisture and available soil nitrate. We found that tarps had immediate negative impacts on surface-active and soil-dwelling arthropod diversity. Surface-active arthropod diversity recovered by 3 weeks after tarping, but at 5 weeks after tarping soil-dwelling arthropod diversity was significantly lower in silage tarp and clear plastic plots than control plots. Tarps also dramatically reduced weed cover (with around 30% weed cover in tarped plots compared to 90% weed cover in control plots) and doubled crop yields.
This study helped unveil the impacts of tarps, which could better inform farmer decision-making around this practice. Our study also increased attention and knowledge around soil arthropods, which are a fairly under-researched and publicly unknown ecological group. To further inform the sustainability of this practice, future research should address how tarping compares to other weed suppression practices and how continuous tarp use may impact the agroecosystem.
The main objective of this project was to enhance sustainable agriculture pursuits in New England by assessing the impacts of tarping on the agroecosystem. The specific research objectives of this project were to 1. Measure the effects of silage tarps on soil arthropod diversity and soil properties; 2. Measure the effects of silage tarps on crop outcomes of relevance and interest to the farmers; and 3. Determine the relationships between soil arthropod diversity, soil properties, and crop properties.
Tarping is an agricultural practice that has grown in popularity in the last decade, especially in the northeastern USA (Birthisel et al., 2019; Lounsbury et al., 2022; Rylander et al., 2020). Tarps have been used globally for decades to kill pathogens and pests (Stapleton and DeVay, 1986) and, more recently, have been implemented on small-scale farms as a low-input method to suppress weeds or terminate cover crops while also reducing tillage needs (Rylander et al., 2020). Growers place tarps, often silage (black plastic) tarps or clear plastic tarps, over the soil for several weeks before planting crops. Silage tarps kill weeds via occultation (shading), whereas clear plastic tarps kill weeds via solarization (extreme heating). While many farmers have adopted or experimented with tarping, uncertainties remain. For instance, while there is strong evidence (both academic and anecdotal) that tarping effectively suppresses weeds (Lounsbury et al., 2022; Rylander et al., 2020), other impacts remain unclear, including impacts on nutrients and soil properties.
One large point of uncertainty around tarps is their impact on soil arthropods, a diverse group in agriculture including spiders, beetles, ants, mites, and collembolans. In general, the use of plastic films in agriculture has been identified as a threat to soil biodiversity because plastic seals the soil surface and can alter physical and chemical soil properties (Birthisel et al., 2019; Tibbett et al., 2020). However, literature on tarps’ effects is limited, with existing studies mostly focusing on the effects of clear tarps (despite heavy use of silage tarps) and analyzing only certain arthropod groups (Seman-Varner, 2005; Gill and McSorley, 2010). Because soil arthropods provide key ecosystem services for agriculture, such as controlling pests (van Lenteren et al., 2018) and improving soil health by contributing to decomposition and soil structure (Lavelle et al., 2006), it is important to understand how tarps impact this community.
To comprehensively understand the impacts of tarping on soil arthropods, it is also important to consider possible indirect effects of tarps. For example, tarps have likely impacts on soil temperature, soil moisture, and weed coverage (Birthisel et al., 2019), which are all variables that are known to change habitat suitability for soil biological communities (Altieri et al., 1985; Schirmel et al., 2018). Identifying predictors of arthropod diversity and composition will help explain tarps’ impacts and uncover sources of complexity within our system.
In this study, we tested the impact of agricultural tarping on soil properties, arthropod communities, weeds and crops. We additionally identified relationships between soil arthropods and the experimental and environmental variables in our system. Monitoring the effects of tarps on the agroecosystem will help inform decision-making and is an important step to assessing the sustainability of this practice.
References
Altieri, M.A., Wilson, R.C., Schmidt, L.L., 1985. The effects of living mulches and weed cover on the dynamics of foliage- and soil-arthropod communities in three crop systems. Crop Protection 4, 201–213. https://doi.org/10.1016/0261-2194(85)90018-3
Birthisel, S.K., Smith, G.A., Mallory, G.M., Hao, J., Gallandt, E.R., 2019. Effects of field and greenhouse solarization on soil microbiota and weed seeds in the Northeast USA. Organic Farming 5, 66–78.
Gill, H.K., McSorley, R., 2010. Effect of integrating soil solarization and organic mulching on the soil surface insect community. Florida Entomologist 93, 308–309. https://doi.org/10.1653/024.093.0224
Lavelle, P., Decaens, T., Aubert, M., Barot, S., Blouin, M., Bureau, F., Margerie, P., Mora, P., Rossi, J.-P., 2006. Soil invertebrates and ecosystem services. European Journal of Soil Biology 42, S3–S15. https://doi.org/10.1016/j.ejsobi.2006.10.002
Lounsbury, N.P., Birthisel, S.K., Lilley, J., Maher, R., 2022. Tarping in the Northeast: A Guide for Small Farms (No. Bulletin #1075). The University of Maine Cooperative Extension.
Rylander, H., Rangarajan, A., Maher, R.M., Hutton, M.G., Rowley, N.W., McGrath, M.T., Sexton, Z.F., 2020. Black Plastic Tarps Advance Organic Reduced Tillage I: Impact on Soils, Weed Seed Survival, and Crop Residue. HortScience 55, 819–825. https://doi.org/10.21273/HORTSCI14792-19
Seman-Varner, R., 2005. Ecological effects of solarization duration on weeds, microarthropods, nematodes, and soil and plant nutrients (PhD Thesis). University of Florida.
Schirmel, J., Albert, J., Kurtz, M.P., Muñoz, K., 2018. Plasticulture changes soil invertebrate assemblages of strawberry fields and decreases diversity and soil microbial activity. Applied Soil Ecology 124, 379–393. https://doi.org/10.1016/j.apsoil.2017.11.025
Stapleton, J.J., DeVay, J.E., 1986. Soil solarization: a non-chemical approach for management of plant pathogens and pests. Crop Protection 5, 190–198. https://doi.org/10.1016/0261-2194(86)90101-8
Tibbett, M., Fraser, T.D., Duddigan, S., 2020. Identifying potential threats to soil biodiversity. PeerJ 8, e9271. https://doi.org/10.7717/peerj.9271
van Lenteren, J.C., Bolckmans, K., Köhl, J., Ravensberg, W.J., Urbaneja, A., 2018. Biological control using invertebrates and microorganisms: plenty of new opportunities. BioControl 63, 39–59. https://doi.org/10.1007/s10526-017-9801-4
Cooperators
- (Researcher)
- (Researcher)
Research
Methodology and Participatory Action Research
This study used Participatory Action Research (PAR) to inform our methodology. PAR seeks for all participants (including researchers, community stakeholders, etc.) to fully engage in all aspects of research, from co-creating research questions to interpreting data. PAR encourages mutual learning, or a reciprocity of knowledge sharing between academics and non-academics, and can benefit local decision-making by making research results more realistic, relevant, and applicable (Méndez et al., 2017, 2013; Utter et al., 2021; Luján Soto et al., 2021).
Following a PAR design, we conducted this research in partnership with three farms. These farms have had ongoing relationships with collaborators in this study for over a decade, mainly through educational programs between the farms and the University of Vermont. We embarked on this research together with these farmer partners due to their initial interest in the effects of tarping, their willingness to participate in the study (including lending a portion of their land for our plots), and the long-term relationships and trust built between them and our study’s collaborators, which facilitated healthy and productive collaboration.
The farmers contributed to our study in several ways. First, the research topic was motivated by informal conversations with the farmer partners. Through additional conversations, the farmer partners revealed a particular interest in the effects of tarping on soil nutrients and biodiversity. We created a research plan that integrated the farmers’ interests with our own and through multiple, iterative conversations the farmers commented on and helped revise the research plan. One major focus of these conversations was choosing and refining our tarping and control treatments and management decisions, with the goal that our methods mimicked realistic farm practices and would yield useful and applicable results.
After completing our project, we also delivered knowledge back to our farmer partners (an important tenet of PAR; Méndez et al., 2017) through one-on-one presentations with each farmer partner. We used the farmers’ feedback from these presentations, which highlighted variables that farmers were particularly interested in or uncertain of, to inform additional variables to include in our final version of the results and to shape discussion points.
Location and design
Field work for this project took place in the summer of 2021 on three farms in Chittenden County, Vermont: Intervale Community Farm (ICF), Diggers’ Mirth Farm (Diggers’), and Catamount Farm (Catamount). Vermont has a temperate climate and at our study sites there was a mean precipitation of 0.2 cm per day and a mean temperature of 22℃ in June (when tarps were on the fields) and a mean precipitation of 0.5 cm per day and a mean temperature of 21℃ in July (when tarps were removed) (NOAA, 2021). All three farms are located adjacent to semi-natural areas: ICF and Diggers’ are situated near a network of recreational forested areas within the Intervale floodplains west of the Winooski River, and Catamount is located within a residential area but is surrounded by large strips of forest and grassland/shrubland.
The three farm sites had key biophysical, ecological, and management differences, which allowed us to understand how tarps function in contrasting environments. For example, Catamount’s soils were classified as sandy, Diggers’ soils were loam, and ICF’s soils were sandy loam. Each farm also had a different composition of major weeds. Catamount was dominated by Portulaca oleracea L. (common purslane) and Digitaria grasses (crabgrass), ICF contained high cover of Chenopodium album L. and Chenopodium glaucum L. (white and oak-leaved goosefoot), and Diggers’ had high abundance of Amaranthus retroflexus L. (redroot pigweed). We also used irrigation and fertilizer schemes typical to each farm. Catamount used drip irrigation due to its sandy, well-drained soil, while ICF and Diggers’ used a combination of sprinklers and hand watering, and each farm received different water amounts depending on the appropriate levels for their soil type. These distinct practices were honed to each farm’s environment, reflected the operational capacities of each farm, and represented realistic scenarios.
Our experiment included two types of plastic tarps, silage tarps and clear plastic tarps, along with a hoed control. Our silage tarps were 0.13 mm polyethylene plastic with a black up-facing side and white down-facing side (Klerks Hyplast Inc., Chester, South Carolina, USA). Our clear plastic tarps were also 0.15 mm polyethylene plastic (Poly-Ag Corp, San Diego, California, USA) and were donated from a local farm where they were used previously on a hoophouse (it is common practice to repurpose hoophouse plastic for ground tarp cover).
We laid out six replicates of these three treatments (silage tarp, clear plastic tarps, and the control) in a randomized complete block design on each farm (18 plots on each farm; 54 plots total across the three farms). Treatment plots were 4.5 m by 1.5 m (1.5 m was the approximate width of our crop beds), with a buffer space of 0.5 m between plots.
Before the tarp treatments were applied, all fields were tilled and prepared with fertilizer. We additionally watered the fields 1-2 days before applying the tarps to stimulate weed germination and increase effectiveness of tarps for killing weeds. We applied the tarps on May 28 and May 29 (2021), and sealed the tarps edges by burying them. The tarps were left on the fields for 25 days (Table 1). During this time, we hoed the control plots weekly to create stale seed beds.
After the tarps were removed in late June, we planted two rows of lettuce seeds (Lactuca sativa; Encore Lettuce Mix, Product ID: 2366G from Johnny’s Selected Seeds; Winslow, ME, USA) in each plot using a Jang seeder (Jang Automation Co., LTD, South Korea). We did not remove weeds in any plots (treatment or control) for the remainder of the experiment. This reflects the reality of many small organic farms that do not have the labor or time for extensive weeding.
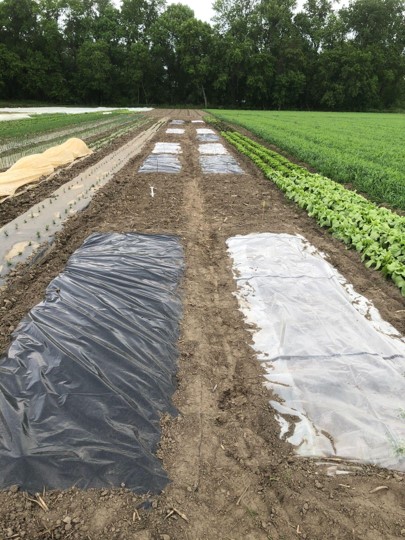
Table 1: Schedule of tarp application and soil, arthropod, weed, and crop data collection (indicating with "x" which variables were sampled in each week). All dates were in the year 2021.
|
|
May 16 |
May 23 |
May 30 |
June 7 |
June 14 |
June 21 |
June 28 |
July 5 |
July 12 |
July 19 |
|
Tarps on |
|
X |
X |
X |
X |
|
|
|
|
|
|
Soil temperature |
|
X |
X |
X |
X |
|
|
|
|
|
|
Soil moisture |
|
|
|
|
X |
X |
|
X |
|
X |
|
Soil available nitrate |
X |
X |
||||||||
|
Soil arthropod |
X |
|
|
|
X |
X |
|
X |
|
X |
|
Weed coverage |
|
|
|
|
|
X |
X |
X |
X |
X |
|
Crop growth |
X |
X |
X |
X |
Soil sampling
At the beginning of the experiment, we collected soil from each farm (using soil augers and composite sampling) to assess baseline soil properties on each farm, including pH, soil organic matter, phosphorus, and soil texture (Table 2). During the tarp treatment, we measured soil temperature using iButtons (Thermochron, Baulkham Hills, NSW, Australia), which log temperature every 30 minutes. In each plot, we buried two iButtons, one at the surface (under 1 cm of soil) and one 10 cm below the surface. We additionally manually measured soil moisture using a TDR-350 soil probe, which we also used every time we collected soil arthropods. Finally, in each plot we measured soil nitrate before and after the tarp treatment to understand how tarps impact soil nutrient levels (soil available nitrate-N was analyzed at the University of Vermont Agricultural and Environmental Testing Lab). These variables (soil temperature, moisture, and nitrate) were chosen because they represent effects of tarps, are of interest to farmers, and potentially correlate to arthropod diversity or crop outcomes.
Table 2: Baseline soil characteristics for the three farm sites. Soil series were determined from the Web Soil Survey (NRCS USDA, 2022).
|
|
Catamount |
Diggers’ |
ICF |
|
Soil texture |
Sand (87% sand, 9% silt, 4% clay) |
Loam (44% sand, 48.5% silt, 7.5% clay) |
Sandy loam (70.5% sand, 27% silt, 2.5% clay) |
|
Soil series (with Great Group) |
Mix of Scarboro (Humaquept), Adams (Haplor-thod), and Windsor (Udipsamments) |
Winooski (Dystrudept) |
Hadley (Udifluvent) |
|
World Reference Base (WRB) soil classification |
Fluvisol |
Cambisol |
Cambisol |
|
pH |
6.8 |
7 |
7 |
|
Available phosphorus (ppm) |
19.4 |
104.9 |
29.5 |
|
Available nitrate (mg N / Kg) |
17.6 |
17.2 |
21.6 |
|
Soil organic carbon (%) |
2.3 |
3.1 |
1.5 |
|
Effective cation exchange capacity (meq/100g) |
6.5 |
12.1 |
7.5 |
Arthropod sampling
We sampled arthropods 5 times throughout the field season: 1 week before tarping (to get a baseline of arthropod diversity), three weeks into the tarp treatment, and then 1, 3, and 5 weeks after tarps were removed (5 sampling periods, 54 treatment plots = 270 samples / method).
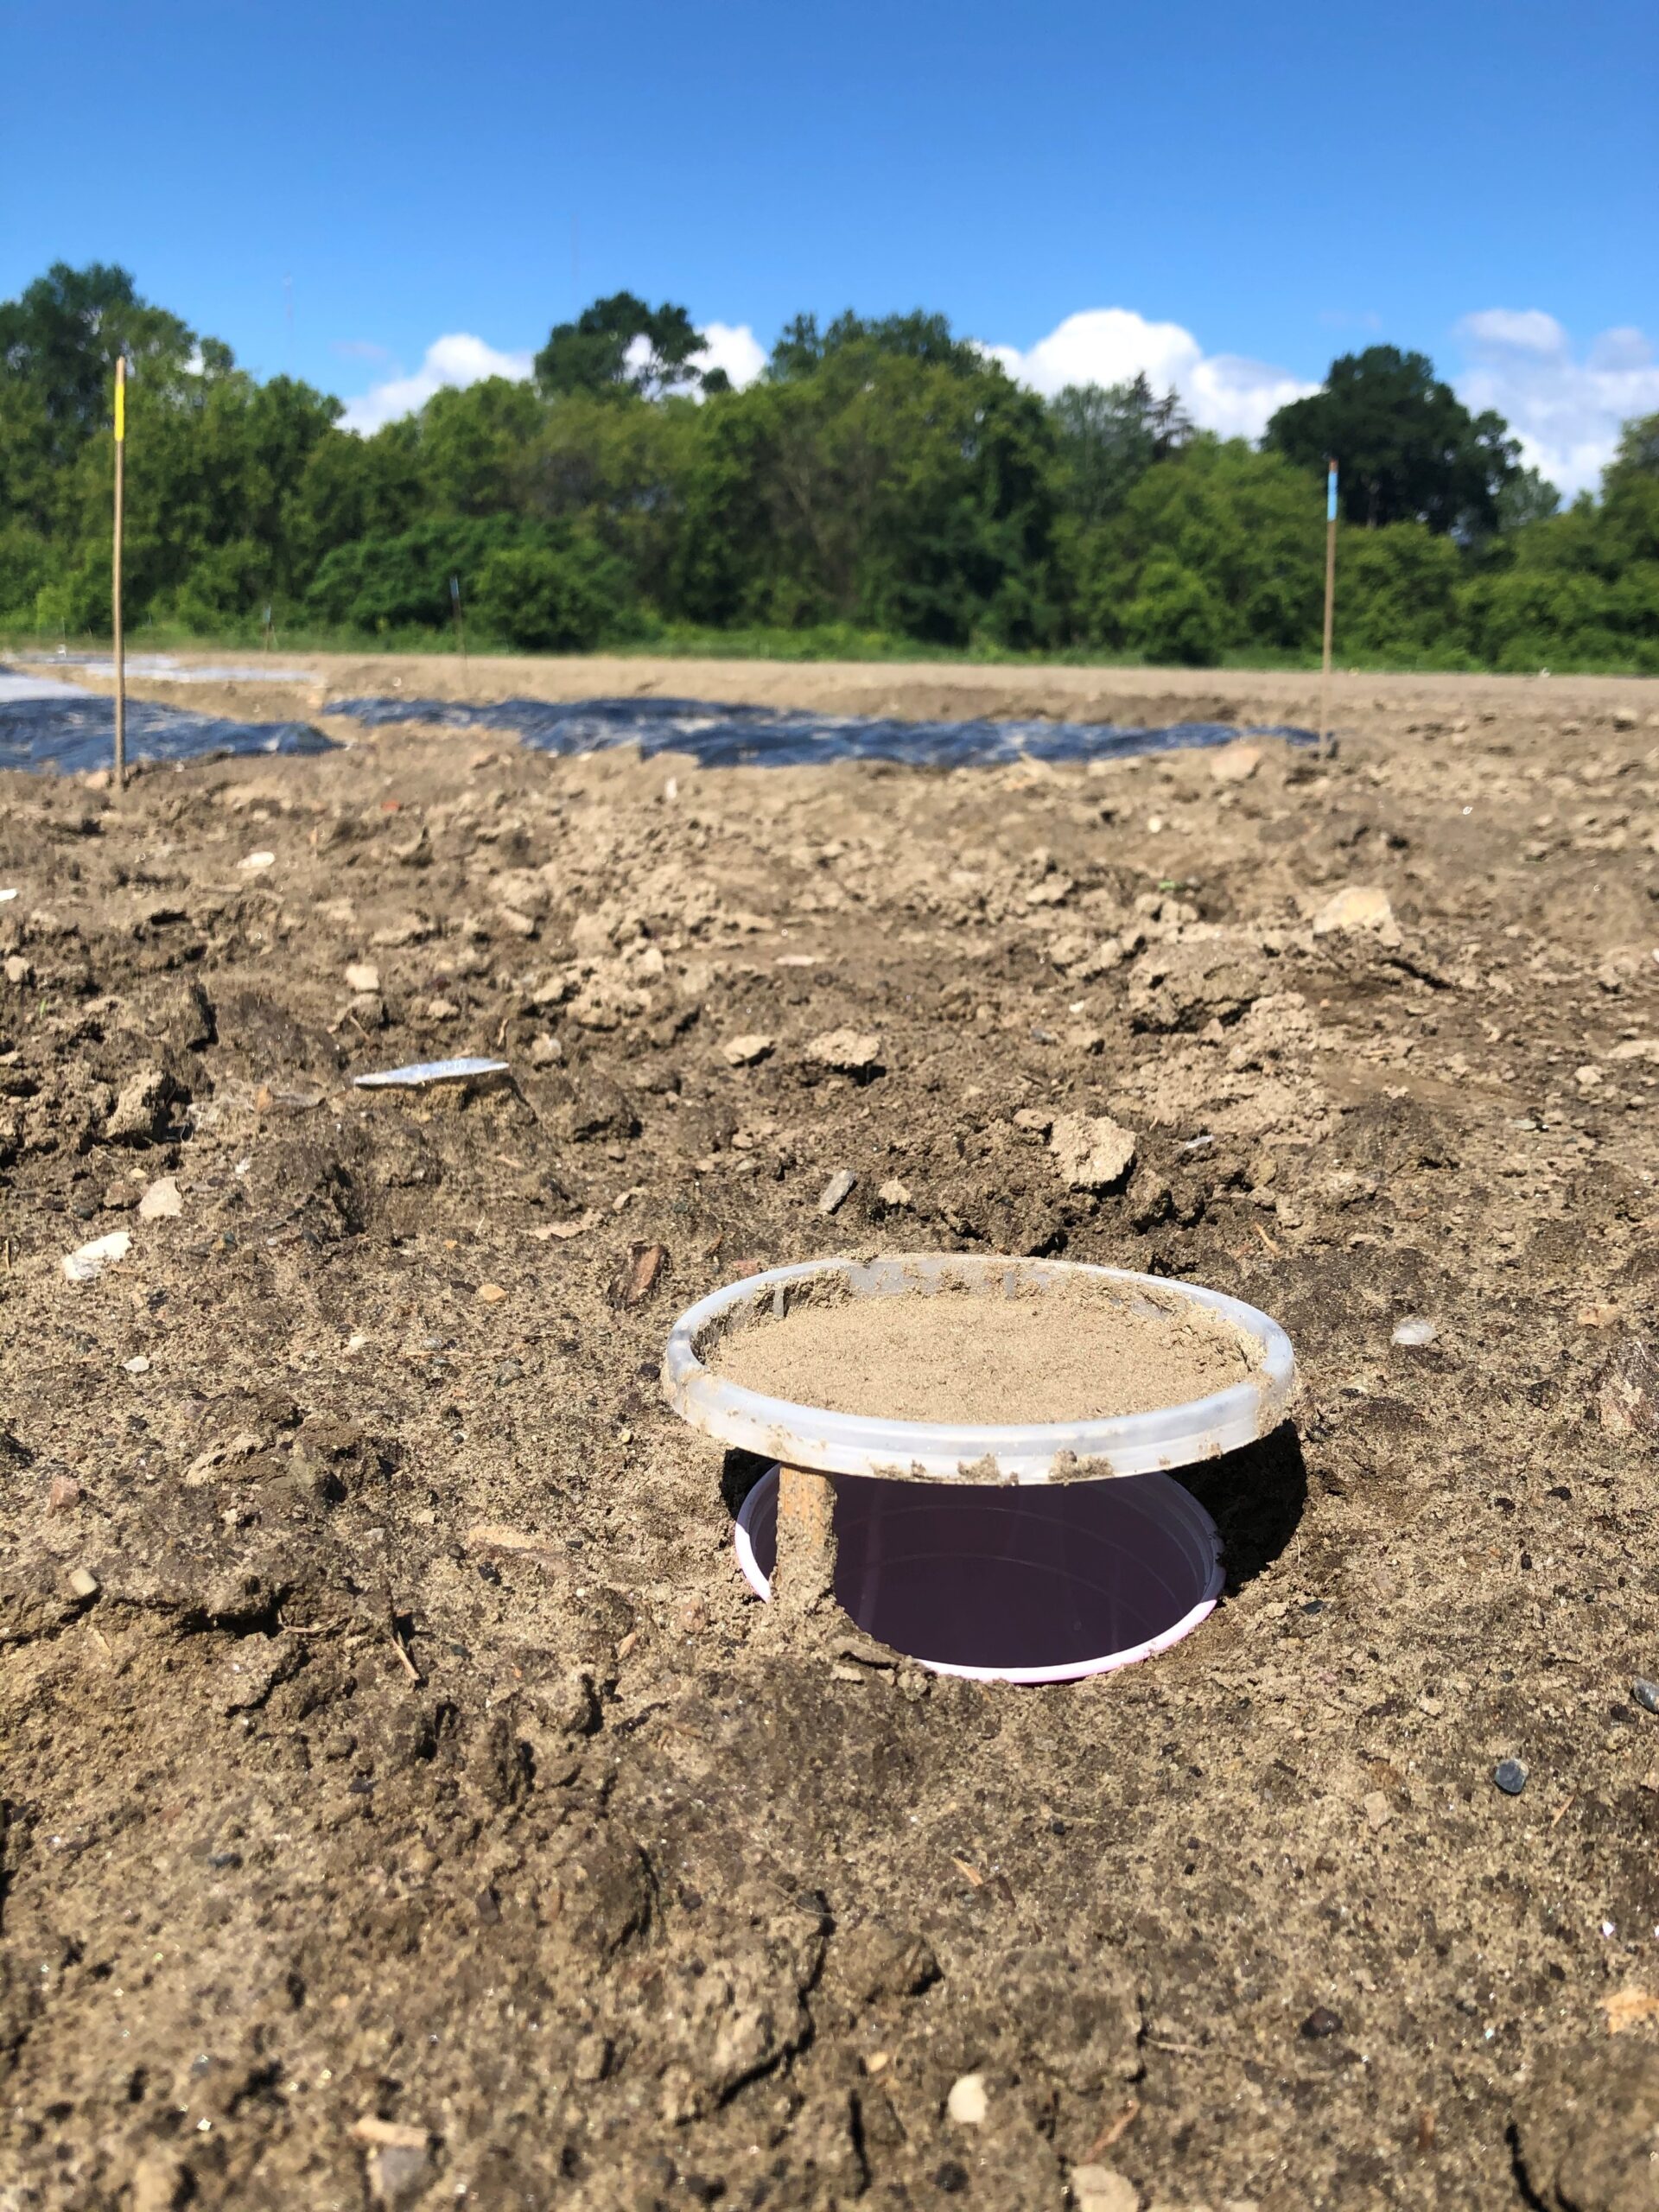
We sampled arthropods using two methods: pitfall traps (for surface-active arthropods) and the Berlese funnel method (for soil-dwelling arthropods). For our pitfall trap method, we buried collection cups (95 mm diameter lid, 120 mm deep) in the center of each plot with their lids level to the surface. We used a killing/preserving agent of 50% propylene glycol (non-toxic anti-freeze) and 50% water, and collected organisms for 3 consecutive days.
For the Berlese funnel extraction method, we took three randomly positioned soil cores (5 cm diameter, 10 cm deep) from each plot and aggregated them. We then extracted arthropods by placing collected soil in a funnel apparatus and exposing it to a 60 Watt light bulb for 72 hours, during which time organisms crawled downward through the funnel and fell into a collection vial with 95% ethanol.
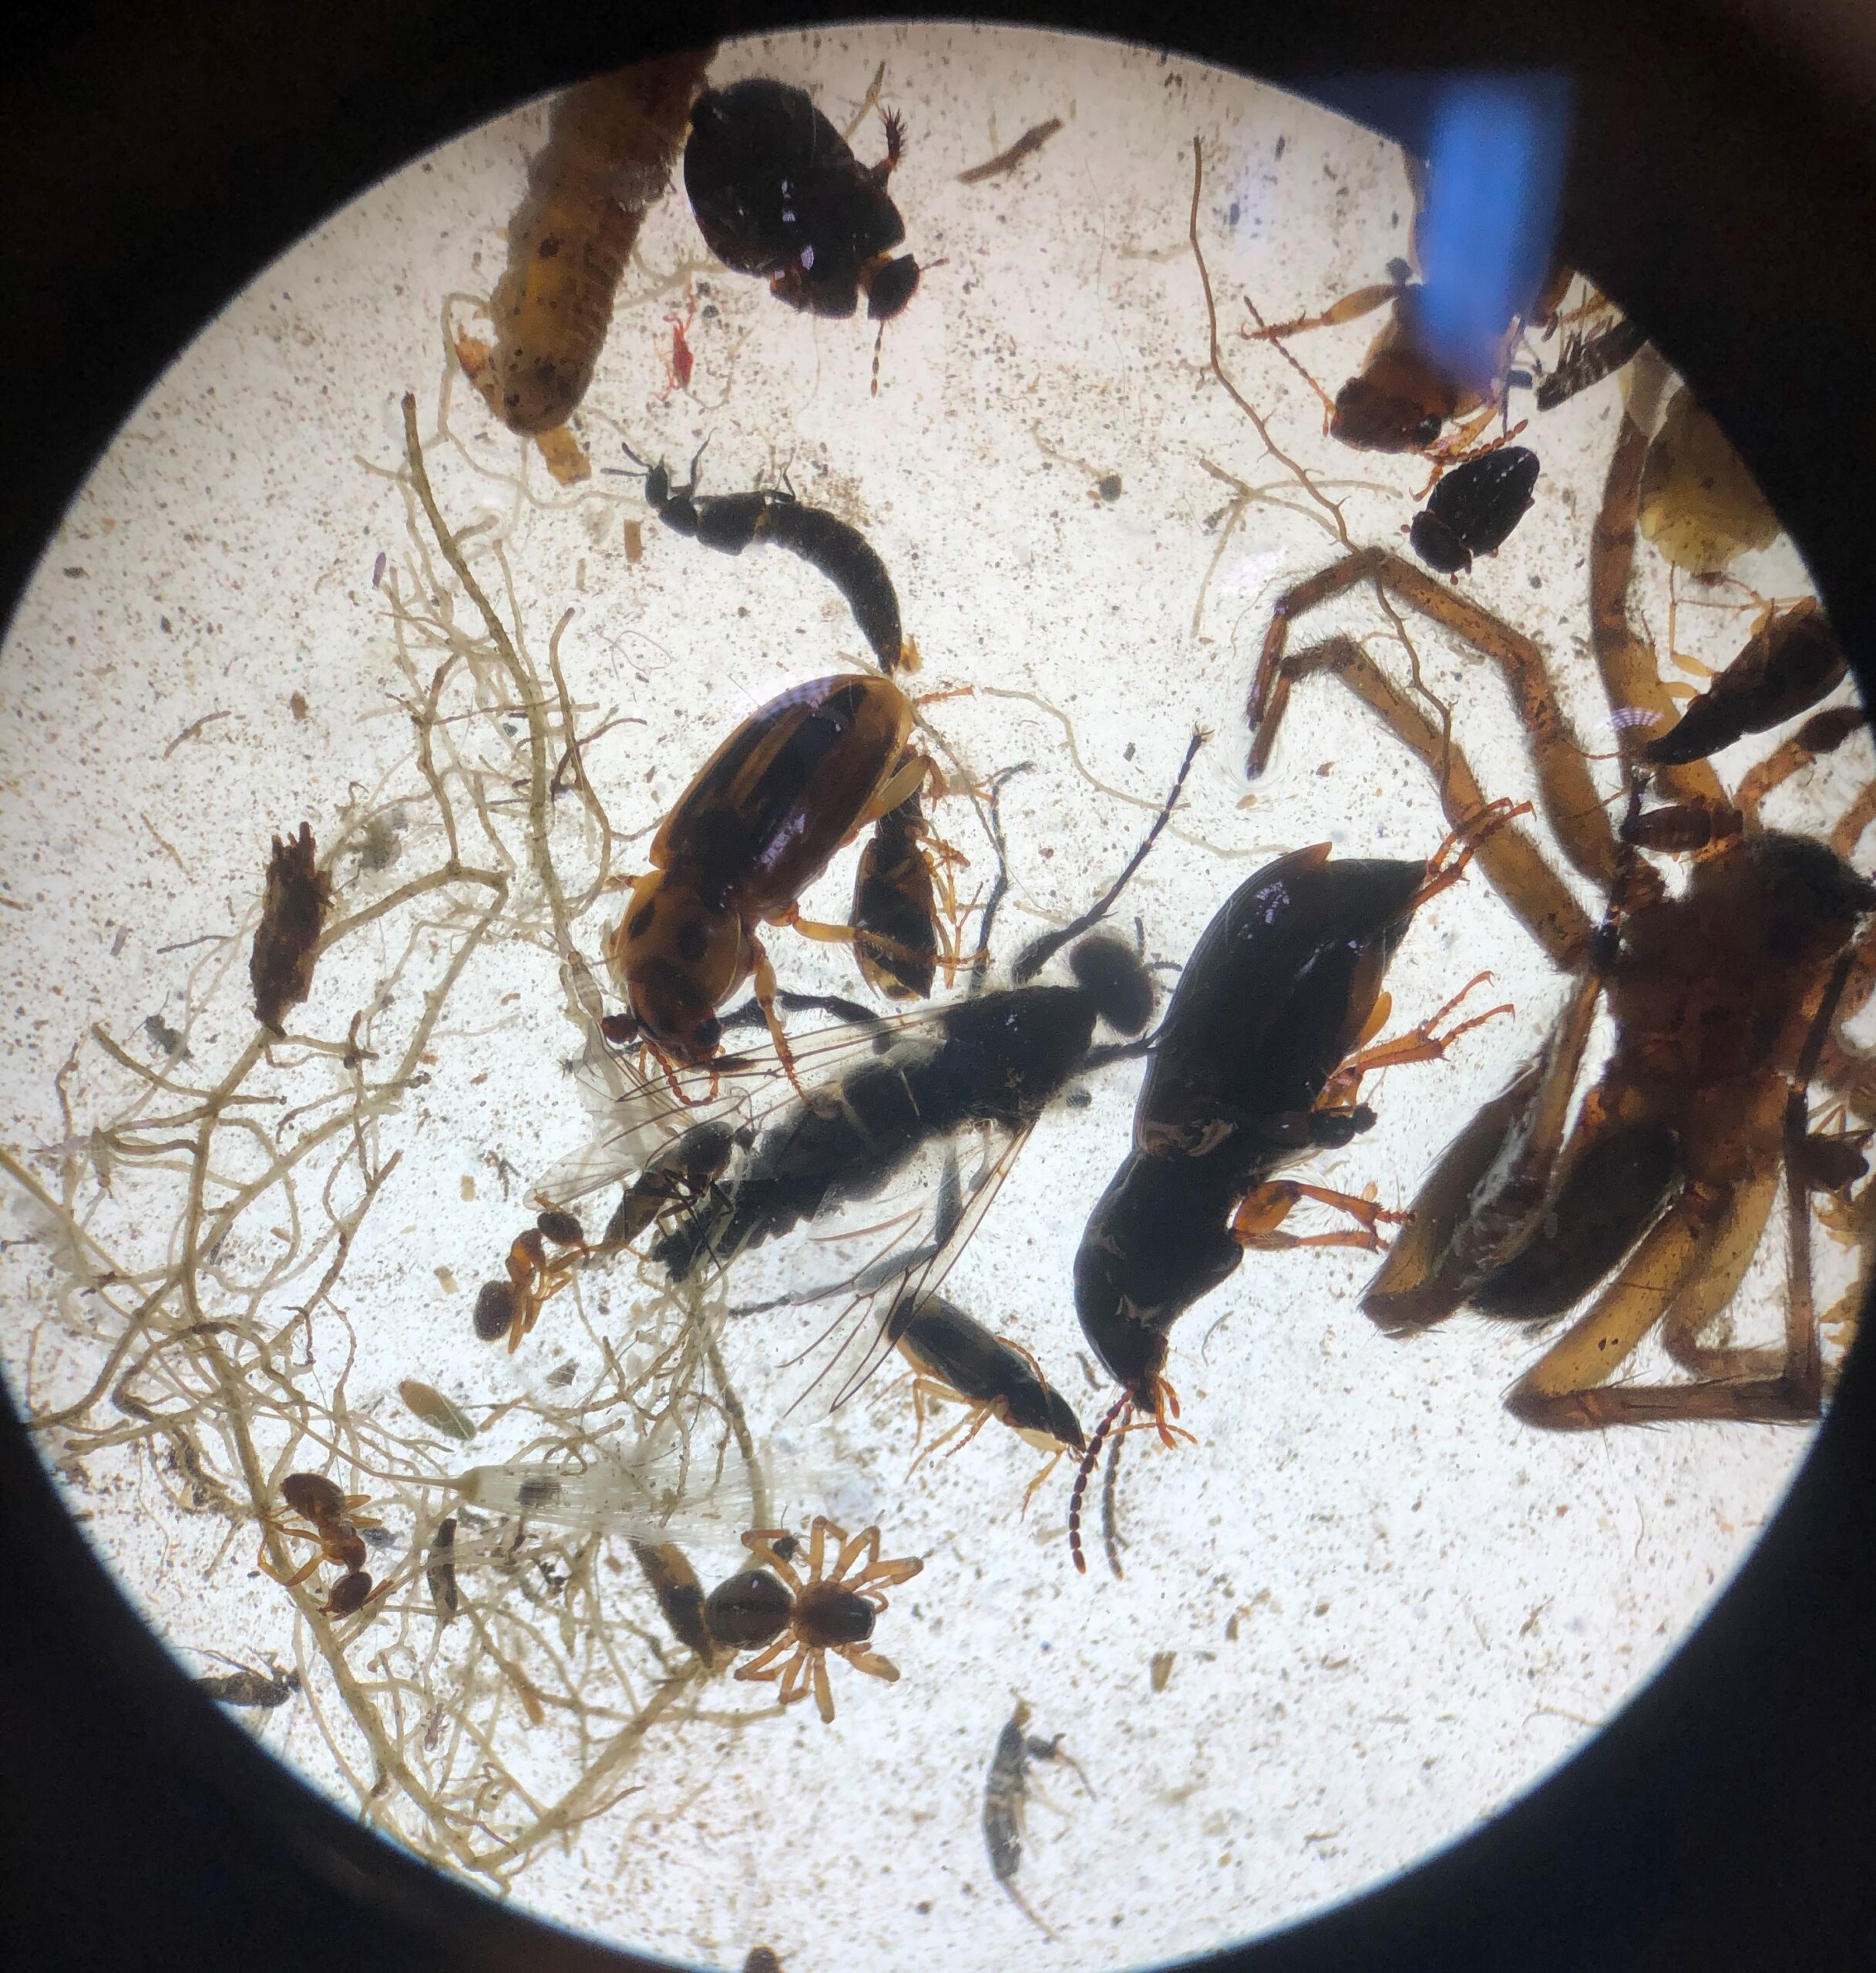
In the lab, we used a stereo microscope to classify all soil arthropods to morphospecies. While identifying organisms to species is valuable (Ward and Stanley, 2004), using morphospecies can be an efficient and effective method to monitor arthropod communities, often yielding similar numbers to species (Hackman et al., 2017).
Because pitfall traps are biased towards catching larger and more mobile arthropods while Berlese funnels are biased towards capturing smaller and less mobile arthropods (Sabu et al., 2011), we only analyzed macrofauna from pitfall traps and mesofauna from Berlese funnels. Orders we included from pitfall traps include: Araneae, Opilliones, Coleoptera, Hemiptera, Lepidoptera (caterpillars), Orthoptera, Psocoptera, Thysanoptera, Diplopoda, Dermaptera, Isopoda, and Lithobiomorpha. Orders we included from the Berlese funnels include: Symphypleona, Astigmata, small insect larva, Protura, Entomobryomorpha, Oribatida, Mesostigmata, Poduromorpha, Prostigmata, and Symphyla. We did not include ants (Hymenoptera) from either sampling method because ants’ central foraging behavior drives their organization on the landscape and can make these sampling methods inadequate for determining their abundance (Higgins and Lindgren, 2012). Tarps had no significant impact on ants during or after application.
We taxonomically identified all soil arthropods to the order level, while some were identified to family, genus, or species level as resources, time, and expertise allowed (for example, all beetles were identified to family). We identified arthropods using keys within Dindal (1990) (for all arthropods), and Evans (2014) and Bousquet (2010) (for beetles). We also utilized taxonomic resources and community identification on online sites bugguide.net (Iowa State University, 2021) and iNaturalist.org (iNaturalist, 2021).
Crop and weed sampling
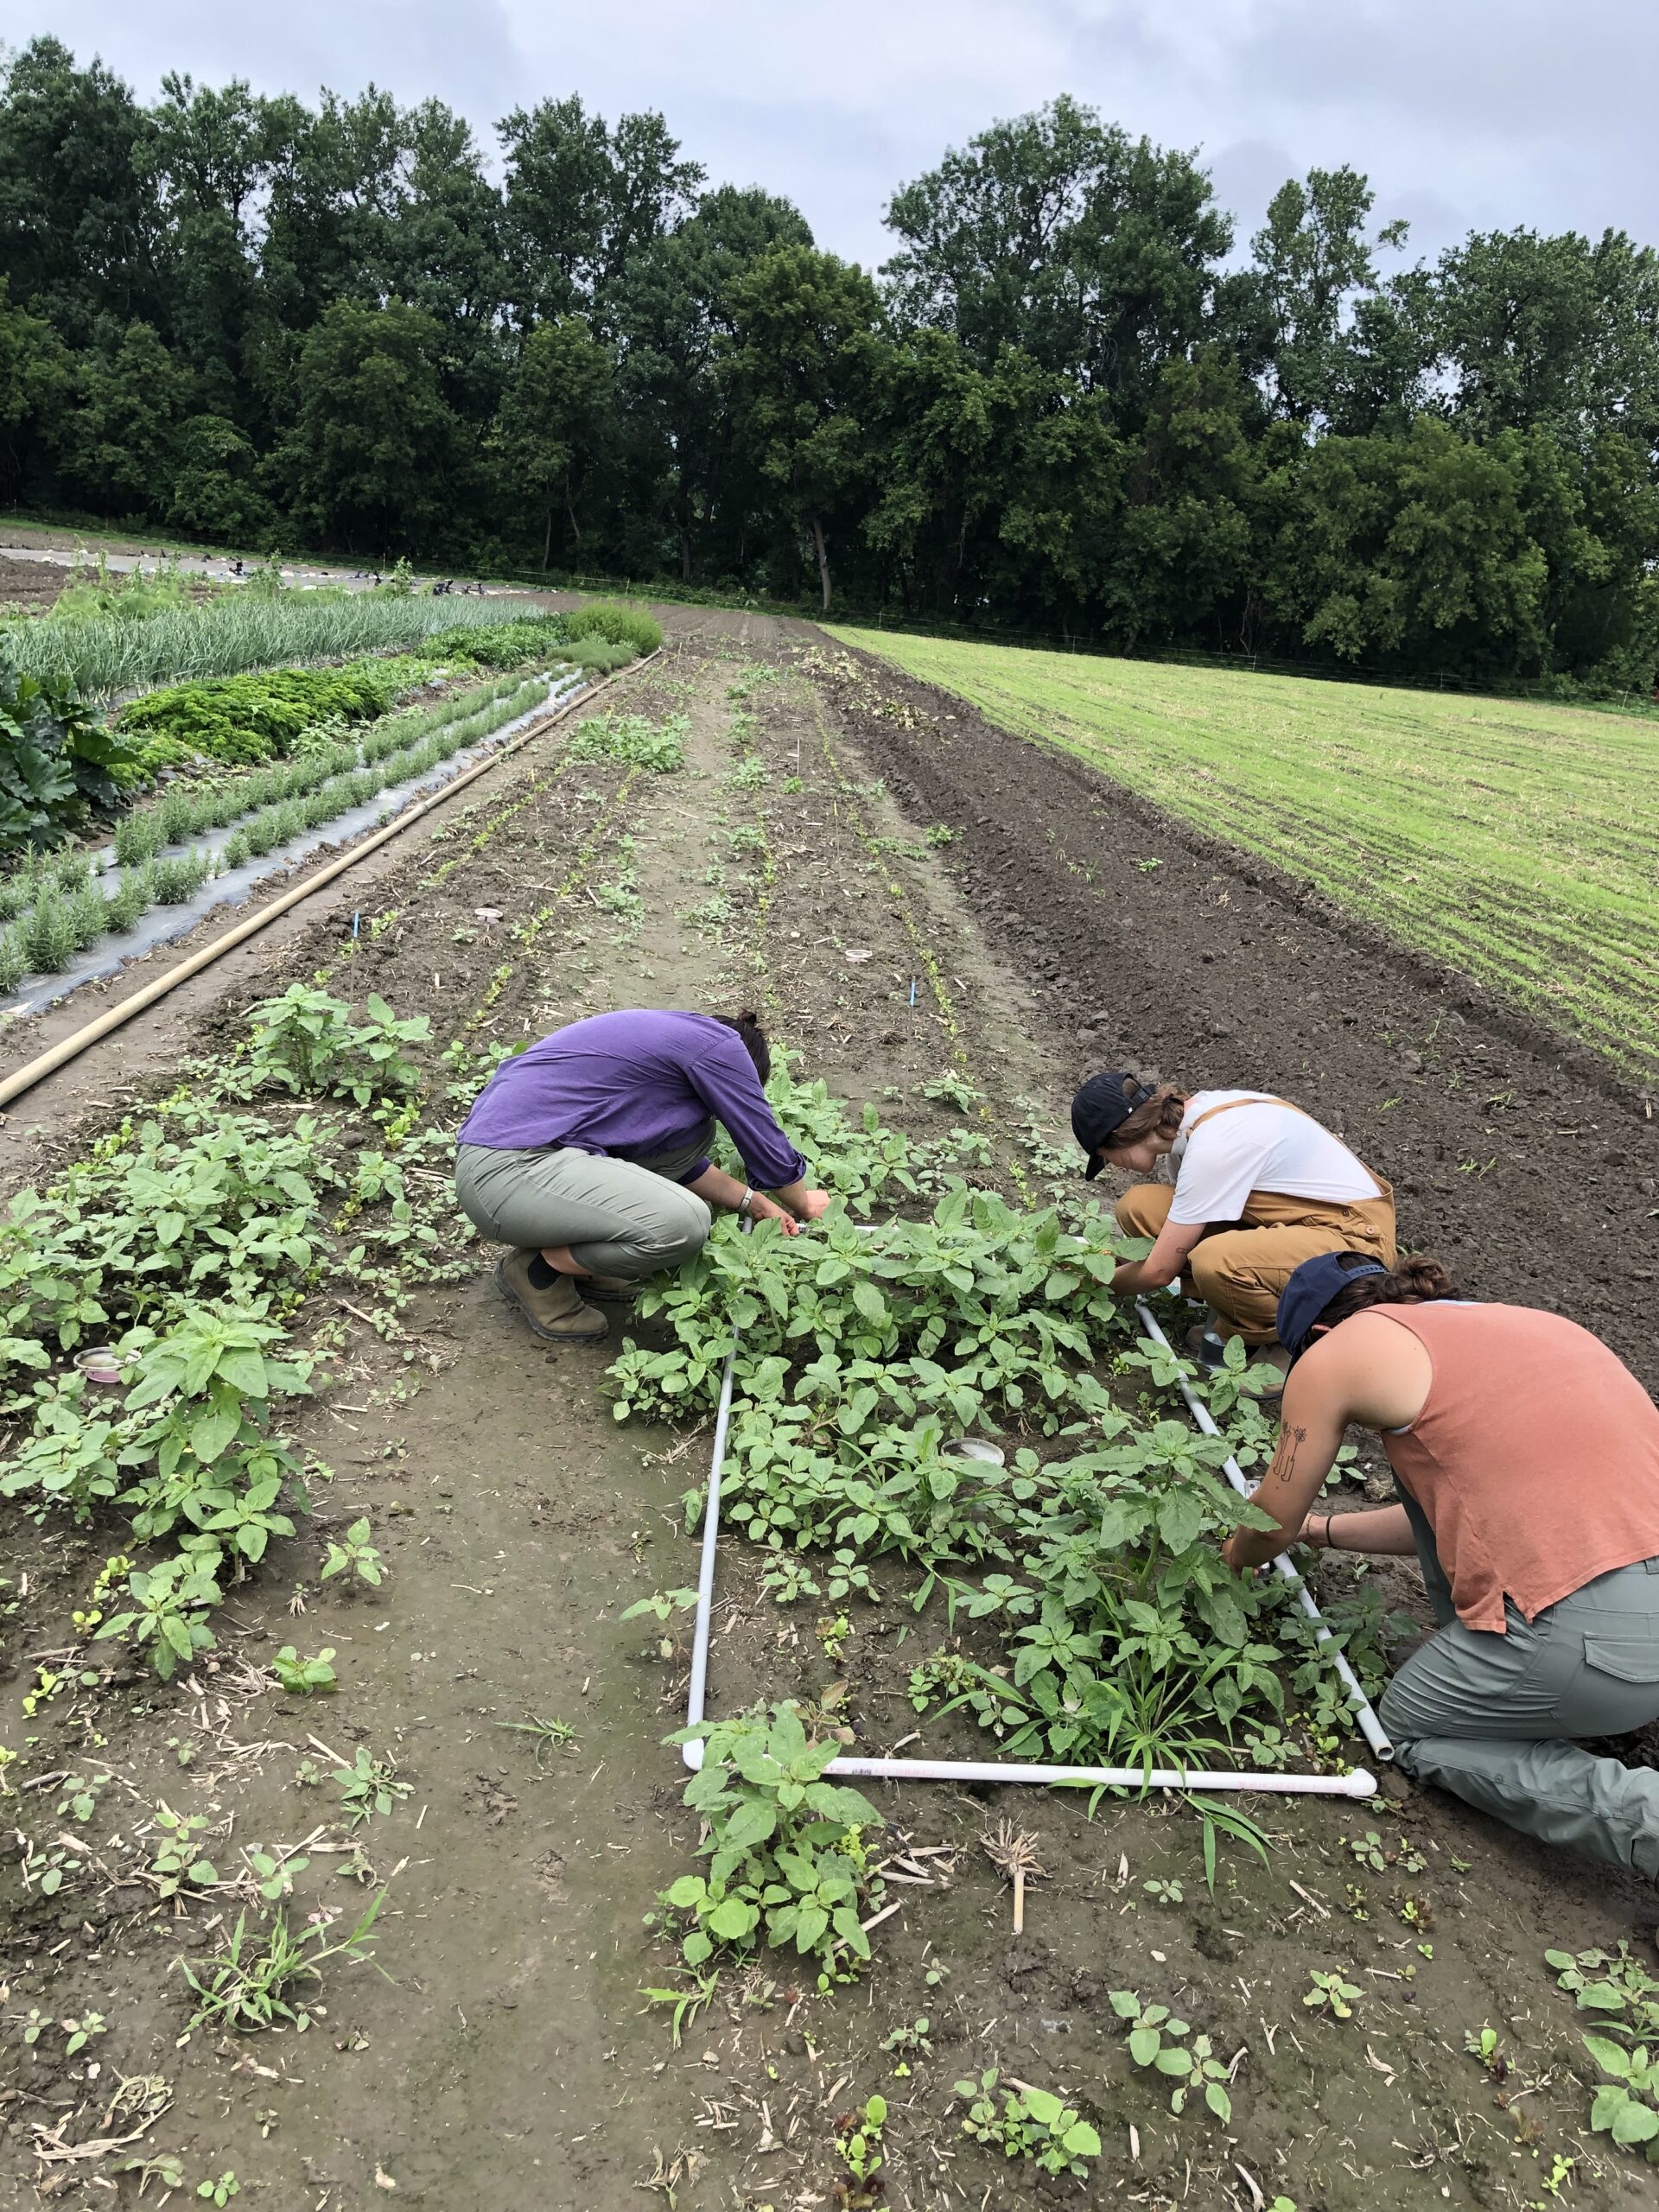
After tarp removal, we measured weed and crop growth weekly for five weeks. To sample weeds, we identified every present weed species in each plot and approximated its cover in the plot. From this, we calculated weed species richness as well as total weed coverage per plot. Total coverage could be greater than 100% if there were multiple layers of weeds present.
To sample crops, we measured the number of leaves, height, and widest leaf width of 10 randomly chosen lettuce plants in each plot. At the end of the 5 weeks, we harvested lettuce from each plot, counting individual lettuce heads and, after washing and drying the lettuce, weighing total biomass per plot.
Statistical analyses
We performed all statistical analyses in R version 4.0.4 (R Core Team, 2021) and used P < 0.05 to indicate significance. We tested how tarp treatments affected biophysical variables using analysis of variance tests (ANOVAs). For soil moisture, soil nitrate-N (measured as change in soil nitrate-N from before to after tarping), number of crop individuals per plot, and crop yield, we tested significance using linear mixed effects models, with farm as a random factor. For data that we collected over multiple time periods, including for soil temperature, surface-active and soil-dwelling arthropods (calculated as morphospecies richness, Shannon’s diversity, and total abundance), weeds (coverage and species richness), and crop growth parameters (number of leaves per plant and leaf sizes), we tested significance using repeated measures ANOVAs, again with farm as a random factor for most variables. For crop parameters, we used plot nested in farm as a random factor due to taking 10 measurements per plot.
Models were mostly fit using the lmer function in the lme4 package (Bates et al., 2015) and multiple comparisons were made using estimated marginal means tests using the emmeans package (Lenth, 2016). One exception is that abundance data was modeled using generalized linear mixed effects models fit with a negative binomial distribution (glmer.nb function in the lme4 package). Model types were chosen based on which yielded normality of residuals, which was tested using quantile-quantile plots and histograms.
Finally, we created models to test how environmental and experimental variables, including treatment, farm, soil moisture, soil temperature, weed coverage, and sampling time (1, 3, or 5 weeks after tarps were removed), related to the soil arthropod communities. “Treatment” specifically refers to whether plots were treated with silage tarps, clear plastic, or the control, and “farm” indicates at which of the three farms (Catamount, ICF, or Diggers’) the plots were located. Our primary model structures were based off a priori assumptions of the ecological system. In models representing conditions during tarp cover, we included an interaction term between treatment and farm to understand whether tarps’ effects on arthropods differed by farm site; for models after tarps were removed, we included an interaction between treatment and sampling time to see if tarps’ effects changed through time. We then assessed collinearity among explanatory variables using variance inflation factors (VIF; vif function in the car package; Fox et al., 2012), and removed variables with GVIF(1/2*DF) scores of over 5 (Fox and Monette, 1992). The only variable we eliminated was soil temperature, due to high collinearity with treatment (see Figure 9). Final variables of interest when tarps were on the fields included treatment, farm, soil moisture, and the interaction between treatment and farm. Variables of interest when tarps were removed included treatment, farm, soil moisture, weed coverage, sampling time, and the interaction between treatment and sampling time.
With these variables, we used multiple linear regression models to predict soil arthropod richness. We created separate models for when tarps were on and off the fields because these times reflect different dynamics and numbers of samplings, thus having different explanatory variables. We additionally created separate models for surface-active and soil-dwelling arthropods, due to these groups being caught with different methods and representing different ecological groups. Within our final models, we tested for significance using Type 3 ANOVAs from the car package (Type 3 ANOVAs test variables regardless of their order in the model and take into consideration interaction terms) (Shaw and Mitchell-Olds, 1993). We additionally assessed the relative importance of variables with the “lmg” method within the relaimpo package (Grömping, 2007). The “lmg” method computes the average R2 over all possible model structures (orders of variables), and we hereafter call this statistic “variable importance.”
References
Bates, D., Mächler, M., Bolker, B., Walker, S., 2015. Fitting linear mixed-effects models using lme4. Journal of Statistical Software 67, 1–48.
Bousquet, Y., 2010. Illustrated identification guide to adults and larvae of northeastern North American ground beetles (Coleoptera, Carabidae). Pensoft Publishers: Sofia-Moscow, Bulgaria.
Dindal, D.L., 1990. Soil biology guide. John Wiley & Sons, New York.
Evans, A.V., 2014. Beetles of Eastern North America. Princeton University Press: New Jersey, USA
Fox, J., Monette, G., 1992. Generalized collinearity diagnostics. Journal of the American Statistical Association 87, 178–183. https://doi.org/10.1080/01621459.1992.10475190
Grömping, U., 2007. Relative importance for linear regression in R: the package relaimpo. Journal of statistical software 17, 1–27.
Hackman, K.O., Gong, P., Venevsky, S., 2017. A rapid assessment of landscape biodiversity using diversity profiles of arthropod morphospecies. Landscape Ecology 32, 209–223. https://doi.org/10.1007/s10980-016-0440-4
Higgins, R.J., Lindgren, B.S., 2012. An evaluation of methods for sampling ants (Hymenoptera: Formicidae) in British Columbia, Canada. The Canadian Entomologist 144, 491–507. https://doi.org/10.4039/tce.2012.50
iNaturalist, 2021. URL http://www.inaturalist.org.
Iowa State University, D. of E., 2021. Bugguide.net [WWW Document]. Bugguide. URL https://bugguide.net.
Lenth, R., Singmann, H., Love, J., Buerkner, P., Herve, M., 2018. Emmeans: Estimated marginal means, aka least-squares means. R package version 1, 3.
Luján Soto, R., de Vente, J., Cuéllar Padilla, M., 2021. Learning from farmers’ experiences with participatory monitoring and evaluation of regenerative agriculture based on visual soil assessment. Journal of Rural Studies 88, 192–204. https://doi.org/10.1016/j.jrurstud.2021.10.017
Méndez, V.E., Bacon, C.M., Cohen, R., 2013. Agroecology as a transdisciplinary, participatory, and action-oriented approach. Agroecology and Sustainable Food Systems 37, 3–18. https://doi.org/10.1080/10440046.2012.736926
Méndez, V.E., Caswell, M., Gliessman, S.R., Cohen, R., 2017. Integrating agroecology and Participatory Action Research (PAR): Lessons from Central America. Sustainability 9, 705. https://doi.org/10.3390/su9050705
NOAA, N.C.D.C., 2021. Monthly summaries of the global historical climatology network - daily (GHCN-D). [Burlington International Airport, VT US] [WWW Document]. URL https://www.ncei.noaa.gov/access/metadata/landing-page/bin/iso?id=gov.noaa.ncdc:C00841 (accessed 11.14.21).
NRCS USDA, 2022. Web soil survey. Available online at websoilsurvey.nrcs.usda.gov (accessed 10.18.22).
R Core Team, 2021. R: A Language and Environment for Statistical Computing.
Sabu, T.K., Shiju, R.T., Vinod, KV., Nithya, S., 2011. A comparison of the pitfall trap, Winkler extractor and Berlese funnel for sampling ground-dwelling arthropods in tropical montane cloud forests. Journal of Insect Science 11. https://doi.org/10.1673/031.011.0128
Shaw, R.G., Mitchell-Olds, T., 1993. Anova for unbalanced data: An overview. Ecology 74, 1638–1645. https://doi.org/10.2307/1939922
Utter, A., White, A., Méndez, V.E., Morris, K., 2021. Co-creation of knowledge in agroecology. Elementa: Science of the Anthropocene 9, 00026. https://doi.org/10.1525/elementa.2021.00026
Ward, D.F., Stanley, M.C., 2004. The value of RTUs and parataxonomy versus taxonomic species. New Zealand Entomologist 27, 3–9. https://doi.org/10.1080/00779962.2004.9722118
Soil properties
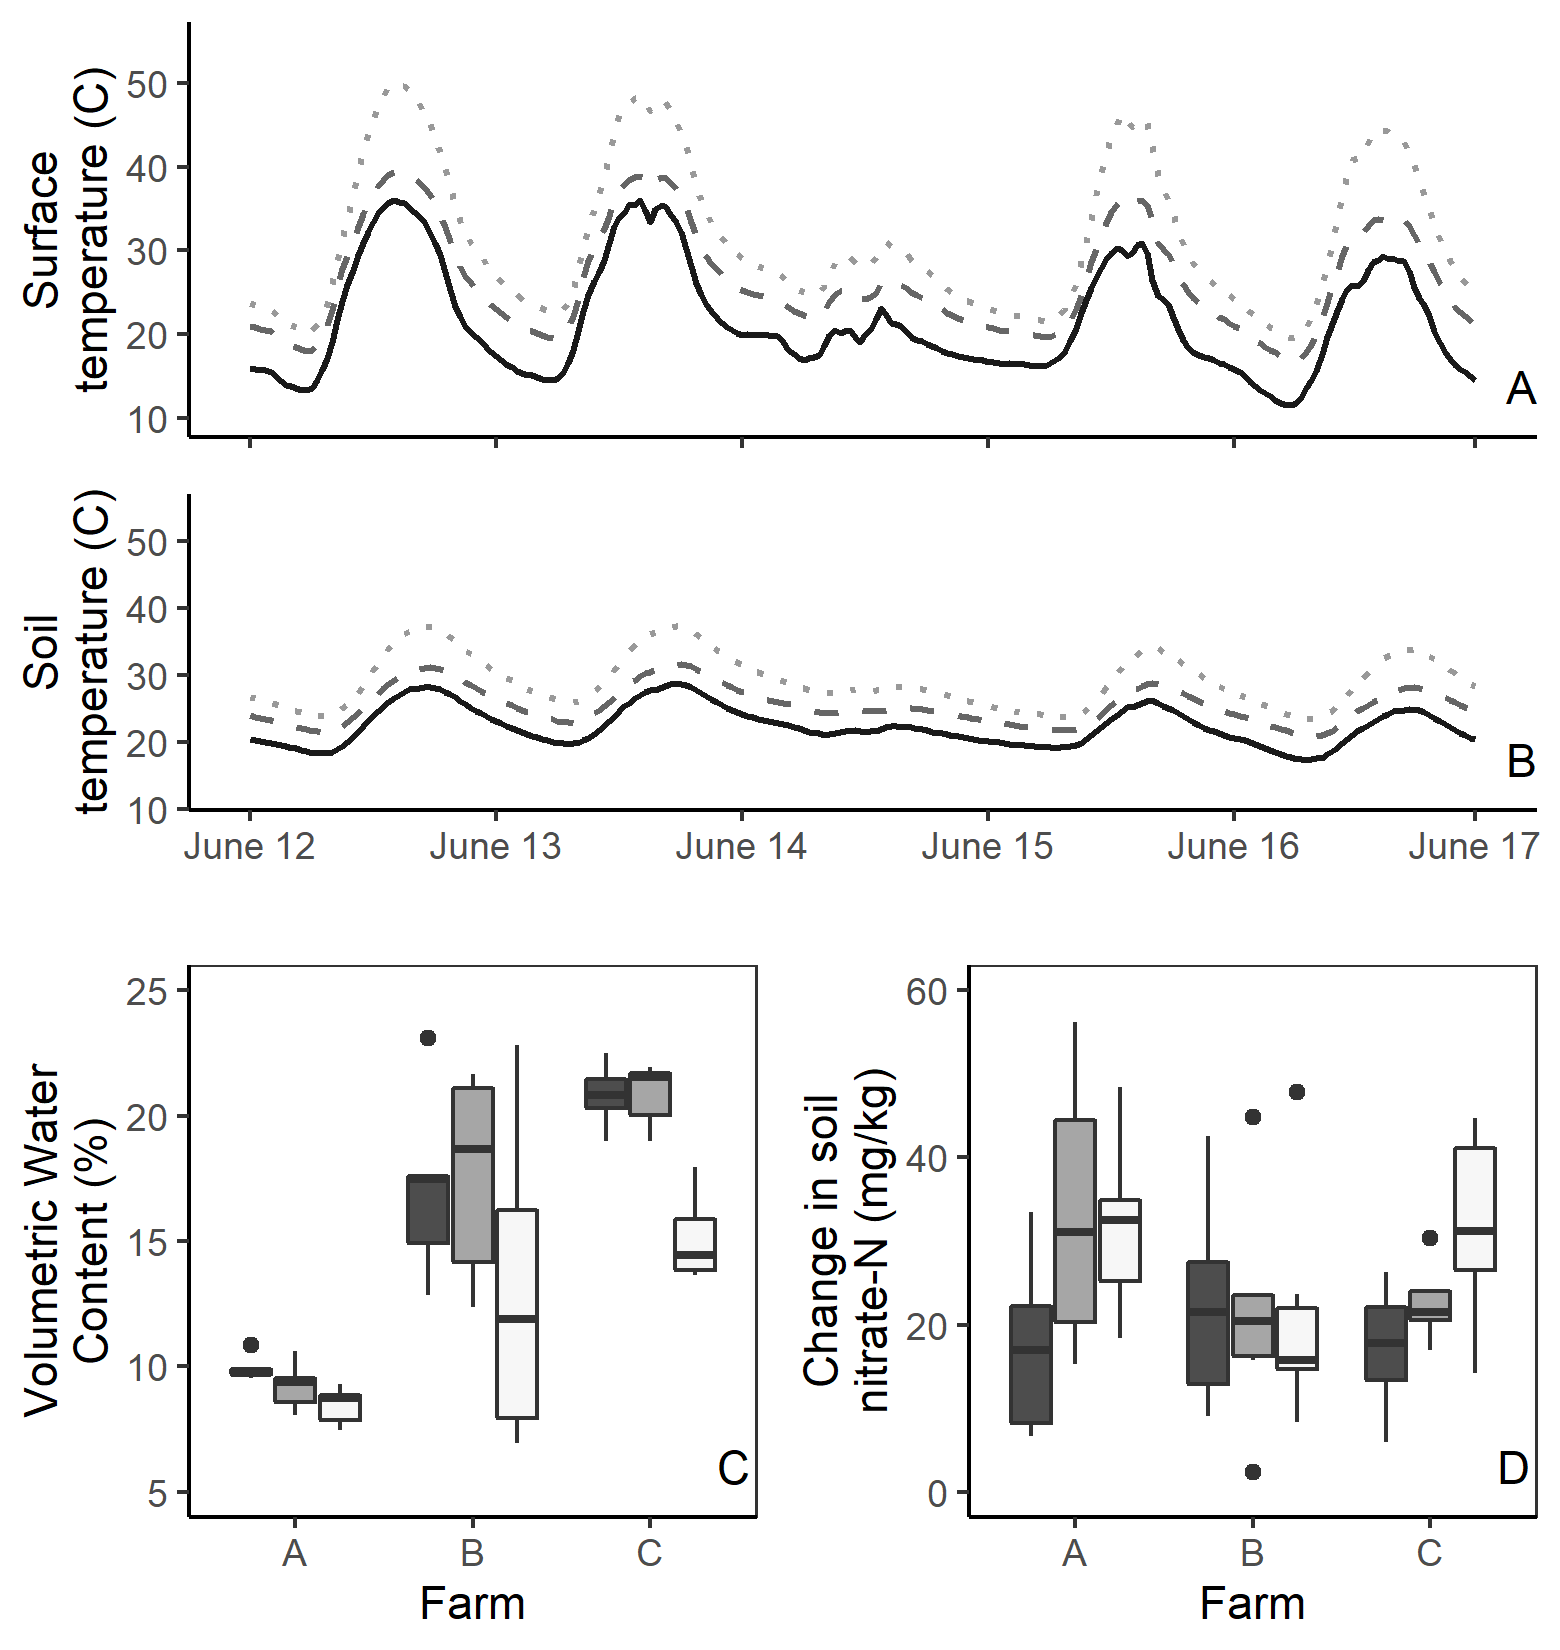
Tarps significantly increased soil temperatures at the surface and 10 cm below the surface (all P < 0.0001), with clear plastic causing higher surface and soil temperatures than silage tarps (both P < 0.0001; Figure 6). The highest recorded surface temperature under the clear plastic tarps was 59°C, compared to 52°C in the silage tarp and 43°C in the control plots. At 10 cm below the soil surface, there was a maximum temperature of 48°C in the clear plastic tarp treatment, compared to 34°C in the control. Extremely hot temperatures under the clear plastic tarps likely relate to the greenhouse effect, where heat is trapped under the tarps. On the other hand, heat under silage tarps likely is due to black tarps absorbing heat. Higher temperatures under both tarps raise potential concerns if they create inhospitable environments for biological life and affect soil functioning.
Soil moisture results slightly varied by farm, though in general we found lower soil moisture under clear plastic tarps compared to control or silage tarp plots (both P < 0.01). Moisture was similar between the control and silage tarp plots (P = 0.86). Lower moisture under clear tarps may reflect condensation on the tarp surface, which was visible during the experiment. Many factors may contribute to moisture trends, including soil texture and recent precipitation and temperature patterns.
Nitrate results also varied by farm. At Catamount and Diggers’, tarps showed more positive change in soil nitrate availability than control plots. However, at ICF we found no differences among treatments. Overall, there were no significant differences, though clear plastic showed a slightly positive effect on soil nitrate (P = 0.09). These results may relate to fertilizer type, as each farm used a slightly different fertilizer. In particular, ICF used a slower-releasing fertilizer which may make the soil nitrate effects more delayed. An experiment testing soil nitrate availability for several weeks after a tarp treatment may better elucidate trends.
Arthropods
We collected a total of 8,027 surface-active arthropods (2,710 from Catamount, 2,591 from Diggers’, and 2,726 from ICF), comprising 102 morphospecies and 12 orders. At the order level, the most abundant group were beetles with 5,559 total individuals. Beetles were also the order with the most morphospecies (with 75 identified beetle morphospecies).
In the Berlese funnel samples, we collected 823 soil-dwelling arthropods, consisting of 20 morphospecies and 10 total orders. Collembolans, mostly from the order Entomobryomorpha, comprised 48% of the Berlese samples, while mites, mostly Prostigmata, made up 39% of the samples.
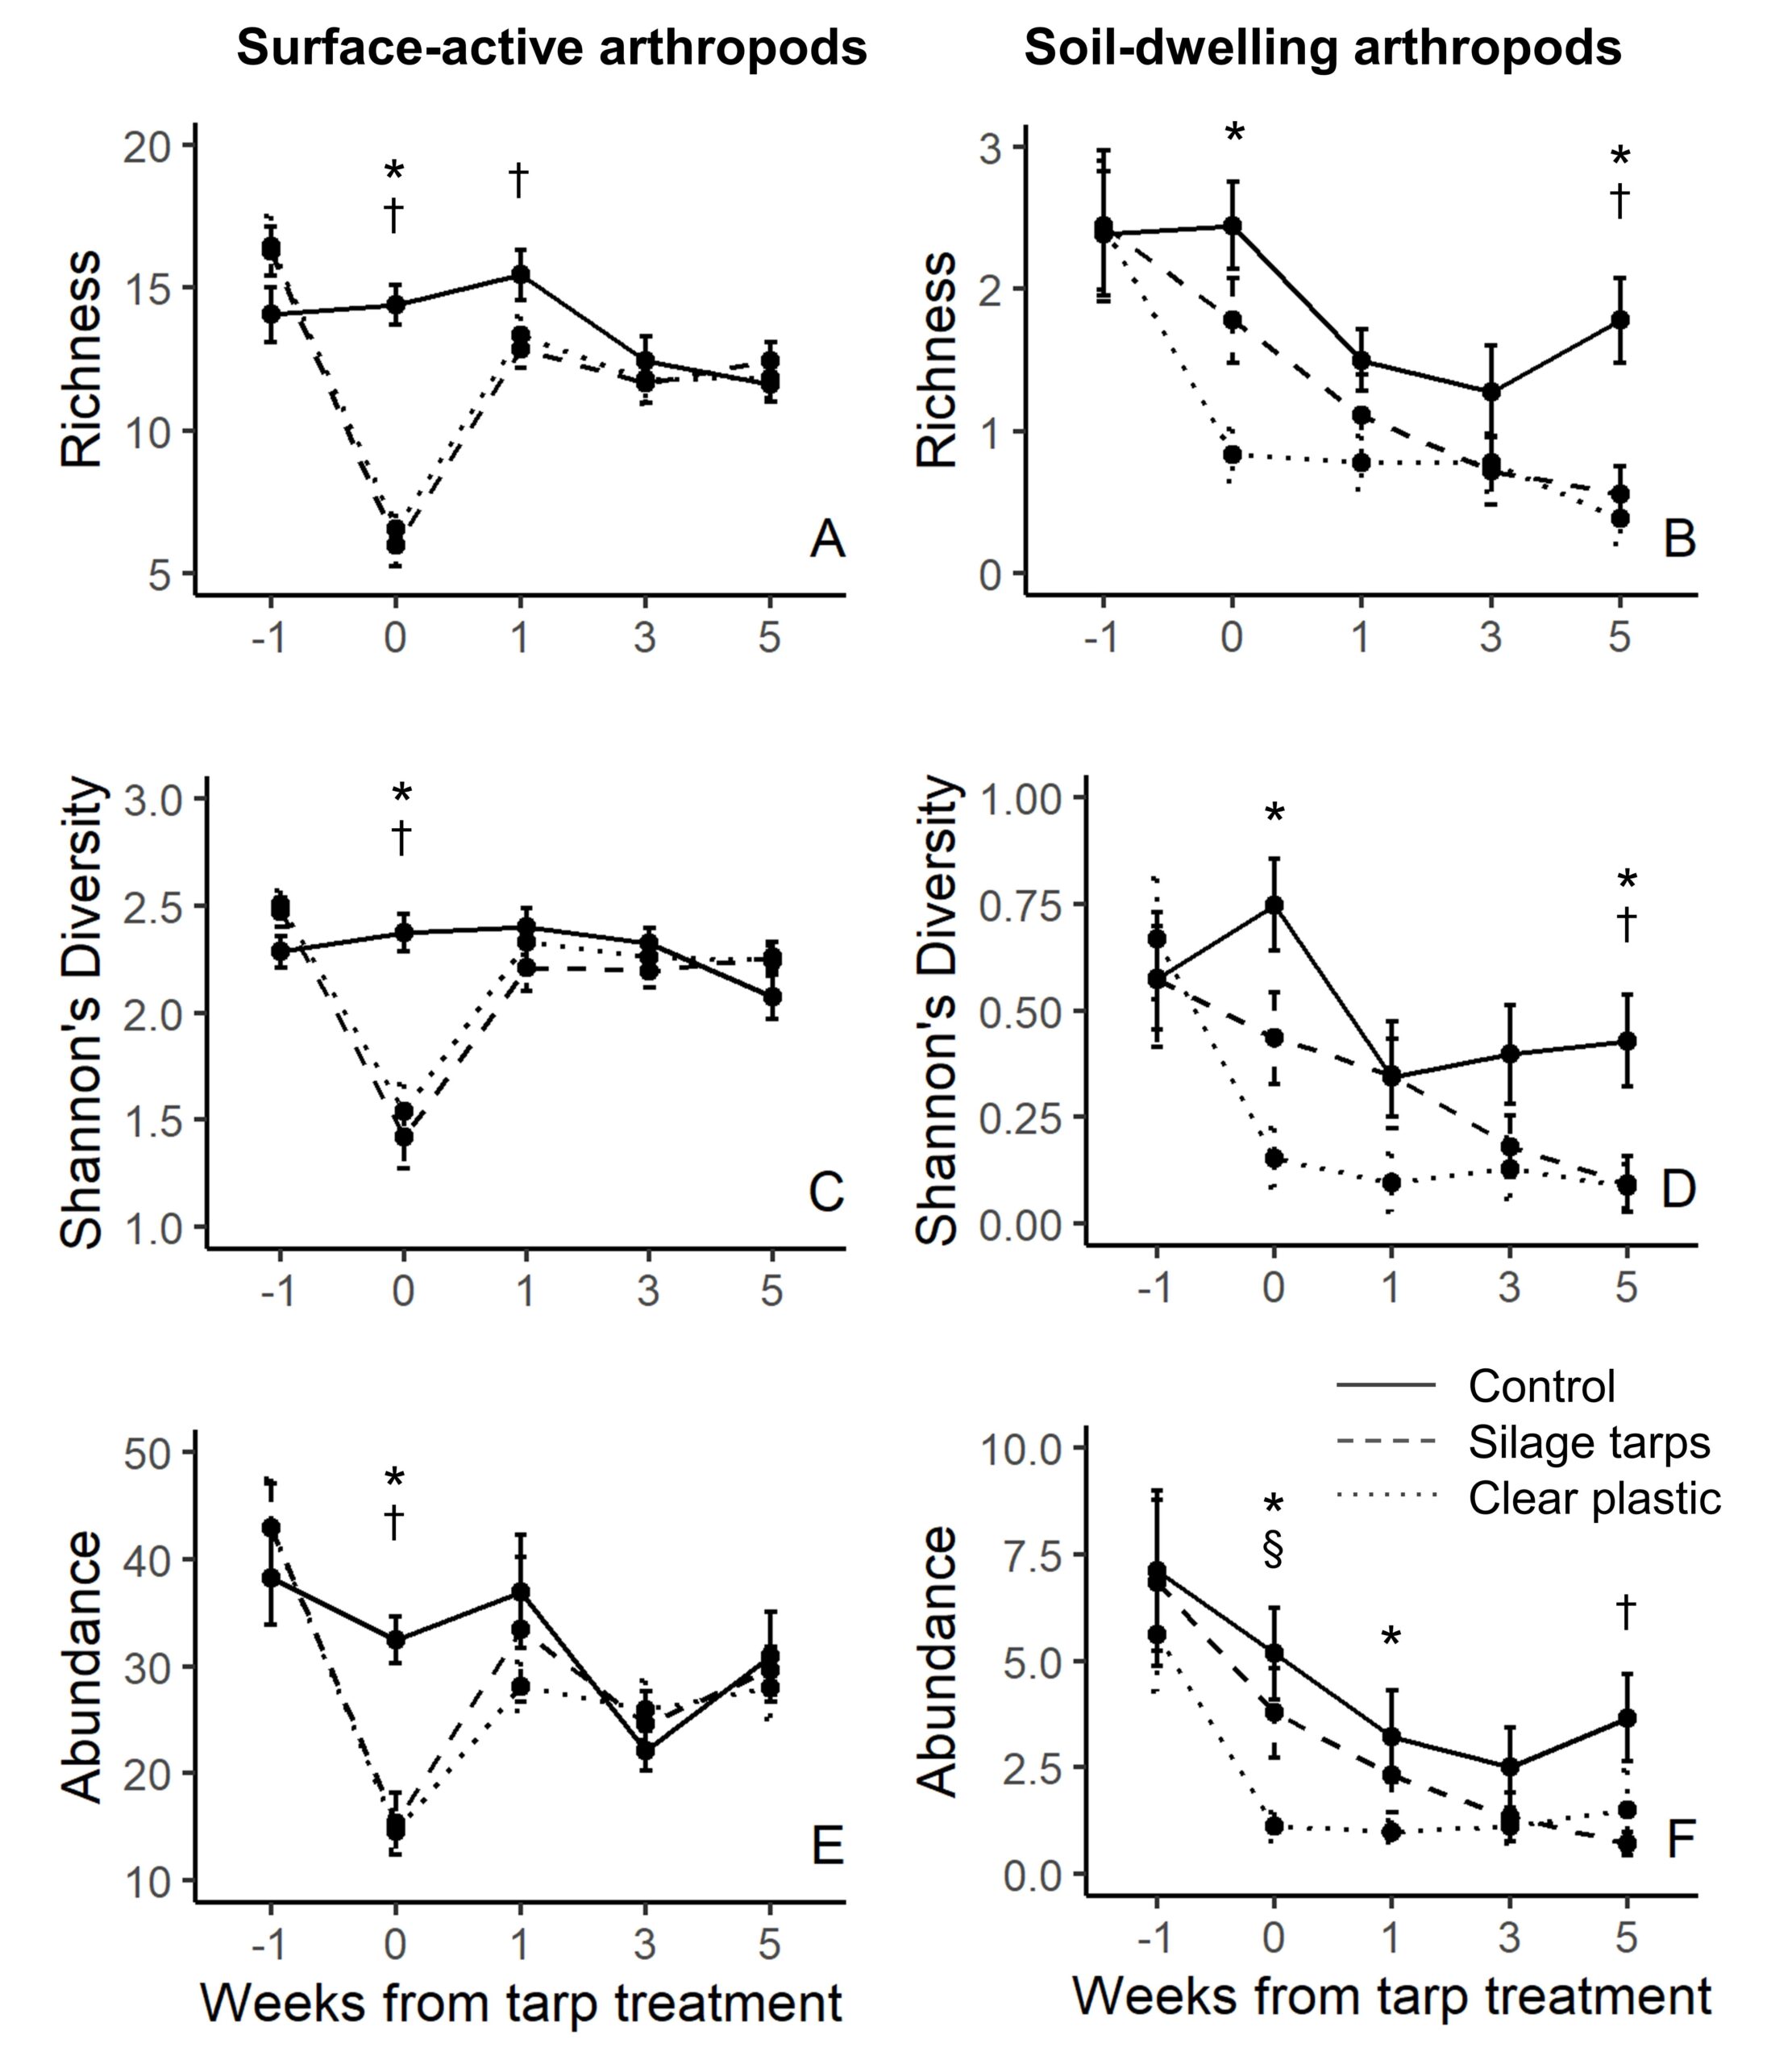
For surface-active arthropods, during the tarping treatment both silage tarps and clear plastic tarps had significantly lower richness, Shannon’s diversity and total abundance than the control plots (all P < 0.001; Figure 7A,C,E). One week after we removed the tarps, silage tarps had lower richness than control plots (P = 0.044), but there were no other significant differences. At 3 and 5 weeks after tarp removal, there were no significant differences for richness, Shannon’s diversity, or abundance among the treatments.
For soil-dwelling arthropods, richness and Shannon’s diversity were significantly lower in the clear plastic tarp plots than in the control plots during the tarping treatment (both P < 0.001; Figure 7B,D). Abundance of soil-dwelling arthropods during the tarp treatment was significantly lower in the clear plastic tarps compared to both control (P = 0.002) and silage tarp plots (P = 0.034; Figure 7F). Soil-dwelling arthropod abundance remained significantly lower in the clear plastic tarp plots than the control plots 1 week after tarp removal (P = 0.033). While there were no differences in richness or Shannon’s diversity values 1 and 3 weeks after tarp removal, 5 weeks after tarp removal silage tarp and clear plastic tarp plots had significantly lower richness (P = 0.011 & P = 0.050) and Shannon’s diversity values (P = 0.003 & P = 0.045) than control plots. Additionally, abundance was significantly lower in silage tarp plots than control plots 5 weeks after tarp removal (P = 0.004; Figure 7F).
These results demonstrate that tarps lead to immediate impacts on surface-active and soil-dwelling arthropod communities. However, recovery of arthropods differed between groups, with a clearer recovery in our study’s time frame for surface-active arthropods. This may be because surface-active arthropods are larger and more mobile, allowing them to migrate out of the tarped area when the tarps are applied, and recolonize once the tarps have been removed. On the other hand, recovery might not be as quick for soil-dwelling arthropods, which are smaller, less mobile, and more reliant on local environmental conditions. Thus, soil-dwelling arthropods could suffer greater population casualties than surface-active arthropods as a result of tarping. The long-term effects of continuous tarping on these communities and the impacts of tarps on pest dynamics remain uncertain. We encourage future research on tarps effects on soil arthropods to help answer these questions.
Weeds and crops
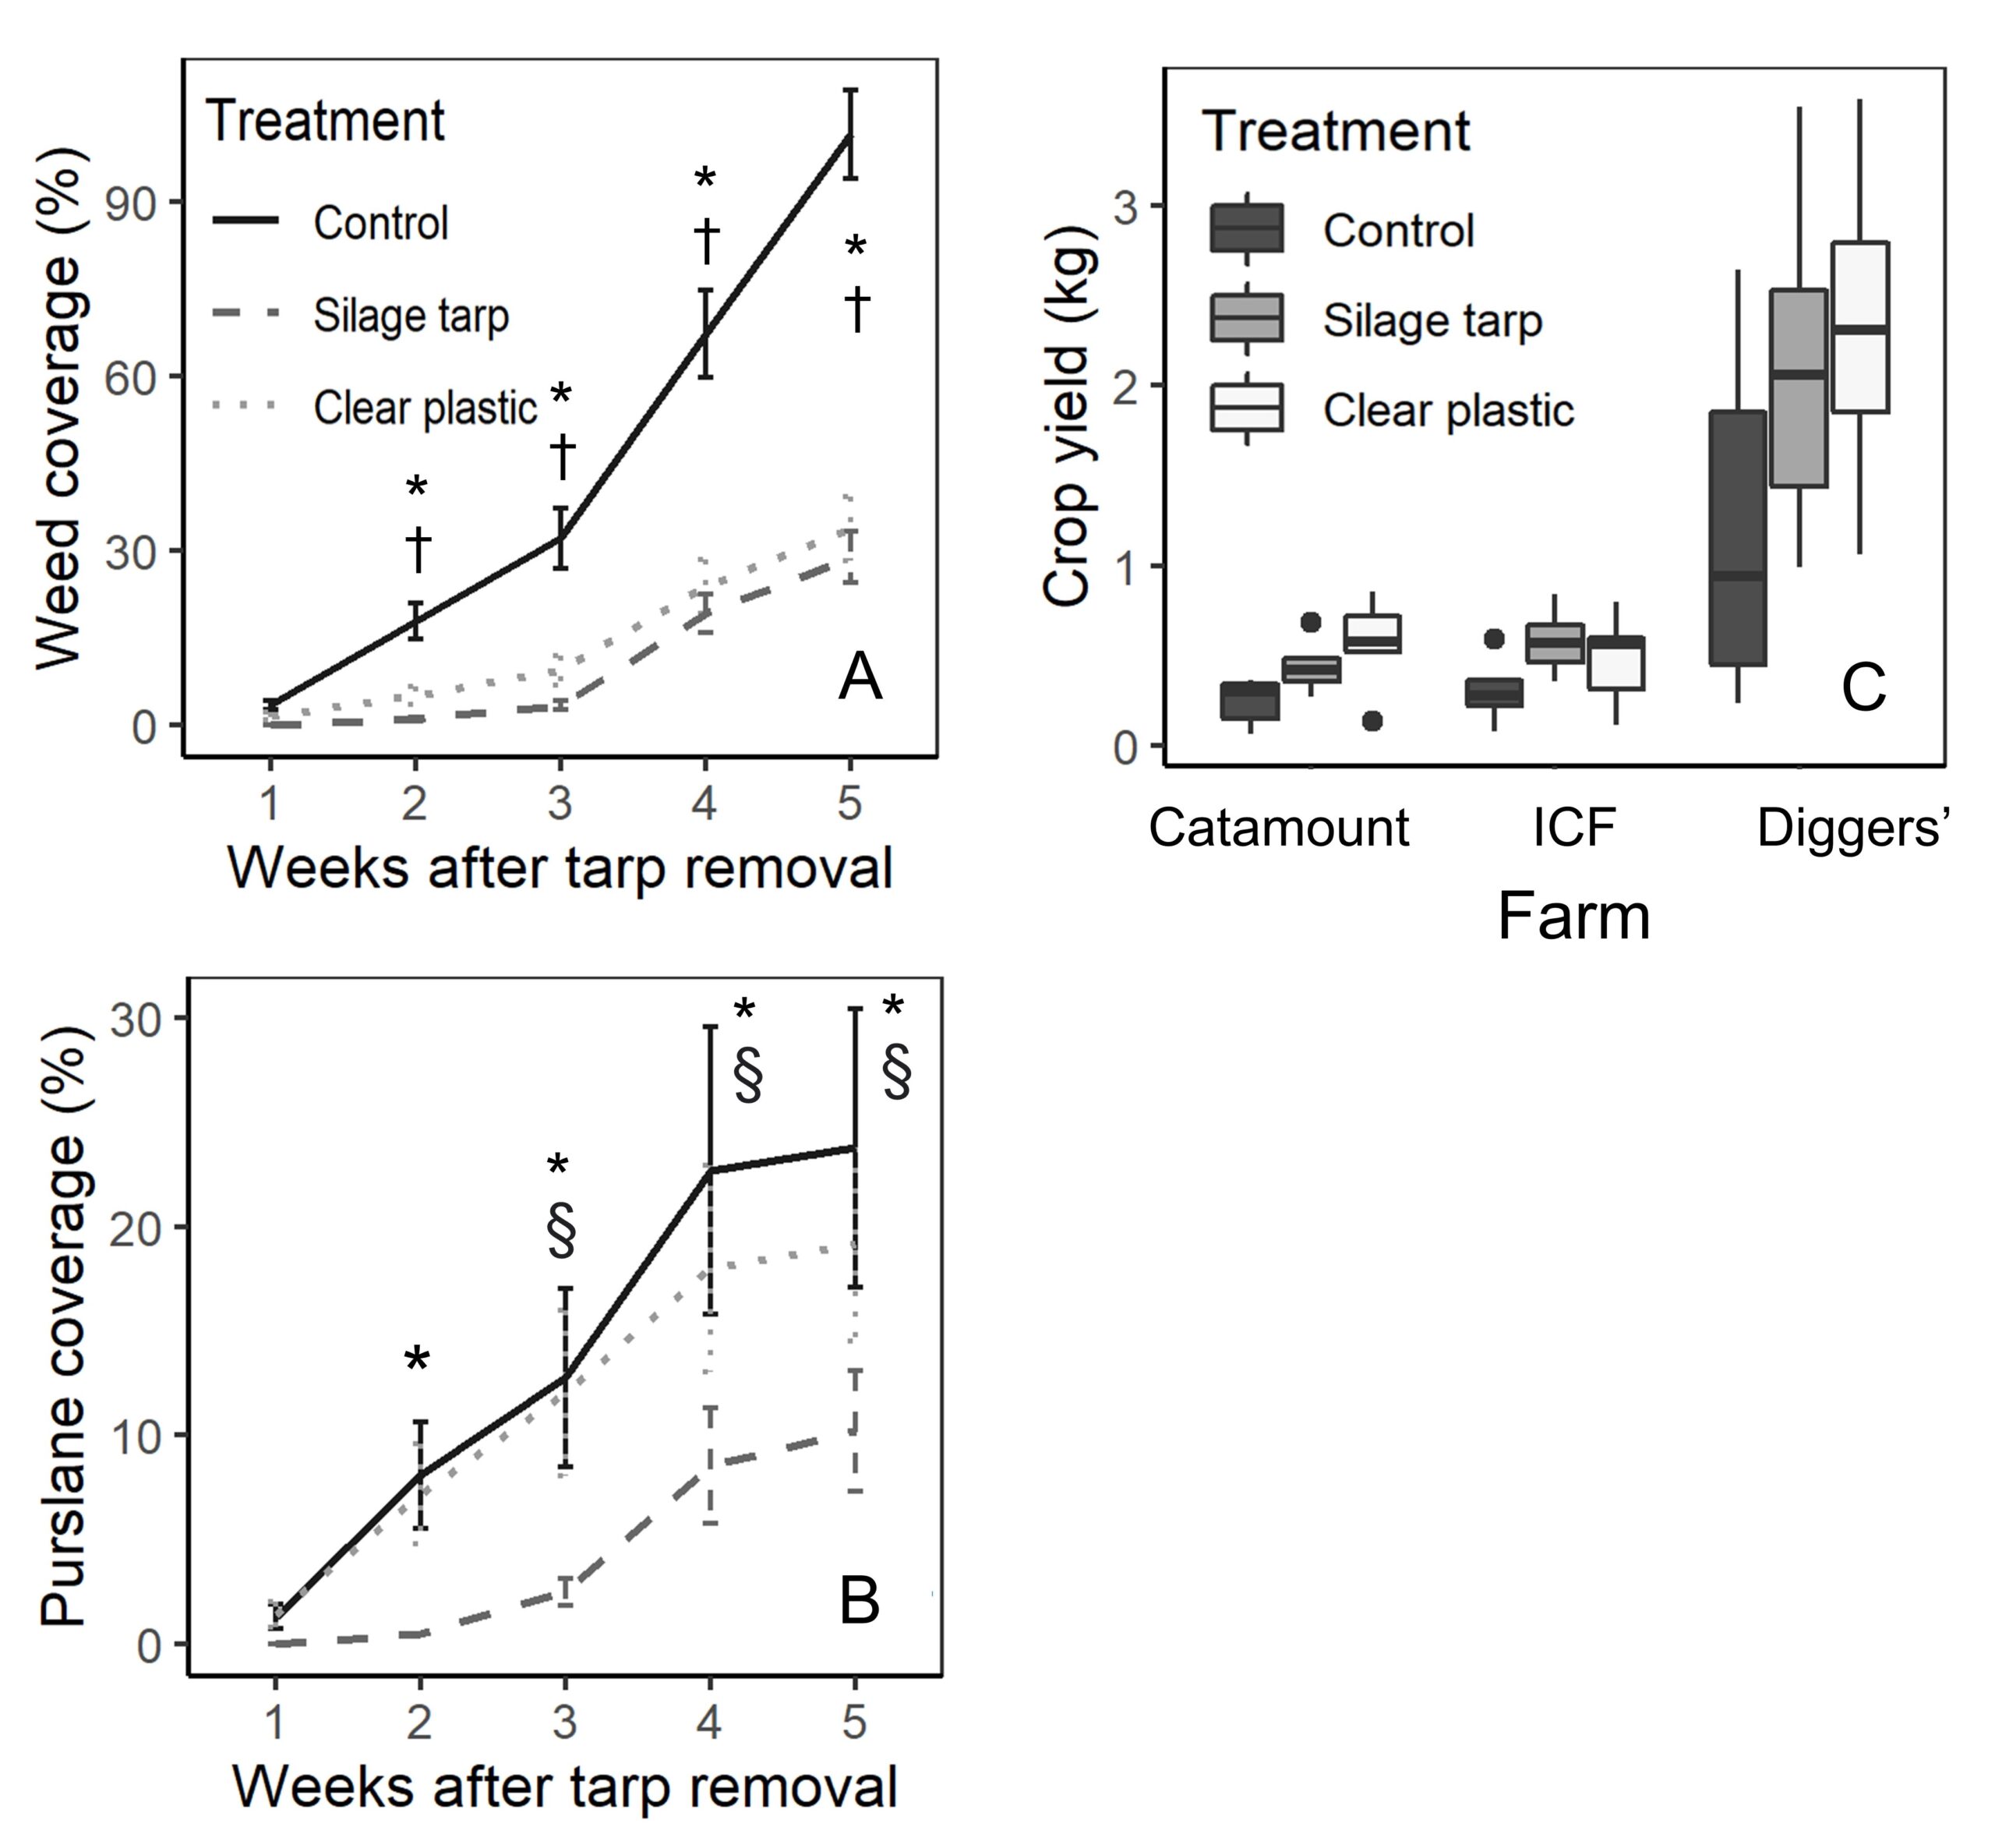
While all treatments had less than 5% weed cover at the time of tarp removal, by 2 weeks after tarp removal the tarped treatments had significantly less weed coverage than control plots (clear plastic - control: P = 0.034; silage tarp - control: P = 0.003). Weed coverage remained much lower in the tarped treatments for the remainder of the experiment (P < 0.001 for all comparisons between tarped treatments and control; Figure 8A). By 5 weeks after tarp removal, control plots had an average of around 90% weed coverage while the tarped plots had around 30% weed coverage.
Also, while tarping suppressed most weed species, purslane (Portulaca oleracea) provided an exception, with clear plastic tarps particularly ineffective at controlling purslane (Figure 8B). Purslane cover in the clear plastic tarp plots was similar to that in the control plots. Also, from 3 to 5 weeks after tarp removal, purslane cover was significantly higher in clear plastic plots than in silage tarp plots. At the end of the experiment, clear plastic plots had an average of 19% purslane coverage, compared to 24% in control plots, and 10% in silage tarp plots.
Tarping had positive effects on crops, with crop yields in the tarped treatments being twice those in the control plots (both P < 0.002; Figure 8C). This likely ties to the finding that tarped treatments had significantly more leaves per lettuce plant than control plots (clear plastic – control P < 0.001; silage tarp - control P = 0.04). As well, tarping caused slight increases to leaf size: crop leaf width 4 weeks after planting was larger by 5-8 mm in silage tarps plots than control plots (P = 0.05). However, the number of lettuce individuals per plot at harvest did not differ among treatments. Crop yields negatively related to weed cover (P = 0.001) but did not relate to available soil nitrate-N (P = 0.517).
These results confirm farmers’ experiences by showing that tarps are effective at suppressing weeds. The reduction in weed coverage also likely contributed higher crop yields, due to less competition for nutrients and light. However, the inefficiency of clear plastic tarps for purslane should encourage caution. Farms with high levels of purslane may want to avoid clear plastic tarps and opt instead to use silage tarps.
Relationships between soil arthropods and environmental and experimental factors
When tarps were on the fields, environmental and experimental variables explained over 75% of the variation in surface-active arthropod richness and 44% of the variation in soil-dwelling arthropod richness (Table 3). For both groups, treatment had the greatest variable importance score and was a significant predictor in the model. For surface-active arthropods, the interaction between treatment and farm also significantly explained surface-active arthropod richness (Table 3). While soil temperature was not included in the multiple regression models due to collinearity with treatment, it significantly related to the richness of surface-active (R2 = 0.32; P < 0.001) and soil-dwelling arthropods (R2 = 0.30; P < 0.001).
When tarps were removed, our models explained around 20% of the variability in surface-active arthropod richness and 23% of the variability in soil-dwelling arthropod richness (Table 3). Farm site had the highest variable importance score for surface-active arthropods and was significant in the models for both groups. For soil-dwelling arthropods, treatment had the highest variable importance score and was significant. No other variables were significant predictors of surface-active or soil-dwelling arthropod richness.
These results indicate that arthropod richness varied among farm sites, despite the fact that farms were relatively geographically close to one another. These differences among farms are likely due to differing environmental and physical conditions, including differences in soil type, plant composition, and nearby landscape composition. However, during tarping the effect of treatment was strong enough to drive patterns and overshadow farm’s effect. The significant interaction between treatment and farm in our models also indicates that treatment’s effects may differ in certain contexts, showing that tarping may be more effective on some farms than others. As well, the negative relationship between soil temperature and arthropod diversity, and the high collinearity between treatment and temperature, suggest that tarps’ heat effects could be negatively impacting arthropods. Finally, we were surprised that environmental variables like soil moisture or weed coverage did not have more of an effect on arthropods, but it is possible that the relatively short time period of the experiment and small treatment plots contributed to less detectable impact.
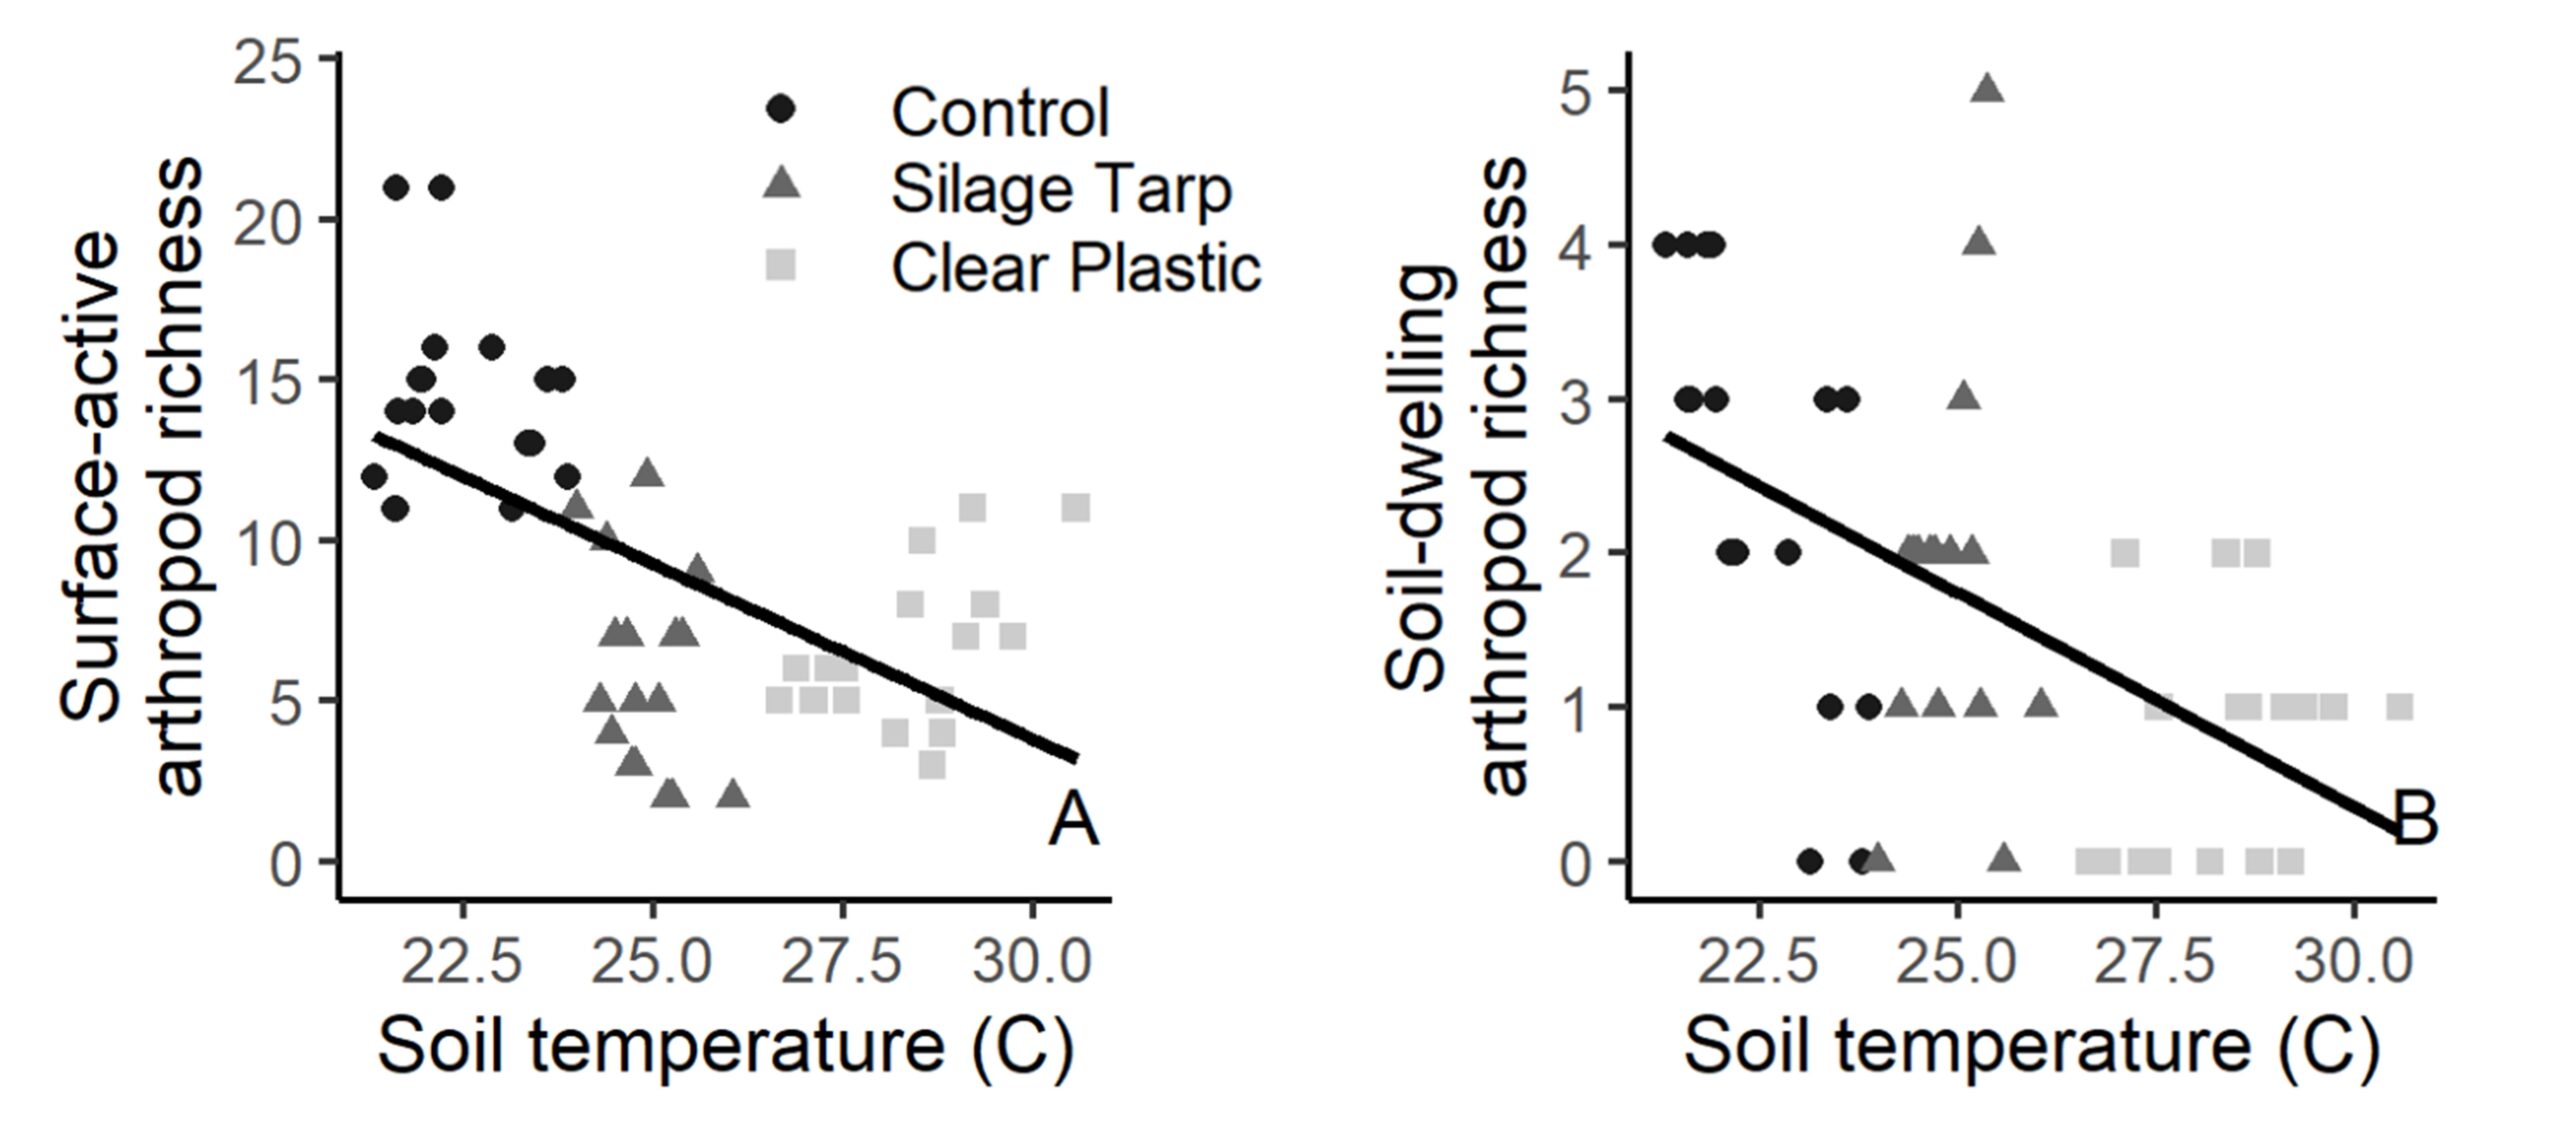
Table 3: Results from models predicting arthropod morphospecies richness with environmental and experimental variables, including variable importance (standardized regression coefficients, totaling 1), F statistics, and P-values. Models were run separately for surface-active and soil-dwelling arthropods and for two sampling periods: when tarps were on the fields (“tarps on”) and 1, 3, and 5 weeks after tarp removal (“tarps off”). Significant variables are bolded.
|
|
Surface-active arthropods |
Soil-dwelling arthropods |
||||
|
|
Richness |
Richness |
||||
|
|
Variable import- ance |
F |
P |
Variable import- ance |
F |
P |
|
Tarps on |
|
|
|
|
|
|
|
Treatment |
0.84 |
7.40 |
0.002 |
0.63 |
7.31 |
0.002 |
|
Farm |
0.05 |
3.06 |
0.057 |
0.03 |
0.14 |
0.874 |
|
Soil moisture |
0.02 |
2.76 |
0.104 |
0.10 |
1.06 |
0.308 |
|
Treatment:Farm |
0.09 |
3.00 |
0.029 |
0.24 |
1.97 |
0.116 |
|
Total model fit (R2) |
76.6% |
43.7% |
||||
|
Tarps off |
|
|
|
|
|
|
|
Treatment |
0.10 |
1.34 |
0.265 |
0.40 |
6.01 |
0.003 |
|
Farm |
0.35 |
6.21 |
0.003 |
0.31 |
6.56 |
0.002 |
|
Sampling |
0.28 |
2.05 |
0.132 |
0.08 |
0.45 |
0.454 |
|
Soil moisture |
0.06 |
0.70 |
0.405 |
0.01 |
0.48 |
0.489 |
|
Weed coverage |
0.09 |
0.57 |
0.452 |
0.11 |
0.01 |
0.918 |
|
Treatment: Sampling |
0.12 |
0.80 |
0.525 |
0.09 |
0.91 |
0.462 |
|
Total model fit (R2) |
20.3% |
22.9% |
||||
We found that tarps had clear impacts on multiple biophysical variables, including soil temperature, soil arthropods, weeds and crops. Many of these impacts relate to benefits for farmers, such as reducing weed coverage and boosting crop yields, and may support their future use. However, other impacts of tarps warrant caution. In particular, the ineffectiveness of clear plastic tarps at suppressing purslane could be problematic for some farms, and indicate that silage tarps are a better option for some farms. In addition, tarps' negative impacts on arthropod communities is concerning, especially for soil-dwelling arthropods, which did not exhibit a full recovery following tarping. Future research is necessary to further test tarps' impacts on arthropod communities, especially with long-term and continuous tarp use. Promoting practices that help conserve arthropod diversity is important because of the multi-faceted benefits arthropods have in the farm ecosystem, including pest control, decomposition, soil structure creation, and nutrient cycling. We hope that this study motivates future research on tarps, increases awareness of arthropod communities in agriculture, and helps contribute to a more sustainable agricultural system.
Education & outreach activities and participation summary
Participation summary:
I have presented this research for a variety of audiences at multiple conferences and meetings. Academic conferences that I presented this research at include the University of Vermont (UVM) Rubenstein School of Environment and Natural Resources' Annual Symposium (October 2021) and the National Congress for Conservation Biology Annual Conference (July 2022). I also presented this work to a mix of researchers and farming professionals at CART: Sustainability Food Systems Transitions (meeting at UVM, July 2019) and the Vermont Veg and Berry Growers Association (January 2022), and to government professionals at the Vermont Agency of Natural Resources (October 2019). As well, because this study was a part of my dissertation, I presented it to academic peers and advisors multiple times, including at my Ph.D. defense.
My collaborators and I wrote two academic manuscripts on this research. Our first manuscript, “Tradeoffs of a rising agroecological practice: addressing uncertainty around tarping with participatory action research and mixed methods” was recently published in Agroecology and Sustainable Food Systems (https://doi.org/10.1080/21683565.2022.2146254). Our second manuscript, “Differing short-term impacts of agricultural tarping on soil-dwelling and surface-active arthropods” is undergoing review at Agriculture, Ecosystems & Environment.
We are also working on publishing a fact sheet for distribution to growers and practitioners, which will be published through UVM Extension. As well, EcoNews (https://www.econewsvt.org/), a online news portal that summarizes ecological research conducted in Vermont, has written an article on our tarping research, which will be published in early 2023.
Project Outcomes
Because of receiving this SARE grant, I was connected to other researchers in the New England area who also work with tarping systems. Specifically, this project gave me the opportunity to collaborate with Sonja Birthisel, Suzanne Ishaq, and Alicyn Smart at the University of Maine and Natalie Lounsbury at the University of New Hamsphire. Our team successfully submitted a proposal to the Northeast IPM Center to fund a working group focused on tarping systems (award received February 2020). This working group met multiple times in 2020 and 2021 and brought together around 20 researchers, farmers, and extension personnel to enhance knowledge, communications, and research on tarping systems in the Northeast.
Another major outcome of this grant was receiving my Ph.D. from the University of Vermont. The third and fourth chapters of my dissertation were derived from this research, and I successfully defended my dissertation in March 2022. My dissertation will be publicly available in March 2024.
Through research and initial communication with farmers, researchers, and extension personnel, I have learned an incredible amount about sustainable agriculture systems in the Northeast. Most notably, I've gained a huge appreciation for the farmers and extension personnel who mix innovation, skill, and their own research to ensure food production for their community, especially as they do this in the midst of changing climates and increasingly aggressive pests and diseases.
This project also gave me a number of skills which I will continue to build upon in my career. For instance, this grant gave me my first opportunity to lead a project from start to finish, including hiring and mentoring research assistants, and manage a budget. I also sharpened my skills in analyzing data and communicating scientific results. The skills I gained in this SARE grant prepared me for my current position as a postdoctoral scholar at Colorado State University, where I continue to work with farmers, study agricultural management and agroecosystems, write grants, and carry out research projects.