Final report for GNE19-210
Project Information
Soil health practices can improve soil conditions and provide ecosystem services, but increased risk of phosphorus (P) loss can be an unintended consequence. We investigated conservation tillage and cover crops effects on soil P stratification, P accumulation at depth, and soil aggregation. Soil cores from ten agricultural fields with 0 to 15 years of conservation tillage or cover cropping were analyzed for Mehlich-3 P, water extractable P, and dry aggregate stability. We found no evidence that conservation tillage or cover cropping caused P stratification or accumulation in fields that were already enriched with P prior to soil health implementation. Annual particulate, dissolved runoff, and leachate P loads from each field was estimated using the NC P Loss Assessment Tool; overall, estimated P loads decreased with soil health practices. We suggest that soil health practices are unlikely to exacerbate P losses from high P soils beyond their initial risk profile.
The goal of this project was to understand how long-term (>5 years) implementation of soil health practices affect the distribution of soil P and hydrologic connectivity in artificially-drained soils on the Delmarva Peninsula. The specific objectives of this project are to:
Objective 1: Compare the vertical distribution of P in soils with and without a long-term history (>5 year) of soil health practices. Accumulation of soil P near the soil surface can increase the risk of dissolved P losses in runoff. In contrast, accumulation of soil P at depth is suggestive of subsurface P losses in leachate. We will investigate soil P stratification within the topsoil and P accumulation at depth at each study field. Soil cores will be collected from several locations in the field and split into 15 depth increments. Soil samples will be analyzed for soil P using a variety of chemical extraction methods to evaluate differences in soil P dynamics through the soil profile in fields with and without a long-term history (>5 year) of soil health management practices.
Objective 2: Determine how soil health practices impact hydrologic connectivity. Hydrologic flow p due to the formation of preferential flow pathways (large connected pathways that connect soil P sources to drainage ditches result in a high risk of P loss. Without this hydrologic connectivity, there is a very low risk of P loss. Soil health management practices can affect hydrologic connectivity). We will determine how soil health practices impact hydrologic connectivity by comparing the dry soil aggregates size distribution in soils with and without a history of soil health practices. Soils with a wider size distribution of soil aggregates suggest the formation of preferential flow pathways through which P can leach.
Objective 3: Use the North Carolina P Loss Assessment Tool (NC-PLAT) to estimated annual particulate, runoff, and leachate P loads from each site under two scenarios assuming no P additions: 1) no-till corn and full season soybean with winter cereal cover crop and 2) conventional tillage corn and soybean with winter fallow.
Excess phosphorus (P) from agricultural lands in sensitive waterways results in eutrophication and hypoxia, leading to lowered water quality (Boesch et al., 2001; Carpenter et al.,1998; Bricker et al., 2008). Phosphorus losses are of great concern on the Delmarva Peninsula due to intensive poultry production (605 million broilers were produced in 2018; Toor and Sims, 2015; Delmarva Poultry Industry, 2019). Historical application of poultry litter at nitrogen (N)-based rates, resulted in an accumulation of soil P to concentrations that exceed crop removal (Patterson et al., 1998; Vadas and Sims, 1998; Vadas and Sims, 1998) and is referred to as legacy P. Losses of legacy P are common on the Delmarva Peninsula from flat, poorly drained, high P soils that are drained by open-ditch networks. During storm events, when hydrologic connectivity between high P soils and drainage ditch increases, legacy P can continuously leach through preferential pathways and move laterally into adjacent open ditches (Sallade and Sims, 1997; Mozaffari and Sims, 1994;Toor and Sims, 2015). While these drainage ditches are needed to lower the high-water table, they also act as conduits for P (and N) to travel rapidly to the Chesapeake Bay (Ritter, 2010). Losses of P through drainage networks on the Delmarva has resulted in water quality degradation and has delayed or stalled watershed mitigation efforts (Shigaki et al., 2008; Kleinman et al., 2011). In addition, drawdown of legacy soil P through crop harvest is estimated to take several decades (Fiorellino et al., 2017). As a result, Delmarva farmers face serious nutrient management issues related to legacy P loss and need strategies to control legacy P loss from soils in the short-term (Sharpley et al., 2013; Qin and Shober, 2018).
One such strategy to address legacy P losses is to promote adoption of soil health practices such as conservation tillage or cover crops. Soil health practices are increasing in popularity on the Delmarva Peninsula as farmers seek to conserve soil and improve soil conditions (fertility, organic matter, infiltration, etc.). Conservation tillage systems allow for better carbon sequestration, erosion prevention, and organic matter retention compared with conventional tillage (Horowitz et al., 2010) while cover crops are useful for preventing erosion, improving water infiltration, and decreasing nitrate leaching (Dumanski et al., 2006; Blanco-Canqui, 2018). Most soil health practices can mitigate sediment-bound P in runoff and dissolved P losses from newly applied manure (Dodd and Sharpley, 2016; Qin and Shober, 2018). On the Delmarva, state agencies and non-government organizations promote cover crops to protect water quality by reducing N losses during the non-growing season.
Although soil health practices provide numerous benefits, conservation tillage and cover crops often increase infiltration and soil aggregation (Dumanski et al., 2006), which can lead to the formation of preferential flow pathways and have been linked to increased concentrations of dissolved P in runoff (Daryanto et al., 2017; Blanco-Canqui, 2018). Subsurface leaching through preferential flow pathways was identified as a major mechanism for legacy P loss on the Delmarva Peninsula, where flat, sandy, poorly drained soils are often artificially-drained through open ditch networks (Kleinman et al., 2007; Vadas et al., 2007). Delmarva farmers may implement soil health practices to improve soil conditions and reduce erosion losses, but these practices may not be effective at controlling subsurface legacy P losses. Adoption of soil health practices may even increase subsurface P losses as documented by some researchers (Kleinman et al, 2009; Christianson et al., 2016). To our knowledge, no studies have investigated how conservation tillage and cover crops impact subsurface P loss on sandy, open ditch-drained soils, like the Delmarva Peninsula. Researchers have documented P stratification, with accumulation of P in the shallow topsoil (Sharpley, 2003) and the formation of preferential flow pathways (Zhao et al., 2001) in long-term no-till soils. When P stratification and preferential flow pathways are present, the risk of subsurface P loss during storms events increases (Sharpley et al., 2001). A better understanding of how soil health practices impact subsurface P loss is needed to help Delmarva farmers better manage soils to improve soil health and meet water quality goals.
In this study, we investigated the impact of long-term (>5 years) conservation tillage and cover crops (winter wheat, crimson clover, hairy vetch) on subsurface legacy P loss on the Delmarva Peninsula from ten agricultural fields with varying years of soil health implementation (0-15+ years) in Sussex County, Delaware, where historical application of poultry litter at nitrogen (N)-based rates resulted in the accumulation of soil P (Toor and Sims, 2015). We present preliminary soil core data from ten study fields that were analyzed for water extractable P (WEP), Mehlich-3 P, modified Hedley sequential chemical fractionation, organic matter (OM), pH and dry aggregate distribution to determine how soil health practices affect the vertical distribution of soil P and hydrologic connectivity in artificially-drained soils on the Delmarva Peninsula. We hypothesized that soils with a long-term history of soil health practices will have more P accumulation at depth, indicating vertical transport, and increased hydrologic connectivity to a wider size distribution of soil aggregates, suggesting the formation of preferential flow pathways. The results from this study will improve our understanding of how soil health practices impact subsurface legacy P loss on the Delmarva Peninsula. This information will help practitioners increase the effectiveness of current and future soil health practices in controlling subsurface P losses.
Research
Site Selection
We selected five pairs of working agricultural fields (10 total) on the Delmarva Peninsula within Sussex County, Delaware. Each paired field had one field with long-term history (>5 years) of soil health practices (i.e., conservation tillage, with or without cover crops) and one field with little to no history of soil health practices. Each pair of fields were no more than 1.7 km away in distance and were managed in a grain crop rotation (e.g., corn, full season soybean or corn, wheat, double-crop soybean).
The Delaware P Site Index (PSI)(Sims et al., 2016) and Maryland Phosphorus Management Tool (PMT)(Coale, 2008) were run on our ten selected agricultural fields. The Delaware PSI and Maryland PMT are field level risk assessment tools that farmers and consultants can use to determine the risk of edge-of-field P losses. These tools identify critical source areas, where P sources (soil P, manure P, or fertilizer P) occur in areas with hydrologic connectivity. The DE PSI and MD PMT require knowledge of past management practices (e.g., fertilizer/manure application method, rate and timing, crop rotation, and soil health practices), as well as information about soil and field characteristics (e.g., slope of field, distance to surface water body, soil test P). This information was obtained from certified crop advisors, grower records, field visits, and the Web Soil Survey.
Fields were sampled prior to spring planting from 23 January 2020 to 24 February 2020. At each study field, seven soil cores were collected in a zigzag pattern around the field using a bucket auger (10.16 cm or 4 in diameter) to a depth of 0.97 m (38 in). Each soil core was divided into 11 depth increments (ranging from 5.1 to 15.2 cm), with smaller increments (5.1 cm) taken near the soil surface and the depth to seasonal high-water table (which was determined prior to sampling using the USDA-NRCS SoilWeb application in Google Earth). Soil cores were air-dried, ground, sieved (2 mm), and bagged prior to analysis.
In addition, subsamples from three of the seven soil cores were collected at each study field along the same depth increments to a depth of 25.4 cm (10 in) to determine the size distribution of dry aggregates (modified Kemper and Rosenau, 1986). Dry aggregate samples were stored in plastic cups to prevent the crushing of soil aggregates.
Lab Analysis
All soil samples (770 samples) were sent to the University of Delaware Soil Testing Lab to undergo a routine soil analysis using standard soil testing procedures (NECC-1312, 2011). The routine soil test consists of pH (1:10 soil/deionized water), organic matter (loss on ignition-LOI), the degree of P saturation, and a Mehlich 3 extraction. Following a Mehlich 3 extraction, soil test P, calcium (Ca), magnesium (Mg), manganese (Mn), zinc (Zn), copper (Cu), iron (Fe), boron (B), sulfur (S), sodium (Na), and aluminum (Al) concentrations will be analyzed by inductively coupled plasma optical emission spectroscopy (ICP-OES). Currently, soil samples from six out of the 10 fields have been analyzed for a routine soil analysis. The remaining four fields' samples will be analyzed within the next two months.
In order to investigate P stratification and P accumulation at depth, soil subsamples four depth increments (0 - 5.1 cm, 5.2 - 10.2 cm, 5.1 cm above the seasonal high-water table to the water table, and the water table to 5.1 cm below the water table) from two cores from each field were extracted (80 samples total)(Self-Davis, 2009). The filtrate was then analyzed for water extractable P (WEP; Murphy and Riley, 1962) by a spectrophotometer (GENESYS™ 30 Visible Spectrophotometer). These 80 soil subsamples also underwent a modified Hedley sequential chemical fractionation (Sui et al., 1999) to determine the operational soil P pools. The modified Hedley sequential chemical fractionation consists of sequentially extracting 0.5 g of each soil sample with a) 30 mL of DI water (water extractable P), b) 30 mL of 0.5 M NaHCO3 (labile P), c) 30 mL 0.1 M NaOH (moderately labile P), and d) 30 mL 0.1 M HCl (readily insoluble P). The extracts generated during each step of the fractionation procedure were analyzed for P, Ca, Mg, Mn, Zn, Cu, Fe, B, S, Na and Al by ICP-OES at University of Delaware Soil Testing Lab.
Lastly, soil samples for dry aggregate distribution were air-dried and transferred from the storage cup to a Ro-Tap Sieve Shaker (W.S. Tyler Ro-TAP Sieve Shaker RX-29) for sieving into various size fractions (sieve no. 4, 8, 16, 30, 50, 100, 200). Dried soils were shaken for 5 minutes on the Ro-TAP and then the aggregates in each sieve were weighed on a balance.
Data Analysis
Study fields were named based on the dominant soil series present in each field. Soil field IDs, management history, PSI ratings, and routine soil data were listed in a table by depth. Note, the depths in the table are continuous from 0-46 cm and jump to the deepest soil depth.
As differences in Mehlich-3 P, WEP, modified Hedley sequential chemical fractionation, and dry aggregate distribution data between paired fields was very minimal, we decided to view fields as a spectrum of soil health implementation ranging from zero (fields with conventional tillage) to 15 years of soil health practices. To minimize the difference of soil texture between study field, we grouped fields with a Pepperbox-Rosedale soil series for dry aggregate distribution.
Water extractable P and Mehlich-3 P data were averaged at each divided core depth and were plotted as scatter plots. Extraction results of the modified Hedley sequential chemical fractionation were plotted using the percent of total and sum of fractions methods to visually see the differences in operational soil P pools between soil health fields and control fields. Dry aggregate distribution retention fractions were plotted as grouped bar graphs. All figures were created in SigmaPlot 10.0.
Statistical Analysis
We ran a Kruskal–Wallis analysis (p ≤ 0.05) followed by Dunn’s multiple comparison post hoc test to compared dry aggregates distribution. In addition, we ran a Wilcoxon signed-rank test in SAS to compare P loads between scenarios estimated in NC-PLAT because the data did not meet normality assumptions for the use of parametric tests.
Compare the vertical distribution of P in soils with and without a long-term history (>5 year) of soil health practices.
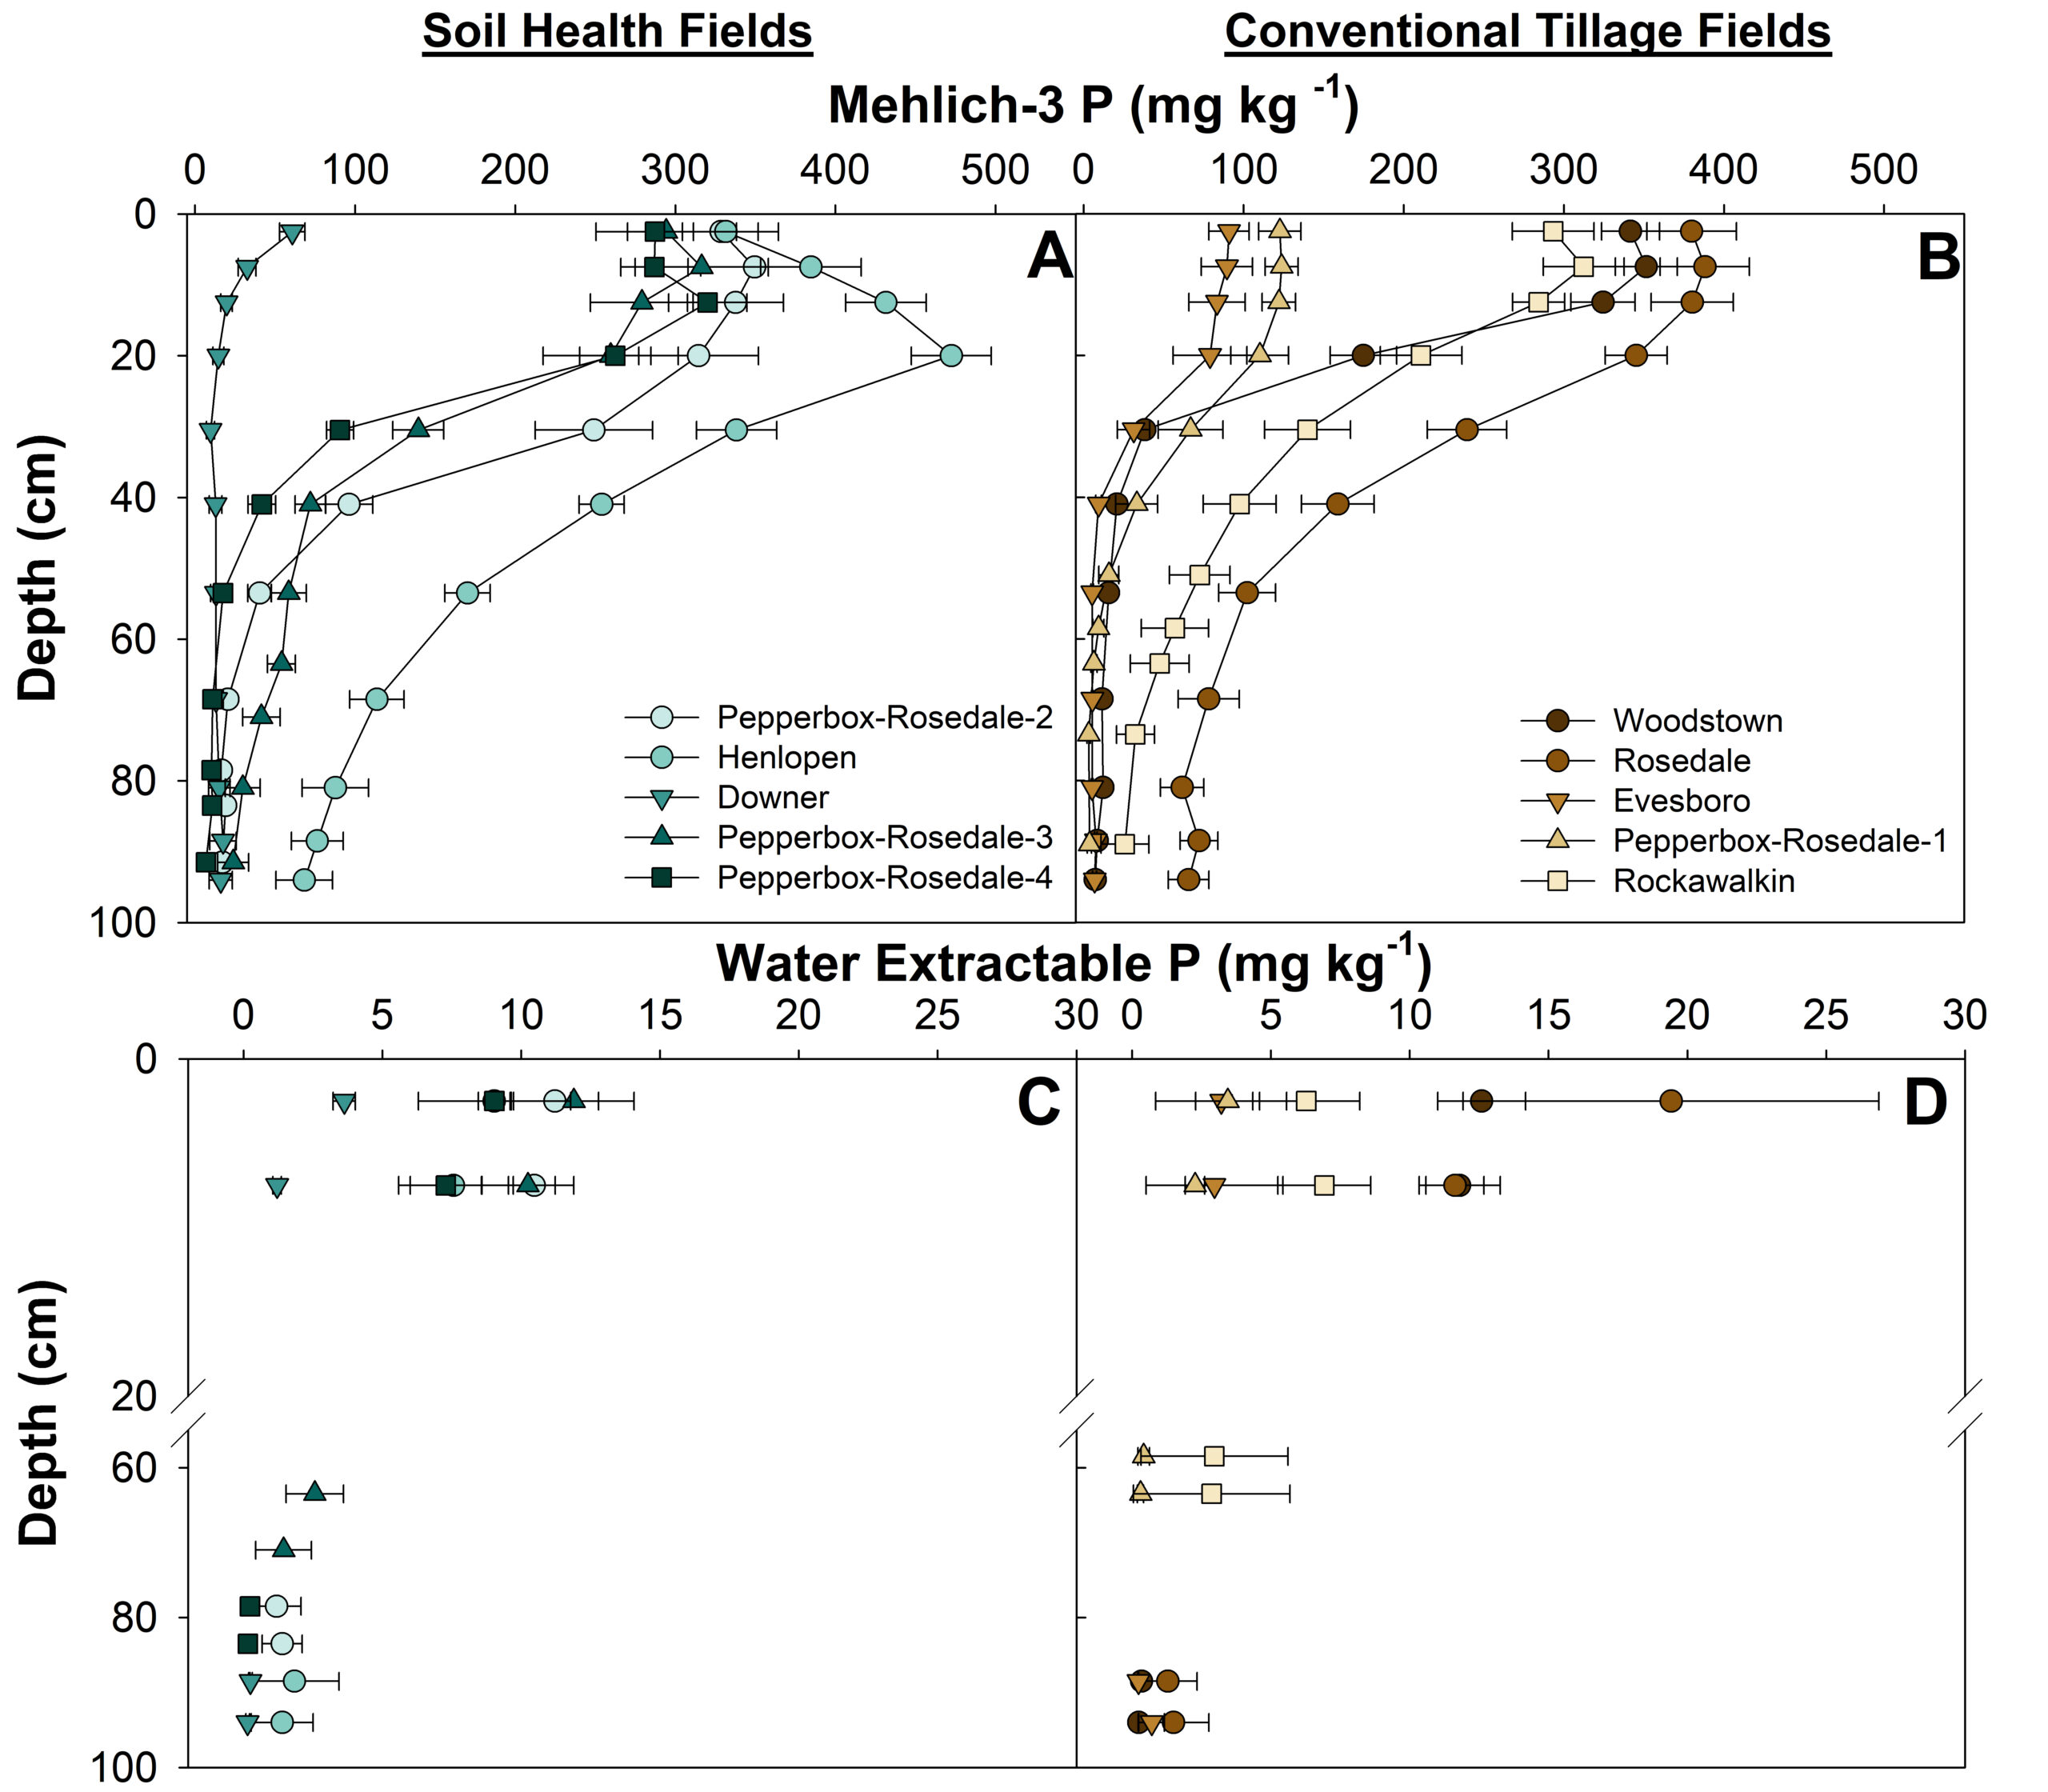
Without the incorporation of manure for conservation or no-till practices, we would expect to see high soil P concentrations stratified in the topsoil (Kingery et al., 1994; Sharpley, 2003) as little to no mixing of P within the plow layer occurred. However, field WEP and Mehlich-3 soil P concentrations show no difference in soil P distribution between the conventional tillage and soil health fields.
The surface (0-5 cm) WEP concentrations in each field ranged from 3.21 to 19.41 mg kg-1 from with a mean of 8.97 mg kg-1. From six to 10 cm, the field WEP ranged from 1.21 to 11.80 mg kg-1 with a mean of 7.23 mg kg-1 (Figure 1a). Six out of ten fields pose a high risk of WEP leaching with surface (0-10 cm) WEP concentrations above the environmental threshold of 8.6 mg kg-1 (Maguire and Sims, 2002). Above and below the water table, which varied by field, WEP concentrations ranged from 0.23 to 2.97 mg kg-1 and 0.15 to 2.87 mg kg-1 with means of 1.13 mg kg-1 and 1.01 mg kg-1, respectively. There is no evidence suggesting a difference in WEP concentrations between conventional tillage and soil health fields.
The study fields fell into three categories of surface Mehlich-3 P concentrations; each category with a different Mehlich-3 soil P distribution pattern within the soil profile. The highest Mehlich-3 P concentration category included seven fields (four soil health and three conventional tillage fields). The average surface concentrations (0-15 cm) within these fields ranged from 296.7 to 382.7 mg kg-1 with a mean of 333.5 mg kg-1 (Table 1, Figure 1b). The PSR values for these field ranged 64.3 to 106.0 with a mean of 93.1 and have a very high risk of P loss from erosion, runoff, and leaching (Sims et al., 2002; Sims and Gartley, 2001). Mehlich-3 P concentrations peaked from 7.5 to 12.5 cm followed by a steep decrease in Mehlich-3 P concentrations below the plow layer. Henlopen, the field with the highest surface Mehlich-3 P concentrations and over 5 years of conservation tillage and cover crops, had an increase in Mehlich-3 P concentrations from 331.6 mg kg-1 at 2.5 cm to a peak of 472.39 mg kg-1 at 20 cm before a decrease in Mehlich-3 P below the plow layer.
The medium Mehlich-3 P category included Pepperbox-Rosedale-1 and Evesboro, both conventional tillage fields. Mehlich-3 P concentrations for the Pepperbox-Rosedale-1 field remained relatively constant (122.68 to 123.71 mg kg-1) from 0 to 12.5 cm before a decrease in concentration at greater depths. Evesboro had a highest Mehlich-3 P concentration at the surface depth and gradually decreased until 20 cm followed by a steeper decrease in concentration (Table 1, Figure 1b).
Downer had the lowest surface Mehlich-3 P concentrations (mean of 37.7 mg kg-1) and Mehlich-3 concentrations peak (61.5 mg kg-1) at 2.5 cm followed by a steep decrease in Mehlich-3 P, suggesting that long-term soil health implementation does cause stratification of P within the topsoil. We expected to see stratification in all soil health fields, especially Pepperbox-Rosedale-4 with over 15 years of no-till; however, only Downer shows P stratification. We propose this is likely due to all the study fields, except for Downer, experiencing high Mehlich-3 P concentrations and P saturation (Table 1, Figure 1a & b), which masks the stratification of P in the topsoil due to P leaching down through the soil profile. More data is needed to support this claim but there is evidence that stratification of P does occur and can only be visible in fields with soil test P below the critical soil test level like the Downer field. In addition, more years of soil health implementation may be needed to see soil health impacts on soil P stratification.
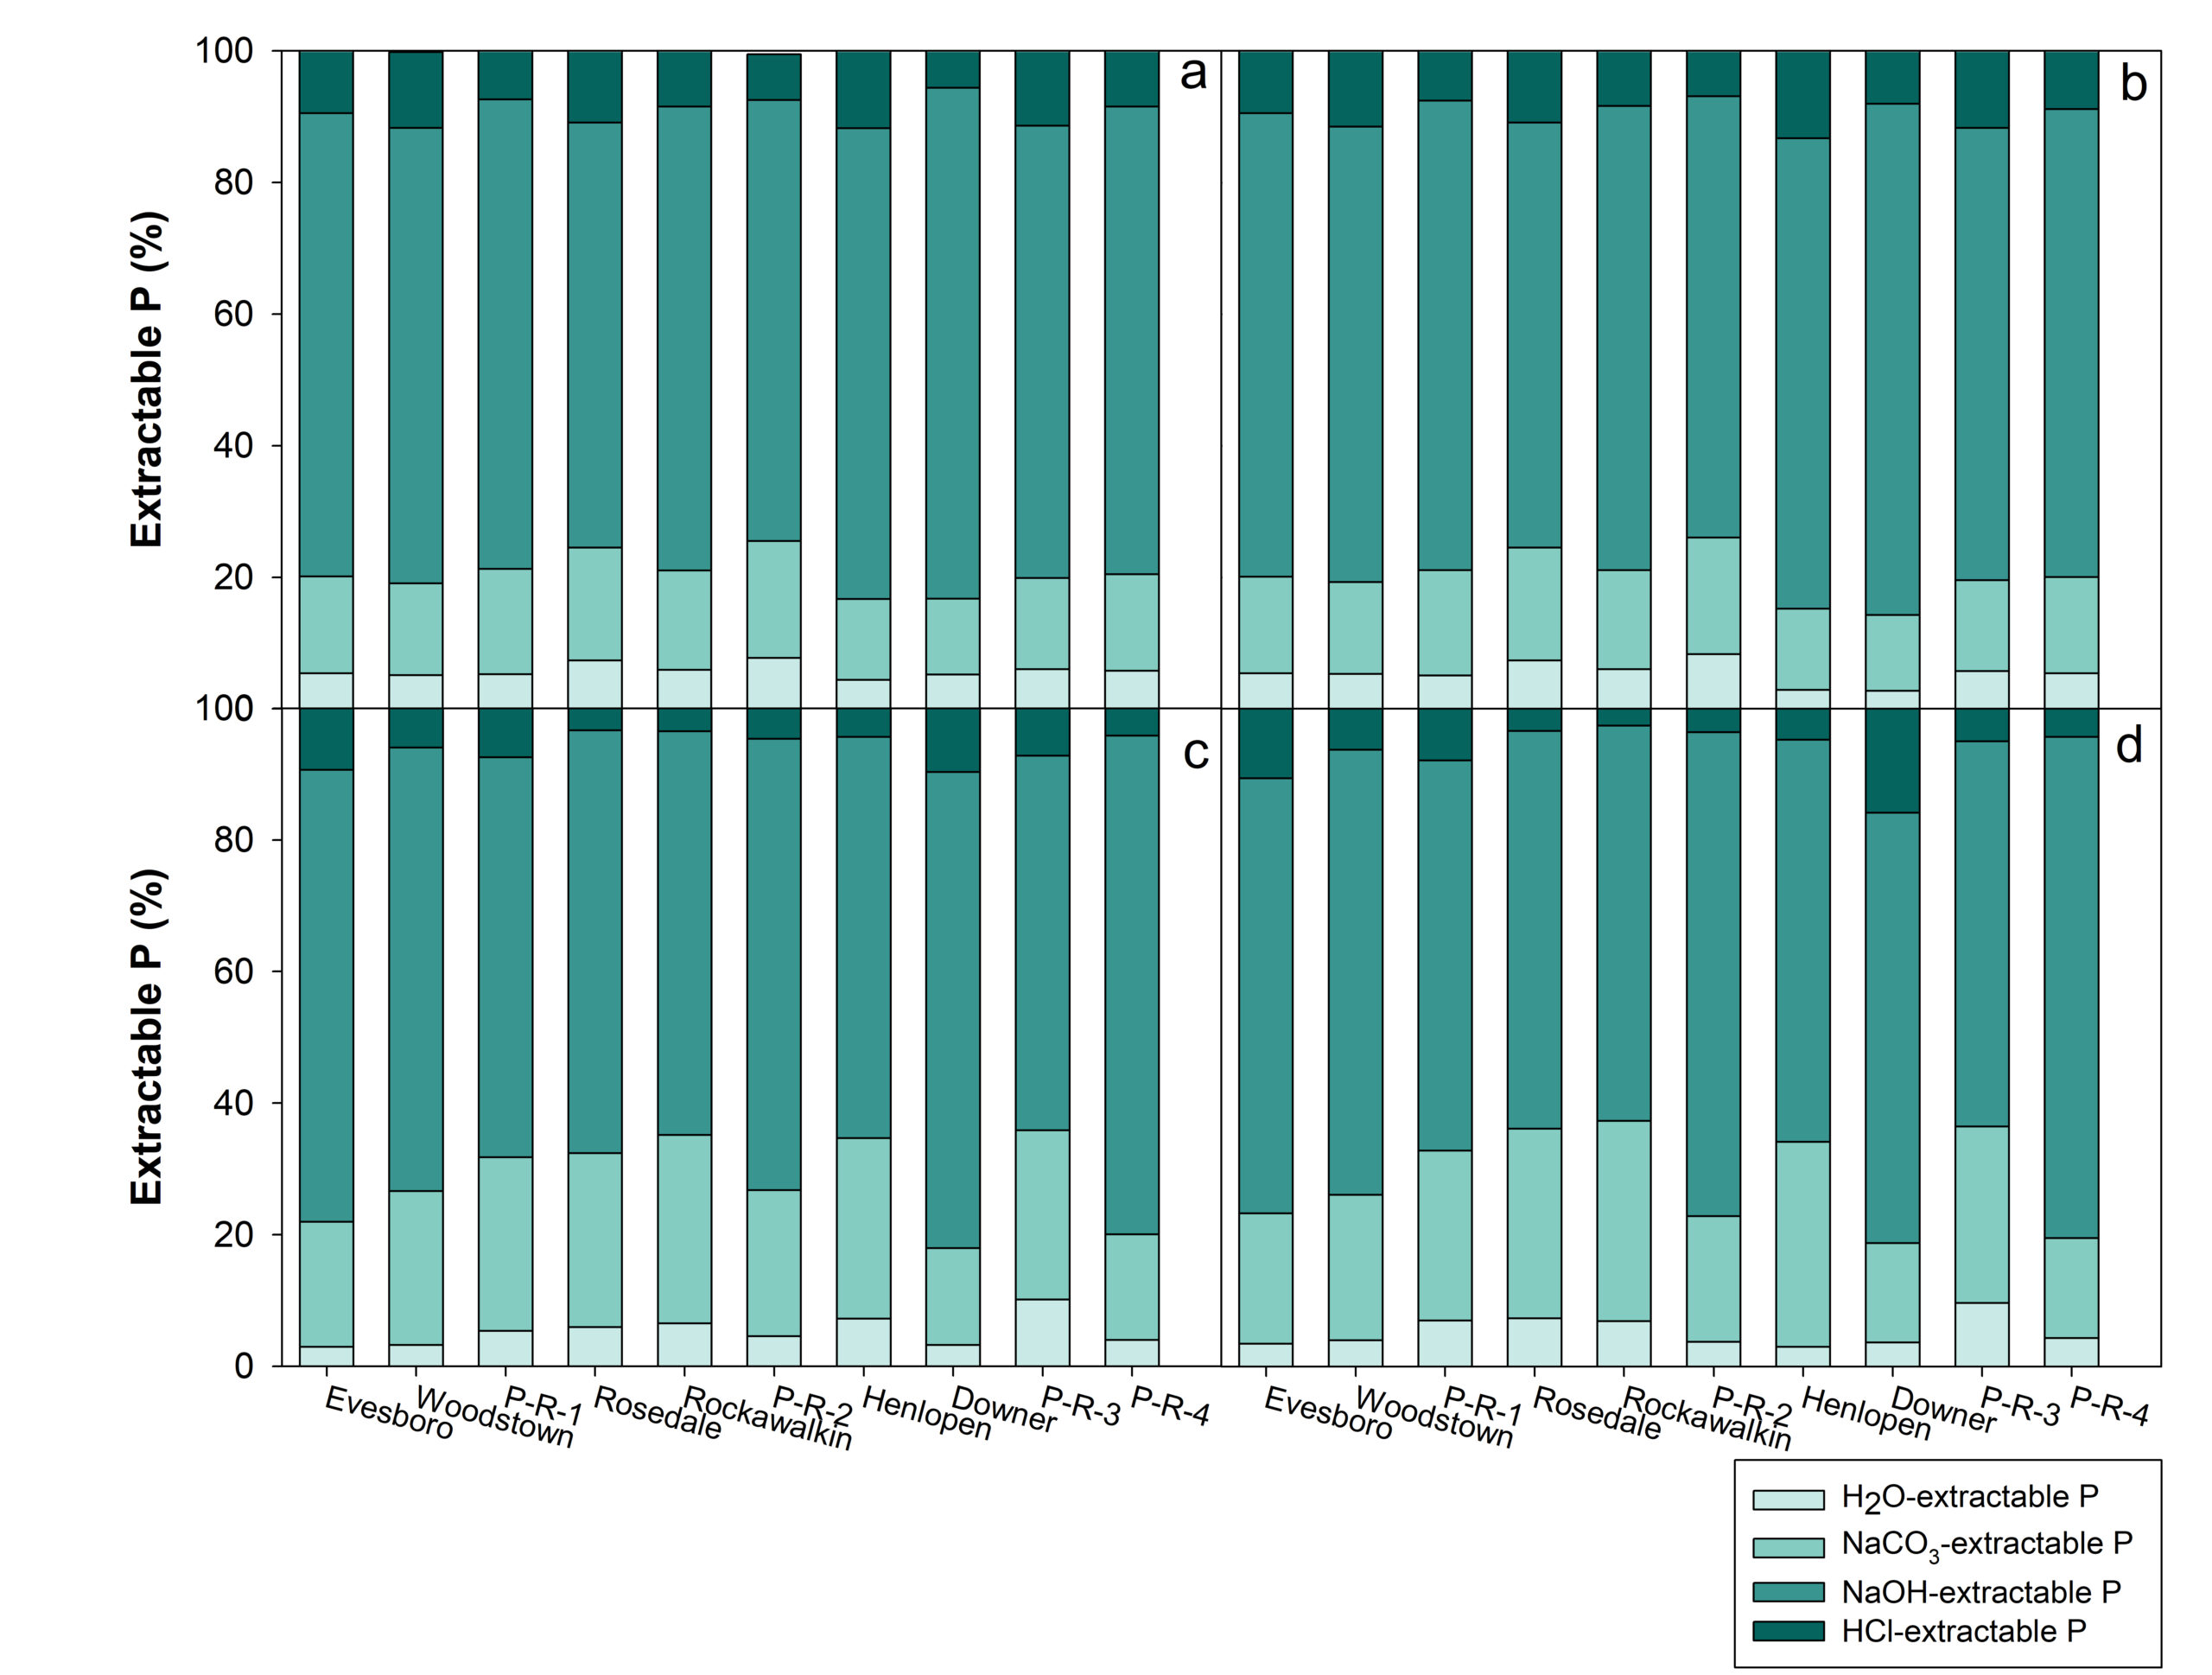
NaHCO3, NaOH, and HCl for all ten study fields from 0-5 cm. b) 6-10 cm c) Above the water table (varied by field) d) Below the water table (varied by field). Fields are ordered from conventional tillage to varying degrees of soil health implementation.
We are in the process of running a Kruskal-Wallis and a Dunn’s post hoc test to compare the operational soil P pools at each depth between fields of varying soil health implementation lengths.
Determine how soil health practices impact hydrologic connectivity.
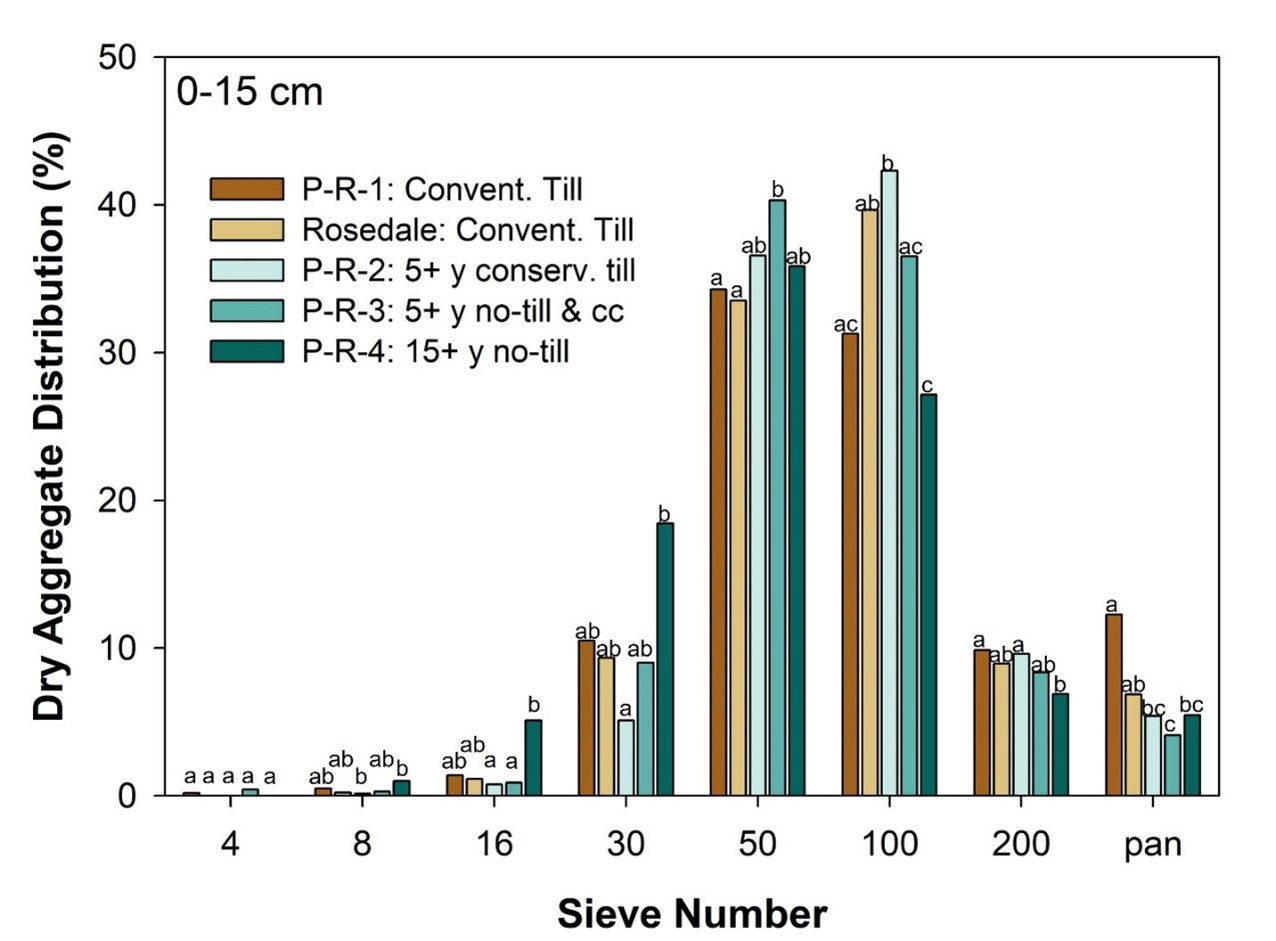
To tease out differences in dry aggregate distribution from soil health practices, and not from other factors like differences in soil texture from various soil series, we focused on comparing fields of varying soil health implementation from the Pepperbox-Rosedale soil series. Although not significantly different, Pepperbox-Rosedale-4 had a larger dry aggregate distribution retention in the sieve sizes 8, 16, and 30 compared to the other soils, suggesting that larger dry aggregates form after 15+ years of no-till and cover crops. Fields with a larger dry aggregate distribution may have increased for subsurface P loss.
NC-PLAT Estimated Phosphorus Loads
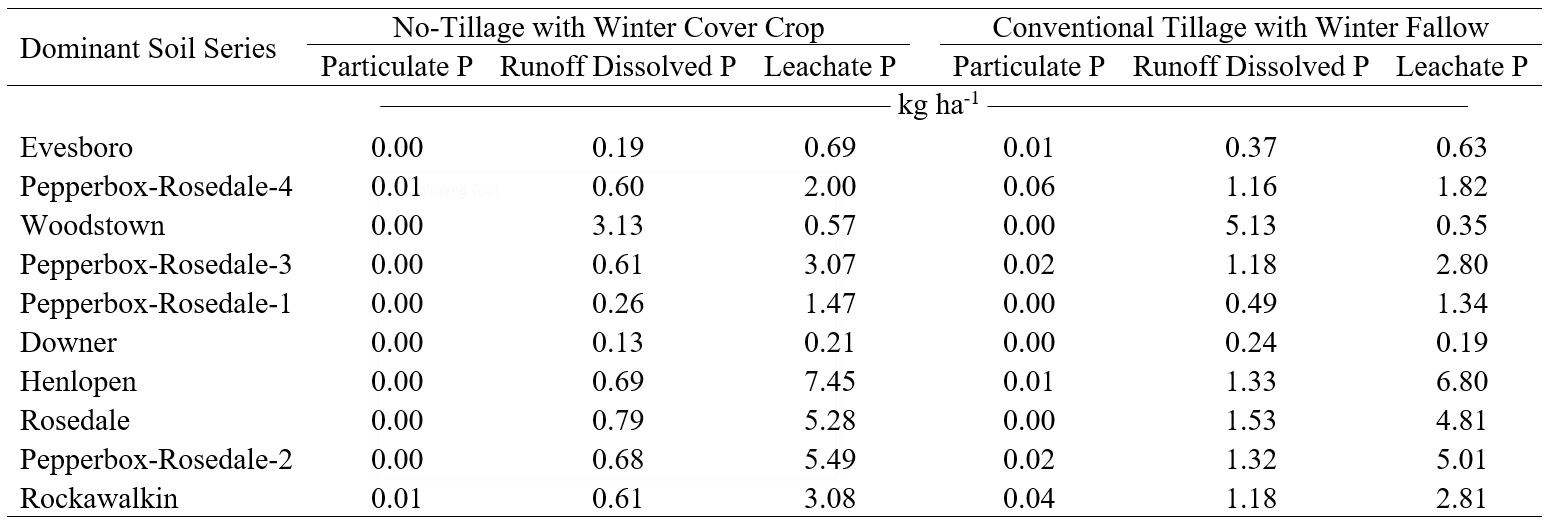
Annual NC-PLAT estimated particulate P, runoff DP, and leachate P loads under scenario 1 (cover crops and no-till) were significantly different (P = 0.002 for all three P sources) from scenario 2 (conventional tillage; Table 1). The NC-PLAT estimated annual particulate P and runoff DP loads decreased on an average of 0.02 and 0.63 kg ha-1, respectively, under no-till and cover crops (vs. winter fallow and conventional tillage). Conversely, annual leachate P loads were 0.28 kg ha-1 higher with cover crops and no-tillage than conventional tillage and no cover crops (Table 1); however, this tradeoff was minimal as NC-PLAT load estimates showed reduced runoff DP loads with soil health practices. Assuming NC-PLAT accurately estimates P loss potential from our fields, implementing soil health practices at our P-enriched field sites should not increase total P loads; instead, may slightly decrease total P loads. Yet, data from more fields is needed to determine if the potential for increased leachate P loads would offset a decrease in particulate and runoff DP loads from P-enriched fields with soil health practices.
We posit that the lack of clear evidence for surface P stratification, P accumulation with depth, and soil aggregate stability in our study was due to significant enrichment of soil P due to historical applications of manure prior to the implementation of soil health practices. As such, we see no evidence that adding soil health practices significantly increased the risk for dissolved soil P losses (surface and subsurface) in most of our study fields because the soils themselves were already considered a potential source of DP. If anything, adopting conservation tillage or planting cover crops likely reduces runoff DP losses from P-enriched soils when compared to conventional tillage and winter fallow. As with other researchers, evidence of surface P stratification at the site with “optimum” soil test P concentrations continues to support the notion that soil health practices can cause P tradeoffs under certain conditions (i.e., when the risk of P loss from surface soils was “low” at the time of soil health practice adoption). Yet, our results reflect a very small dataset consisting of primarily coarse-textured, high P soils from flat landscapes. Future studies should focus on sampling from fields with a variety of textures and soil test P concentrations across various landscape positions and cropping systems to better quantify the potential for changes in P loss risk under soil health management.
Education & outreach activities and participation summary
Participation summary:
We presented our results at the ASA-SSSA-CSSA 2022 Annual Meeting. We have plans to present our results in several University of Delaware Extension workshops, field days, and factsheets.
Project Outcomes
Results from this project have been submitted to Agricultural & Environmental Letters Journal. Our manuscript is currently in review.
This project helped me recognize that soil health practices can cause P tradeoffs under certain conditions. We plan to continue investigating soil health implementation on fields enriched with P on the Delmarva Peninsula to help guide nutrient management applications.