Final report for GNE19-212
Project Information
The purpose of this project was to understand factors affecting consumer acceptance and preference for baby leafy greens grown via vertical farming in a controlled indoor environment to guide selection of plant varieties. The ability to predict the type of greens desired by specific consumer groups is especially beneficial for indoor farmers, since they can consistently and reliably alter the environment in which their products are grown.
Study I. In-lab Sensory Research: Participants (n=73) evaluated six varieties of baby greens grown with CEA and rated their liking of the sensory characteristics of each sample. We also measured personality traits and genetically-linked sensitivity to bitter taste. Agglomerative Hierarchical Clustering was used to segment consumers based on overall liking of the samples. Study II. Online Survey: To understand purchasing behavior with respect to appearance and flavor, an online survey (n=397) was conducted using choice-based conjoint analysis (CBC), which included characteristics of color, leaf texture, and sensory flavor descriptions. Demographic questions and a survey of bitter food liking were completed. Consumers were segmented using k-means clustering analysis based on differences in the relative importance of each sensory characteristic.
In both studies, traditional (i.e. lettuce-type) greens were well-liked by most consumers, and those who find flavor to be very important tend to prefer these varieties. However, there exist many different consumer segments with different preferences for baby greens. To satisfy these groups, growers should consider a multi-sensory approach to decide which cultivars to bring to market. The results from this project will provide much needed information to growers of baby leafy greens regarding crop selection for potential consumer groups. Economic sustainability is critical for the long-term success of any farm, and it is particularly important for indoor agri-businesses due to the financial cost of the technology needed. The results from this project have been disseminated through various presentations to the agricultural and food industries, and plans for publication are underway. The impact of this project has lead to new grant funding within our group focused on optimizing sustainable organic indoor farms.
The overall goal of this project was to develop a comprehensive approach to model consumer acceptance and purchase intent of different varieties of baby leafy greens in order to identify consumer segments that differ in their expectations and preferences for baby leafy greens. This knowledge will help growers to better understand their consumers and assist them in selecting what varieties to grow. The strategies developed in this research can be translated and used in a variety of agriculture settings, including indoor farming. This project consisted of two studies: a central location test, where consumers tasted six varieties of baby greens (Study I), and an online study to assess consumer choice based on visual characteristics and taste descriptors (Study II).
Consumer behavior is complex; researchers have attempted to understand the links between consumer acceptance of leafy greens and personality characteristics with limited success. Previous studies have generally examined only one or two domains of consumer behavior in isolation to predict choice and acceptance. In our work, we utilize a more comprehensive approach to model liking.
The objectives of Study I were:
- To understand consumer liking across a broad range of baby leafy green varieties.
- To assess the role of personal characteristics including food adventurousness, variety seeking and bitter taste sensitivity in consumer acceptance.
- To identify consumer segments based on differences in liking and purchase intent of the selected varieties.
Due to the ongoing COVID-19 pandemic, our original second planned study of a large community-based consumer test was re-imagined into an online consumer test.
The objectives of Study II were:
- To determine the relative importance of written flavor descriptions and visual appearance (color and texture) on purchase intent of baby leafy green ready-to-eat salad mixtures.
- To identify consumer segments based on the a) the importance of the aforementioned sensory attributes and b) the specific colors, textures, and flavors associated with each sensory attribute.
The purpose of this project is to understand factors affecting consumer acceptance and preference for baby leafy greens grown via vertical farming in a controlled indoor environment to guide selection of plant varieties.
Interest in controlled environment agriculture (CEA) is growing rapidly due to concerns about feeding a growing global population. CEA methods such as aeroponics are highly sustainable, using up to 95% less water than traditional farming, and are ideal for growing in the urban or peri-urban settings that can be found throughout the Northeast region of the United States.
The current high demand for value-added specialty crops that are sustainable, pesticide-free, and locally-sourced has attracted the attention of both entrepreneurs and investors. As a relatively young technology, there are many unanswered questions about vertical farming, such as processing conditions, efficient supply chain management, and consumer acceptance of the final product.
The question of consumer demand for leafy greens is not easily answered. The primary reason why a consumer will accept or reject a food is because of its taste. Bitter or sulfurous tastes in leafy greens and other vegetables can be off-putting to many people. However, many of these bitter compounds have nutritional or other health-promoting benefits, which is also of interest to the consumer. Individual differences in perception and preference for bitterness increase the need for variety in the marketplace. The ability to predict the type of greens desired by specific consumer groups is especially beneficial for CEA farmers, since they can consistently and reliably alter the environment in which their products are grown.
Peer-reviewed and publicly available research on the market potential and consumer acceptance of leafy greens produced through vertical farming is not available. Studies on consumption habits for bitter vegetables focus on demographic factors, whereas others emphasize taste or inherent personality characteristics. No studies have simultaneously examined all three of these domains in the same investigation to obtain a more comprehensive and holistic view of consumer acceptance of baby greens.
Taste and flavor are typically considered to be the most important sensory characteristics that influence overall liking, followed by texture and appearance. Both texture and color are important to liking and consumption of leafy greens, and salad mixtures with high color contrasts are considered to be healthier than those which are one color. Color is known to influence perceived flavor quality and intensity of many foods; however it is unknown to the extent this applies to leafy vegetables in the context of selection at the time of purchase. Additionally, differences alone may lead to rejection of leafy greens, particularly in kale. However, the effects of visual texture on liking are not clear. The relative importance of color, perception of texture visually, and flavor description in an online setting is not known.
To accomplish this research, we partnered with AeroFarms, a leader in aeroponic farming technology, whose world headquarters is located in urban Newark, NJ. We recently conducted a collaborative project with AeroFarms funded by a grant from the Foundation for Food and Agricultural Research (FFAR). Preliminary data from that project informed the consumer taste acceptance study in this project. The knowledge generated in this project will inform and guide the planting programs and variety selections of a range of growers, including those using CEA.
Cooperators
- (Researcher)
- (Researcher)
Research
All research activities were approved by Rutgers University Institutional Review Board (Protocol#2019001829).
1.0. Study 1: Consumer Taste Research
1.1. Plant Material
Six varieties of baby greens were selected for study which represented three distinct flavor classes identified in previous research from our group (O'Brien, Simon, & Tepper, 2021). Samples included two varieties representing ‘spicy-pungent’ (Arugula and Mustard Green), two representing ‘earthy-astringent’ (Green Kale and Red Kale), and two representing ‘sweet-grassy’ (Pac Choi and Red Romaine). Varietal information is listed in Table 1.
|
Table 1. Baby leaf varieties used in Central Location Test with consumer taste panel (n=73). |
||
|
Sample |
Classification |
Grower |
|
Arugula |
Eruca sativa |
AeroFarms, Newark, NJ |
|
Ruby Streaks |
Brassica juncea |
|
|
Green Kale |
Brassica oleracea |
|
|
Red Kale |
Brassica oleracea |
|
|
Pac Choi |
Brassica rapa |
|
|
Red Romaine |
Lactuca sativa |
|
All leaf samples were grown in a large-scale controlled aeroponic system (AeroFarms, Newark, NJ). Four of the six samples (Arugula, Green Kale, Red Kale, and Red Romaine) were screened via descriptive analysis in a prior study (O'Brien et al., 2021). Leaves were harvested two days prior to testing, sealed in plastic bags, and shipped via refrigerated courier to Rutgers University Department of Food Science (New Brunswick, NJ). Samples were stored in plastic bags and refrigerated at 4°C until the time of testing. All leaves were free from damage and deterioration. During testing, approximately 5g of leaf sample (7-8 leaves) were portioned and placed into 3oz paper bowls labeled with three-digit blinding codes.
1.2. Questionnaires
1.2.1. Liking Questionnaire
To assess consumer liking, participants rated their overall liking and liking of aroma, flavor, and texture on hedonic scales (1=Like extremely to 7=Dislike extremely). Check-All-That-Apply (CATA) questions were included for liking and disliking of color, taste, flavor, and mouthfeel attributes (sweetness, bitterness, spiciness, moisture, drying).
1.2.2. Personality Questionnaires
To assess behavior and attitudes, consumers completed the following questionnaires: the Three-Factor Eating Questionnaire (TFEQ-R18), which assesses three measures of dietary behavior including cognitive restraint, emotional eating, and uncontrolled eating (Karlsson, Persson, Sjöström, & Sullivan, 2000; Stunkard & Messick, 1985), the Variety Seeking questionnaire (VARSEEK), which measures consumers’ variety seeking tendency with respect to food, (Van Trijp & Steenkamp, 1992), a question regarding food adventurousness (Scott, Burgess, & Tepper, 2019; Ullrich et al., 2004), which measures willingness to try new foods, and a general demographic survey.
1.3. PROP Testing
Participants were tested for their sensitivity to 6-n-propylthiouracil (PROP) using the filter paper screening method described in Zhao et al. (2003), and classified as non-tasters, medium-tasters, or super-tasters. In this method, participants tasted two filter paper disks impregnated with NaCl and PROP, at 1.0 mol/l and 50mmol/l, respectively. Participants rated the intensity of the taste on a Labeled Magnitude Scale. PROP intensity rating cutoffs were ≤15mm for non-tasters and ≥67mm for super-tasters. NaCl ratings were used to clarify group classifications.
1.4. Participants
A total of 73 consumers (n = 54 Female) were recruited from email distribution lists within Rutgers University and the surrounding area. Eligible participants were over 18 years old, in good health, consumed leafy greens at least monthly, and were able to attend two evaluation sessions.
1.5. Data Collection
All evaluations were completed in the Sensory Evaluation Laboratory at Rutgers University (New Brunswick, NJ) in individual testing booths under ambient conditions. All data were collected using RedJade® sensory collection software (Curion, Redwood City, CA). Participants completed two sessions: Session 1 included taste evaluations, and Session 2 included demographic questionnaires and testing PROP taste sensitivity.
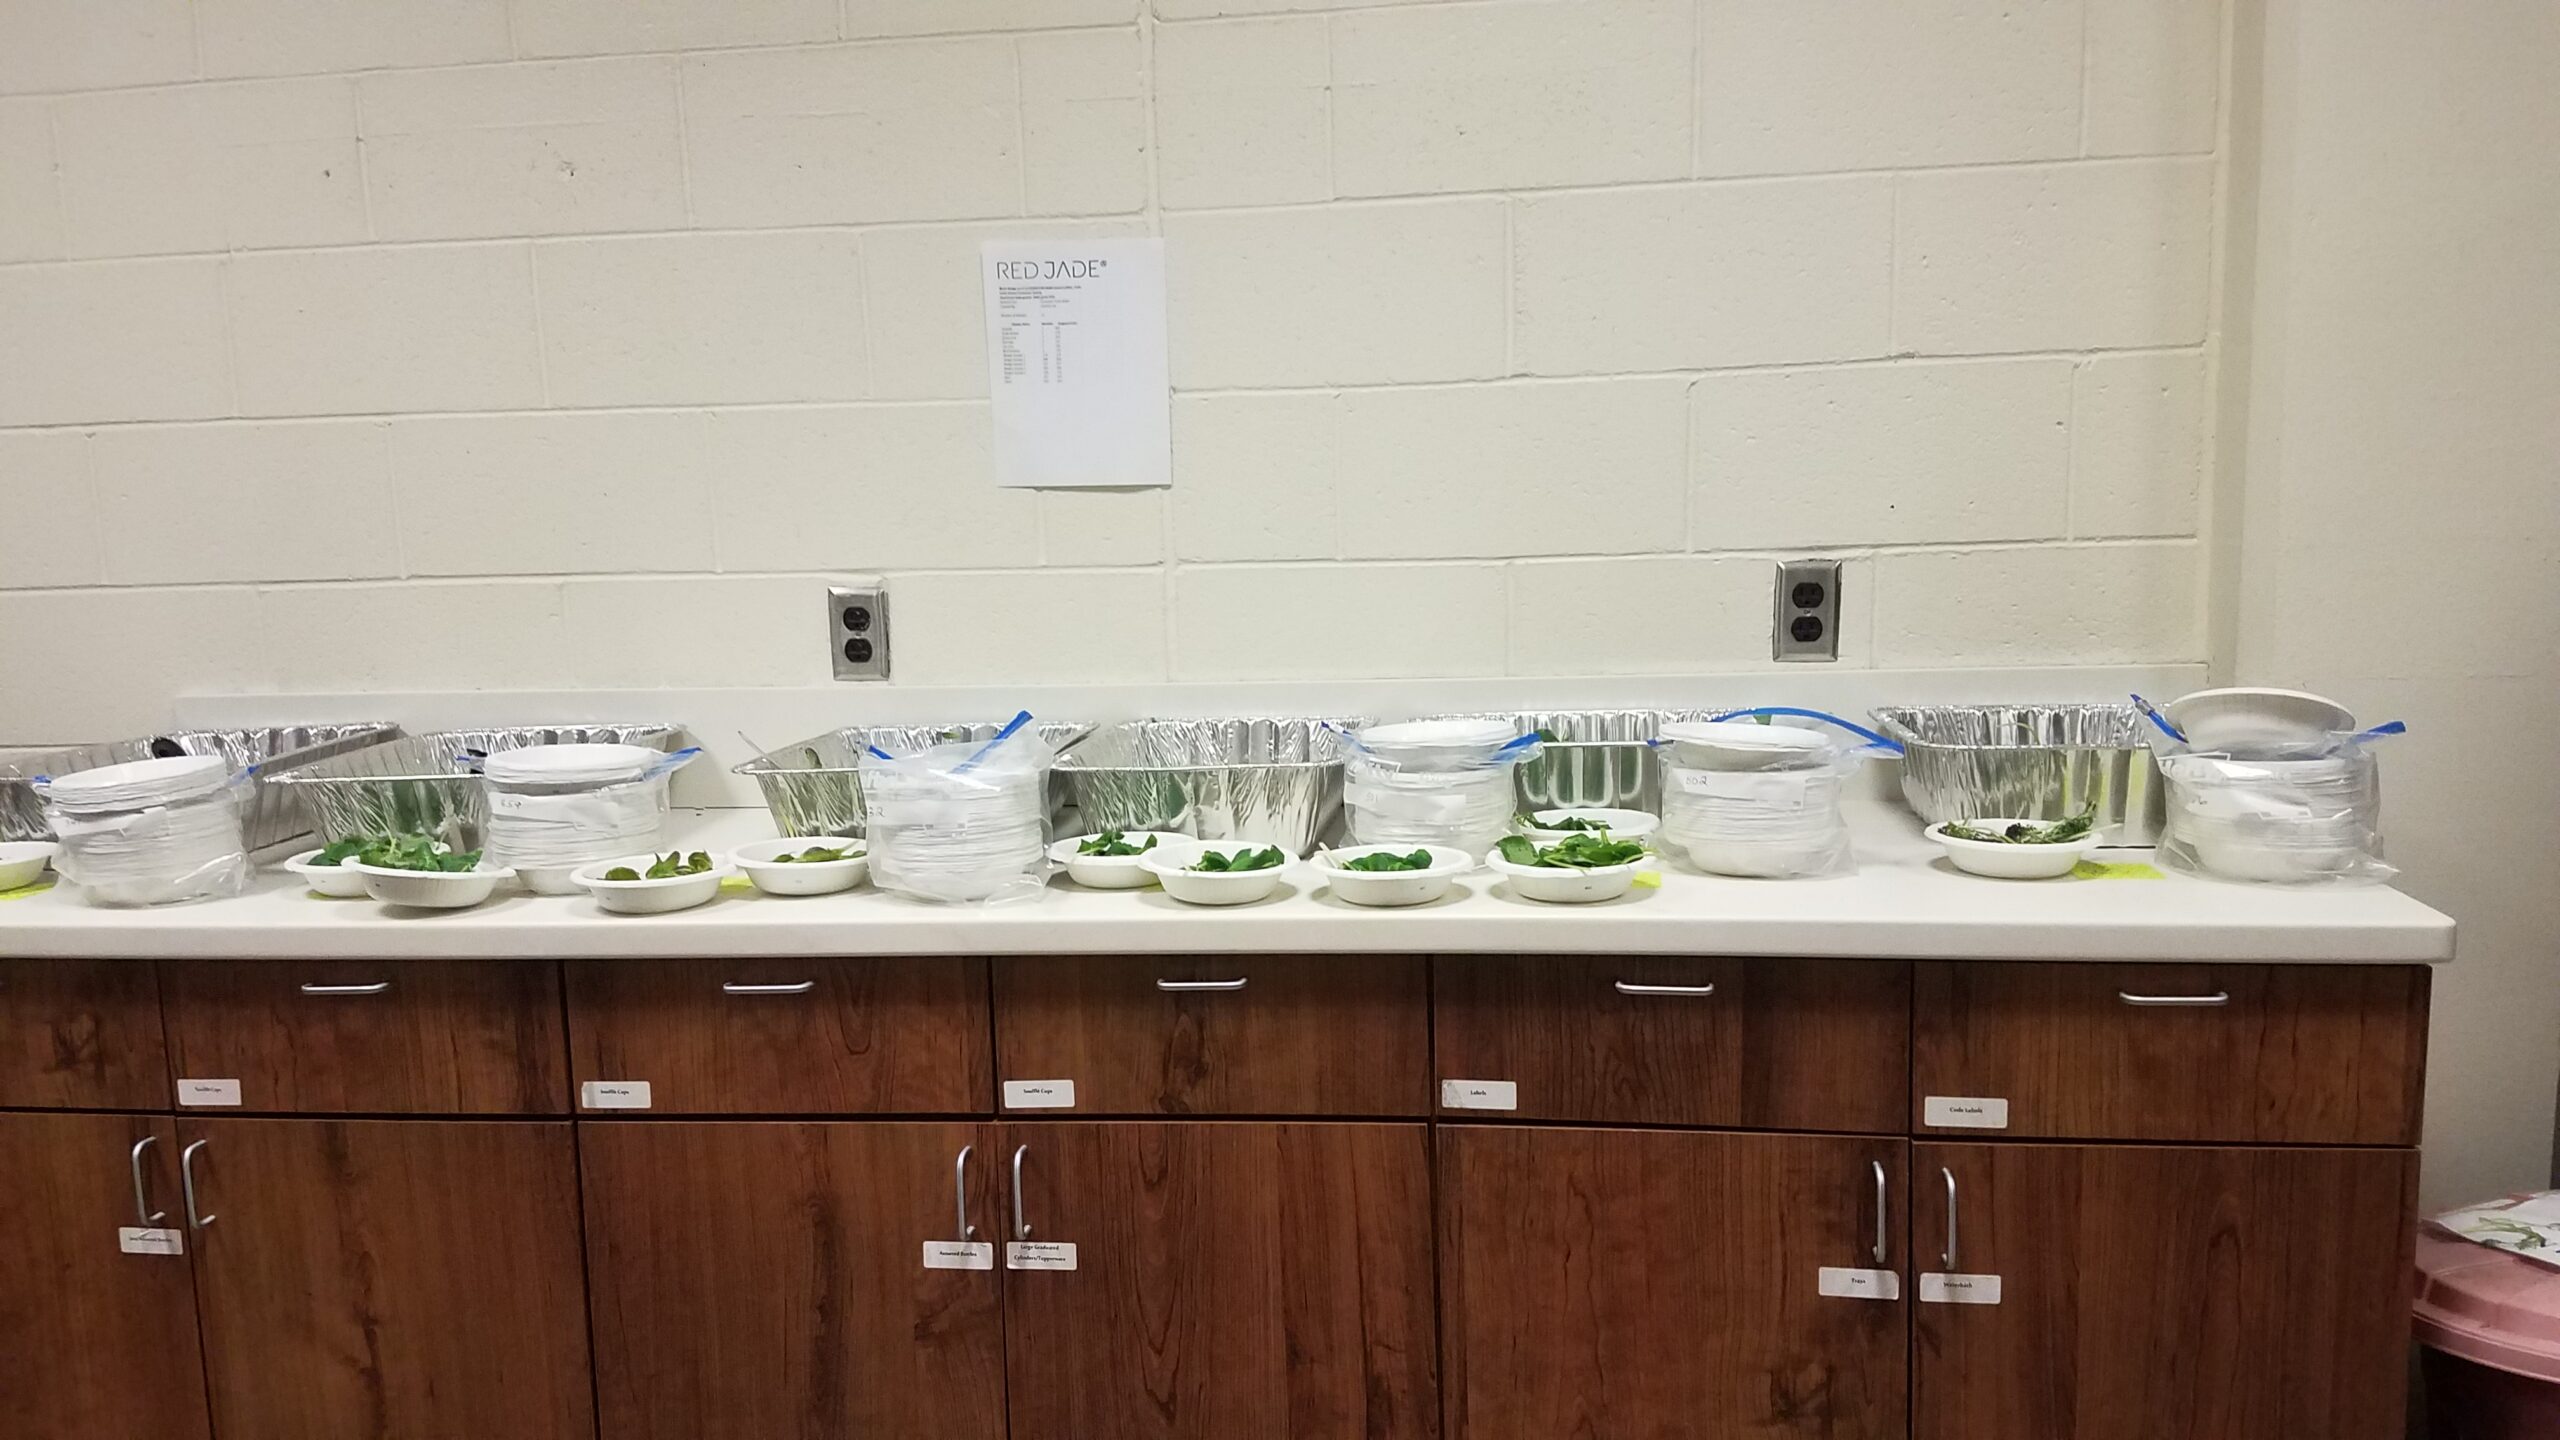
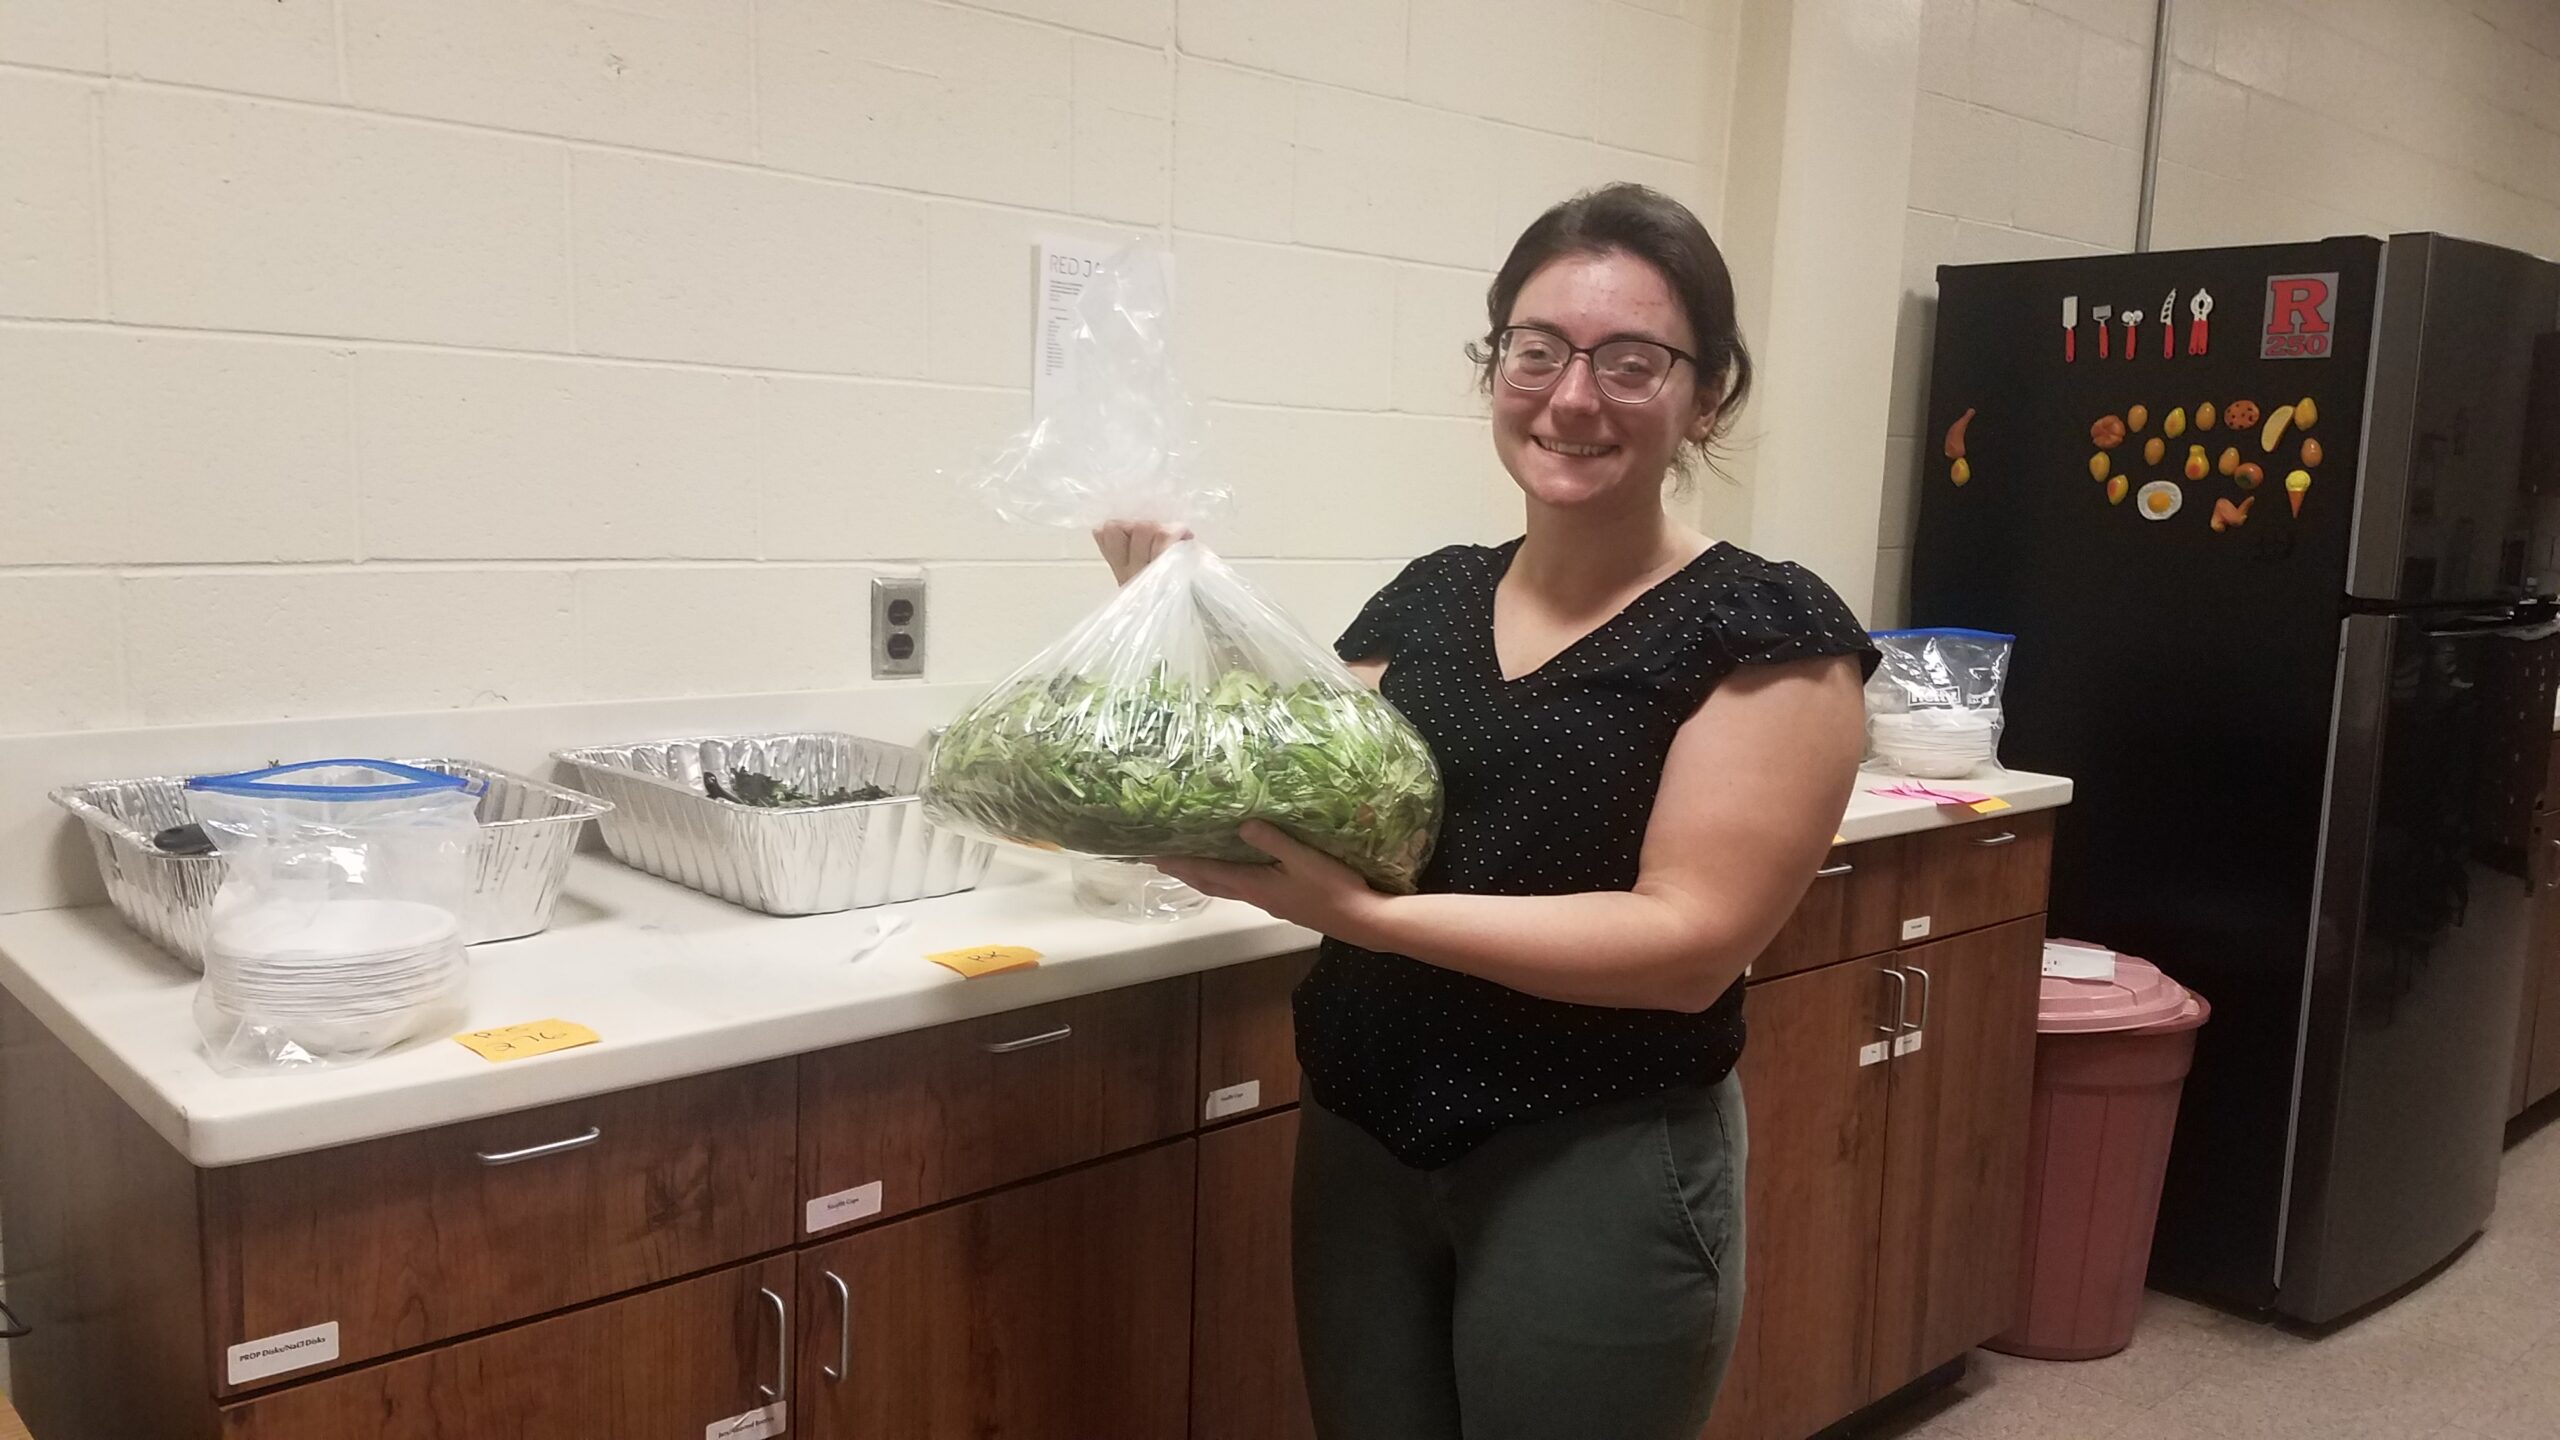
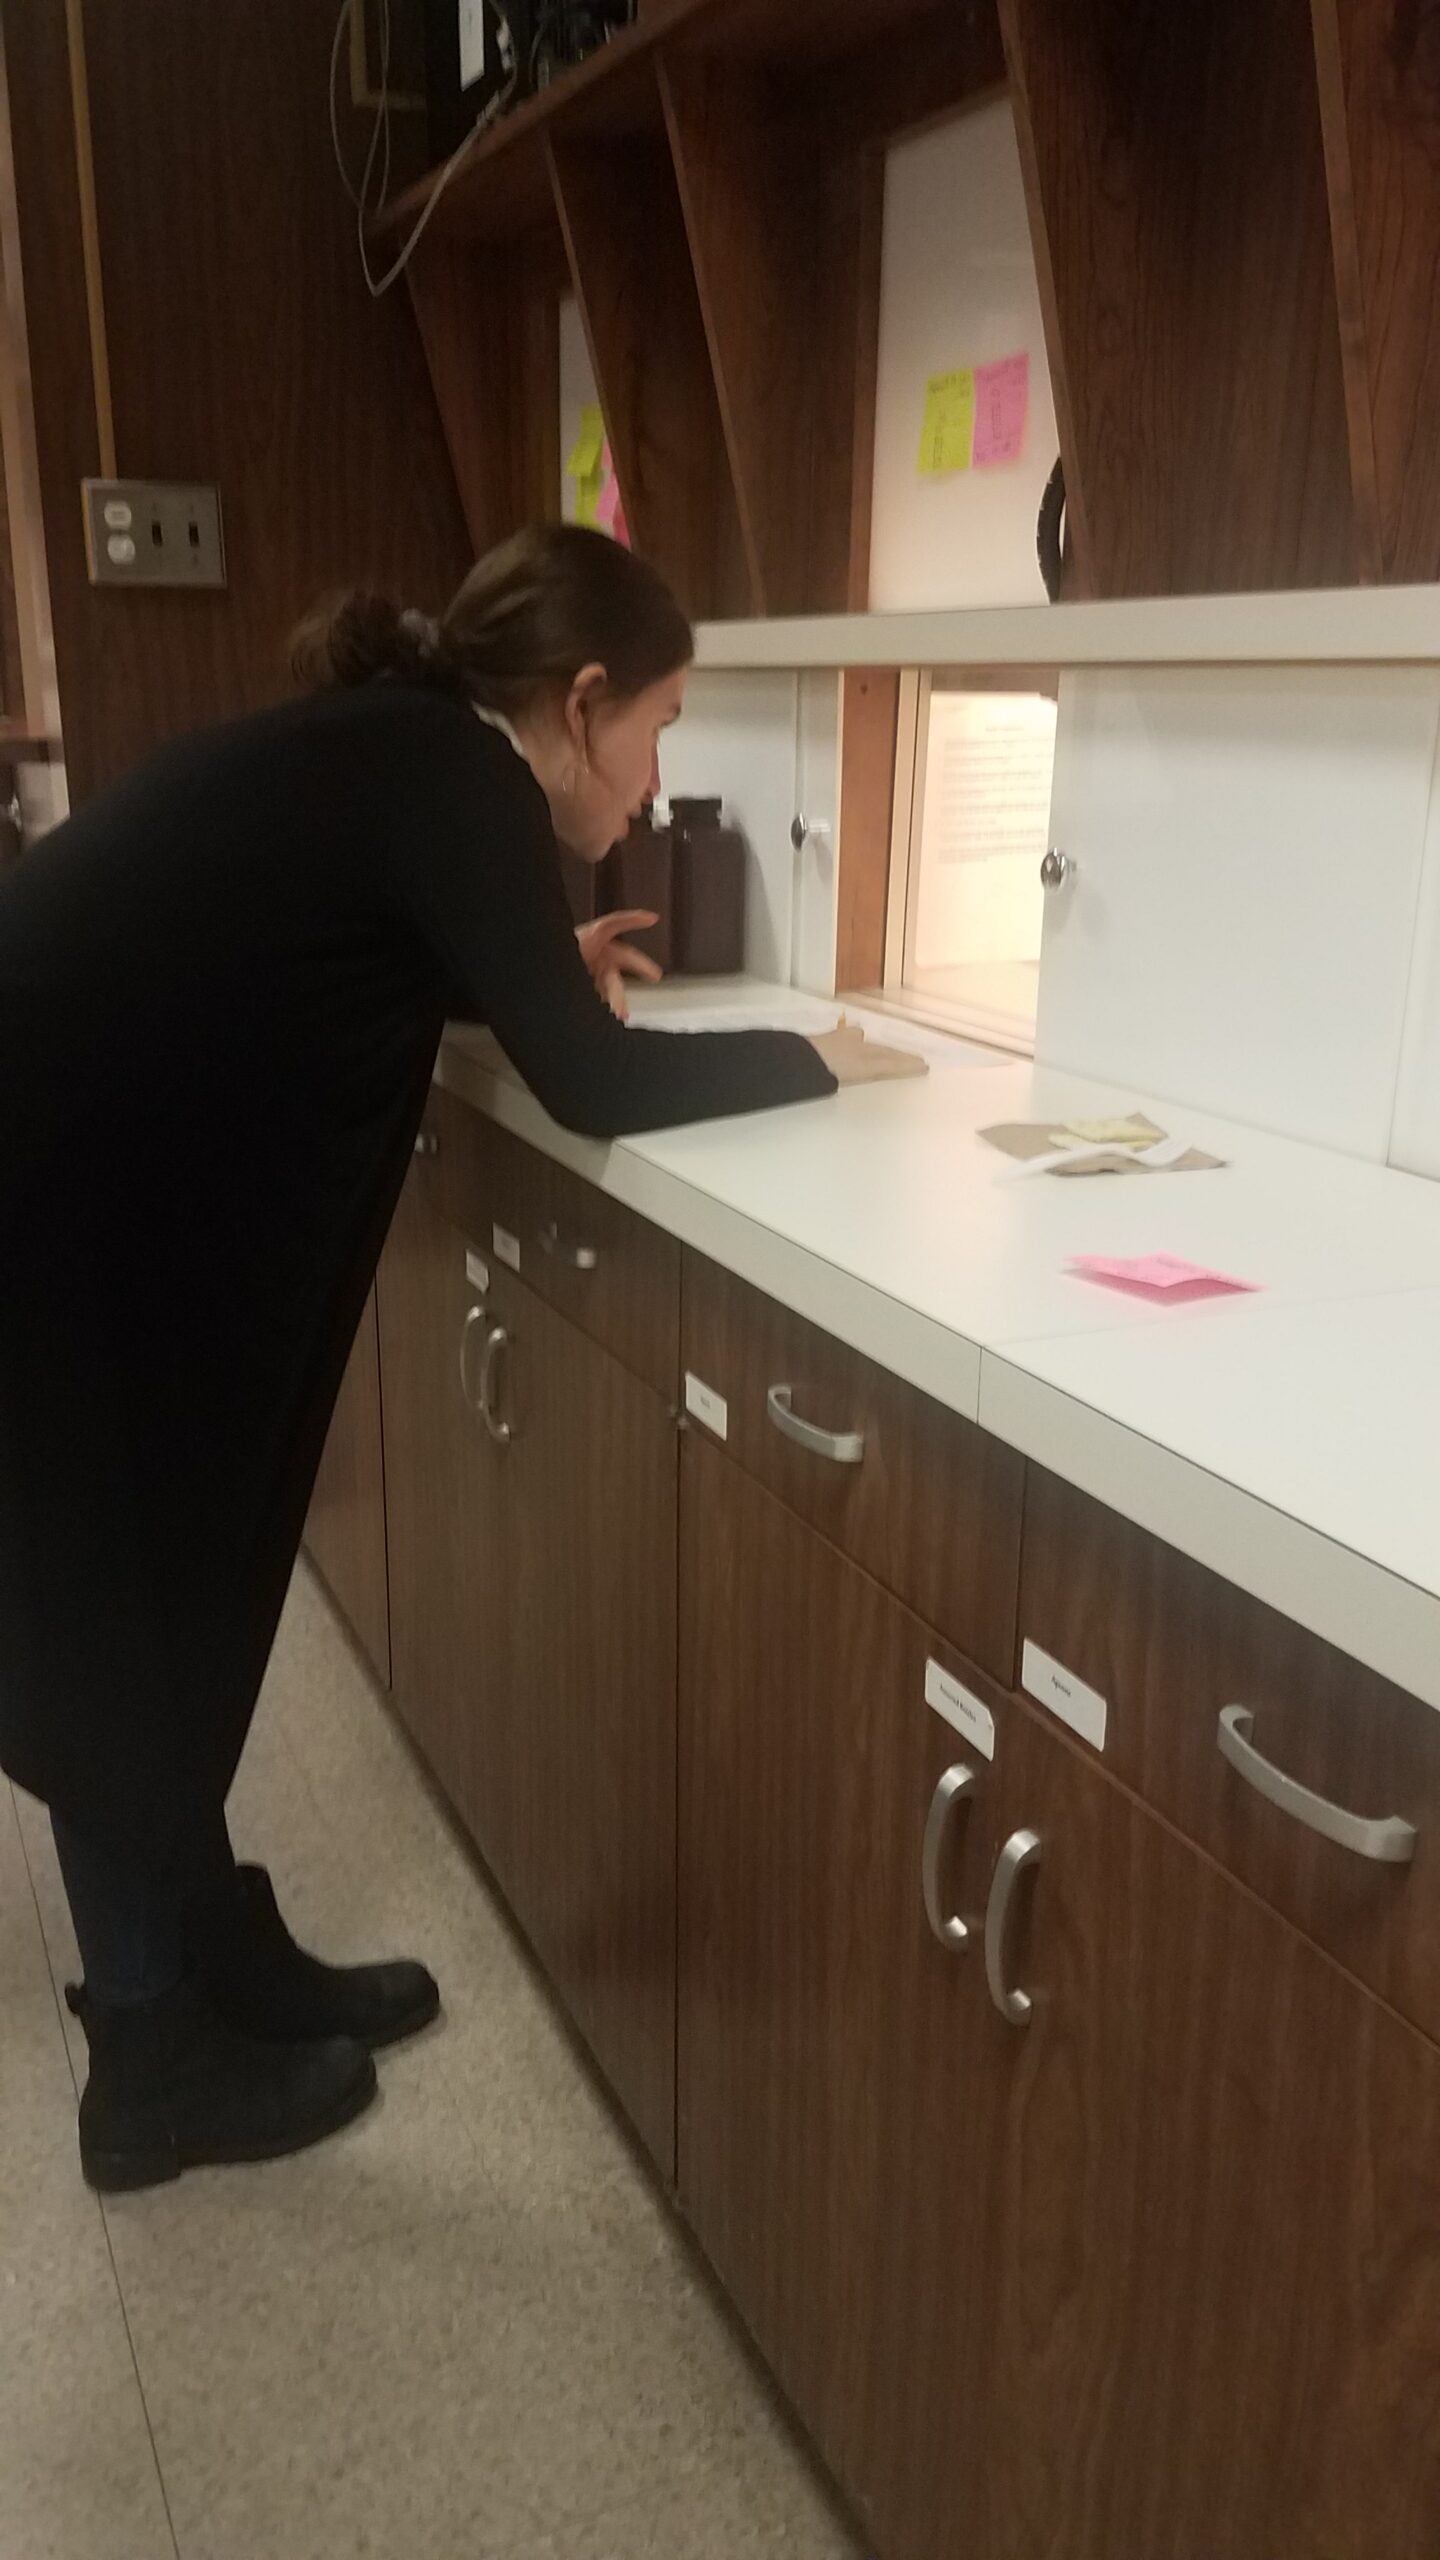
Left: Baby leafy greens being prepared for participants. Middle: Ph.D. Student Regina O'Brien prepares baby leafy greens for testing. Right: M.S. Student Fay Alwattari serves samples to participants.
1.5.1. Session 1
During Session 1, consumers evaluated the six baby leaf varieties described above. Samples were presented one-at-a-time in a balanced randomized order. Each sample was evaluated once under white lighting. Filtered water and unsalted crackers were provided as a palate cleanser during the 60s break between samples.
1.5.2. Session 2
During Session 2, consumers completed the TFEQ-R18, the Variety Seeking questionnaire, a food adventurousness question, and the demographic survey. Following the questionnaires, participants were then tested for their sensitivity to PROP using the filter paper screening method described above.
1.6. Data Analysis
All statistical analysis was completed using XLSTAT-Sensory (Addinsoft, New York, NY). Consumer hedonic data for overall liking and aroma, flavor, and texture liking were analyzed using two-way Analysis of Variance (ANOVA) followed by Tukey’s HSD, with statistical cutoff set to p<0.01. Check-all-that-apply questions were analyzed with Cochran’s Q test set to p<0.05, with McNemar post hoc test. To understand consumer preference, Agglomerative Hierarchical Cluster Analysis (AHC) was performed on hedonic scores for overall liking and aroma, flavor, and texture liking, using Euclidian dissimilarity, Ward’s agglomeration method, and automatic truncation. A separate ANOVA and Tukey’s HSD analysis were used to determine liking differences between clusters. Demographic data were condensed based on the median value of each measure. To assess relationships between clusters and consumer traits, Fisher’s exact test was applied to contingency tables of the demographic data with cutoff at p<0.05. Multiple Factor Analysis was applied to the data, using the mean hedonic scores, with demographic qualitative data and CATA frequency added as supplementary data.
2.0 Study 2: Online Consumer Survey
2.1. Questionnaires
2.1.1. Conjoint Analysis
To assess relative importance of product features, a Choice-Based Conjoint (CBC) analysis task was completed. In this type of testing, aspects of a product (often price, brand, color, etc.) are combined to create a ‘product concept.’ Pairs of product concepts are shown; participants must choose which product they are more likely to purchase, giving insight into which features are most likely to influence purchase.
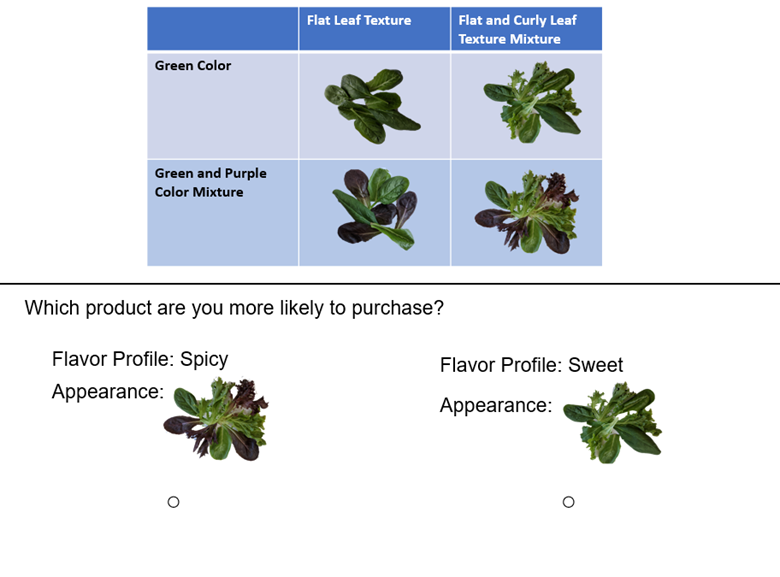
The CBC included three factors: color, leaf texture, and flavor. Each factor included two levels. The levels for the ‘Color’ factor included mixtures with only green coloring and mixtures with green and purple coloring. The levels for ‘Leaf Texture’ included mixtures with straight leaf edges only, or a mixture of straight and curly leaf edges. The levels for ‘Flavor Description’ included “spicy” and “sweet.” These flavor descriptions were selected based on preliminary results from Study I indicating that there were large differences in consumer clusters’ liking of varieties with those flavor characteristics (see Results). To create a product concept, one level from each attribute were combined. A total of 6 product concepts were created. The factors and levels included in the CBC are detailed in Table 2. The images used in the survey are shown in Figure 1.
|
Table 2. Factors and Levels included in the Choice-Based Conjoint task completed by consumers (n=397). |
|
|
Factor |
Levels |
|
Flavor |
Sweet Spicy |
|
Color |
Green Leaves Green and Purple Leaf Mixture |
|
Texture Appearance |
Flat Leaf Edge Flat and Curly Leaf Mixture |
2.1.2. Bitter Food Liking Questionnaire
To understand how bitterness influenced selection of product concepts, participants were asked about their liking of various bitter foods. To assess bitter food liking, participants were asked to rate their degree of liking of eight common foods, including six bitter and two non-bitter foods. Liking was measured on 9-point (1=Dislike extremely to 9=Like extremely) hedonic scales. The food items were adapted from a list compiled by Ullrich et al. (2004).
2.1.3. Demographic Questionnaire
To understand consumer segments, participants were given a general demographic questionnaire including items on age, ethnicity, gender, income level, and grocery shopping behavior.
2.2. Participants
Consumers were recruited online through a third-party recruitment service (Dynata, Plano, TX). Eligible participants were above the age of 18 years old, residing in the United States, and consumed leafy greens at least once per month.
2.3. Data Collection Procedures
All data were collected using Qualtrics XM™ Version 01.22 (Qualtrics, Provo, UT). All questions were answered in a single session. For the CBC, product concepts were presented in pairs and participants selected which sample of each pair they were more likely to purchase. All possible product concept pairs were presented to participants, a total of 28 selections. Randomization was implemented within each presentation and between questions to avoid presentation bias. Following the CBC, demographic questions were answered.
2.4. Data Analysis
In the online study, completion time was assessed; those determined to be speedy responders (>1/3 of median duration) were eliminated from the data. Speed of response is linked to careless responding (Goldammer, Annen, Stöckli, & Jonas, 2020).
For the CBC data, individual utility and importance scores were calculated by Hierarchical Bayesian estimation. An analysis of variance was used with Fisher's least significant difference to determine significance between levels and attributes for the participants (n=397). Cluster analysis of individual utility scores was performed with k-means clustering followed by ANOVA with means separation for determination of differences within each cluster. Fisher’s exact test was also applied to the demographic data for each cluster. Multiple Factor Analysis was also applied to the data using a similar procedures to the hedonic study.
For the bitter food liking ratings, hedonic scores for bitter foods and non-bitter foods were added and compiled to create a ratio of bitter food liking to overall food liking (‘bitter score’). This bitter score was used to determine relationships in bitterness liking and utility scores using a Pearson correlation coefficient set to p<0.05. Differences in bitter scores between clusters were assessed using ANOVA.
Results
1.0. Taste Study
A consumer test was conducted to determine consumer acceptance of six varieties of baby greens. Approximately 85% of consumers reported consuming leafy greens at least once per week. Most participants were between the ages of 18 and 34 (77%), had high food adventurousness (84%), and were medium or high variety seeking (81%). Table 3 shows the mean differences for the sensory attributes of each sample. Mean liking scores differed significantly (p<0.01) across samples in overall liking, flavor, and texture. No differences in aroma were observed between the samples.
|
Table 3. Mean liking ratings (±SEM) for sensory attributes for baby leaf varieties evaluated by consumers (n=73). |
||||||
|
|
Arugula |
Ruby Streaks |
Green Kale |
Red Kale |
Pac Choi |
Red Romaine |
|
Aroma Likingns |
5.1 (0.2) |
4.9 (0.2) |
4.6 (0.2) |
4.7 (0.2) |
5.2 (0.2) |
5.3 (0.2) |
|
Flavor Liking |
4.3b (0.3) |
4.8ab (0.2) |
4.7ab (0.2) |
4.7ab (0.2) |
5.3a (0.2) |
5.4a (0.2) |
|
Texture Liking |
5.6a (0.2) |
4.7b (0.2) |
5.6a (0.2) |
5.3ab (0.2) |
5.9a (0.1) |
5.2ab (0.2) |
|
Overall Liking |
4.5b (0.3) |
4.7b (0.2) |
4.5ab (0.2) |
4.5ab (0.2) |
4.8a (0.2) |
4.8a (0.2) |
|
Purchase Intent |
4.3b (0.3) |
4.3b (0.2) |
4.6ab (0.2) |
4.6ab (0.2) |
5.2a (0.2) |
5.2a (0.2) |
|
Samples with different superscripts (a,b) indicate statistically significant differences at p<0.01. |
||||||
|
Table 4. Percentage of participants (n=73) selecting liking or disliking of attributes from the Check-All-That-Apply task for six samples of baby leafy greens. |
|||||||
|
Arugula |
Ruby Streaks |
Green Kale |
Red Kale |
Pac Choi |
Red Romaine |
||
|
Bitterness |
Dislike (%) |
55a |
23b |
38ab |
37ab |
26b |
16b |
|
Like (%)ns |
34 |
21 |
32 |
33 |
36 |
18 |
|
|
Sweetness |
Dislike (%)ns |
1 |
0 |
3 |
0 |
4 |
0 |
|
Like (%) |
14b |
26b |
22b |
15b |
33b |
52a |
|
|
Spiciness |
Dislike (%) |
15a |
19a |
4bc |
5b |
3bc |
0c |
|
Like (%) |
34a |
36a |
21ab |
16bc |
12c |
8c |
|
|
Drying |
Dislike (%)ns |
10 |
8 |
21 |
15 |
8 |
18 |
|
Like (%)ns |
5 |
4 |
3 |
8 |
4 |
3 |
|
|
Color |
Dislike (%) |
1c |
18ab |
4c |
29a |
1c |
14bc |
|
Like (%) |
84a |
62bc |
79ab |
60c |
88a |
67abc |
|
|
Different lettering (a,b,c) represents statistically significant differences across samples (rows) at p<0.05 after Cochran’s Q test with McNemar (Bonferroni) post-hoc test. |
|||||||
Mean hedonic scores for liking are shown in Table 3. Across all sensory attributes, Pac Choi was consistently rated as the highest liked sample. Arugula was the least liked sample overall liking and in flavor liking. Differences in liking of flavor and overall liking followed similar patterns, where both Pac Choi and Red Romaine were liked the more than Arugula; Ruby Streaks, Green Kale, and Red Kale fell between those samples, respectively. Purchase intent closely followed patterns for both flavor liking and overall liking. The texture of Pac Choi, Arugula, and Green Kale were liked more than that of Ruby Streaks.
Differences were observed in the CATA data for liking/dislike of color and spiciness, liking of sweetness, and dislike of bitterness (Table 4). A higher proportion of participants disliked the color of Red Kale (29%) Ruby Streaks (18%) compared to Arugula (1%) and Pac Choi (1%). More participants recorded liking sweetness of Red Romaine (52%) than all other samples, and more reported disliking the bitterness of Arugula (55%) than Ruby Streaks (23%), Pac Choi (26%), and Red Romaine (16%). Spiciness was liked, and also disliked, by more participants in Ruby Streaks (36%; 19%) and Arugula (34%; 15%) than all other samples.
1.2. PROP Classification
Participants were screened for their sensitivity to the compound PROP with 21% of participants (n=15) classified as non-tasters, 49% (n= 36) classified as medium tasters, and 30% (n=22) classified as supertasters. This distribution was consistent with normative data from similar populations and frequencies observed in previous studies (Bartoshuk, Duffy, & Miller, 1994; Tepper et al., 2001; Tepper & Ullrich, 2002; Zhao et al., 2003). No differences in liking for any sensory attributes were observed across taster groups.
1.3. Cluster Analysis
AHC grouped consumers into three clusters based on overall liking. Within class variance represented 61.8% of the variance. Within class variance ranged from 12.2% for Cluster 1 (n=38) to 20.7% for Cluster 3 (n=13). Cluster 3 was most dissimilar to the other clusters, according to the dendrogram of the AHC analysis.
Figure 2 shows the mean flavor liking ratings (± SEM) for each cluster, grouped by variety. Generally, Cluster 1 gave high liking ratings to all samples, each falling within the ‘Liking’ range. Liking patterns for Cluster 2 reflected those of Cluster 1 apart from Arugula, in which Cluster 2 disliked the sample. Cluster 3 generally disliked the samples but had higher variability in ratings compared to the other clusters. Arugula was liked the most by Cluster 1 compared to Cluster 2 and Cluster 3, whose liking of arugula flavor was within the ‘Dislike’ range. For Ruby Streaks, Green Kale, and Pac Choi, both Cluster 1 and Cluster 2 gave similarly high liking ratings compared to Cluster 3, whose liking ratings were in the ‘Dislike’ range. For Red Kale, Cluster 1 gave the highest liking compared to Cluster 3, while ratings for Cluster 2 fell between the other two clusters.
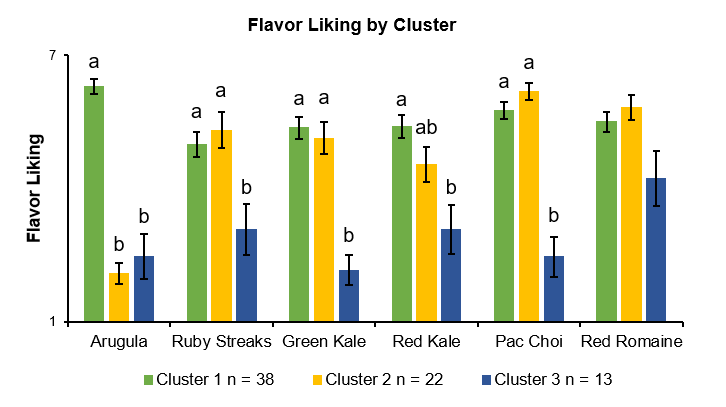
Fisher’s exact test of independence revealed relationships (p<0.05) in the consumer clusters for income, ethnicity, and consumption frequency. Cluster 3 contained higher than estimated frequencies of Asian consumers and consumers whose household income was less than $70,000 per year, while Cluster 1 contained higher than estimated White/Caucasian consumers and consumers whose household income was greater than $70,000 per year. No differences were observed between clusters for PROP status, age, gender, food adventurousness, variety seeking, or any TFEQ-R18 category (Cognitive Restraint, Emotional Eating, and Uncontrolled Eating).
2.0. Online Survey
2.1. Demographics
A total of 862 participants attempted the study; 374 did not qualify, and an additional 89 began the survey but did not complete it. A total of 399 consumers completed the online survey based on self-reported consumption of leafy greens at least once per month. Post hoc, 2 participants were classified as ‘careless responders’ and removed from the data set based on the speed of response.
Of the respondents who completed the survey, 55% identified as female. The largest ethnicity demographic was Caucasian (46%). In household income, 39% earned less than $50,000 per year, 34% earned between $50,000 and $90,000, and 26% earned more than $90,000. The participants were primarily highly food adventurous (69%) and were responsible for grocery shopping some of the time or always (73%).
2.2. CBC Analysis
Data from the CBC attributes are reported as importance scores; higher percentages indicate a more important attribute. When all participant data was grouped, consumers placed the most importance on flavor, followed by leaf texture, and then color. Within each attribute, individual utility scores for each level were analyzed. Higher utility scores represent the more attractive level within each attribute. Overall, consumers preferred leafy greens which were described as sweet, were of mixed colors and mixed leaf textures.
2.3. Cluster Analysis of CBC Data
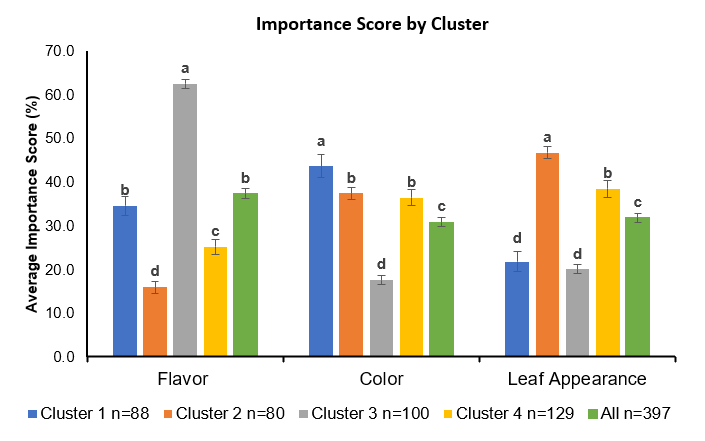
Four clusters were identified based on individual utility scores: Cluster 1 (n=88), which placed importance on both color, then flavor; Cluster 2 (n=80), which placed importance on texture, then color; Cluster 3 (n=100), which placed importance on flavor; and Cluster 4 (n=129), which placed similar importance on color and texture. Figure 4 shows the average importance scores for each cluster. Table 5 shows the breakdown of utility scores for each cluster.
Within Color, Cluster 3 placed the most importance on the flavor description, followed by Cluster 1, Cluster 4, and Cluster 2. Within the color attribute, Cluster 1 placed the more importance on sample color compared to Cluster 4 and Cluster 2, which had similar importance scores for color. Cluster 4 placed the lowest importance on color overall. For leaf texture, Cluster 2 placed the highest importance on visual texture appearance, followed by Cluster 4. Clusters 1 and 3 placed similar importance on texture, and had lower importance than both other clusters.
A large group (Cluster 4; n=129) placed high importance on visual characteristics, with high utility placed on greens which had flat texture and those which were only green in color. Flavor was of less importance to this group, and utility values for both levels were very close to 0, with higher utility for greens described as sweet. A group which made most of their decisions based on the flavor of the product concepts (Cluster 3; n=100) placed 62% importance on the flavor description of the sample. This cluster was attracted to samples which were described as sweet as compared to those described as spicy. This cluster placed equally low importance on visual attributes, and placed preference on mixtures of color and texture.
A smaller cluster (Cluster 1; n=88) placed most importance on color and flavor, respectively. Of these attributes, higher utility was placed on greens that were a mixture of green and purple, and those that were described as spicy. Leaf texture was of less importance, and this group was more attracted to mixes that varied in texture. The smallest cluster (Cluster 2; n=80) placed relatively equal importance on both texture and color, more often selecting greens which were mixed color and mixed texture.
|
Table 5. Utility scores per cluster for levels within each attribute. |
||||||
|
Attribute |
Level |
Cluster 1 (n=88) |
Cluster 2 (n=80) |
Cluster 3 (n=100) |
Cluster 4 (n=129)
|
All Participants (n=397)
|
|
Flavor |
Sweet |
-0.710d |
0.434b |
2.237a |
0.010c |
0.586 |
|
Spicy |
0.710a |
-0.434c |
-2.237d |
-0.010b |
-0.586 |
|
|
Color |
Green |
-0.918c |
-1.290d |
-0.320b |
0.207a |
-0.476 |
|
Green and Purple |
0.918b |
1.290a |
0.320c |
-0.207d |
0.476 |
|
|
Texture Appearance |
Flat |
-0.474c |
-2.047d |
-0.222b |
0.460a |
-0.444 |
|
Flat and Curly |
0.474b |
2.047a |
0.222c |
-0.460d |
0.444 |
|
|
Different superscripts (a,b, c, etc.) represent statistically significant differences at p<0.05. |
||||||
Fisher’s exact test showed demographic differences between the clusters in age (p<0.05). Clusters 2 and 3 contained a higher frequency of participants whose age was above 55 years old, while Cluster 4 contained a lower frequency of participants in this age range. A trend (p=0.09) in food adventurousness was observed between the consumer segments.
Additionally, there were significant correlations between bitter food liking score and utility scores for spiciness and sweetness (r2 = 0.2, p<0.01). In the CATA questions for liking of sensory attributes, Cluster 1 had a high frequency of consumers who liked spicy and pungent characteristics. Cluster 3 had a high frequency of liking sweet and mild characteristics, and lower frequency of liking spicy and bitter characteristics. Cluster 4 had a higher level of participants liking bitterness and toughness, while a lower frequency of reported liking for crispy leaves. There were no differences in sensory attribute liking for Cluster 2.
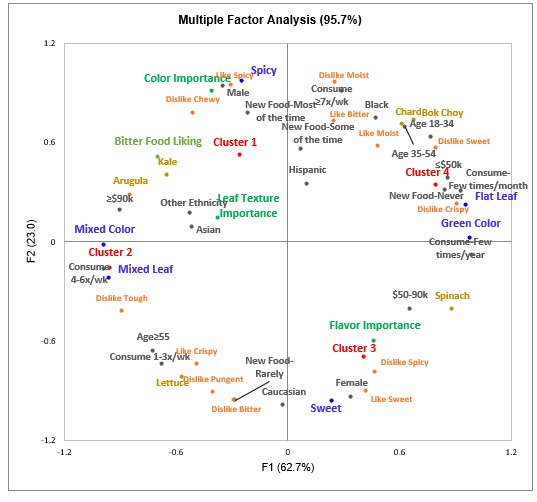
The MFA biplot (Figure 4) shows the associations between utility and importance scores, demographic information, and clusters. The analysis explained 95.7% of the variance. Factor 1 (62.7%) shows the variation between Cluster 2 and Cluster 4. These two clusters had high utility scores for color and texture appearance characteristics. Cluster 4, which placed high utility on flat leaves with green color, was associated with disliking of crispy leaves, low consumption frequency, low household income (≤$50,000 per year), and low food adventurousness (rarely try new foods). Cluster 2, which placed high utility on mixed (green/purple) color and mixed (flat/curly) texture. This cluster was associated with disliking tough leaves, high household income (≥$90,000 per year), and high consumption of leafy greens (4-6 times per week).
Factor 2 of the MFA (23.0%; Figure 4) shows the variation between Cluster 1 and Cluster 3. Cluster 1 placed high importance on color and leaf texture appearance, and was characterized as having high utility for spicy greens. Cluster 1 was associated with reported liking of spiciness, having a high bitter food liking score, being male, and having high food adventurousness (try new food most of the time). Cluster 3 placed very high importance on flavor and had high utility for sweet greens. This cluster was associated with dislike of spiciness and liking of sweetness, and female gender.
Discussion
1.0. Taste Study
In this study, we conducted an in-lab test to assess consumer liking of the sensory characteristics of a variety of baby leafy greens. Overall, most of the baby leafy greens were well liked in all sensory attributes tested, however we found differences in liking between the varieties. Liking of flavor was most closely associated with overall liking.
Generally, the mild/sweet greens, Pac Choi and Red Romaine, were liked the most over the spicy and bitter/astringent greens. This is consistent with other reports on liking of leafy vegetables, where Fouladkhah et al. (2011) used lettuces as a control against new leaf cultivars. The control was liked as much or more in flavor liking and overall liking compared to the other samples. Traditionally, lettuces have been widely available across the United States and are the most popular among consumers (Tarwadi & Agte, 2003). The Red Romaine baby lettuce tested in the present study has a relatively simple sensory profile (O'Brien et al., 2021), and familiarity with its flavor may positively influence liking (Köster & Mojet, 2016).
The Green Kale and Red Kale samples generally were moderately liked and followed the same pattern for flavor liking and overall liking. However, the texture of Red Kale was not as well liked as that of the Green Kale sample. Texture is an important attribute influencing liking of mature kale cultivars (Swegarden et al., 2019), although the texture of baby kale may be more acceptable than that of mature kale (Barker et al., 2021). Additionally, many people disliked the color of the Red Kale sample. Red Kale has a very dark purple color compared to other samples in this study (O'Brien et al., 2021), which may be unfamiliar and unappealing to some consumers. Purple coloring in leaves due to anthocyanins (Zhang et al., 2014) has been associated with moderate astringency in vegetables (Martín, Navas, Jiménez-Moreno, & Asuero, 2017).
The baby greens we categorized as “spicy”, Arugula and Ruby Streaks, had different patterns of liking. In flavor liking and overall liking, arugula was the least liked sample of all varieties, consistent with other liking studies of leafy greens (Fouladkhah et al., 2011). Differences in liking of arugula were observed between Cluster 1 and Clusters 2 and 3. Ruby Streaks, a mustard green, did not have differences in liking between the largest clusters, despite also having spicy quality. Arugula has been evaluated as having high bitterness, pungency, heat, and pepperiness, whereas mustard greens generally do not have the bitterness associated with arugula (O'Brien et al., 2021; Talavera-Bianchi, Chambers, & Chambers, 2010). Arugula and mustard have different compositions of glucosinolate compounds, which are widely accepted to drive bitterness and pungency in Brassicaceae vegetables (Bell et al., 2018).
We found no differences in aroma liking for the varieties. This is consistent both with our findings from trained panelists (O'Brien et al., 2021) showing that the intensity ratings for aroma attributes of baby leafy greens were much lower than for flavor attributes and reports from a consumer study on kale showing no differences in aroma liking between consumer clusters (Swegarden et al., 2019). This indicates that flavor, a combination of retronasal aroma and basic taste, should be the focus of crop selection in future programs.
Cluster analysis of the hedonic scores revealed three groups. The largest differences existed between Cluster 1, which liked most samples, and Cluster 3, a small group, which disliked most samples. Cluster 2 disliked both Arugula and Red Kale, which we previously reported as having intense bitterness compared to other baby leafy green (O'Brien et al., 2021). No differences were observed between consumer groups as a function of PROP classification, indicating that PROP tasting alone cannot explain differences in liking. The cluster disliking most of the samples was composed of more consumers who had low household income and those who were Asian. Cultural differences in consumption or preparation could influence liking, and socioeconomic status is well-documented to be a determinant of vegetable consumption (Reicks, Randall, & Haynes, 1994). Due to low frequencies in some groups, it is difficult to determine trends for some demographic data.
2.0. Online Study
In the online survey, we conducted a choice-based conjoint analysis. Although flavor was the most important attribute overall, clustering showed groups which assigned different importance levels to the attributes. The largest cluster (Cluster 4) contained participants who placed similar importance on both flavor and appearance, and preferred greens that were sweet, had a single texture (flat leaf), and were only green in color – consistent with the qualities of most traditional varieties of baby leaf lettuce and/or spinach on the market. This cluster was comprised of participants who were in an older age demographic and who try new foods less often than other clusters. Another large cluster (Cluster 3) placed most importance on flavor and preferred greens which were sweet. This is consistent with previous reports that spiciness (hotness) was the main driver of disliking arugula cultivars (Bell, Lignou, & Wagstaff, 2020), and a consumer group placing high importance on flavor would avoid products with indicated spiciness.
Two smaller consumer clusters placed importance on color/flavor and color/texture (Cluster 1; Cluster 2), respectively, and these groups preferred the non-traditional sensory qualities (spiciness, mixed color, and mixed texture) in attributes of high importance. Despite color potentially being an indicator of nutritional quality, the influence of nutritional packaging claims on purchasing decision did not differ between the groups. Attention should be placed on these clusters to produce salad mix tailored to those preferring variety. Producers of leafy salad mix may decide to incorporate variety across many sensory attributes to satisfy these consumer segments. Across all participants, we observed positive associations between liking of bitter foods and high preference (i.e., utility) for products labeled as spicy. Spicy compounds, such as capsaicin, may also confer bitterness for some population segments. TAS2R38 polymorphism is associated with perception of bitterness in foods which are burning (Green & Hayes, 2003; Nolden, McGeary, & Hayes, 2016).
3.0. Integrated Insights from Taste Study and Online Study
In both hedonic consumer evaluations and online surveying, we saw similarities in consumer behavior. First, most consumers have high liking for baby greens which are sweet with minimal variation in texture from typical baby lettuces. Second, in both studies, we found that consumer clusters have high variability in their liking of spicy varieties. From the conjoint analysis, we determined that consumers who placed very high importance on flavor were averse to baby greens labeled as spicy. However, other consumers who do not find flavor to be highly important may be more concerned with textural variety when making a purchasing decision. Of consumers who preferred mixes with non-traditional sensory attributes, variety across several factors were preferred. However, producers should be conscious of extremely dark purple coloring on leaves, as one-third of consumers in the taste study reported to dislike the color of Red Kale.
By utilizing both hedonic testing and online surveys, we identified consumer clusters that have different preferences for sensory attributes of leafy greens. We studied demographically different consumer groups, one in a CLT format with tasted samples and the other online, both resulting in similar conclusions. Generally, large segments of consumers are accepting of baby greens and mixes with traditional characteristics – sweet, green, and/or flat texture. However, the identification of smaller consumer groups that were accepting of spicy greens and color/texture variety gives insight to growers and marketers to tailor individual varieties and blends to satisfy different segments of consumers.
Education & outreach activities and participation summary
Participation summary:
Education and Outreach
In December 2019, I presented an Educational Micro-Session at the New York Produce Show and Conference about this project. Co-sponsored by the Eastern Produce Council, this trade show is the second largest produce show in North America, attracting roughly 5,000 attendees and 400 exhibitors from the produce industry. The talk, “Controlled Environment Agriculture: A Tool to Understand Flavor Profiles and Consumer Demand for Baby Leafy Greens,” highlighted use of indoor farms in Food Science research and connected this with our consumer research detailed in this project. In this talk, we were able to inform those in the produce industry about preliminary findings of our in-lab research.
In March 2021, I presented a talk titled "Controlled Environment Agriculture – A tool to understand flavor profiles and consumer demand for baby leafy greens” at the Vegetable Growers Association of New Jersey annual education session. This talked, aimed to deliver the results of our research directly to farmers within the state, highlighted the importance of crop selection for specific consumer groups.
In May 2021, I gave a presentation “How can sensory science support agricultural development” within the Science Cafe series at AeroFarms in Newark, NJ. This talk discussed the results from our ongoing collaborative FFAR grant with AeroFarms, as well as presenting findings from our consumer research to stakeholders and those in the indoor farming industry.
In July 2022, a presentation titled "Individual differences in sensory perceptions and personality traits associated with consumer acceptance of phytochemical-rich foods" was given at the Institute of Food Technologists annual meeting in Chicago, IL. This yearly conference and expo attracts more than 18,000 people working in the food and agricultural industries. This talk, aimed at scientists working with agricultural products and those in the food industry, highlighted the need to understand all aspects of the consumer profile - including the role of personality and genetic differences.
Project Outcomes
The results from this project will provide much needed information to growers of baby leafy greens regarding crop selection for potential consumer groups. Economic sustainability is critical for the long-term success of any farm, and it is particularly important for indoor agriculture start-ups. Often, there is a large financial investment associated with such farms to obtain the technology needed to commercially grow indoors; profitability within the first several years of business is essential to remain in operation. Plans for publication are underway, which will ensure that the information is publicly accessible to growers.
The results from these surveys will prompt growers to carefully select the plant varieties they bring to market to optimize not only how to grow, but what to grow. Whereas the common practice of crop selection has been to focus on flavor, producers should also consider how other sensory characteristics of their products impact purchase – particularly color and texture can be potentially appealing or off-putting, depending on the consumer. Indirectly, by helping to aid in economic sustainability, these impacts may lead to increases in the number of sustainable indoor farms in the country.
The impact of this project brought attention to the continued research in agricultural products at The Center for Sensory Sciences and Innovation at Rutgers University. Lead by Dr. Beverly Tepper of the Sensory Evaluation Laboratory and Dr. James Simon of the New Use Agriculture and Plant Products Laboratory, this collaboration with Soli Organic, Inc. intends to select and advance the next generation of commercial organic, indoor-grown produce over the next five years. This new project will identify and further optimize flavor, aroma, nutrition and yield traits for indoor cultivation.
The conclusions from this project highlight the need for growers to understand their consumers on a holistic level. In the in-lab testing, we observed trends which described differences in consumer segments. These differences were linked to all aspects of the consumers – including inherent genetic differences in bitter taste sensitivity and traits linked to social factors including age, income, and ethnicity.
Traditionally, lettuce crops have been the most economically important leafy green in U.S. markets. While the results from both studies showed that lettuces and mild-tasting leaf varieties are well liked by most consumers, we uncovered many consumer segments which differed in their liking of the varieties presented. This challenges the past mindset of appealing to the consumer at large – we have found that product offerings should be able to satisfy many consumer groups with varying needs, and that non-traditional cultivars have a place in the current market.
My graduate advisor noted that at the beginning of this research, commercial products from indoor farms using Controlled Environment Agriculture (CEA) were just starting to come to the market in the Northeast U.S., and there were many questions surrounding the viability of these products in traditional grocery stores. From our in-lab testing, we determined that most products were well-liked by our consumer panel, indicating that CEA can produce fresh, quality product which is acceptable to those who regularly consume leafy greens. Now, several years later, the indoor farming industry is extremely successful and expanding to new products outside of leafy vegetables.
In May 2022, I successfully defended my dissertation titled “Using Controlled Environment Agriculture to improve the Sensory Quality and Consumer Acceptance of Baby Leafy Green Vegetables.” I am currently working as an ORISE postdoctoral fellow at USDA-ARS at the Beltsville Agricultural Research Center in Beltsville, MD. My work involves sensory and consumer research which builds upon the knowledge gained through this project. Our current projects seek to enhance the quality and shelf life of fresh fruits and vegetables grown and processed with novel technologies and breeding efforts targeted at improving disease resistance.
In our in-lab consumer test, we studied many different reasons for consumer liking, including genetic sensitivity to bitterness, personality characteristics, and social demographics. Although this study was intended to be a small pilot test to select questionnaires for further study, we gained valuable knowledge by studying these factors simultaneously. However, because of the limited sample size, there was limited variability in the consumers’ variety seeking tendency and level of food adventurousness, and most consumers were found to be highly adventurous eaters with a need for variation in the products they consume. Because of this, it was difficult to determine the role of personality in liking of the plant varieties presented. Further research in this area is warranted with a larger, more diverse group of consumers, which will give more insight into these segments. Other personality characteristics, such as sensation seeking tendency and emotional response, may add value to future studies in consumer behavior.
Due to the global pandemic, our intended second study was re-worked to an online consumer survey. Through this study, we gained additional information about the relative importance of visual sensory attributes and sensory descriptors. Future work in this area should include additional factors, such as label claims, brand, and pricing to develop a comprehensive understanding of what drives selection of baby greens at the time of purchase.