Final report for GNE20-231
Project Information
Maryland farmers can install algal turf scrubbers (ATS) to generate nutrient trading credits. In an ATS, pond or river water is pumped across a flow-way which allows algae to seed and grow in a contained “bloom” on land that traps nitrogen and phosphorus in the algal turf for easy harvest. An ATS allows for upstream removal of nutrients to improve water quality downstream, while generating nutrient credit payments for farmers. Installation and operational costs of an ATS may be partially offset by using the weekly algae harvest to create value-added products for the farm. This experiment used anaerobic digestion (AD) to process ATS algae into methane (CH4)-enriched biogas and fertilizer via co-digestion with traditional agricultural AD feedstocks (dairy manure, food waste, and poultry litter). The biogas can be used on-farm for electricity production to increase farm income. Fertilizer was produced from AD effluent, which is commonly land applied on-farm. Thus, the nutrients trapped by the algae will be recycled for farmers to use again.
Two phases of experimentation were performed. In Phase I, a batch-scale AD test measured the volume and quality of CH4 produced from co-digestion reactors over a 45-day period. In Phase II, the effluent from the batch reactors were used to fertilize potted lettuce to assess the quality of this fertilizer compared with commercial fertilizer. These experiments demonstrate how farmers utilizing AD can supplement their digesters via co-digestion with algae and improve the economic benefits provided by both ATS and AD.
The findings of the batch-scale reactor experiment in Phase I conclude that while co-digesting ATS algae with dairy manure and food waste at loading ratios 1:1, 1:2, 1:5, and 1:10, or poultry litter at loading ratios of 1:1, 1:5, or 1:10 by VS does not significantly change the efficiency of a digestion per g VS loaded. The results of the lettuce growth experiment demonstrated that, while the effluent from the digesters can be used to fertilize lettuce, they are generally less effective at promoting biomass growth compared to commercial stock fertilizers. They may need to be supplemented with other fertilizer materials to provide leafy plants like lettuce with the full range of nutrients they need to thrive.
This research has demonstrated that a novel urban bioremediation technology, the algal turf scrubber, can potentially be integrated into agricultural areas as well, since the waste can be disposed of successfully via co-digestion in established on-farm infrastructure. This technology provides an option for farmers interested in sustainability and direct participation in Chesapeake Bay Watershed nutrient load reduction programs, and can be used in Maryland to participate in the state's Water Quality Trading program to generate offset credits if desired.
Objective 1. Quantify the volume and quality of biogas produced from co-digestion of ATS algae with traditional agricultural AD feedstocks: dairy manure, poultry litter, and food waste.
Hypotheses:
-Ha1.1: Co-digestion of ATS algae will yield a higher volume of CH4 than produced from AD of algae or the agricultural feedstocks alone.
-Ha1.2: Co-digestion of ATS will yield biogas with a lower concentration of H2S, and thus be of higher quality, than biogas produced from the agricultural feedstocks alone.
These hypotheses will be addressed using a batch-scale AD reactor experiment. ATS algae grown in Maryland was digested alone and via co-digestion with dairy manure, poultry litter, and food waste over 62 days. It was expected that biogas from reactors containing algae will experience elevated biogas production, and a corresponding increase in CH4 production, due to the introduction of more complex substrates for AD bacteria to utilize. Additionally, it was expected that this biogas will have lower H2S than reactors without algae due to the iron content of algae bonding with sulfur to produce iron sulfide precipitates instead.
Objective 2. Determine how co-digestion of ATS algae with traditional feedstocks affects the quality of fertilizer produced from the digester’s effluent.
Hypotheses:
-Ha2.1: Lettuce seeds fertilized using effluent from co-digestion of algae will produce biomass equal to or greater than seeds fertilized using commercial fertilizers or effluent from AD systems utilizing agricultural feedstocks alone.
These hypotheses will be addressed using a lettuce growth experiment that was conducted after the reactor experiment described in Objective 1. Effluent from the reactors will be used to fertilize buttercrunch lettuce seeds to compare its effectiveness with commercial fertilizers. It is expected that co-digestion will dilute any salts or heavy metals present in the algae sufficiently to prevent them from interfering with lettuce growth or increasing their concentration in the lettuce biomass, and thus verify the utility of the co-digestion AD effluent for land application.
The purpose of this project was to improve the economic viability of algal turf scrubber (ATS) technology for Maryland farmers interested in installing them to generate nutrient trading credits for their farm. This was achieved by using anaerobic digestion (AD) to process algal biomass from an ATS into value-added products, specifically biogas and fertilizer.
The Chesapeake Bay Watershed covers much of the northeastern United States, stretching hundreds of miles from the Atlantic Ocean in Maryland to the source of the Susquehanna River in Upstate New York. Farms present throughout the watershed are critical to the agricultural economy of this region, yet runoff from their fields could contribute to nutrients and sediments accumulating downstream in the Bay. To help increase the Bay’s water quality, all states within the watershed must develop Watershed Implementation Plans (WIPs) to set goals for their runoff management. Critical to Maryland’s WIP III plan is the use of economic incentives, such as nutrient credit trading, to reduce discharge of nutrients into the Bay watershed. Nutrient credit trading encourages research and development of nutrient abatement technology by allowing farms that install extra or novel systems to generate credits that can be sold to businesses unable to meet their discharge requirements.
ATS technology is an approved nutrient trading credit technology in Maryland. The ATS was developed in the 1980s to mimic algal growth patterns on coral reefs using land-based flow ways. Pumps are used to replicate the natural wave action in a coral reef by sending timed pulses of water from a river or pond across a textured surface on land, allowing time for algal cells naturally present in the water to settle and grow during the lull between pulses (Adey et al. 2011). The algae metabolize nitrogen and phosphorus dissolved in the water into its biomass as it grows, and traps sediments in its turf. In this way, dissolved nutrients and sediments can be removed from water and converted into an algal “crop” that may be harvested on a weekly basis during the growing season.
The algal crop may then be processed into value-added products, which can help offset the costs of ATS installation. Processing via AD was the focus of this research due to the established use of AD systems on some US farms to manage wastes, such as manure, wastewater sludge, and food waste. The non-selective nature of AD allows for algae to easily be incorporated as a co-digestion feedstock with these wastes. AD converts carbon in the feedstocks into biogas and a nutrient-rich effluent. The biogas is used for on-farm electricity production or sold to the grid, while the AD effluent may be separated into a solid fraction for bedding, composted, or sold off-site. The nearly odor-free liquid effluent may be disposed of as wastewater or land applied as fertilizer. It is expected that by using a combined ATS-AD system, the algae can increase farm income through: 1) increased electricity production, 2) nutrient trading credits, and 3) continued sales of off-farm fertilizer or bedding.
Research
Objective 1: Energy production via anaerobic digestion
Co-digestion feedstocks
A 71 x 168 cm (1.2 m2) ATS sited on the Anacostia River at Bladensburg Waterfront Park in Bladensburg, Maryland was used to supply algae for this project (Figure 1). This ATS was constructed in 2018 by the UM Student Chapter of the American Ecological Engineering Society and run by the UMD Algal Ecological Technology. For this experiment, it was activated on September 25, 2020 and run for three weeks with harvests every ten days after the biofilm had established itself. The culture used in the Phase I experiments was collected during the third harvest on October 23, 2020, tested for total solids (TS) and volatile solids (VS), and frozen until needed. Microscopy was used to find that the dominant species in this algal culture were the diatom Melosira sp. (~70%) and the green alga Spyrogyra sp. (~30%) (Figure 2).
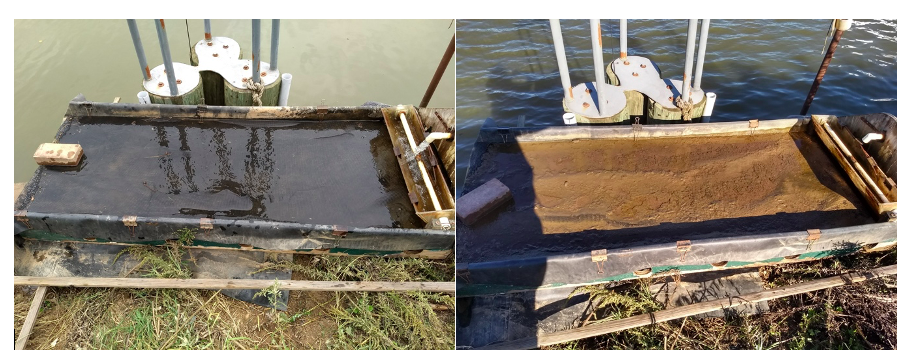
Figure 1: Small-scale ATS system on the Anacostia River used to supply algae for Phase I, before (left) and after (right) 10 days of biofilm growth. Photos taken on September 25 and October 5, 2020.
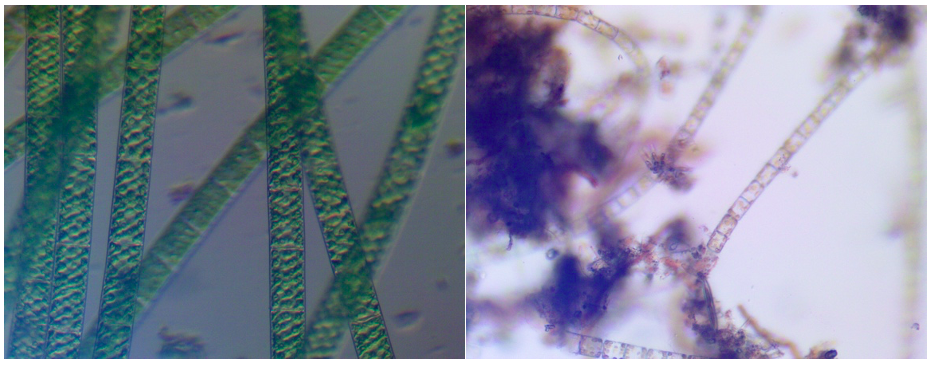
Figure 2: Microscope images of Spyrogyra sp. (left) and Melosira sp. (right) taken from samples of the algal biofilm from the Bladensburg Waterfront Park ATS system.
Poultry litter (PL) was collected from a poultry farm on the Eastern Shore of Maryland on August 27, 2020 and frozen until needed. Dairy manure (DM) was collected from the scrape system at the United States Agricultural Department’s Beltsville Agricultural Research Center (USDA BARC) dairy farm in Beltsville, Maryland on October 27, 2020 and refrigerated until needed. Artificial food waste (FW) was prepared on October 27, 2020 using the methods described in Yarberry et al. (2019), consisting of 506 g of white bread, 907 g of pork and beans, and 176 g of potato flakes, homogenized via blending and refrigerated until needed.
The inoculum culture was a mixture of lab-grown liquid inoculum started from a dairy manure digester on a farm in Maryland and dewatered solid inoculum produced by an AD reactor at municipal wastewater treatment facility in Washington DC. Each batch of mixed inoculum culture was prepared by combining 1110 g of lab-grown inoculum with 390 g of BLOOM to achieve a final VS of ~5% (Table 1).
Table 1: Total solids (TS) and volatile solids (VS) of inoculum and co-digestion feedstocks used in the Phase I lab-scale reactor experiment. Values given are mean % wet weight ± standard error (n=3).
|
Material |
TS (%) |
VS (%) |
|
Algae |
4.82 ± 0.02 |
0.61 ± 0.00 |
|
BLOOM Inoculum |
33.8 ± 0.4 |
17.7 ± 0.2 |
|
Lab-grown Inoculum |
1.11 ± 0.00 |
0.71 ± 0.00 |
|
Mixed Inoculum |
8.48 ± 0.09 |
4.53 ± 0.04 |
|
Dairy Manure (DM) |
15.4 ± 0.0 |
13.3 ± 0.1 |
|
Food Waste (FW) |
45.3 ± 0.3 |
43.6 ± 0.2 |
|
Poultry Litter (PL) |
71.0 ± 0.1 |
50.0 ± 0.3 |
Lab-scale AD reactor experiment
The AD reactors were loaded, and the Phase I experiment started on November 5, 2020. Six ratios of algae:co-digestion feedstock were tested (0:1, 1:10, 1:5, 1:2, 1:1, 1:0, by mass), with 1:0 and 0:1 ratio used as controls to measure the biogas produced from AD of algae-only and each feedstock-only, respectively. Furthermore, an inoculum-only control treatment was used to account for biogas production from the organic material in the inoculum used to seed the digesters. This baseline level of biogas production was subtracted from the biogas production data presented in the results. Each treatment was prepared with four replicates, three of which were incubated for 62 days, while the fourth was harvested immediately after preparation to provide a sample of pre-digestion reactor fluid.
The reactors used in the batch-scale experiments were set up in 250 mL and 500 mL glass bottles. The bottle size used for a given treatment was determined by the expected final volume of the reactors’ digestate, which varied due to the high range of the initial TS and VS content of the algae and co-digestion feedstocks. Inoculum and feedstocks were loaded based on a 2:1 inoculum to feedstock ratio. Treatments whose inoculum+substrate volume exceeded 220 mL were placed in 500 mL bottles to keep at least 30 mL of headspace for biogas accumulation in the reactor and prevent excessive pressure accumulation. Each bottle was loaded with 5 g total VS, and thus, two parts (3.333 g VS) were supplied by the inoculum and one part (1.667 g VS) was supplied by the experimental co-digestion substrate (Table 2).
Table 2: Experimental Setup of the Phase I lab-scale reactor test. Reactors 1-3 were loaded with inoculum only to provide a baseline of biogas and methane production, 4-15 were mono-substrate reactors, 16-48 co-digestion reactors with different ratios of algae:waste, determined by the VS of the algae and waste. Dairy Manure, FW=Food Waste, and PL=Poultry Litter.
|
Reactor # |
Treatment |
Inoculum (g) |
Algae (g) |
Dairy Manure (g) |
Food Waste (g) |
Poultry Litter (g) |
Total Substrate Mass (g) |
Total Mass Loaded (g) |
|
1-3 |
Mixed Inoculum |
73.648 |
- |
- |
- |
- |
0 |
73.648 |
|
4 - 6 |
Algae |
73.648 |
264.228 |
- |
- |
- |
264.228 |
337.875 |
|
7-9 |
DM |
73.648 |
- |
12.542 |
- |
- |
12.542 |
86.190 |
|
10-12 |
FW |
73.648 |
- |
- |
3.848 |
- |
3.848 |
77.496 |
|
13-15 |
PL |
73.648 |
- |
- |
- |
3.332 |
3.332 |
73.648 |
|
16-18 |
Algae+DM 1:1 |
73.648 |
132.114 |
6.271 |
- |
- |
138.385 |
212.033 |
|
19-21 |
Algae+DM 1:2 |
73.648 |
88.076 |
8.361 |
- |
- |
96.437 |
170.085 |
|
22-24 |
Algae+DM 1:5 |
73.648 |
44.038 |
10.452 |
- |
- |
54.490 |
128.138 |
|
25-27 |
Algae+DM 1:10 |
73.648 |
24.021 |
11.402 |
- |
- |
35.423 |
109.070 |
|
28-30 |
Algae+FW 1:1 |
73.648 |
132.114 |
- |
1.924 |
- |
134.038 |
207.686 |
|
31-33 |
Algae+FW 1:2 |
73.648 |
88.076 |
- |
2.565 |
- |
90.641 |
164.289 |
|
34-36 |
Algae+FW 1:5 |
73.648 |
44.038 |
- |
3.207 |
- |
47.245 |
120.893 |
|
37-39 |
Algae+FW 1:10 |
73.648 |
24.021 |
- |
3.498 |
- |
27.519 |
101.167 |
|
40-42 |
Algae+PL 1:1 |
73.648 |
132.114 |
- |
- |
1.666 |
133.780 |
205.762 |
|
43-45 |
Algae+PL 1:2 |
73.648 |
88.076 |
- |
- |
2.221 |
90.297 |
161.724 |
|
46-48 |
Algae+PL 1:5 |
73.648 |
44.038 |
- |
- |
2.777 |
46.815 |
117.686 |
|
49-51 |
Algae+PL 1:10 |
73.648 |
24.021 |
- |
- |
3.029 |
27.050 |
97.668 |
After adding the inoculum and co-digestion substrates, the bottles were flushed with nitrogen gas (N2) for 30 seconds to displace oxygen in the headspace and create an anaerobic environment and then capped with self-healing rubber septa, which provided an airtight seal. A total of 51 AD reactors were incubated in the dark at mesophilic temperatures (35°C) with continuous agitation (120 rpm) for 62 days.
Biogas volume was measured using a 50 mL wet-tipped glass syringe, with biogas production measured every 4-6 hours during the first 48 hours of incubation, every 12 hours during the next 48 hours, and daily on Days 5-9 and Days 11-17. Sampling frequency was reduced after Day 17 until the end of the experiment, as biogas production declined. The digestion experiment concluded on January 6, 2021.
With each biogas quantity testing, biogas quality was also accessed by feeding 0.5 mL of the biogas through an Agilent 7890A gas chromatograph (GC) to determine the concentration of CH4, carbon dioxide (CO2), and H2S according to the lab’s published protocols (Achi et al. 2020; Lisboa and Lansing, 2013; Witarsa et al., 2020). The GC was set with a thermal conductivity detector (TCD) and the following parameters: injection and detector temperature 250°C, oven temperature 60°C, and 8.6 mL/min flow of He as a carrier gas. After biogas analysis, each bottle was rubber sept was further sealed with silicone to reinforce the self-healing septum and minimize the chance of the leaks. The percentage of CH4 in the biogas was multiplied by its volume to determine the volume of CH4.
Analytical methods
The pH of the reactor fluid was tested on pre- and post-digestion samples using an Accumet Basic AB15 meter. The TS and VS concentrations were measured according to APHA Methods 2540B and 2540E, respectively (APHA et al., 2005). The TS concentration was determined by drying samples at 105°C overnight and comparing sample weight before and after drying. Dried samples were then incinerated at 550°C to determine the VS by comparing the ash weight to the TS weight. Pre-digestion TS and VS values were calculated based on the ratios of the inoculum, algae, and co-digestion feedstocks in the reactors. Post-digestion TS and VS values were measured directly from each reactor. The specific organic acids present were determined via volatile fatty acid (VFA) analysis using a flame ionization detector (FID) on an Agilent 7890A GC. The GC used the following parameters for this analysis: injection temperature 250°C, detector temperature 300°C, oven temperature 106.5°C, and 1.8 mL/min flow of carrier gas (10.6% H, 85.1% air, 4.3% He).
Pre- and post-digestion ammonia (NH4) in the liquid was analyzed using a Lachat Quickchem analyzer. Frozen samples were sent to Agrolab, Inc. (Harrington, DE) for nitrogen (N), phosphorus (P), nitrate (NO3), iron (Fe), sulfur (S), C:N ratio, mineral, and fertility analysis to obtain a complete chemical profile of trace materials present in the influent and effluent.
Data analysis and statistics
All data analysis was done in RStudio. The volume of CH4 was normalized according to two parameters of the experimental design: the mass of organic material (g VS) in the substrate of each reactor (1.667 g) and the total mass of substrate loaded, which varied according to the treatment (Refer to Table 2). The CH4/g VS predicts the efficiency of bioenergy production from an AD substrate, while the CH4/g feedstock predicts how much bioenergy one can expect to gain from digestion of any mass of that substrate fed to an AD reactor.
Statistical analysis was performed using both of these normalized parameters. For Ha1.1, ANOVA was used to find if there is a significant difference in CH4 volume produced between each of the different reactor loads. Tukey’s HSD was used to provide pairwise comparisons for all treatments. For Ha1.2, multiple linear regression was used to determine if a statistically significant relationship exists between the Fe and S content of the algal influent and H2S content of the biogas in each reactor.
Objective 2: Fertilizer production from digester effluent
Lettuce growth experiment
Digested effluent from each treatment was used in an indoor plant growth experiment that concluded in Spring 2022. The purpose of this experiment was to verify the effectiveness and safety of land application of effluent from co-digestion. While AD effluent in MD is typically used to fertilize corn fields in Maryland, buttercrunch lettuce was used as a model organism in this experiment due to its rapid growth and ability to grow in a small, controlled environment. All plant cultivation was conducted at the University of Maryland Research Greenhouse complex at the College Park campus.
The lettuce was grown using 4.5” square plastic pots with rock wool blocks (4.5” cubes from Cultilene) as growth media. All blocks were rinsed and saturated with water prior to use to wash away particles and residues from manufacturing. The pots were arranged with an automatic watering system that delivers 100 mL of water to each pot 1-2 times daily, which was adjusted as needed over the course of the study to maintain moisture in the media. Each block was seeded with two lettuce seeds, watered thoroughly, and allowed to germinate for 48-36 hours. The plants were then allowed to develop for approximately 10 days, until secondary leaves began to show, at which point seedlings were thinned to 1 plant per pot. Fertilization was applied to each pot immediately after thinning, by pipetting 50 mL of fertilizer to the roots of the seedlings. All fertilization tests were tested using four replicate pots. Light was supplied on a 16:8 hour light:dark cycle by the greenhouse’s high-intensity discharge (HID) lamps on a timer. The greenhouse’s automatic climate control was set to maintain a constant temperature of 20°C.
The plants were grown for two months until they reached maturity. When maturity was reached, the automatic watering was stopped 12 hours prior to harvest to allow excess water to drain from the rock wool growth media. Each plant was cut at the point the roots entered the rock wool, massed, and added to a brown paper bag. The bags were then placed in the greenhouse’s drying oven at 50°C for four days until the dry mass of each plant was measured. After the mass of each plant was measured, the replicate plants from each treatment were composited, stored at room temperature inside the drying bags and, sub-samples from each composite were sent to Agrolab in June 2022 for plant tissue analysis.
This method is a revision of the method originally proposed for this fertilization experiment. After preliminary tests of the proposed method in Summer and Fall 2021, the media proposed (perlite) was ineffective in producing healthy seedlings needed for the experimental fertilization period. The revised method using rock wool cube was developed with collaboration from University of Maryland faculty in the Plant Sciences department to create a more conducive environment for seedling growth.
Statistical analysis
All data analysis was done in RStudio. For Ha2.1, ANOVA was used to analyze mean lettuce biomass growth across all treatments, while Tukey’s HSD was used for pairwise comparisons of individual treatments.
Phase I: Batch-scale reactor study
Characterization of Inoculum, Substrates, and Digestate
The algae had the highest moisture content of the four substrates (4.82 ± 0.02% TS, 0.61 ± 0.00% VS), followed by DM (15.4 ± 0.0% TS, 13.3 ± 0.1% VS), FW (45.3 ± 0.3% TS, 43.6 ± 0.2% VS), and PL (71.0 ± 0.1% TS, 50.0 ± 0.3% VS). The algae-only reactors also had the lowest pre-digestion TS and VS (5.62% TS, 1.47% VS) of the mono-substrate treatments due to the high moisture content of the algae in comparison to DM mono-substrate (9.49% TS, 5.80% VS), FW mono-substrate (10.3% TS, 6.47% VS), and PL mono-substrate (11.7% TS, 6.79% VS) reactors.
Due to the low VS concentration in the algae, a larger mass of algae was needed to provide a given mass of VS to reactors where it was a mono- or co-digestion substrate. This effect was most pronounced in the 1:1 co-digestion reactors, for example algae:DM 1:1, where 132.114 g of algae (95% of the total mass of substrate fed to the reactor) was needed to supply the same g VS as just 6.271 g of DM. The result was a clear dilution effect in reactors with larger quantities of algae, with a progressive increase in concentration of TS and VS in co-digestion reactors as the mass of algae added decreased. For example, the highest TS and VS in the FW co-digestion reactors was in algae:FW 1:10 (8.88% TS, 4.95% VS) and the lowest in algae:FW 1:1 (6.49% TS, 2.40% VS) (Table 3).
Post-digestion, the TS of the mono-substrate waste reactors declined by 14.9% (DM), 28.1% (FW) and 19.2% (PL). VS of these same reactors declined by 26.7% (DM), 51.0% (FW), and 28.6% (PL). FW had the highest decline in TS and VS when digested alone, which was expected due to the high digestibility of its component materials (e.g. white bread) and relative lack of complex, hard materials such as plant residues in the DM and poultry remains in the PL. During co-digestion with algae, however, reactors containing DM had similar or higher decline in TS (26.7%-70.0%) and VS (40.0% and 74.4%), indicating that more of the substrate had been utilized to generate bioenergy compared to the DM in the mono-digestion reactors. Similarly, the FW reactor with the highest change in TS and VS was a co-digestion treatment (algae+FW 1:1) with a 48% change in TS and 57.9% change in VS post-digestion. The co-digestion reactors containing PL had similar change in both TS (10.6-16.5%) and VS (24.4%- 31.8% VS) to the mono-substrate PL treatment, indicating that the addition of algae did not increase substrate utilization as it did in most of the the DM and FW reactors.
Table 3: The total solids (TS) and volatile solids (VS) of the lab-scale reactors before and after 62 days of digestion. The initial TS and VS loaded in each reactor was calculated from the data in Table 1, while final the TS and VS values are shown as the mean ± standard error of the triplicate reactors (n=3). DM=Dairy Manure, FW=Food Waste, and PL=Poultry Litter.
|
Treatment |
Initial TS (% wet weight) |
Final TS (% wet weight) |
TS % Change |
Initial VS (% wet weight) |
Final VS (% wet weight) |
VS % Change |
|
Mixed Inoculum |
8.48 |
8.15 ± 0.53 |
-3.89 |
4.53 |
3.99 ± 0.24 |
-11.92 |
|
Algae |
5.62 |
-* |
-* |
1.47 |
-* |
-* |
|
DM |
9.49 |
8.08 ± 0.19 |
-14.9 |
5.80 |
4.25 ± 0.09 |
-26.7 |
|
FW |
10.3 |
7.41 ± 0.97 |
-28.1 |
6.47 |
3.17 ± 0.92 |
-51.0 |
|
PL |
11.7 |
9.45 ± 0.23 |
-19.2 |
6.79 |
4.85 ± 0.13 |
-28.6 |
|
Algae+DM 1:1 |
6.40 |
3.04 ± 2.67 |
-52.5 |
2.35 |
0.94 ± 0.81 |
-60.0 |
|
Algae+DM 1:2 |
6.93 |
2.08 ± 1.55 |
-70.0 |
2.93 |
0.75 ± 0.54 |
-74.4 |
|
Algae+DM 1:5 |
7.79 |
5.71 ± 1.05 |
-26.7 |
3.90 |
2.34 ± 0.43 |
-40.0 |
|
Algae+DM 1:10 |
8.40 |
4.06 ± 1.71 |
-51.7 |
4.58 |
1.90 ± 0.81 |
-58.5 |
|
Algae+FW 1:1 |
6.49 |
3.35 ± 1.55 |
-48.4 |
2.40 |
1.01 ± 0.45 |
-57.9 |
|
Algae+FW 1:2 |
7.09 |
5.83 ± 0.27 |
-17.8 |
3.04 |
1.94 ± 0.12 |
-36.2 |
|
Algae+FW 1:5 |
8.12 |
6.84 ± 0.13 |
-15.8 |
4.14 |
2.68 ± 0.05 |
-35.3 |
|
Algae+FW 1:10 |
8.88 |
7.16 ± 0.16 |
-19.4 |
4.95 |
3.08 ± 0.09 |
-37.8 |
|
Algae+PL 1:1 |
6.70 |
5.99 ± 0.30 |
-10.6 |
2.42 |
1.83 ± 0.09 |
-24.4 |
|
Algae+PL 1:2 |
7.46 |
6.23 ± 0.11 |
-16.5 |
3.08 |
2.10 ± 0.07 |
-31.8 |
|
Algae+PL 1:5 |
8.79 |
7.61 ± 0.23 |
-13.4 |
4.24 |
3.11 ± 0.11 |
-26.7 |
|
Algae+PL 1:10 |
9.78 |
8.70 ± 0.31 |
-11.0 |
5.12 |
3.76 ± 0.08 |
-26.6 |
*No data due to sample storage error.
The pH of the reactors after the inoculum and substrates were combined was consistently neutral or slightly basic in all reactors (7.27-7.47), except the FW reactors, which were slightly acidic pre-digestion (6.32 - 6.85), but the pH in all reactors were basic by the end of the experiment (7.02-7.59) The final pH in co-digestion reactors with a larger proportion of algae were consistently lower, with the reactor digesting algae-only exhibiting almost neutral pH after 62 days of incubation (7.02 ± 0.03) (Table 4).
Table 4: pH of lab-scale reactors before and after 62 days of incubation. Initial pH was n=1, while the final pH is shown as the mean ± standard error of the triplicate reactors (n=3). DM=Dairy Manure, FW=Food Waste, and PL=Poultry Litter.
|
Treatment |
Initial pH |
Final pH |
|
Mixed Inoculum |
7.47 |
7.59 ± 0.03 |
|
Algae |
7.31 |
7.02 ± 0.04 |
|
DM |
7.27 |
7.40 ± 0.03 |
|
FW |
6.58 |
7.57 ± 0.02 |
|
PL |
7.38 |
7.58 ± 0.04 |
|
Algae+DM 1:1 |
7.38 |
7.07 ± 0.02 |
|
Algae+DM 1:2 |
7.30 |
7.20 ± 0.01 |
|
Algae+DM 1:5 |
7.38 |
7.34 ± 0.02 |
|
Algae+DM 1:10 |
7.38 |
7.34 ± 0.01 |
|
Algae+FW 1:1 |
6.85 |
7.11 ± 0.01 |
|
Algae+FW 1:2 |
6.62 |
7.26 ± 0.03 |
|
Algae+FW 1:5 |
6.58 |
7.42 ± 0.03 |
|
Algae+FW 1:10 |
6.32 |
7.47 ± 0.01 |
|
Algae+PL 1:1 |
7.45 |
7.16 ± 0.02 |
|
Algae+PL 1:2 |
7.40 |
7.26 ± 0.01 |
|
Algae+PL 1:5 |
7.33 |
7.48 ± 0.02 |
|
Algae+PL 1:10 |
7.34 |
7.54 ± 0.01 |
Acetic acid was the VFA present in the highest concentration in all reactors (substrate + inoculum) pre-digestion, which indicated that the reactors would be capable of producing CH4 quickly, as acetic acid is the primary organic acid used by methanogenic bacteria. While each reactor had the same quantity of VS added, there was a wide range of VFA concentrations due to the dilution effect of the algae. The algae-only reactor had the lowest concentration of acetic acid (249 ± 4 mg/L) and lowest overall concentration of VFAs (497 mg/L). Valeric acid was lacking from most of the reactors having PL, except for the PL-only reactor (94.0 ± 1.63 mg/L) and algae+PL 1:10 reactors (79.6 mg/L), with valeric acid only detected in a single replicate for the latter. The co-digestion treatments with the lowest volume of algae (algae:DM 1:10, algae:FW 1:10, and algae:PL 1:10) had the highest concentration of VFAs within their respective co-digestion treatment groups. The highest overall VFA concentrations were observed in the DM-only and PL-only reactors, which exceeded 1200 mg/L VFAs. The highest concentration of acetic acid was observed in algae+FW 1:10 (1046 mg/L), which was the only co-digestion treatment to exceed 1200 mg/L total VFAs (1219 mg/L). Post-digestion, concentrations of the four target VFAs were below the detection limit for the method used in all reactors, indicating that the four VFAs had been metabolized by the reactors’ bacteria during anaerobic digestion. No post-digestion data is available for this parameter as a result. (Figure 3).
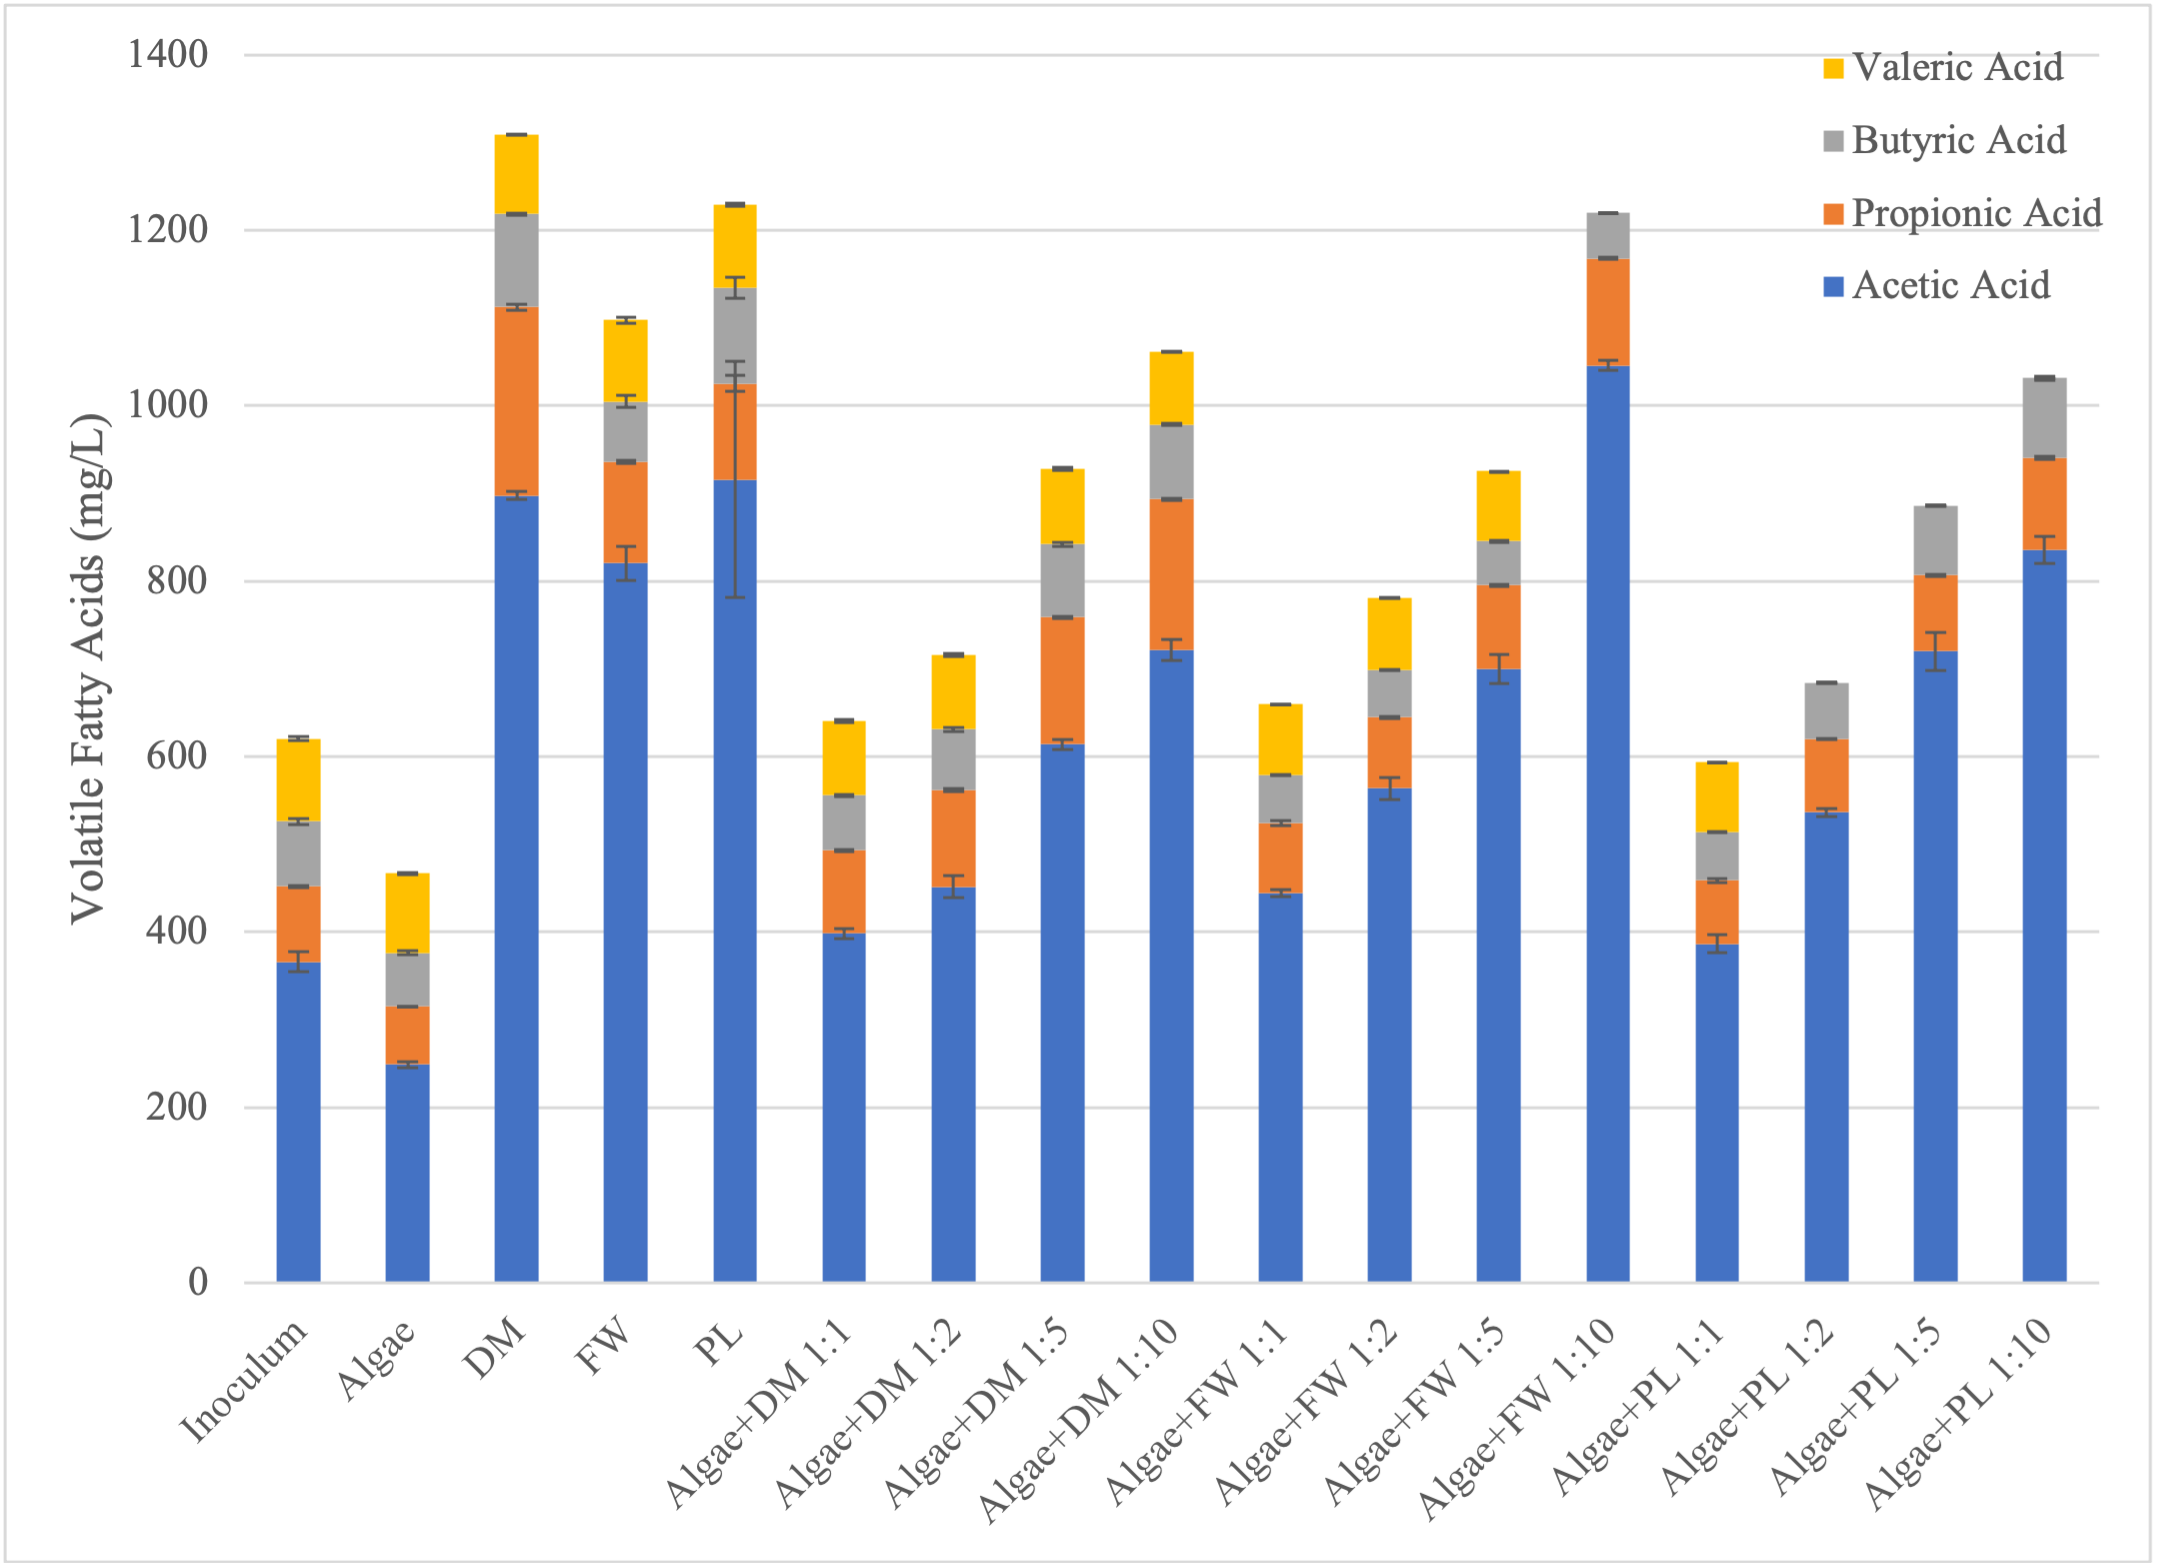
Figure 3: Results of the volatile fatty acid (VFA) analysis on pre-digestion samples from Phase I lab-scale reactor experiment. DM=Dairy Manure, FW=Food Waste, and PL=Poultry Litter.
Of the mono-substrate reactors PL had the highest concentration of NH4 (1650 ± 25 mg N/L) and algae the lowest (325 ± 3 mg N/L). The low concentration of NH4 in the algae-only treatment is especially notable considering the high concentration present in the inoculum that was added to every treatment (1500 ± 29 mg N/L); the addition of algae resulted in a nearly 5-fold dilution in the reactors after mixing with the inoculum. Pre-digestion, the co-digestion reactors containing PL had the highest NH4 concentration overall (682 - 1450 mg/L), followed by the DM reactors (623 - 1030 mg/L), and FW reactors (493 – 1080 mg/L) As with the solids and organic parameters, the concentration of NH4 decreased as the volume of algae in the reactor increased. This was clear as algae+DM 1:1 (623 ± 11 mg/L), algae+FW 1:1 (493±8 mg/L) and algae+PL 1:1 (682 ± 10 (mg/L) having the lowest concentration of NH4 for co-digestion of their respective wastes. Post-digestion, the ammonia concentration increased in all of the reactors, which was expected due to the conversion of organic N to ammonium ions during the AD process. (Table 5).
Table 5: Ammonia (NH4) data from the Phase I lab-scale reactor experiment (n=3). Values given are as mean ± standard error. DM=Dairy Manure, FW=Food Waste, and PL=Poultry Litter.
|
Treatment |
Pre-Digestion NH4 (mg N/L) |
Post-Digestion NH4 (mg N/L) |
|
Mixed Inoculum |
1500 ± 29 |
1800 ± 46 |
|
Algae |
325 ± 3 |
531 ± 9 |
|
DM |
1390 ± 13 |
1850 ± 52 |
|
FW |
1320 ± 30 |
2200 ± 97 |
|
PL |
1650 ± 25 |
2500 ± 31 |
|
Algae+DM 1:1 |
623 ± 11 |
841 ± 33 |
|
Algae+DM 1:2 |
684 ± 4 |
957 ± 30 |
|
Algae+DM 1:5 |
850 ± 21 |
1270 ± 24 |
|
Algae+DM 1:10 |
1030 ± 37 |
1430 ± 73 |
|
Algae+FW 1:1 |
493 ± 8 |
824 ± 29 |
|
Algae+FW 1:2 |
668 ± 8 |
1020 ± 40 |
|
Algae+FW 1:5 |
983 ± 22 |
1480 ± 18 |
|
Algae+FW 1:10 |
1080 ± 23 |
1760 ± 120 |
|
Algae+PL 1:1 |
682 ± 10 |
905 ± 25 |
|
Algae+PL 1:2 |
940 ± 48 |
1060 ± 11 |
|
Algae+PL 1:5 |
1500 ± 67 |
1580 ± 35 |
|
Algae+PL 1:10 |
1450 ± 48 |
1990 ± 90 |
Biogas Production
A summary of biogas and CH4 production data from the batch-scale reactor experiment is provided in Table 6. In addition to the total volume of biogas and CH4 each treatment generated, the results were normalized by both the mass of substrate (i.e. algae and waste) VS fed to each reactor (1.667 g for all treatments) and the total mass of substrate fed to each reactor, which varied; refer to Table 2 for the mass of inoculum and substrates in each treatment. The ratio for each co-digestion refers to the VS of each co-substrate.
Table 6: Summary of biogas and CH4 generation during Phase I batch-scale reactor experiment. All values are the average of data from n= 3 reactors over 62 days of incubation, ± standard error. DM = dairy manure, FW = food waste, PL = poultry litter.
|
Treatment ID |
Total Biogas (mL) |
mL Biogas/g VS |
mL Biogas/ g substrate |
Average CH4 Concentration (%) |
Total CH4 (mL) |
mL CH4/ g VS |
mL CH4/g substrate |
|
Algae |
230 ± 10 |
138 ± 6 |
0.87 ± 0.039 |
54 ± 3.6 |
182 ± 7 |
109 ± 4 |
0.687 ± 0.025 |
|
DM |
897 ± 22 |
538 ± 13 |
71.5 ± 1.8 |
49.8 ± 3 |
498 ± 14 |
299 ± 8 |
39.7 ± 1.1 |
|
FW |
1280 ± 43 |
768 ± 26 |
333 ± 11 |
48.9 ± 4.2 |
640 ± 39 |
384 ± 23 |
166 ± 10 |
|
PL |
927 ± 20 |
556 ± 12 |
278 ± 6 |
53.1 ± 3.3 |
504 ± 12 |
302 ± 7 |
151 ± 4 |
|
Algae+DM 1:1 |
522 ± 29 |
313 ± 17 |
3.77 ± 0.21 |
58.6 ± 3.3 |
422 ± 23 |
253 ± 14 |
3.05 ± 0.17 |
|
Algae+DM 1:2 |
622 ± 4 |
373 ± 2 |
6.45 ± 0.04 |
54.1 ± 3.1 |
424 ± 6 |
255 ± 3 |
4.4 ± 0.06 |
|
Algae+DM 1:5 |
616 ± 90 |
370 ± 54 |
11.3 ± 1.6 |
52.1 ± 3.2 |
391 ± 47 |
235 ± 28 |
7.18 ± 0.86 |
|
Algae+DM 1:10 |
812 ± 10 |
487 ± 6 |
22.9 ± 0.3 |
51.9 ± 3 |
488 ± 5 |
293 ± 3 |
13.8 ± 0.1 |
|
Algae+FW 1:1 |
772 ± 15 |
463 ± 9 |
5.76 ± 0.11 |
57.9 ± 3.1 |
524 ± 10 |
314 ± 10 |
3.91 ± 0.12 |
|
Algae+FW 1:2 |
933 ± 41 |
560 ± 25 |
10.3 ± 0.5 |
56.6 ± 3.7 |
559 ± 33 |
336 ± 20 |
6.17 ± 0.36 |
|
Algae+FW 1:5 |
1240 ± 20 |
746 ± 12 |
26.3 ± 0.4 |
52.8 ± 4.2 |
664 ± 15 |
398 ± 9 |
14 ± 0.3 |
|
Algae+FW 1:10 |
1300 ± 39 |
781 ± 23 |
47.3 ± 1.4 |
51.5 ± 4 |
664 ± 36 |
399 ± 22 |
24.1 ± 1.3 |
|
Algae+PL 1:1 |
488 ± 4 |
293 ± 2 |
3.65 ± 0.03 |
56.6 ± 2.9 |
385 ± 7 |
231 ± 4 |
2.88 ± 0.06 |
|
Algae+PL 1:2 |
525 ± 33 |
315 ± 20 |
5.82 ± 0.36 |
55.7 ± 2.9 |
370 ± 31 |
222 ± 19 |
4.1 ± 0.34 |
|
Algae+PL 1:5 |
715 ± 13 |
429 ± 8 |
15.3 ± 0.3 |
53.5 ± 3.3 |
424 ± 3 |
254 ± 2 |
9.06 ± 0.06 |
|
Algae+PL 1:10 |
786 ± 17 |
472 ± 10 |
29.1 ± 0.6 |
53.2 ± 3.2 |
445 ± 12 |
267 ± 7 |
16 ± 0.5 |
CH4 concentration in the biogas increased at a similar rate for all treatments, with all mono- and co-digestion substrate treatments stabilizing around day 10 of incubation, excluding the inoculum-only control reactor (Figure 4). The CH4 concentration remained above 50% for all of the mono- and co-digestion reactors after this point. The average CH4 concentration was similar for all treatments over the 62 days of incubation (48.9-58.6%). Of the mono-substrate treatments, the algae-only reactors had the highest peak CH4 concentration (73.5%), while the highest of the co-digestion treatments was algae+DM 1:1 (77.3%), nearly 20% higher than peak generation from algae:DM 1:10 treatment (60.1 %). For the DM reactors, the addition of algae appears to have increased the maximum concentration of CH4 in the biogas, which suggests it may yield a biomethane of higher purity for use in energy generation. The FW and PL reactors did not exhibit this trend, however, and peak CH4 concentrations were similar between their respective mono-digestion reactors (FW 72.1%, PL 70.4%) and co-digestion reactors (FW 70.2-73.8%, PL 66.4-70.2%).
Of the four mono-substrate digestion reactors, FW generated the most biogas overall (1280 ± 43 mL) and algae the least (230 ± 10 mL biogas). All but one of the FW co-digestion reactors (algae+FW 1:1) also exceeded biogas production of all the other co-digestion treatments in the study, and the one exception still produced the sixth highest volume of biogas overall (772 ± 15 mL biogas). Algae+FW 1:10 also exceeded biogas production compared to the FW mono-substrate digestion (1300 ± 39 mL biogas), and was the only co-digestion treatment to do so for its respective mono-substrate control. The DM and PL mono-substrate reactors produced similar volumes of biogas (897 ± 22 mL and 927 ± 20 mL, respectively) with each of their respective co-digestion reactors generating less biogas; the degree of decline in biogas production increased with the addition of higher amounts of algae in a treatment. The results of the TS, VS, and VFA analysis suggest that the addition of algae diluted the digestate inside each reactor, and dilution is known to slow anaerobic digestion by reducing the chance for bacteria to contact with the substrates they convert into biogas.
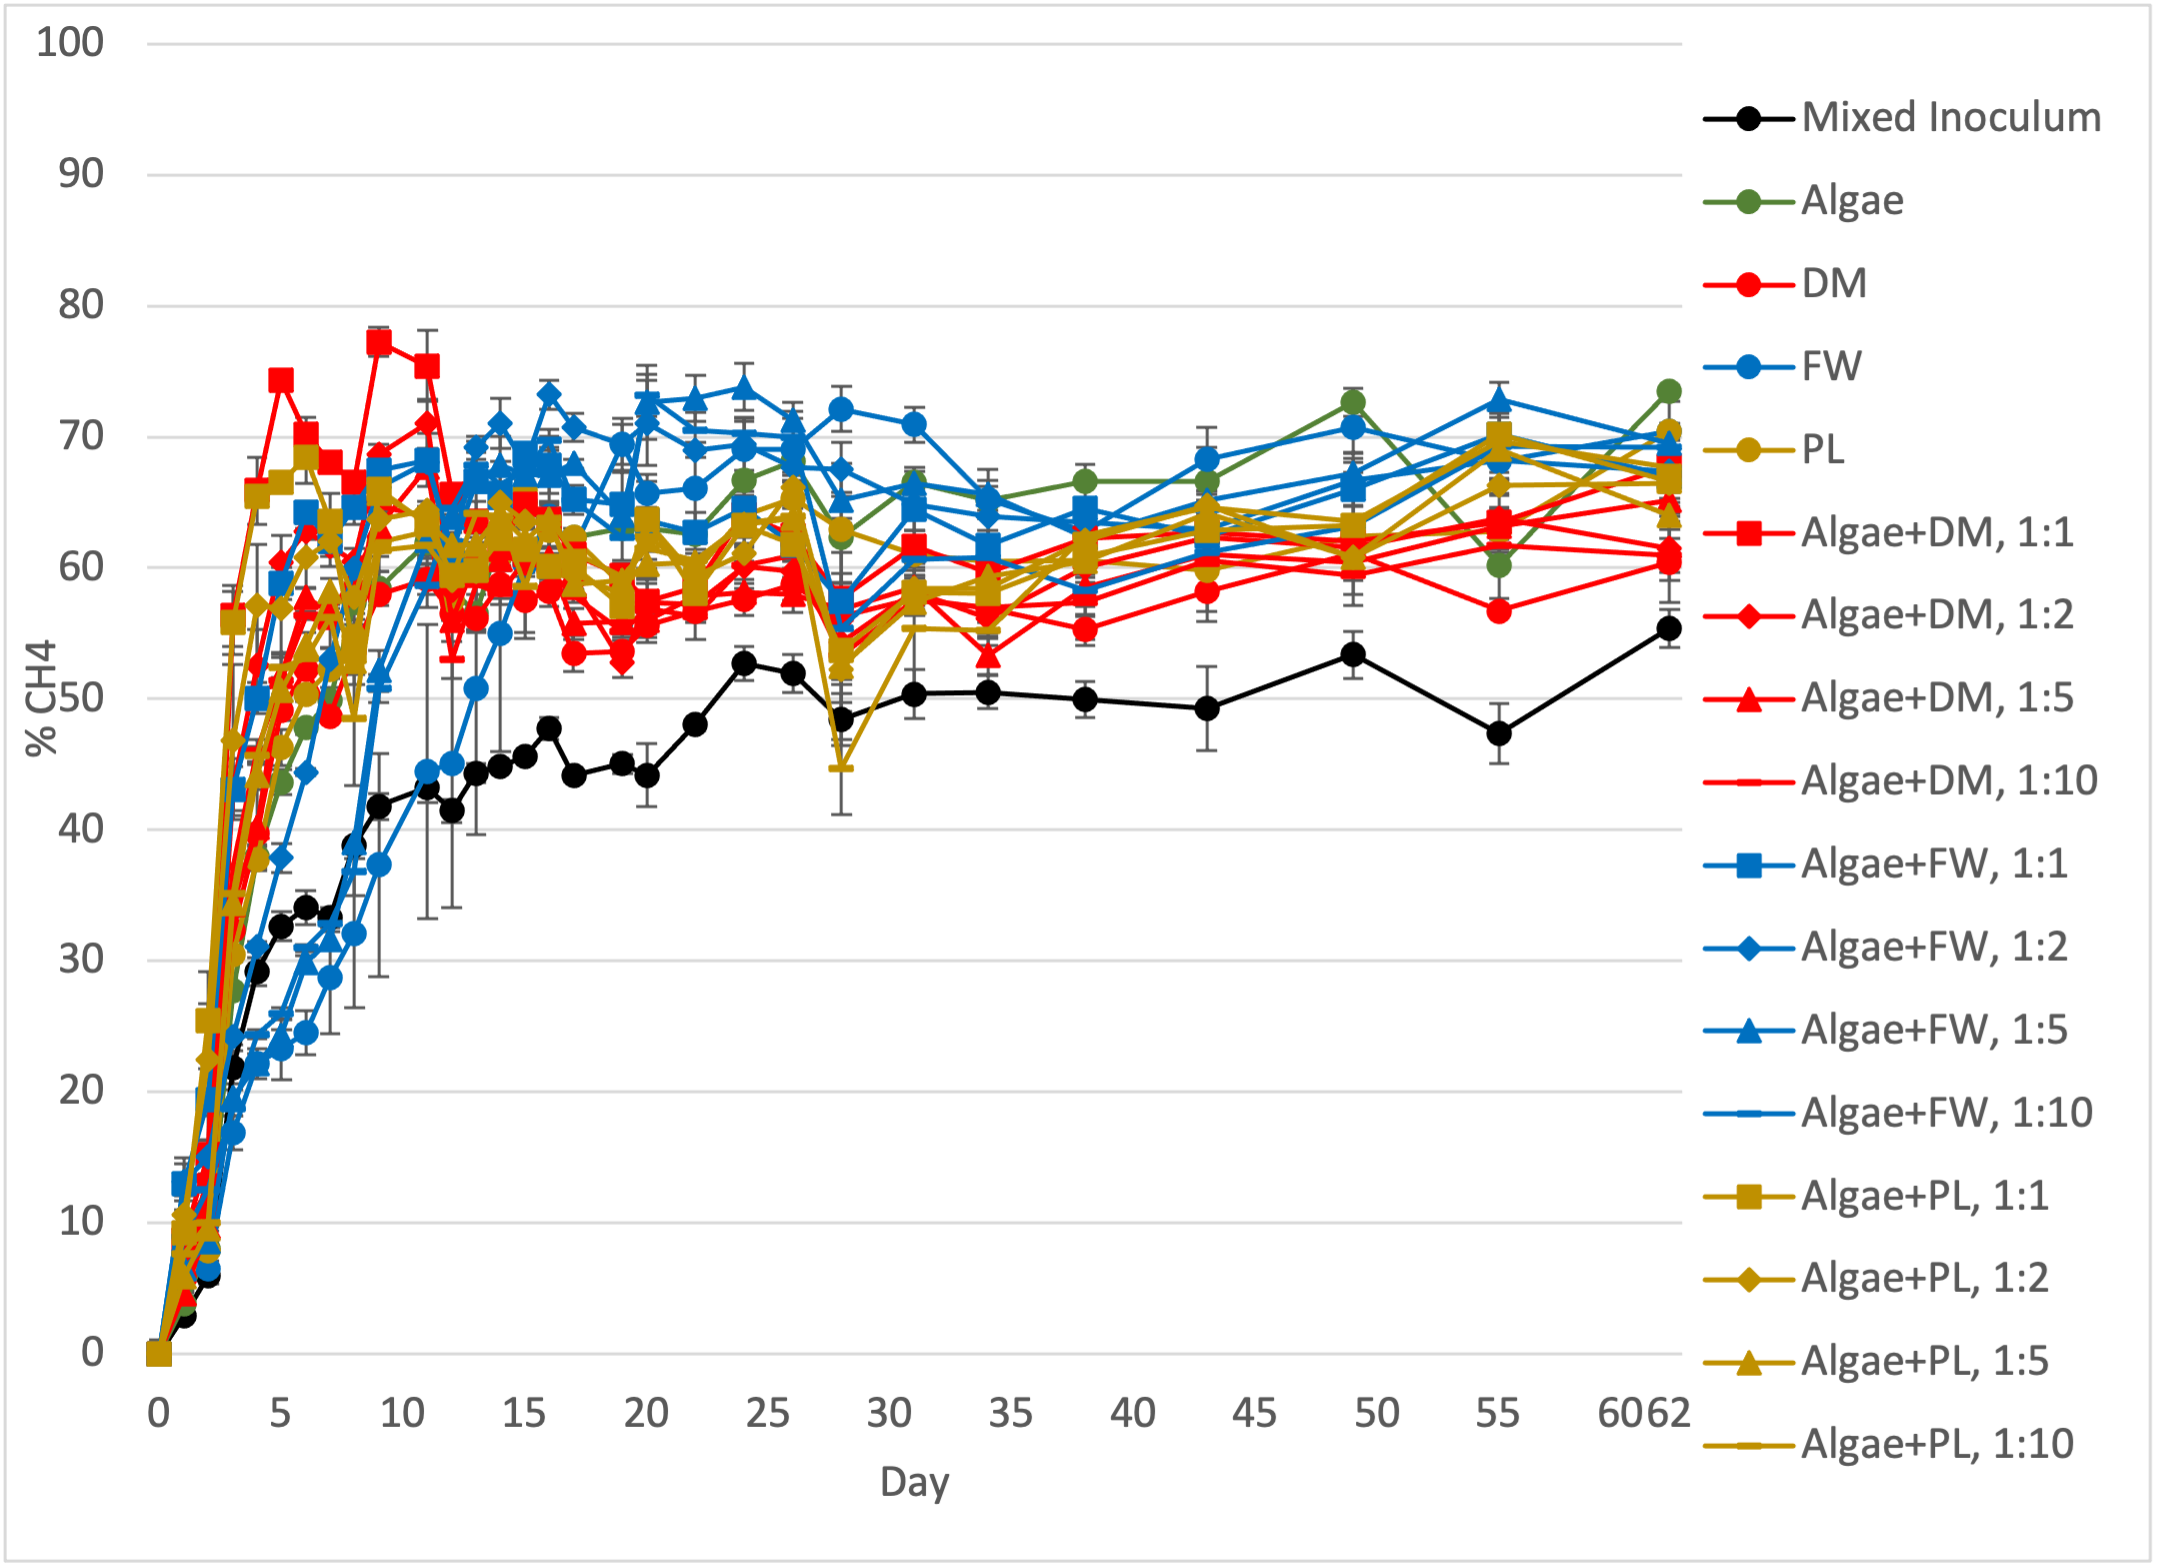
Figure 4: Methane (CH4) concentration in biogas collected from the triplicate feedstock reactors and inoculum reactors in the Phase I lab-scale experiment. The standard error of the triplicate reactors is shown in the error bars. DM=Dairy Manure, FW=Food Waste, and PL=Poultry Litter.
When normalized by g VS fed to the reactors, the algae was the least efficient substrate when digested alone (138 ± 6 mL biogas/g VS; 109 ± 4 mL CH4/g VS). Every other treatment in the study, whether mono-substrate or co-digestion, was significantly more efficient at generating CH4 than the algae-only reactor (p<0.000 for all). This allows the null hypothesis of Ha.1.1. to be rejected, since the addition of a co-digestion feedstock always significantly increased bioenergy generation compared to digestion of algae alone. It may be concluded that incorporating algae into co-digestion is more efficient for obtaining bioenergy from the algal waste.
The FW was also the most efficient mono-substrate waste at generating biogas and bioenergy (768 ± 26 mL biogas/g VS; 384 ± 23 mL CH4/g VS). The FW co-digestion reactors were also highly efficient, with algae+FW 1:10 the most efficient in the entire study (781 ± 23 mL biogas/g VS; 399 ± 22 mL CH4/g VS) and algae+FW 1:5 the second most efficient (746 ± 12 mL biogas/g VS; 398 ± 9 mL CH4/g VS). There was no statistical difference assessed between CH4 generation in the FW mono-substrate reactor and algae+FW 1:10 (p=1.000), algae+FW 1:5 (p=1.000), algae+FW 1:2 (p=0.519), or algae+FW 1:1 (p=0.072) at the 0.05 level of significance. The null hypothesis of Ha.1.1 may be rejected for FW as well, as the addition of algae did not significantly decrease CH4 generation when normalized by VS. This indicates that ATS algae can replace some of the VS FW reactors (up to 1:1 VS ratio) without significantly reducing the efficiency of the reaction.
PL was the second most efficient mono-substrate treatment at generating biogas and bioenergy in when normalized by g VS (556 ± 12 mL biogas/g VS; 302 ± 7). Each of the PL co-digestion was progressively less efficient at generating CH4 as algae was added, but there was no statistically significant difference in production of CH4 between the PL-only and algae+PL 1:10 (p=0.902), algae+PL 1:5 (p=0.538), and algae+PL 1:1 (p=0.062) reactors at the 0.05 level of significance. However, algae+PL 1:2 did have a statistically significant decline in CH4 generation compared to the mono-substrate PL control (p=0.020). The null hypothesis for Ha.1.1. cannot be rejected for PL in terms of efficiency of CH4 generation, as the addition of algae resulted in a significant decline in bioenergy generation when co-digested with poultry litter at a 1:2 ratio. Algae may thus be added to PL digesters for co-digestion without impacting digester efficiency, but it is recommended that it only be added at higher (e.g. 1:10) co-digestion ratios in order to minimize CH4 loss.
Finally, DM was the third most efficient substrate at generating biogas and bioenergy when normalized by g VS (538 ± 13 mL biogas/gVS; 299 ± 8 mL CH4/g VS. The trends in CH4 generation were similar in the DM co-digestion reactors to those of the PL, and overall bioenergy from both treatments was similar per g VS at each co-digestion ratio. However, there was no statistical significance between normalized CH4 generation per g VS between the DM-only, algae+DM 1:10 (p=1.000), algae+DM 1:5 (p=0.139), algae+DM 1:2 (p=0.662), or algae+DM 1:1 (p=0.612) at the 0.05 level of significance. The null hypothesis for Ha.1.1 may be rejected for DM in terms of CH4 generation per g VS. It may thus be concluded that algae may be incorporated in anaerobic digesters processing DM at the loading ratios tested without significantly reducing digester efficiency (Figures 5 and 6).
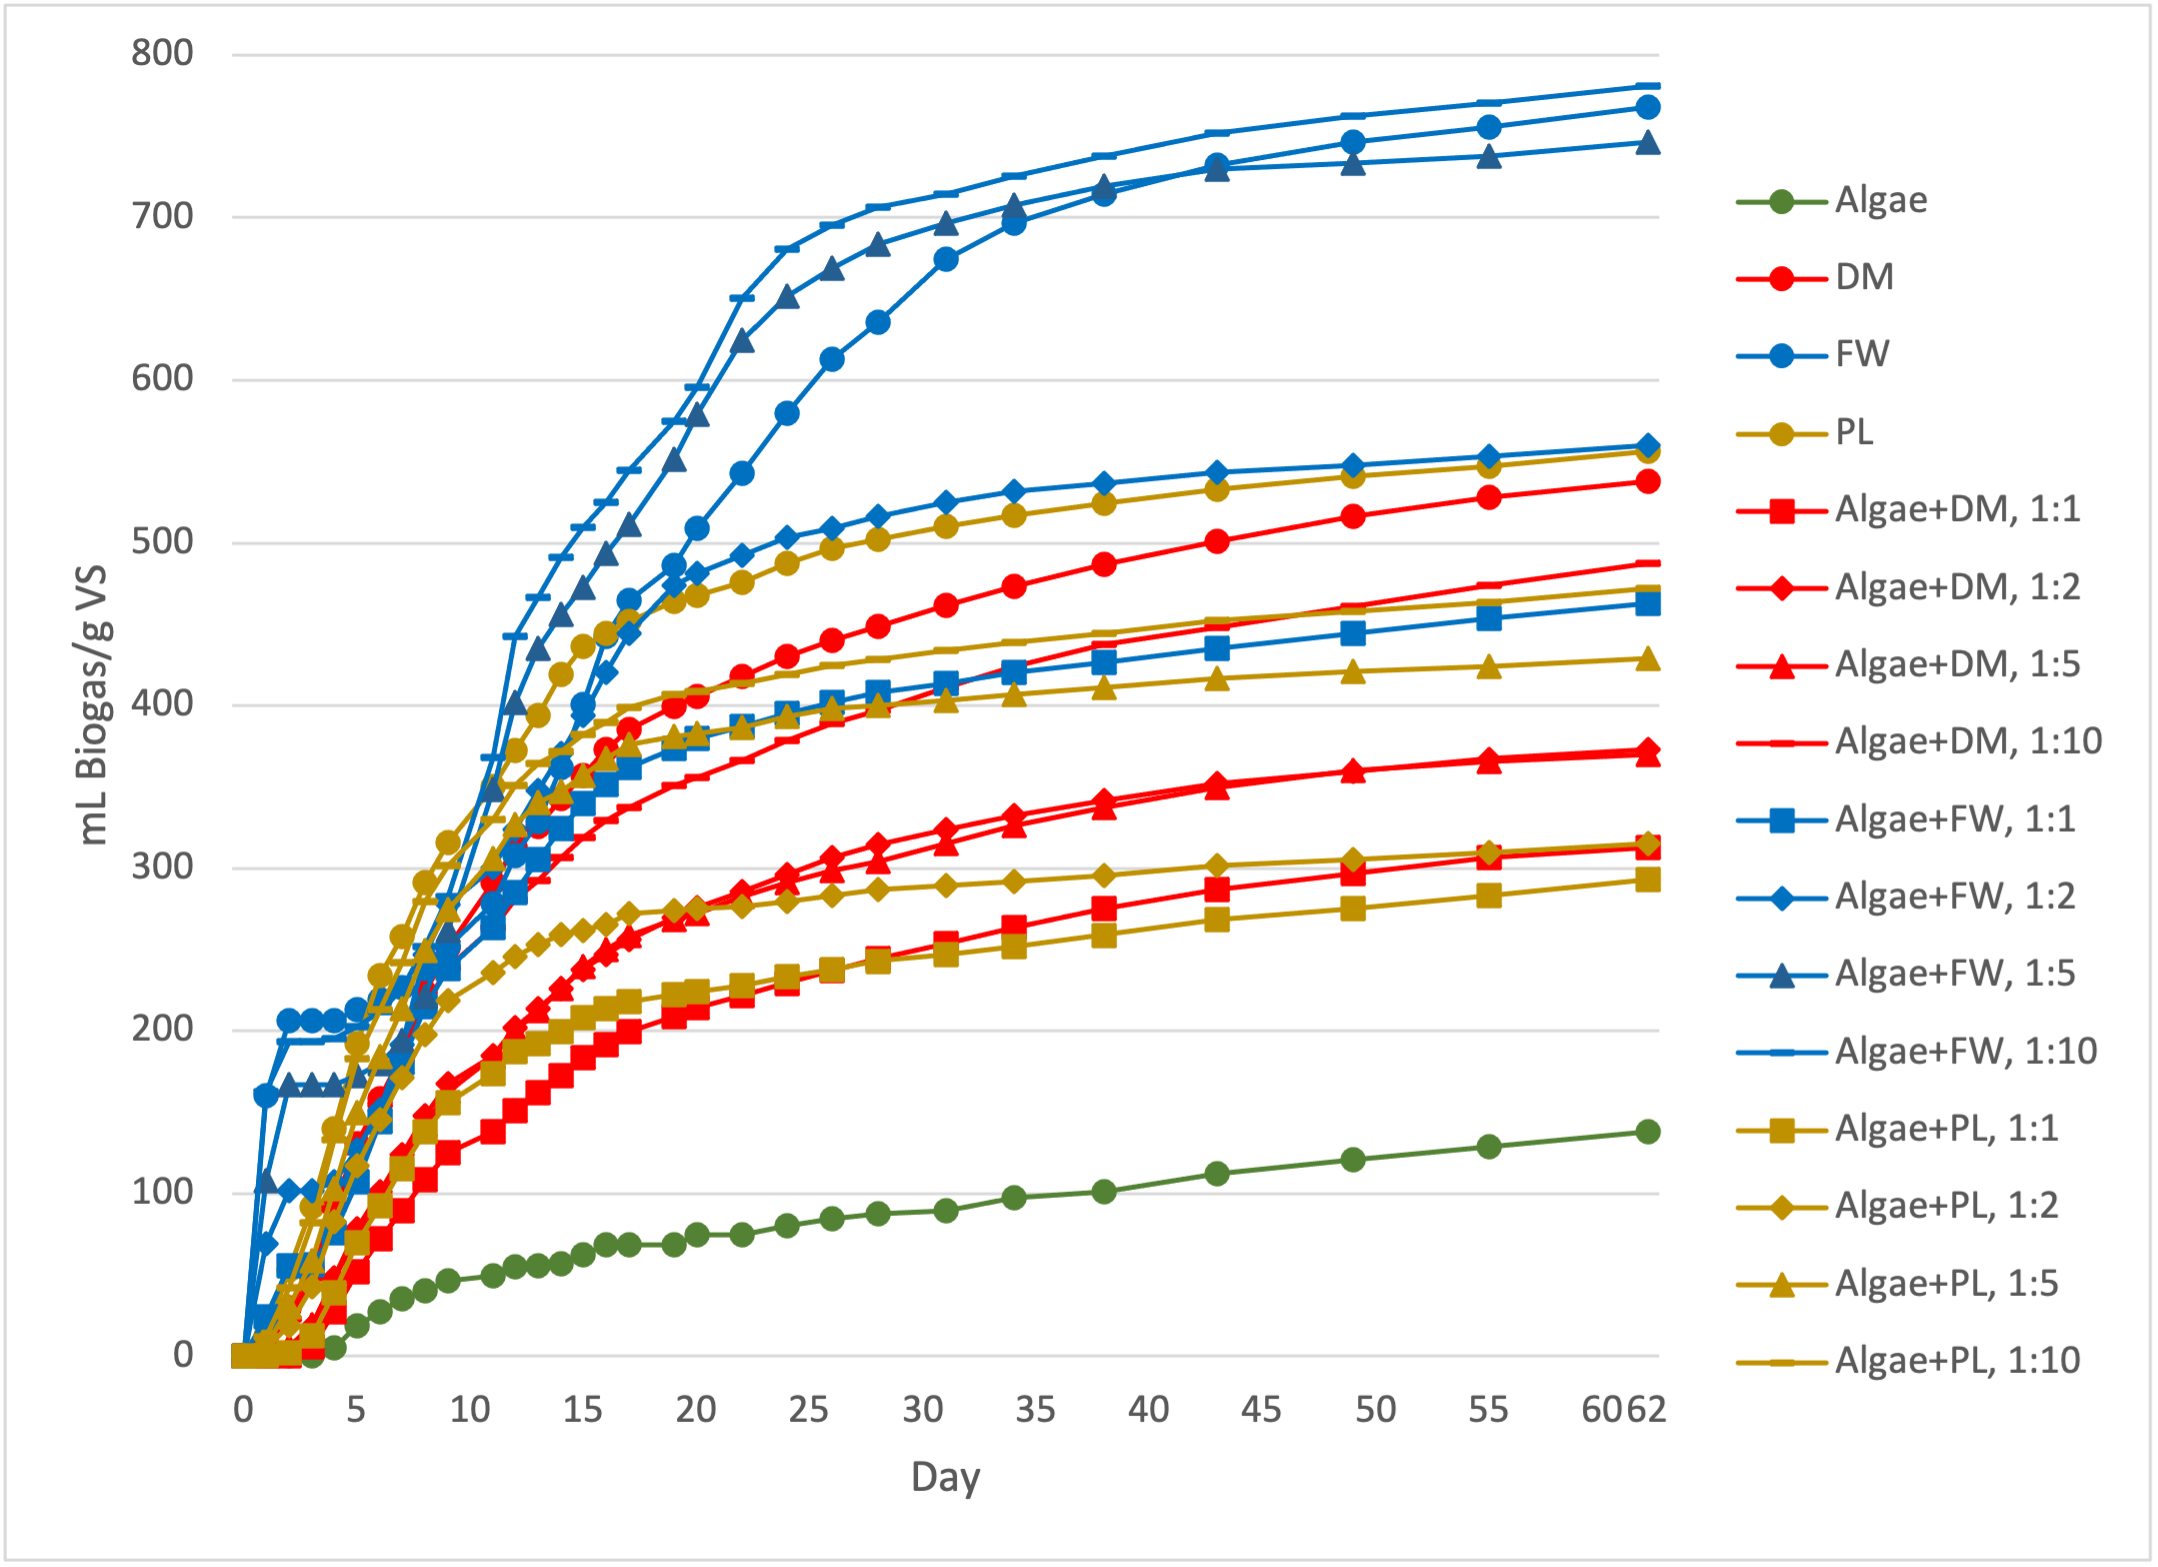
Figure 5: Biogas generated from the batch-scale reactor experiment, normalized by the mass of volatile solids (VS) in the substrate fed to each reactor. The standard error of the triplicate reactors is shown in the error bars. DM=Dairy Manure, FW=Food Waste, and PL=Poultry Litter.
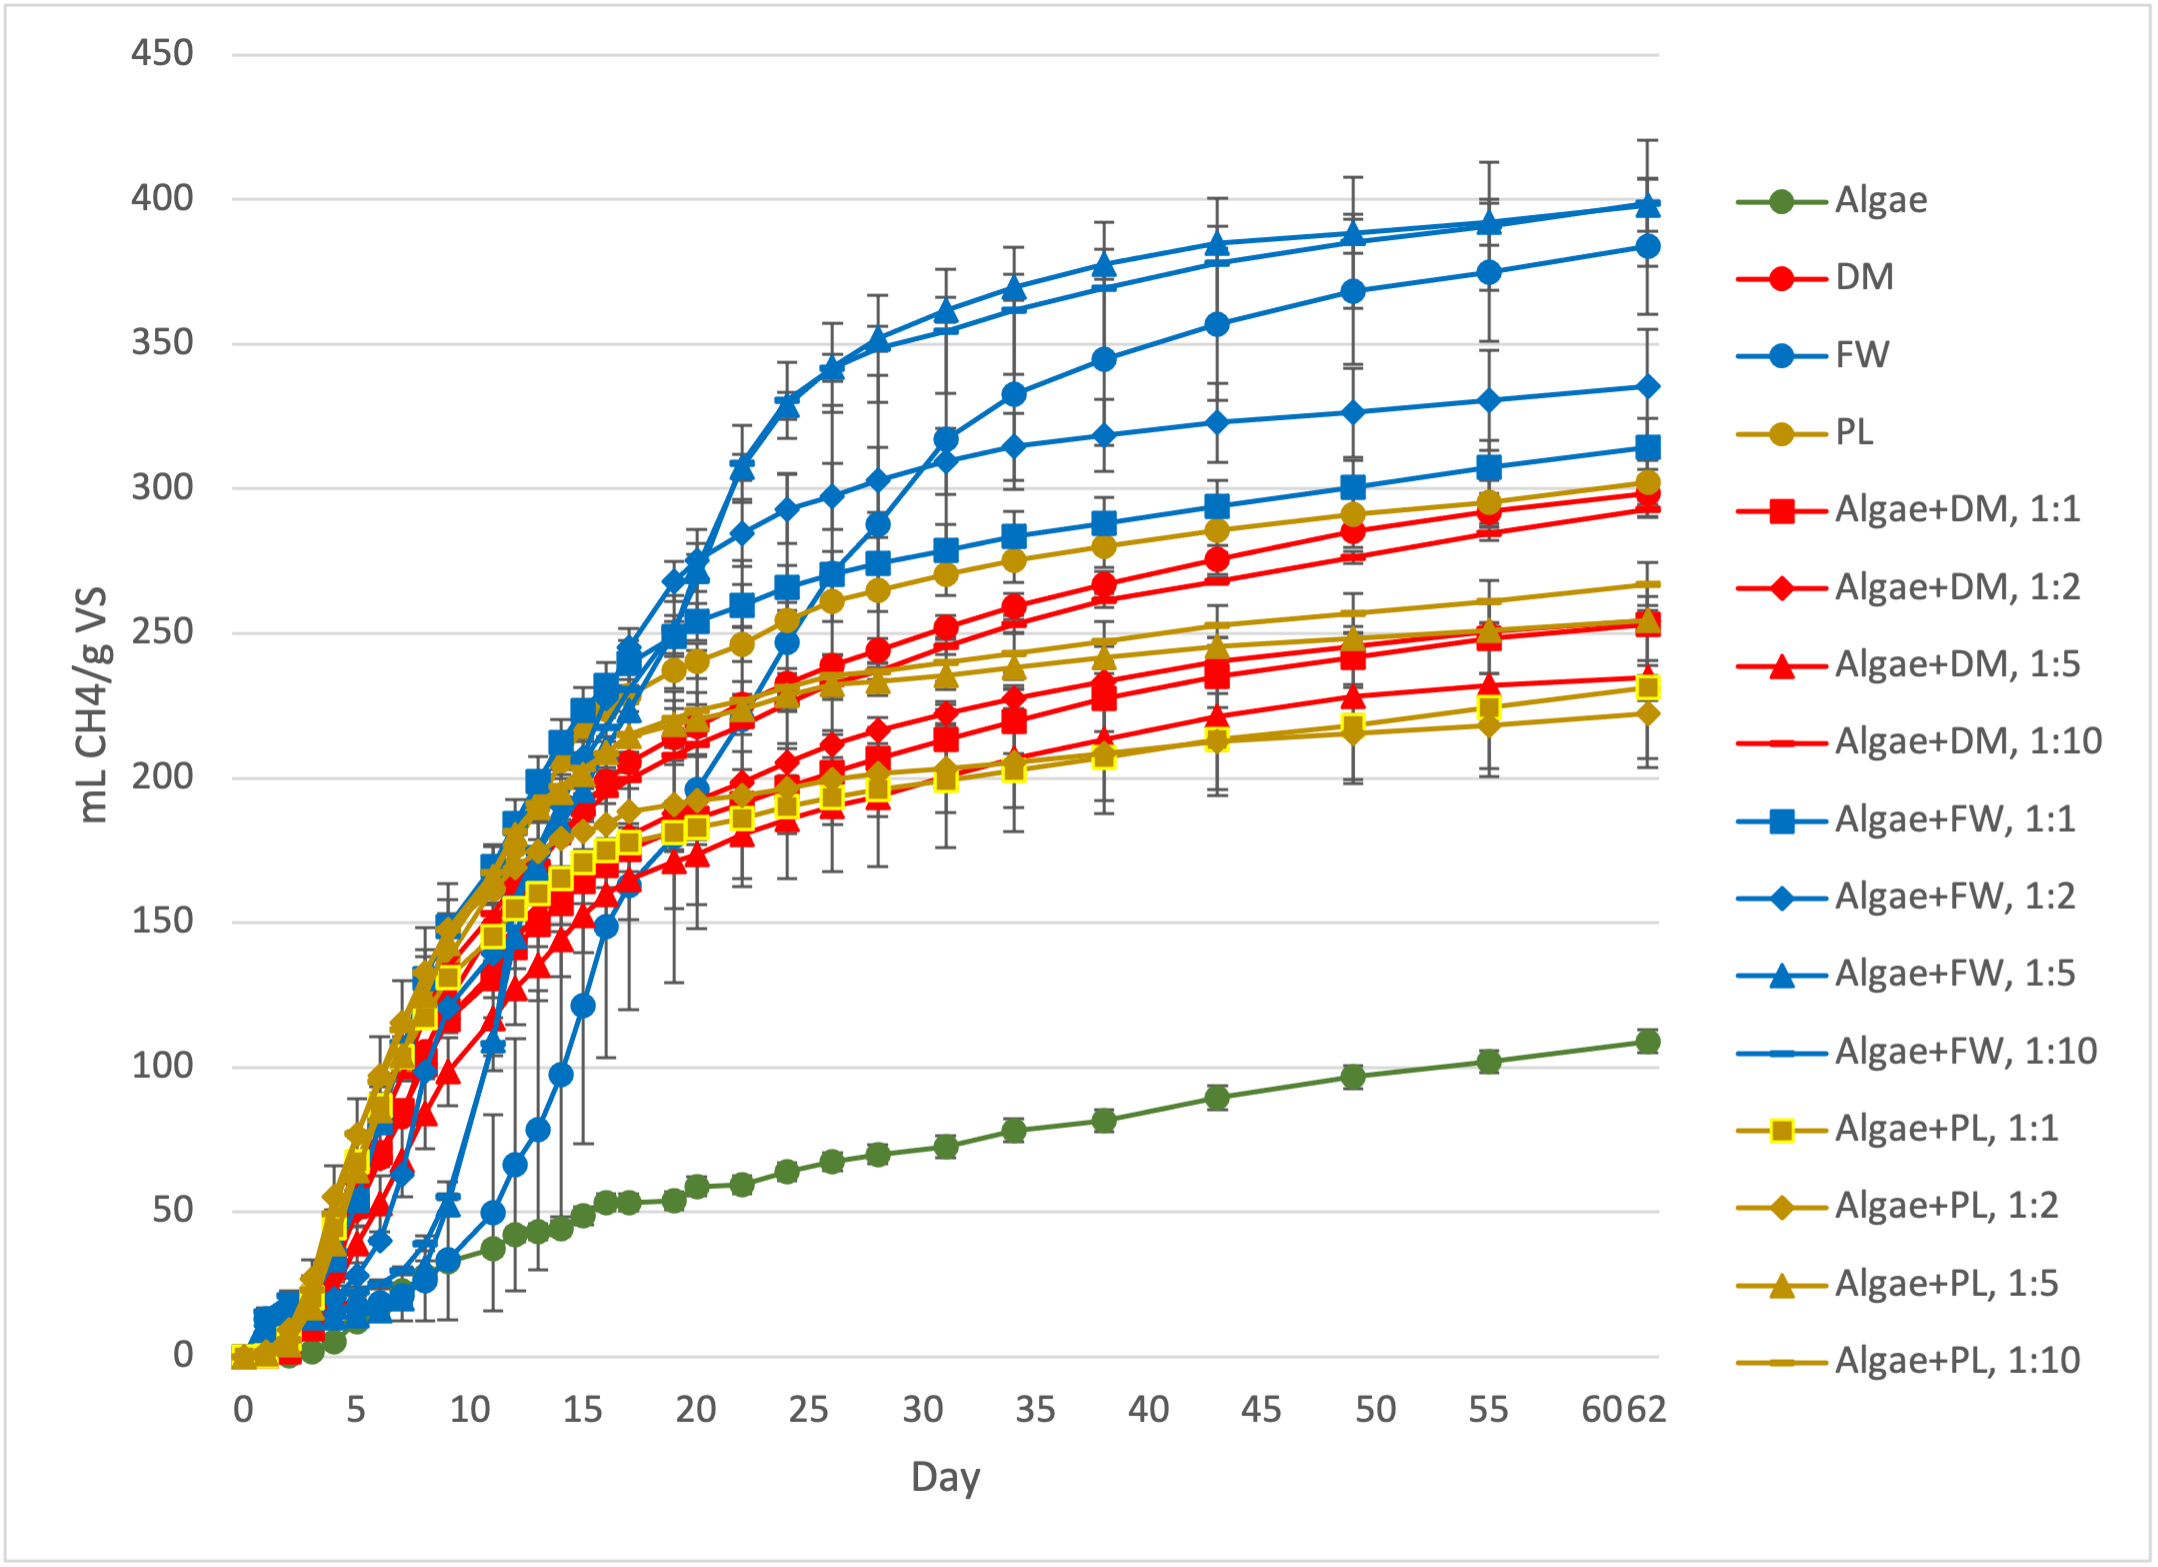
Figure 6: Cumulative methane (CH4) production in the batch-scale reactor experiment, with CH4 production normalized by g volatile solids (VS) of the substrates. The standard error of the triplicate reactors is shown in the error bars. DM=Dairy Manure, FW=Food Waste, and PL=Poultry Litter.
Because the total VS concentration in the substrates varied from 0.61% (algae) to 50.0% (PL), the amount of mass loaded into each reactor varied widely. When the biogas and CH4 data was normalized by total substrate mass, the previously established trends changed greatly (Figures 8 and 9). FW mono-substrate was the most efficient in terms of both biogas (47.3 ± 1.4 mL biogas/g substrate) and CH4 (166 ± 10 mL CH4/g substrate) generation, followed by PL (278 ± 6 mL biogas/g substrate and 151 ± 4 mL CH4/g substrate) and DM (71.5 ± 1.8 mL biogas/g substrate and 39.7 ± 1.1 mL biogas/g substrate). Algae was an order of magnitude lower than these (0.87 ± 0.039 mL biogas/g substrate and 0.687 ± 0.025 mL CH4/g substrate), reflecting its low VS concentration relative to the other wastes. The high mass of the algae needed to achieve the desired co-digestion ratios resulted in all of the co-digestion reactors yielding far lower biogas (≤47.3 mL biogas/g substrate) and CH4 (≤24.1 mL CH4/g substrate) depending on the treatment.
Co-digestion of algae yielded significantly less CH4 per mass of substrate than FW (p<0.000), DM (p<0.000), and PL (p<0.000) at the 0.05 level of significance. Additionally, the addition of algae as a co-digestion feedstock significantly reduced CH4 yield per mass substrate at 1:1, 1:2, 1:5, and 1:10 co-digestion loading ratios for all three wastes studied (p<0.000 for all). The results of this analysis suggest that the high moisture content of algae results in very little CH4 gain per mass of waste processed in a digester relative to conventional wastes, which is of practical and logistical concern for farmers who would have to process ATS algal waste in their established digesters (Figures 7 and 8).
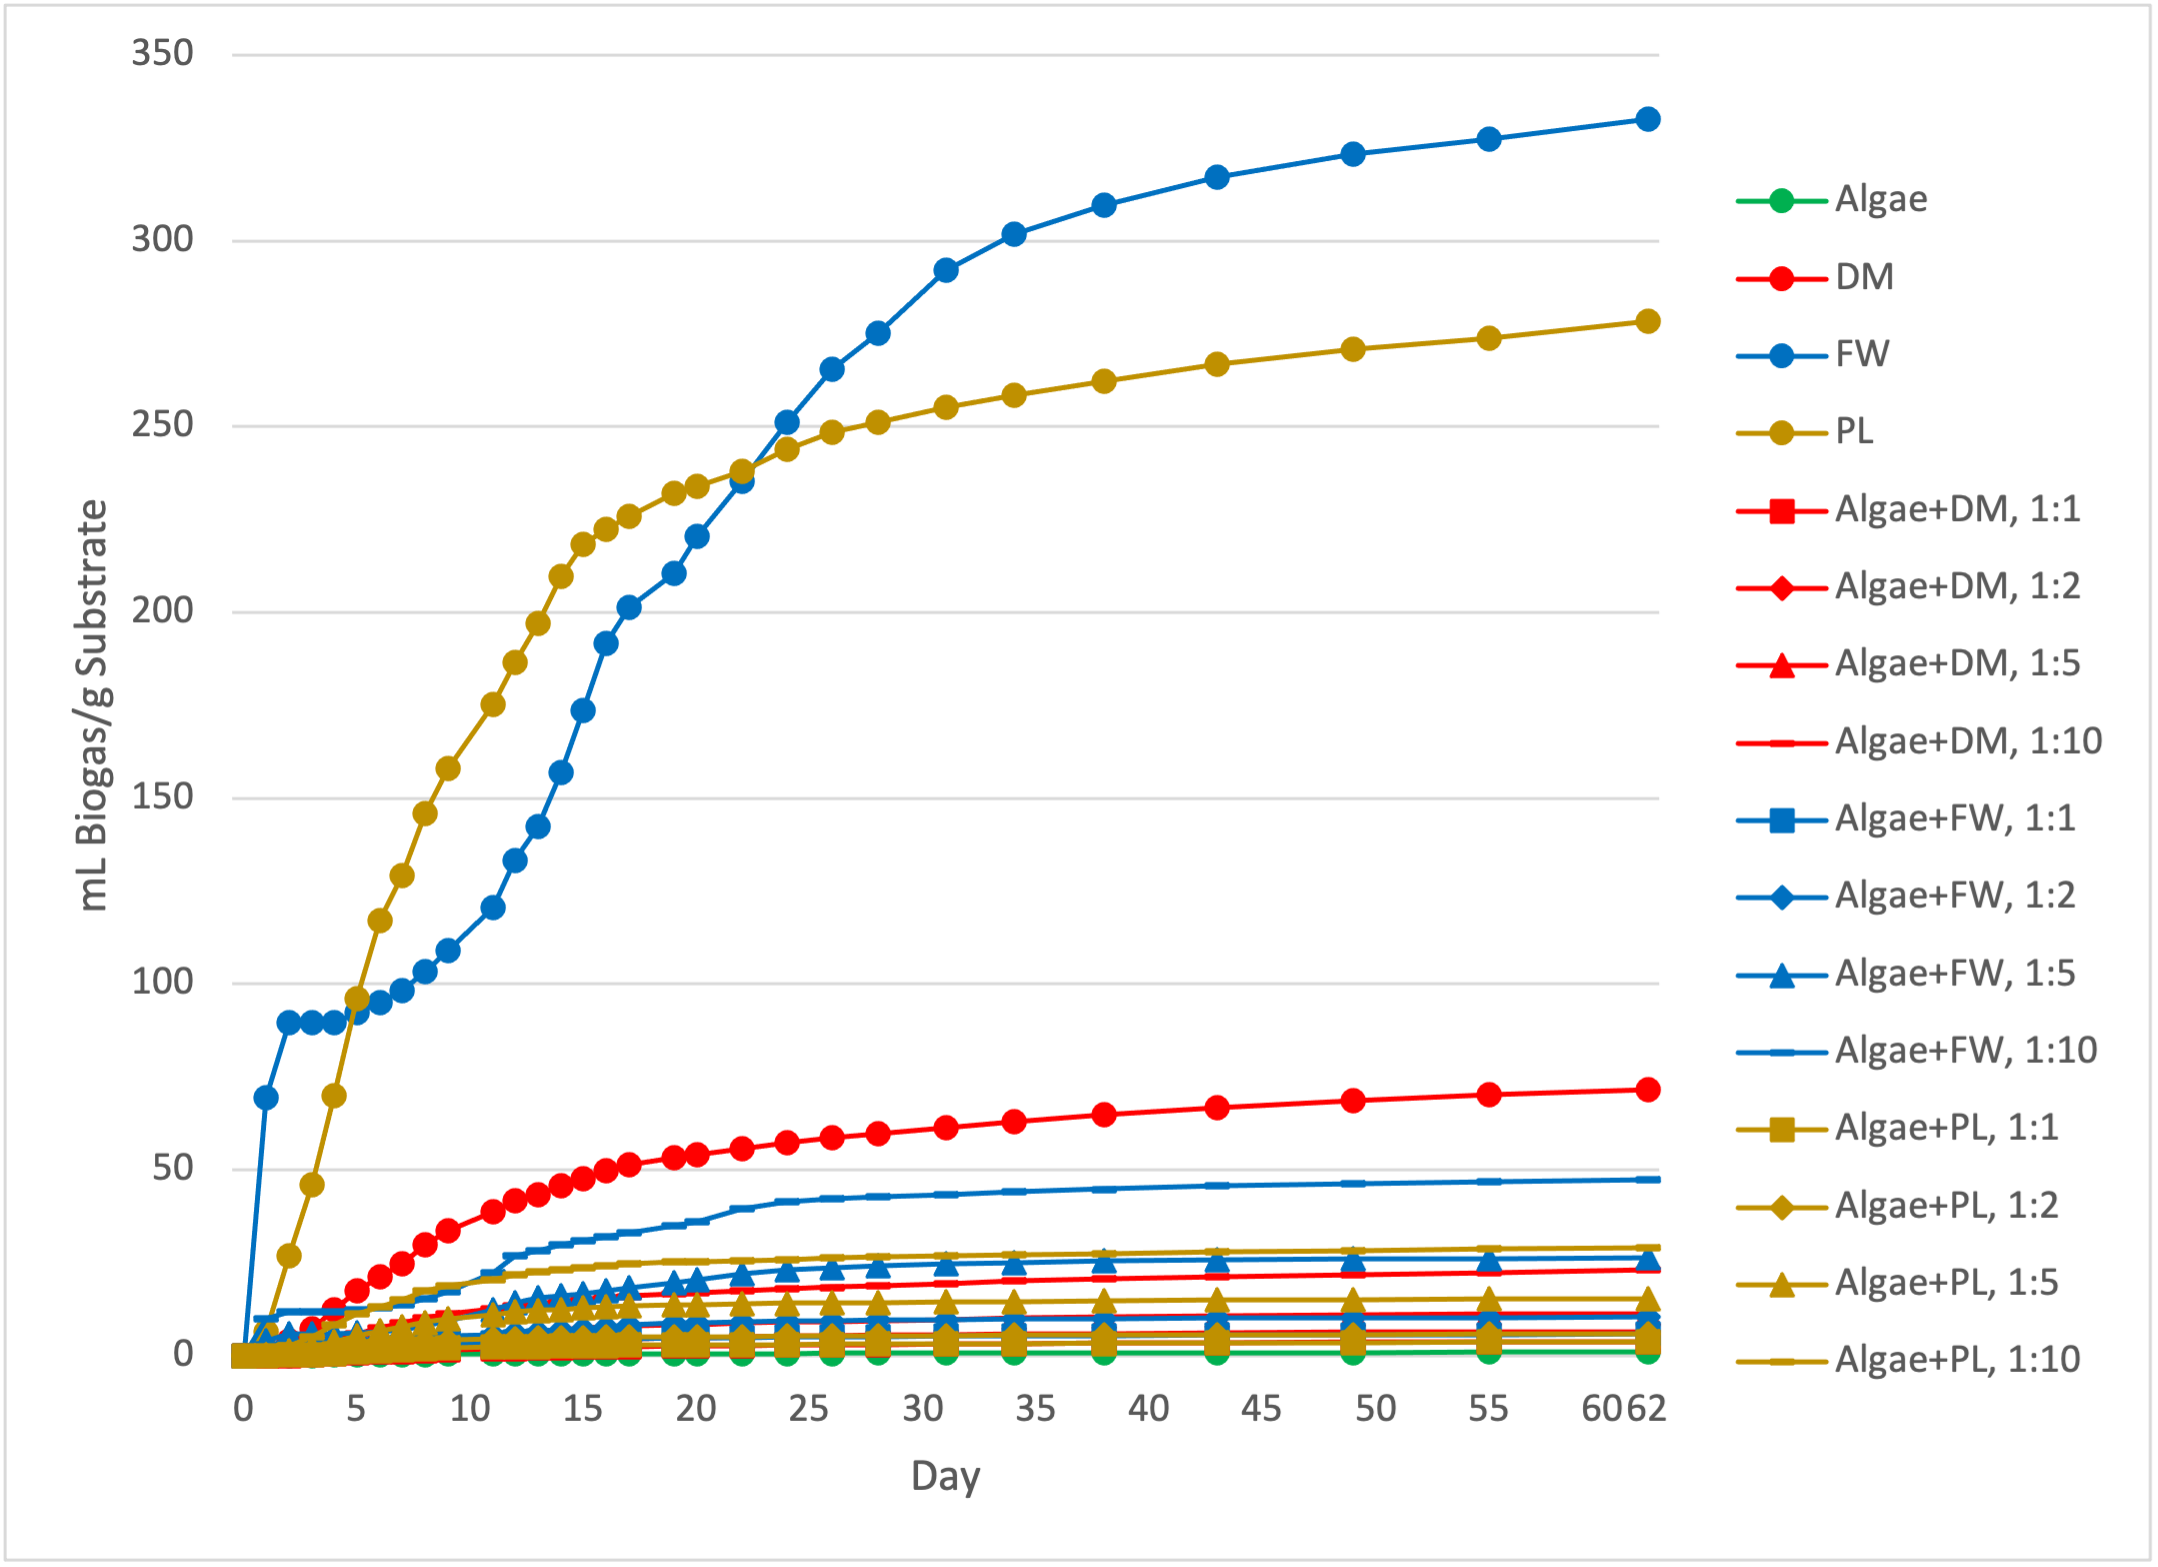
Figure 7: Cumulative biogas generated from the batch-scale reactor experiment, normalized by the total mass of substrate material fed to each reactor. The standard error of the triplicate reactors is shown in the error bars. DM=Dairy Manure, FW=Food Waste, and PL=Poultry Litter.
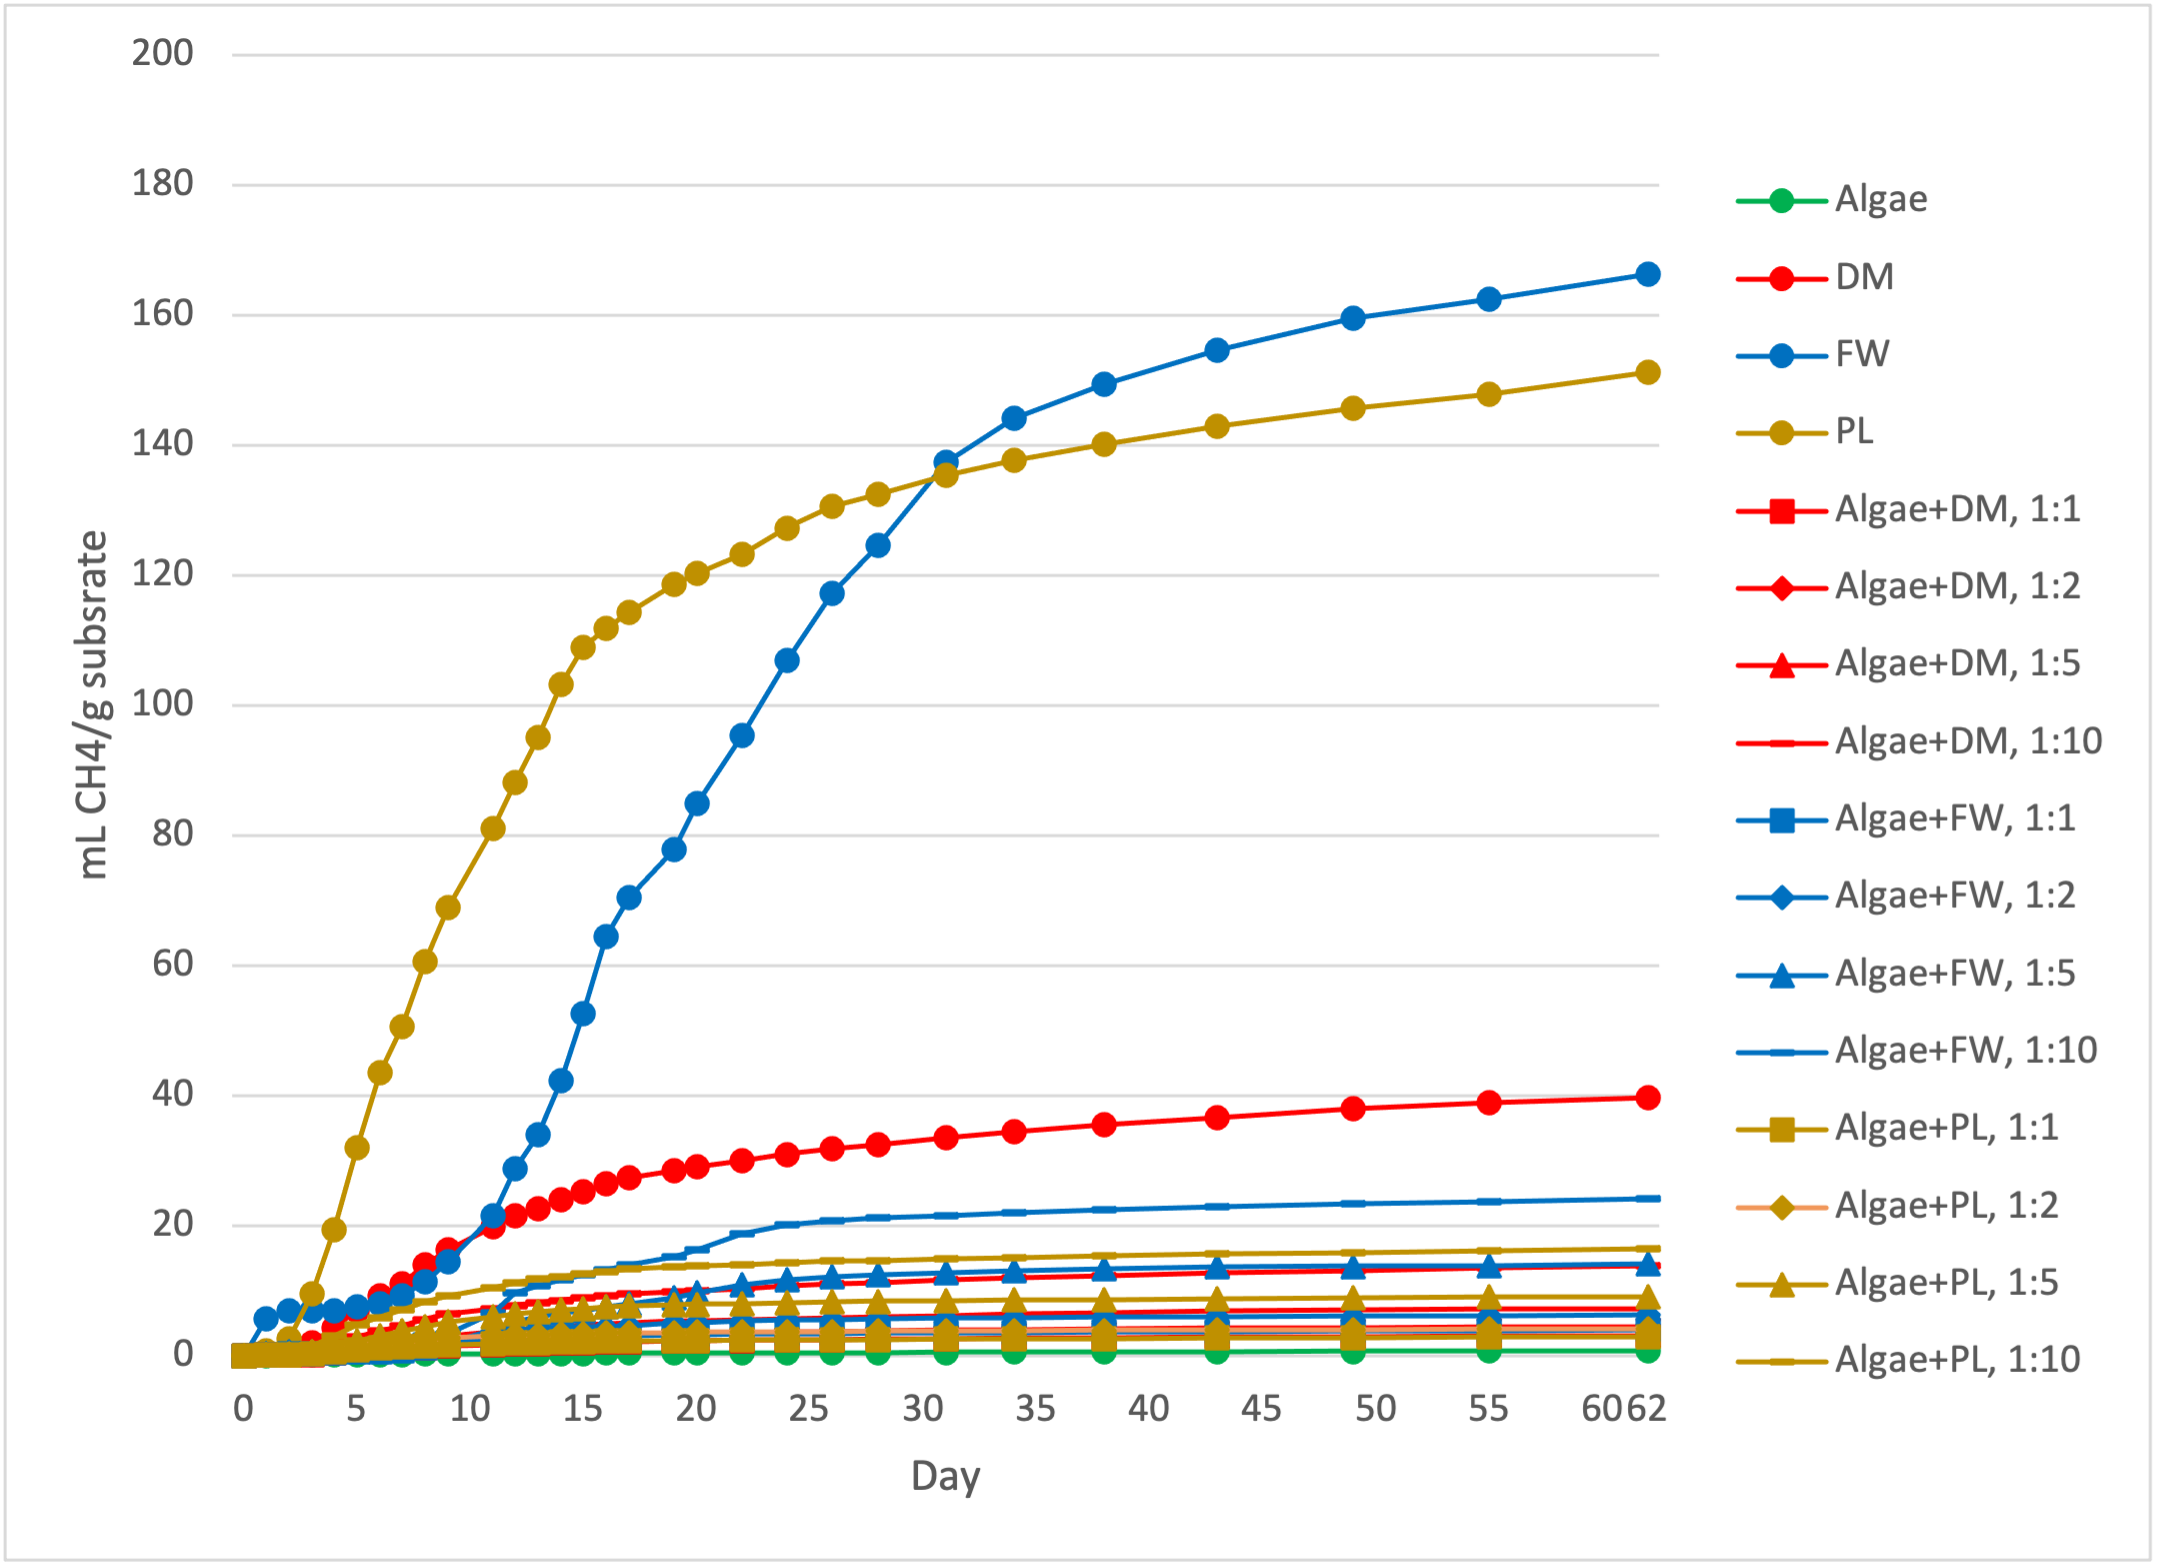
Figure 8: Cumulative methane (CH4) production in the batch-scale reactor experiment, with CH4 production normalized by g of substrate fed to each reactor. The standard error of the triplicate reactors is shown in the error bars. DM=Dairy Manure, FW=Food Waste, and PL=Poultry Litter.
Hydrogen sulfide was not detected in any of the reactors in Phase I. The inoculum had a high iron concentration (2420 mg Fe/L pre-digestion and 5150 mg Fe/L post-digestion). This inoculum was a mixture of our lab-based food waste digester (no iron addition) with waste water treatment digestate with iron oxide flocculants added prior to digestion. The iron in the inoculum suppressed H2S generation independently of iron present in the algae. The use of this inoculum source prevented hypothesis H.1.2, which tested if the iron in the algae could suppress H2S production, from being answered for this experiment.
Phase II: Lettuce Growth Study
Fertilizer analysis
The results of C:N ratio indicated that the algae had the highest C:N ratio (56.6) followed by DM (20.5), FW (24.7), PL (11.7), and the inoculum (10.5). The fertility analyses included NH4, total N, P (as P2O5) and K (as K2O). NH4 was previously analyzed on fresh, acidifed samples immediately after the Phase I digestion experiments, but it was re-analyzed on frozen, unacidified samples sent to Agrolab. The post-digestion effluents were set aside to be used as fertilizer in Phase II, so they could not be acidified to prevent NH4 loss by volatilization prior to freezing (Tables 7 and 8). The post-freezing (non-acidified values) from were used to determine the dilution rate for the lettuce growth experiments.
Table 7: Nutrient profile of pre-digestion reactors from the Phase I batch-scale reactor experiments, analyzed after freezing. Data provided by Agrolab (Harrington, DE). DM=Dairy Manure, FW=Food Waste, and PL=Poultry Litter.
|
Treatment |
NH4+ (mg N/L) |
Total N (mg N/L) |
P (mg P2O5/L) |
K (mg K2O/L) |
NPK Ratio* |
|
Mixed Inoculum |
601 |
2660 |
2160 |
1480 |
2:1:1 |
|
Algae |
197 |
463 |
537 |
804 |
1:1:2 |
|
DM |
497 |
1340 |
2510 |
2520 |
1:2:2 |
|
FW |
469 |
1550 |
2780 |
1870 |
1:2:1 |
|
PL |
7220 |
7220 |
1840 |
2760 |
4:1:1 |
|
Algae+DM 1:1 |
114 |
855 |
989 |
931 |
1:1:1 |
|
Algae+DM 1:2 |
526 |
1390 |
731 |
973 |
2:1:1 |
|
Algae+DM 1:5 |
536 |
1470 |
682 |
1080 |
2:1:2 |
|
Algae+DM 1:10 |
330 |
1980 |
1970 |
1320 |
1:1:1 |
|
Algae+FW 1:1 |
350 |
448 |
698 |
865 |
1:2:2 |
|
Algae+FW 1:2 |
394 |
551 |
505 |
958 |
1:1:2 |
|
Algae+FW 1:5 |
510 |
2930 |
1320 |
1180 |
2:1:1 |
|
Algae+FW 1:10 |
552 |
3160 |
1500 |
1220 |
3:1:1 |
|
Algae+PL 1:1 |
413 |
2490 |
683 |
1130 |
4:1:2 |
|
Algae+PL 1:2 |
509 |
662 |
928 |
1250 |
1:1:2 |
|
Algae+PL 1:5 |
638 |
3570 |
1650 |
1540 |
2:1:1 |
|
Algae+PL 1:10 |
718 |
2630 |
2150 |
1780 |
1:1:1 |
*Calculated using Total N, P2O5, and K2O data.
Table 8: NPK profile of composite effluents from Phase I batch-scale reactor experiments, analyzed after freezing. Data provided by Agrolab (Harrington, DE). DM=Dairy Manure, FW=Food Waste, and PL=Poultry Litter.
|
Treatment |
NH4+ (mg N/L) |
Total N (mg N/L) |
P (mg P2O5/L) |
K (mg K2O/L) |
NPK Ratio* |
|
Mixed Inoculum |
790 |
3790 |
4550 |
1180 |
3:4:1 |
|
Algae |
319 |
460 |
497 |
648 |
1:1:1 |
|
DM |
764 |
3300 |
3510 |
1390 |
2:3:1 |
|
FW |
866 |
5590 |
3660 |
1280 |
4:3:1 |
|
PL |
870 |
4100 |
4580 |
2170 |
2:2:1 |
|
Algae+DM 1:1 |
534 |
1270 |
1370 |
844 |
2:2:1 |
|
Algae+DM 1:2 |
694 |
2170 |
1700 |
1020 |
2:2:1 |
|
Algae+DM 1:5 |
633 |
2360 |
2580 |
1080 |
2:2:1 |
|
Algae+DM 1:10 |
420 |
2930 |
3060 |
1180 |
2:3:1 |
|
Algae+FW 1:1 |
519 |
1710 |
1560 |
861 |
2:2:1 |
|
Algae+FW 1:2 |
580 |
2080 |
1810 |
865 |
2:2:1 |
|
Algae+FW 1:5 |
778 |
2420 |
2890 |
1024 |
2:3:1 |
|
Algae+FW 1:10 |
854 |
3200 |
2720 |
1160 |
3:2:1 |
|
Algae+PL 1:1 |
574 |
1350 |
1780 |
1050 |
1:2:1 |
|
Algae+PL 1:2 |
682 |
1870 |
1720 |
1230 |
2:1:1 |
|
Algae+PL 1:5 |
874 |
3370 |
3010 |
1520 |
2:2:1 |
|
Algae+PL 1:10 |
931 |
4050 |
3360 |
1690 |
2:2:1 |
*Calculated using Total N, P2O5, and K2O data.
It was determined that a NH4 loss of 27.5 - 70.6% occurred while the samples were in frozen storage. NH4 volatilization from liquid samples occurs at neutral pH, so samples are typically acidified before freezing to prevent this, but in this experiment acidification could not be performed because the effluents would be re-used in the lettuce growth experiment. The lowest NH4 loss was observed in the algae-only mono-substrate reactor (27.5%) while the highest NH4 loss was in algae+DM 1:10 (70.6%). Reactors containing higher volumes of algae appear to have retained NH4 better, as the 1:1 co-digestion reactors for each substrate consistently had better retention then their respective reactors containing less algae.
Elemental Analysis
The algae-only reactor contained the lowest concentration of all analytes except for Al (260 mg/L pre-digestion, 307 mg/L post-digestion) (Tables 9 and 10). This was expected due to the presence of diatoms such as Melosira sp. in the algal culture, as they are characterized by their cell walls (i.e. frustules) containing aluminum and silica.
Iron was the analyte with the highest concentration overall compared to the other analytes and was relatively high in the inoculum-only reactor (2420 mg Fe/L pre-digestion and 5150 mg Fe/L post-digestion). The iron can bind with the S in the reactors during digestion, suppressing H2S generation in the biogas by forming the solid precipitate iron sulfide. The concentration of S did not appear to change pre-and post-digestion, indicating it was retained in the effluent rather than converted to gaseous H2S. The Ca and S were the analytes with the next highest concentration in all reactors both pre- and post-digestion. Both are crucial micronutrients for plant growth and were monitored in Phase II for their effect on the lettuce biomass development.
Table 9: Results of metal and sulfur analysis, pre-digestion samples. Data provided by Agrolab (Harrington, DE). DM=Dairy Manure, FW=Food Waste, and PL=Poultry Litter.
|
Treatment |
S (mg/L) |
Ca (mg/L |
Mg (mg/L) |
Na (mg/L) |
Zn (mg/L) |
Fe (mg/L) |
Mn (mg/L) |
Cu (mg/L) |
B (mg/L) |
Al (mg/L) |
|
Mixed Inoculum |
859 |
1140 |
266 |
270 |
29.2 |
2420 |
16.8 |
15 |
4.5 |
146 |
|
Algae |
223 |
425 |
177 |
97.3 |
11.6 |
1060 |
116 |
4.1 |
1.8 |
260 |
|
DM |
951 |
1520 |
431 |
383 |
40.8 |
2600 |
23.7 |
18.5 |
4.6 |
191 |
|
FW |
919 |
1790 |
385 |
467 |
38.9 |
3320 |
23.1 |
19.2 |
6.2 |
193 |
|
PL |
1070 |
1170 |
362 |
551 |
27.9 |
1550 |
20.6 |
18.7 |
4.1 |
113 |
|
Algae+DM 1:1 |
361 |
665 |
227 |
147 |
18.2 |
1540 |
114 |
7.5 |
2.7 |
284 |
|
Algae+DM 1:2 |
386 |
579 |
205 |
202 |
12.7 |
999 |
60.4 |
5 |
1.9 |
161 |
|
Algae+DM 1:5 |
485 |
574 |
221 |
256 |
11.9 |
817 |
33.1 |
4.8 |
1.6 |
113 |
|
Algae+DM 1:10 |
676 |
1170 |
320 |
321 |
30.6 |
2260 |
55.9 |
13.8 |
4.4 |
209 |
|
Algae+FW 1:1 |
309 |
618 |
199 |
147 |
12.2 |
1170 |
90.7 |
4.8 |
2 |
214 |
|
Algae+FW 1:2 |
330 |
639 |
192 |
199 |
7.7 |
870 |
55.4 |
3 |
1.5 |
112 |
|
Algae+FW 1:5 |
541 |
1120 |
273 |
299 |
18.5 |
1840 |
64.8 |
8.5 |
3.4 |
186 |
|
Algae+FW 1:10 |
607 |
1270 |
284 |
357 |
20.7 |
2110 |
52.6 |
9.5 |
3.9 |
169 |
|
Algae+PL 1:1 |
354 |
496 |
199 |
164 |
12.5 |
1010 |
78.2 |
5.8 |
1.8 |
209 |
|
Algae+PL 1:2 |
451 |
622 |
227 |
232 |
16 |
1210 |
76.4 |
8.1 |
2.4 |
213 |
|
Algae+PL 1:5 |
712 |
963 |
297 |
331 |
25.8 |
1870 |
71.8 |
14 |
4 |
225 |
|
Algae+PL 1:10 |
834 |
1200 |
324 |
391 |
33 |
2220 |
61.8 |
19.2 |
4.8 |
227 |
Table 10: Results of metal and sulfur analysis, post-digestion samples. Data provided by Agrolab (Harrington, DE). DM=Dairy Manure, FW=Food Waste, and PL=Poultry Litter.
|
Treatment |
S (mg/L) |
Ca (mg/L |
Mg (mg/L) |
Na (mg/L) |
Zn (mg/L) |
Fe (mg/L) |
Mn (mg/L) |
Cu (mg/L) |
B (mg/L) |
Al (mg/L) |
|
Mixed Inoculum |
981 |
2160 |
357 |
298 |
298 |
5150 |
35.5 |
33.7 |
9.9 |
307 |
|
Algae |
108 |
424 |
150 |
82.5 |
82.5 |
988 |
97.1 |
3.7 |
1.7 |
246 |
|
DM |
777 |
2040 |
381 |
389 |
389 |
3820 |
31.5 |
25.6 |
7.3 |
227 |
|
FW |
761 |
1780 |
319 |
404 |
404 |
4150 |
28.4 |
27.3 |
7.7 |
246 |
|
PL |
1010 |
2300 |
481 |
505 |
505 |
4590 |
45.8 |
42.6 |
9.6 |
279 |
|
Algae+DM 1:1 |
304 |
886 |
257 |
180 |
180 |
2220 |
159 |
10.1 |
3.9 |
427 |
|
Algae+DM 1:2 |
366 |
1030 |
281 |
223 |
223 |
2380 |
129 |
12.3 |
4.3 |
363 |
|
Algae+DM 1:5 |
558 |
1450 |
331 |
266 |
266 |
3270 |
111 |
19 |
6.1 |
360 |
|
Algae+DM 1:10 |
677 |
1740 |
367 |
303 |
303 |
3690 |
91.3 |
22.5 |
6.5 |
350 |
|
Algae+FW 1:1 |
344 |
941 |
268 |
186 |
186 |
2560 |
179 |
12.1 |
4.4 |
465 |
|
Algae+FW 1:2 |
380 |
1010 |
261 |
220 |
220 |
2620 |
136 |
13.5 |
4.6 |
386 |
|
Algae+FW 1:5 |
606 |
1460 |
320 |
294 |
294 |
3800 |
128 |
22.1 |
6.8 |
416 |
|
Algae+FW 1:10 |
604 |
1380 |
301 |
348 |
348 |
3440 |
82 |
21.2 |
6.2 |
319 |
|
Algae+PL 1:1 |
421 |
2520 |
330 |
248 |
248 |
2660 |
178 |
17.1 |
4.9 |
502 |
|
Algae+PL 1:2 |
410 |
1840 |
307 |
283 |
283 |
2330 |
143 |
16.7 |
4.4 |
398 |
|
Algae+PL 1:5 |
691 |
1590 |
372 |
341 |
341 |
3490 |
127 |
27.2 |
6.8 |
389 |
|
Algae+PL 1:10 |
768 |
1690 |
375 |
394 |
394 |
3600 |
92.8 |
29.9 |
7.3 |
329 |
Due to the sodium (82.5-505 mg/L Na) and high NH4 concentrations in the post-digestion effluents, dilution was required to prevent the salt from impacting lettuce growth in Phase II (and field conditions in the soil environment contain this dilution). The NH4+ data from Agrolab was as the target metric for dilution, due to its bioavailabilty. An 8-fold dilution was done on the composite effluent from each reactor to achieve a final NH4 of ~90-100 mg/L N for the Phase II fertilizers. While this would not be the case for effluents with low NH4 (i.e. the algae-only treatment), the same dilution factor was selected for all treatments to maintain the unique profile of other trace metals and nutrients present in each.
Lettuce growth analysis
Preliminary tests of the methods planned for Phase II were conducted between June and October 2021. The methods were revised due to preliminary testing that showed rock wool cubes were a better media substrate for lettuce compared to perlite. The final experimental setup is pictured in Figure 9.
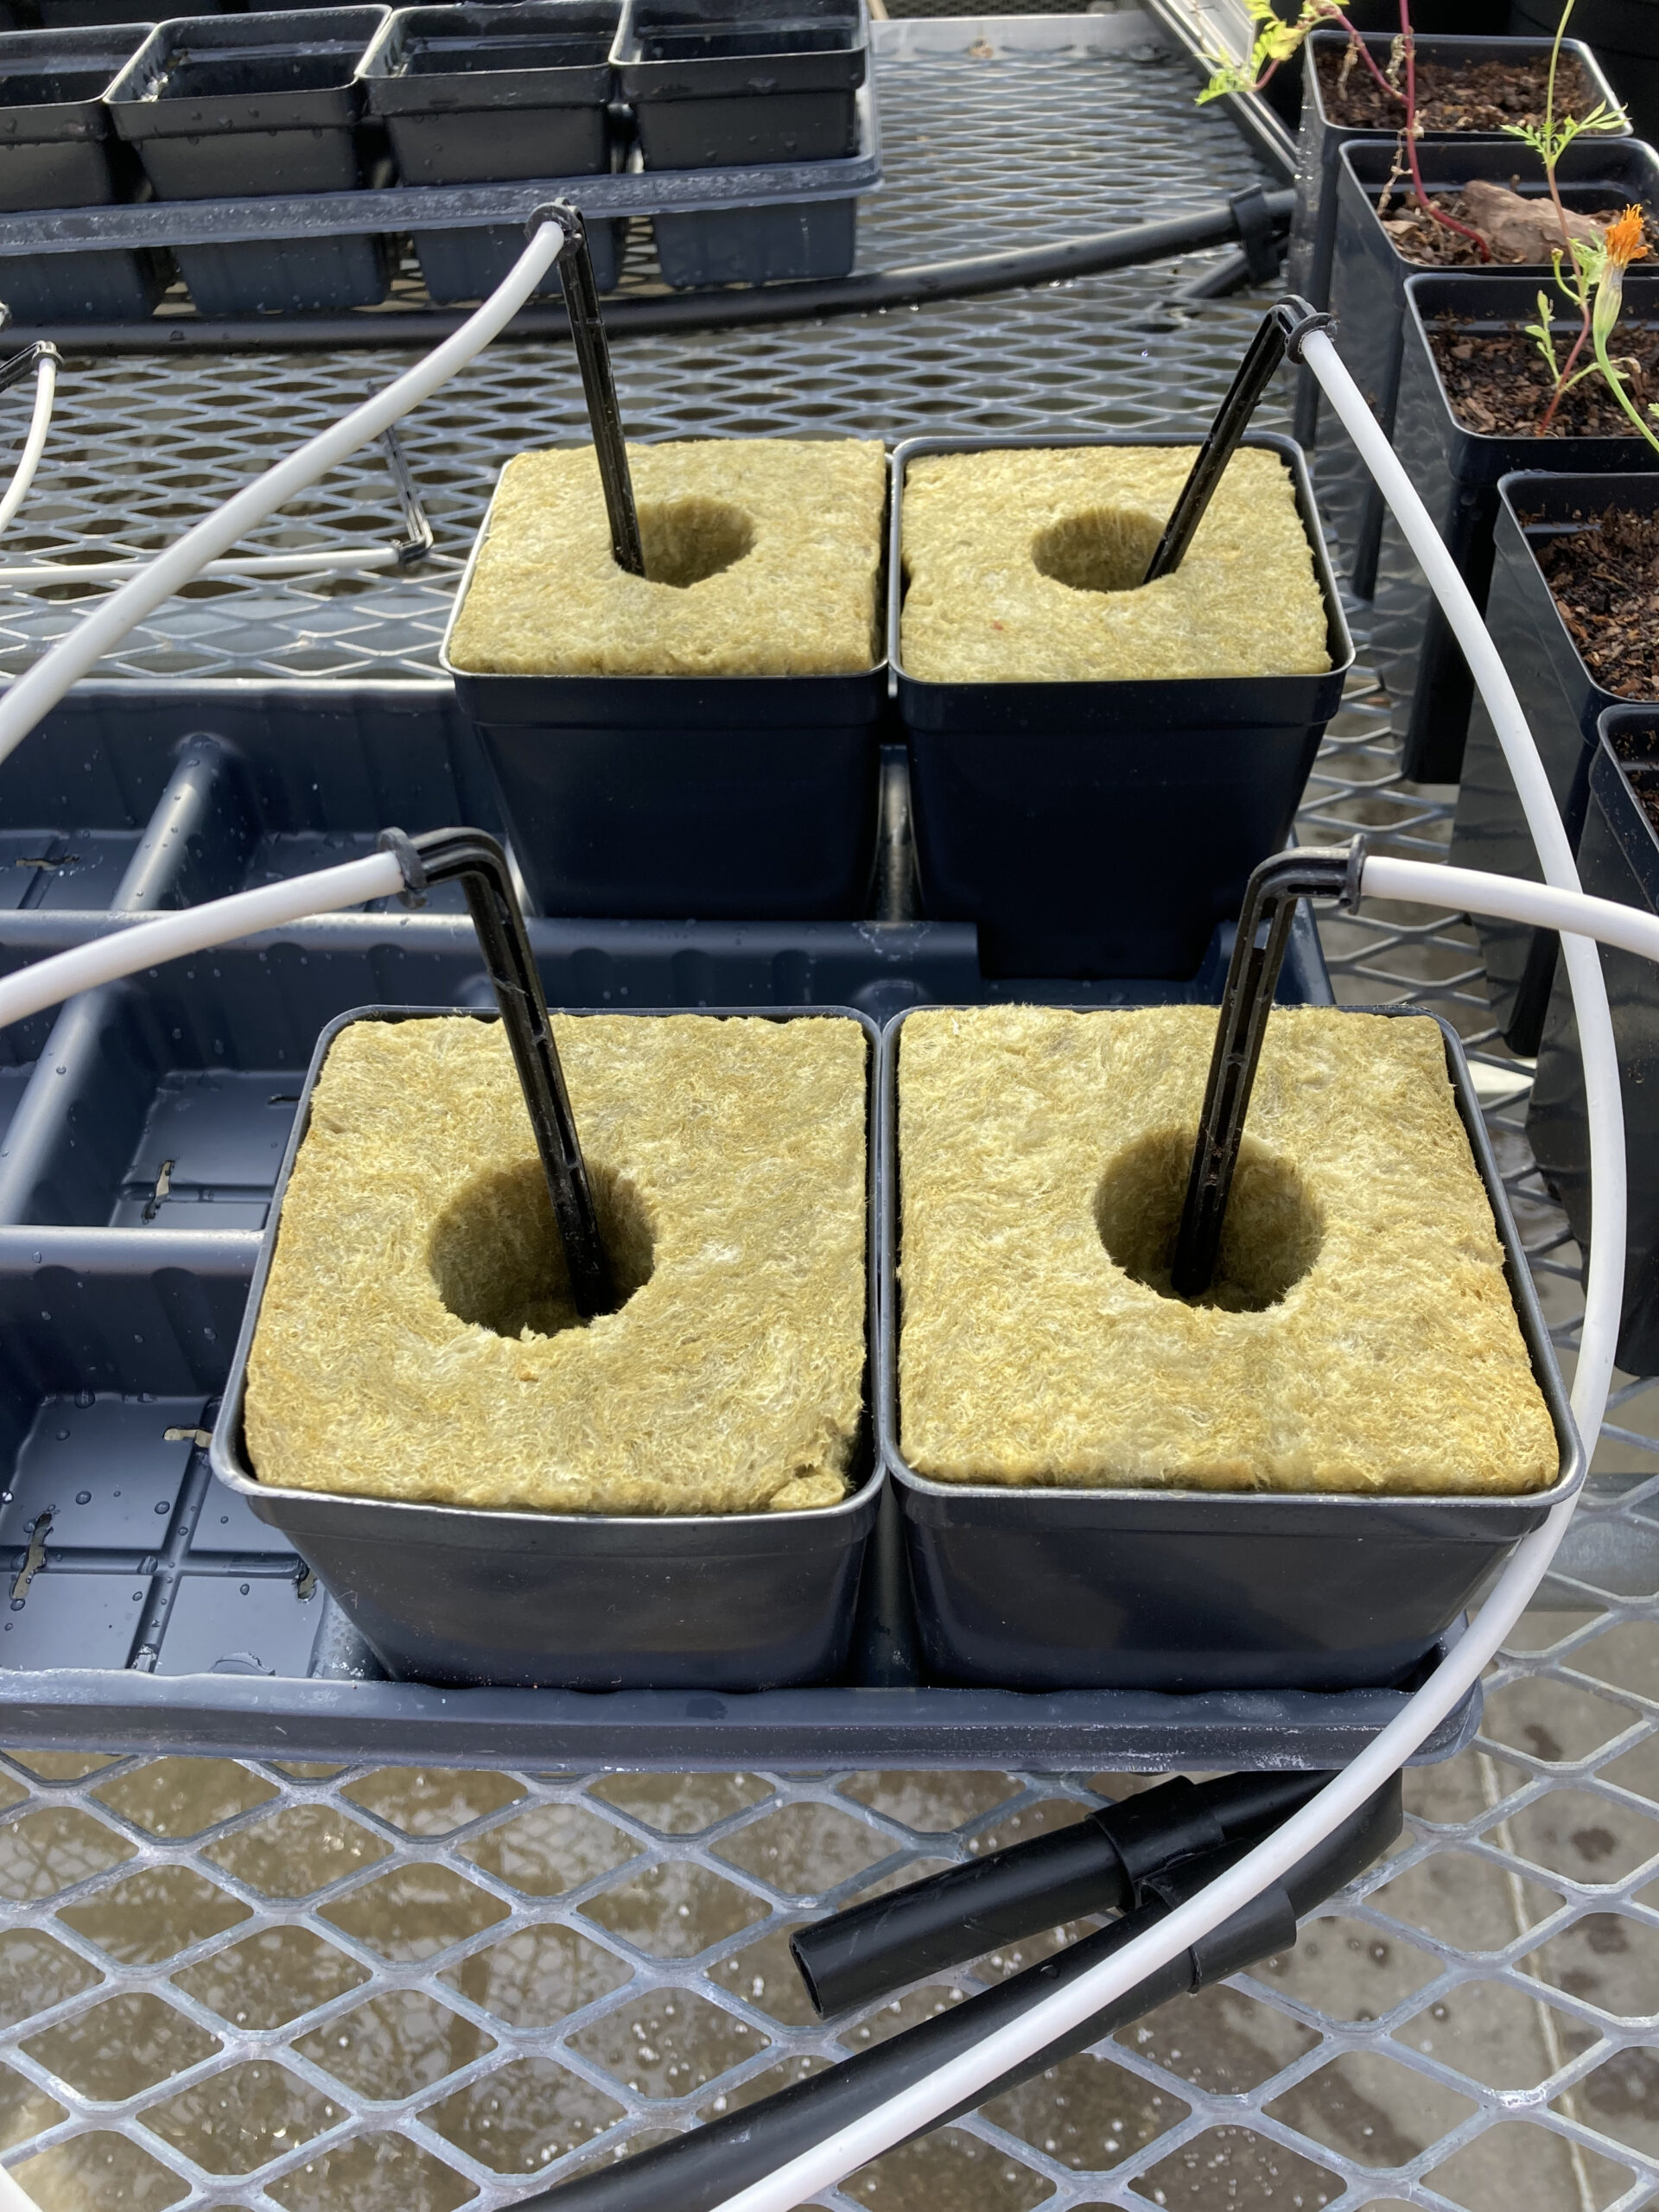
Figure 9: Final design of the growth system for Phase II lettuce growth experiments.
The lettuce grew continuously during the first three weeks of growth, but an unseasonal heat wave in April 2022 overwhelmed the greenhouse’s climate control system for a week-long period. The frequency of watering was increased to prevent drying, but the lettuce seedlings remained stunted as they continued to develop after this point. As a result, the mature plants for all treatments, including controls, only reached a maximum height of approximately 50% of what was expected for the species of lettuce used. Regardless, all plants survived for the duration of the growth period and were successfully harvested in May 2022. None of the plants that received effluent fertilizers displayed obvious signs of acute toxicity after the fertilizers were applied. The 8-fold dilution level was sufficient to prevent ammonia or salt toxicity.
The biomass generated from each fertilization treatment is summarized in Table 11. The control treatment using the greenhouse’s balanced stock fertilizer (NPK 17:5:17, 100 mg/L NH4) yielded the highest amount of both whole (5.3 ± 0.16 g) and dry (0.966 ± 0.082 g) biomass on average, which was expected for a positive control. Plants in the negative control that received no fertilizer remained the smallest and yielded the least whole (2.3 ± 0.26 g) and dry (0.318 ± 0.018 g) biomass on average, which was also expected. There was a statistically significant difference in dry biomass production between the negative control treatment that did not receive fertilizer and the greenhouse’s commercial stock fertilizer (p<0.000) indicating that the stock fertilizer was successful at promoting plant growth as a positive control.
Table 11: Biomass generated from lettuce plants grown during the Phase II fertilization experiment. Values for plant masses are average of n=4 plants ± standard error
|
Fertilizer Treatment |
Fertilizer pH* |
Average Whole Plant Mass (g) |
Average Dry Plant Mass (g) |
|
Control - Stock Fertilizer |
4.01 |
5.3 ± 0.16 |
0.966 ± 0.082 |
|
Control - No Fertilizer |
n/a |
2.3 ± 0.26 |
0.318 ± 0.018 |
|
Reactor Effluent - Algae Only |
7.55 |
3.3 ± 0.20 |
0.517 ± 0.035 |
|
Reactor Effluent - DM Only |
8.32 |
4.5 ± 0.34 |
0.683 ± 0.089 |
|
Reactor Effluent - FW Only |
-** |
4.0 ± 0.28 |
0.655 ± 0.056 |
|
Reactor Effluent - PL Only |
8.40 |
4.1 ± 0.15 |
0.659 ± 0.014 |
|
Reactor Effluent - Algae+DM 1:1 |
7.62 |
3.6 ± 0.26 |
0.611 ± 0.025 |
|
Reactor Effluent - Algae+DM 1:2 |
7.86 |
3.3 ± 0.35 |
0.565 ± 0.082 |
|
Reactor Effluent - Algae+DM 1:5 |
8.05 |
4.0 ± 0.33 |
0.696 ± 0.074 |
|
Reactor Effluent - Algae+DM 1:10 |
8.04 |
4.0 ± 0.18 |
0.653 ± 0.040 |
|
Reactor Effluent - Algae+FW 1:1 |
7.64 |
3.1 ± 0.12 |
0.578 ± 0.030 |
|
Reactor Effluent - Algae+FW 1:2 |
7.97 |
3.4 ± 0.36 |
0.542 ± 0.103 |
|
Reactor Effluent - Algae+FW 1:5 |
7.94 |
4.3 ± 0.15 |
0.714 ± 0.043 |
|
Reactor Effluent - Algae+FW 1:10 |
8.11 |
3.9 ± 0.22 |
0.675 ± 0.039 |
|
Reactor Effluent - Algae+PL 1:1 |
7.83 |
3.4 ± 0.18 |
0.597 ± 0.031 |
|
Reactor Effluent - Algae+PL 1:2 |
7.97 |
3.3 ± 0.23 |
0.564 ± 0.046 |
|
Reactor Effluent - Algae+PL 1:5 |
8.04 |
4.2 ± 0.05 |
0.704 ± 0.038 |
|
Reactor Effluent - Algae+PL 1:10 |
8.12 |
4.0 ± 0.06 |
0.674 ± 0.023 |
*Sample taken immediately after fertilizing plants.
**Insufficient fertilizer remaining for analysis after fertilizing plants.
Of the plants fertilized with effluents from Phase I, the algae yielded the lowest amount of whole (3.3 ± 0.20 g) and dry (0.517 ± 0.035 g) biomass on average. This was not significantly different from the control pots that did not receive fertilizer (p=0.488) and was significantly lower than the dry biomass grown in the control (p<0.000). Given the high moisture content of the algae and the dilution effect it had on reactor effluent in Phase I, it appears that the additional 8-fold dilution in Phase II further reduced the concentration of nutrients needed for effective plant growth.
For the mono-digestion waste reactors, the DM-only reactor yielded the highest dried lettuce biomass (0.683 ± 0.089 g) on average, followed by PL-only (0.659 ± 0.014 g) and FW (0.655 ± 0.056 g). All three of these yields were significantly higher than the control without fertilizer at the 0.05 level of significance (p=0.002, p=0.007, and p= 0.006, respectively). However, DM, PL, and FW generated significantly less dry biomass on average then the stock fertilizer from the greenhouse as well, indicating they would not be sufficient to support the lettuce’s growth on their own at the dilution level used. The following co-digestion reactors also had significantly lower dry biomass yield compared to the stock fertilizer control: algae+DM 1:1 (p=0.003); algae+DM 1:2 (p<0.000); algae+DM 1:10 (p=0.038); algae+FW 1:1 (p=0.001); algae+ FW 1:10 (p=0.038); algae+PL 1:1 (0.002); algae+PL 1:2 (p<0.000); and algae+PL 1:10 (p=0.036). Only algae+DM 1:5 (p=0.079), algae+FW 1:5 (p=0.135), and alga+PL 1:5 (p=1.02) yielded a mass of dried lettuce that was not significantly different from the stock fertilizer control. Thus, the null hypothesis of Ha.2.1 cannot be rejected at this time. At the 8-fold level of dilution, the effluents from the experimental reactors from Phase I could not support plant growth equivalent to a commercial chemical fertilizer when applied to buttercrunch lettuce.
The major chemical components of leaf tissue from all of the plants was similar between all treatments (Figure 10), although the report from Agrolab indicated that all plants were deficient in nitrogen. Only potassium (K) showed large variability in tissue concentration between treatments, but no clear trends were visible to explain these results. Trends in trace mineral uptake (Figure 11) are consistent with the results in Figure 10 though iron and magnesium were the most variable trace components between treatments.
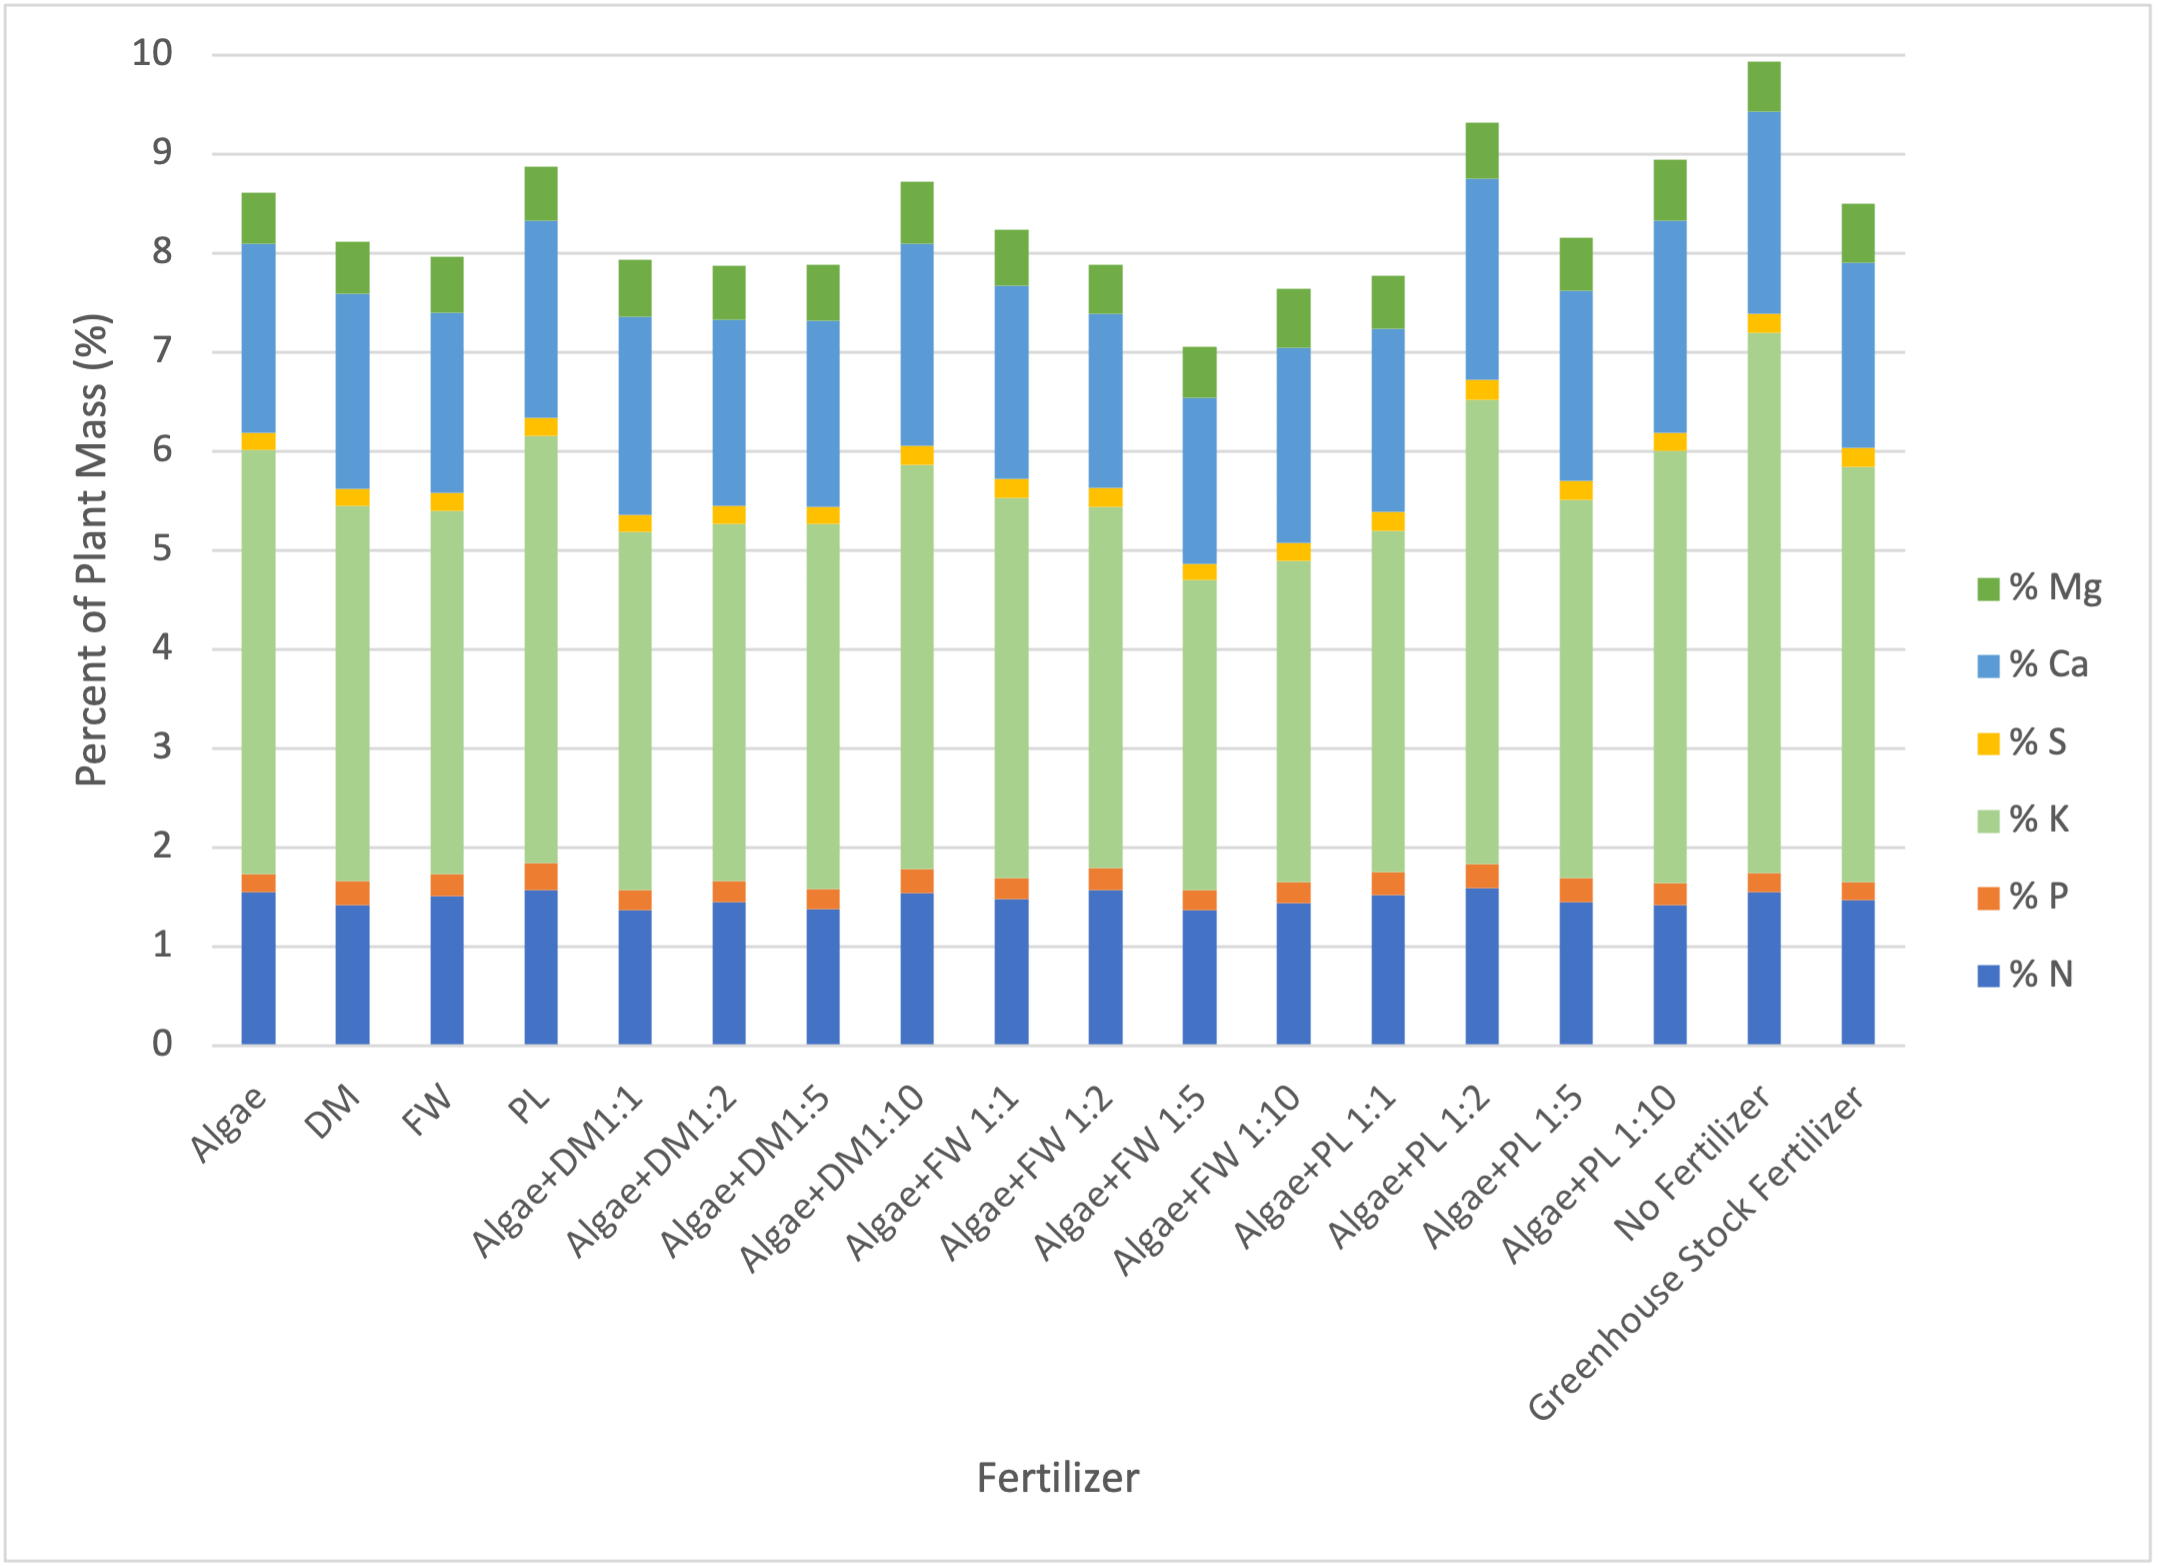
Figure 10: Results of Agrolab’s plant tissue analysis for lettuce from the Phase II fertilization experiment. DM = Dairy Manure, FW = Food Waste, PL = Poultry Litter.
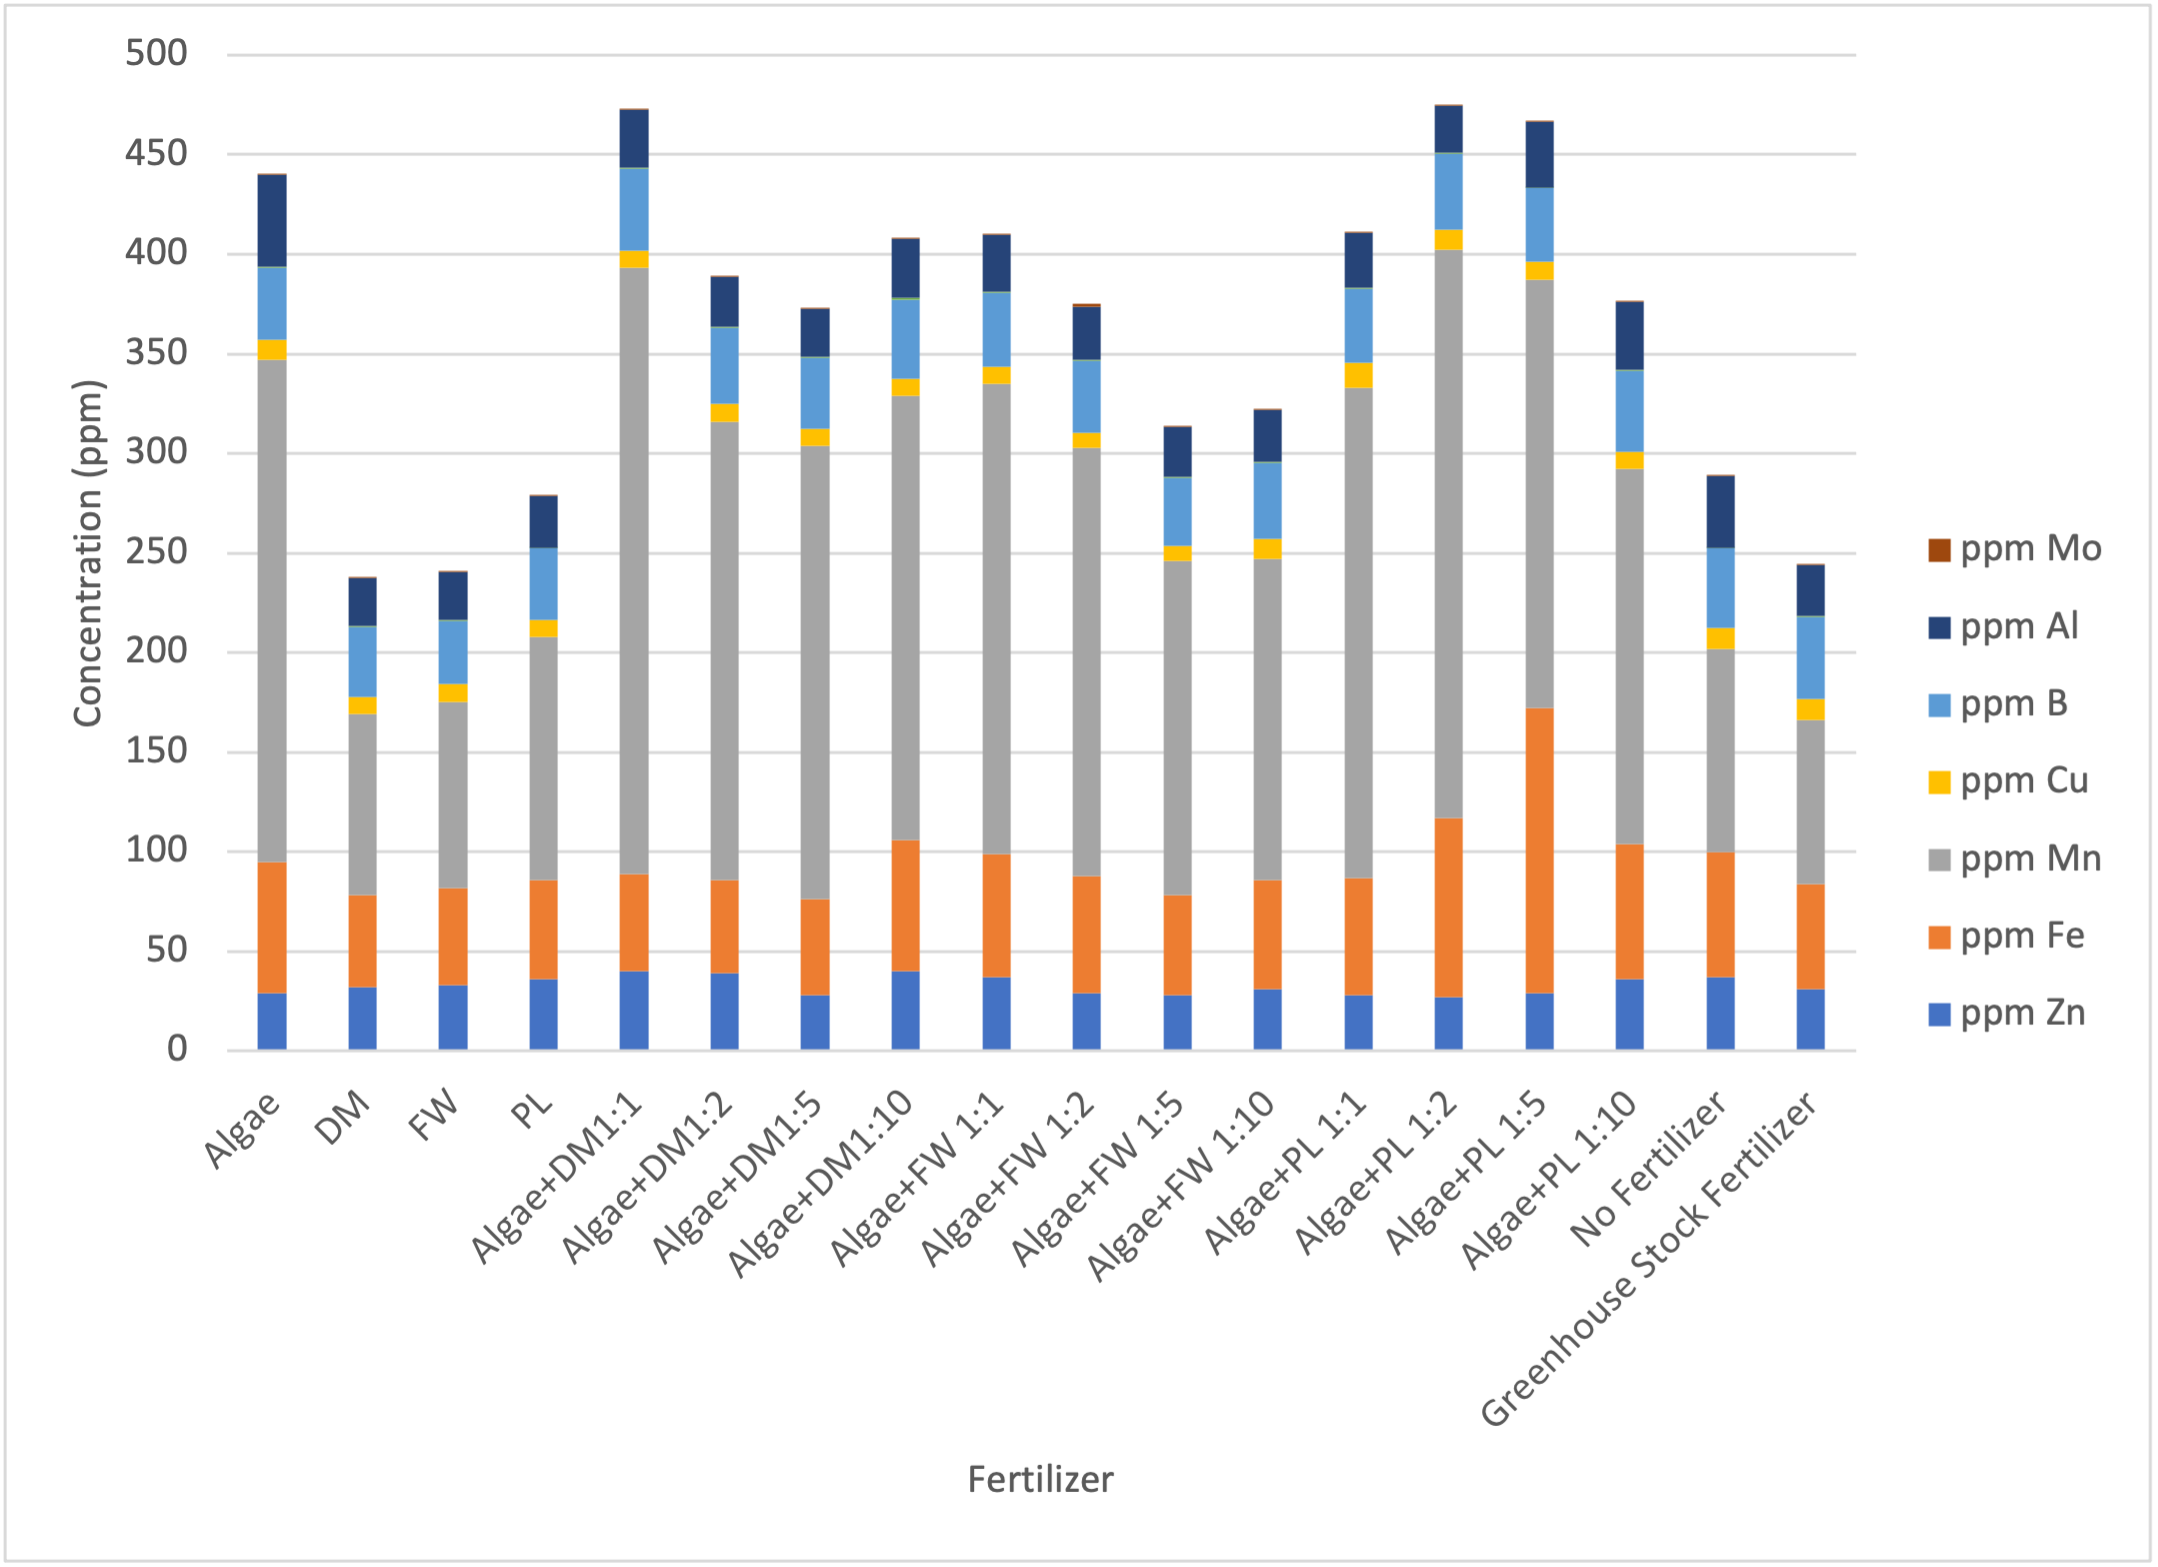
Figure 11: Results of Agrolab’s trace mineral analysis for lettuce from the Phase II fertilization experiment. DM = Dairy Manure, FW = Food Waste, PL = Poultry Litter.
In conclusion, it is possible to process algae from an ATS system via AD as a co-digestion feedstock with dairy manure, food waste, and poultry litter. The findings of the batch-scale reactor experiment in Phase I conclude that while co-digesting ATS algae with dairy manure and food waste at loading ratios 1:1, 1:2, 1:5, and 1:10, or poultry litter at loading ratios of 1:1, 1:5, or 1:10 by VS does not significantly change the efficiency of a digestion per g VS loaded. However, the moisture in the algae does significantly reduce the amount of CH4 gained on a per substrate mass basis. As demonstrated in Table 12, even adding 10% additional algae to the load of a small scale 30 m3 does not noticeably increase CH4 generation daily. However, it should be noted that very dry substrates such as PL typically require dilution with added water prior to digestion, to achieve a sufficiently fluid digestate to facilitate bacterial growth. In this case a wet co-digestion substrate could be desirable, in order to reduce the need for freshwater input. This would be a sustainable way for a farmer to reduce their water use, but further research specifically with dry co-digestion substrates would be needed to confirm its effectiveness.
Table 12: Theoretical additive integration of algae from an algal turf scrubber (ATS) into an on-farm digester with addition of 10% algae, using the data on rate of CH4 generated per mass of substrate from Phase I.
|
Waste |
Waste Fed per day (m3)* |
Digester Volume (m3) |
HRT (days) |
m3 CH4/day, waste only |
Algae Addition per day (m3) |
Modified HRT (days) |
m3 CH4/day, waste and algae co-digestion |
|
Dairy Manure |
1 |
30 |
30 |
0.64 |
0.1 |
27 |
0.64
|
|
Food Waste |
1 |
30 |
30 |
2.68 |
0.1 |
27 |
2.68 |
|
Poultry Litter |
1 |
30 |
30 |
2.44 |
0.1 |
27 |
2.44 |
*Note: 1 m3 of waste has been assumed to weigh 1000 kg in this example.
In Phase II, some of the effluents were able to promote plant growth and act as a fertilizer, but others were unable to effectively supply sufficient nutrients to support plant growth due to high dilution of the reactor effluent from the addition of algae prior to the 8-fold fertilizer dilution used in this experiment. However, three effluents were capable of achieving a level of plant biomass growth comparable to a commercial fertilizer. The results of the lettuce growth experiment further show that, while the effluent from the digesters can be used to fertilize lettuce, they are generally less effective at promoting biomass growth compared to commercial stock fertilizers. They may need to be supplemented with other fertilizer materials to provide leafy plants like lettuce with the full range of nutrients they need to thrive. That said, the addition of algae did not cause acute toxicity in the plants. It appears that land application of effluents from AD reactors supplemented with algae will not harm lettuce crops at the dilution level studied.
Education & outreach activities and participation summary
Participation summary:
At the conclusion of this research, the results were used to prepare educational and outreach materials. The goal of this project was to give information to farmers on the effect of combining ATS with AD, which could allow for nutrient trading credits for farmers through ATS use, plus energy production from AD systems. The graduate student involved in this project has previously worked with the Port of Baltimore to explore the use of ATS-AD in an urban environment, but the applicability of ATS-AD to agricultural environments is a new area of research. The results of this study have helped address this knowledge gap and will be made available to the public through several communication and outreach initiatives.
Presentations
Four presentations were given to the academic community to communicate the preliminary results as the research progressed. Phase I and Phase II data were presented, respectively, at the 2021 and 2022 annual meetings of Northeast Agricultural and Biological Engineering Conference (NABEC). Data from Phase I was also presented at the 2022 annual meetings of the American Ecological Engineering Society (AEES) and American Society of Agricultural and Biological Engineers (ASABE). At time of writing, an abstract for a poster presentation has been submitted for the UMD College of Agriculture and Natural Resources’s annual cornerstone event on October 12, 2022 and a seminar presentation has also been scheduled for December 2022 as part of a series hosted by UMD’s Environmental Science and Technology.
Education and Outreach
A deliverable was prepared in the form of a lay language Fact Sheet, which has been enclosed with this final report in the Information Products section that follows. The Fact Sheet provides an introduction to ATS systems and how they could be used in agricultural areas and how the addition of AD algae may affect established on-farm digesters based on the findings of this study. The Fact Sheet may be used by SARE and will be distributed to local government and outreach groups such as eXtension, Maryland Department of Agriculture, and MDE to increase the visibility of the results to the broader public. The Fact Sheet includes contact information for the PI and graduate students on the project, so they can be reached to answer any further questions about the research that arise.
In the coming months, the results will be prepared and submitted for publication in a scientific journal, such as Bioresource Technology or Ecological Engineering. Additionally, as this study was completed by a graduate student as a chapter of their dissertation research, the results will also be made available to both the public and the scientific community once the dissertation is submitted for publication by the University of Maryland.
Finally, the results will also be posted on Dr. Lansing’s website after they have been prepared for publication. The findings of this study have built upon her work done on AD and ATS as profiled in videos on the Big Ten Network (https://today.umd.edu/articles/double-helping-ba2021aa-9a89-4c25-8e66-feb924c1e662) and Voice of America (https://www.voanews.com/a/4691150.html) by adding a co-digestion and fertilizer component, which has not been previously quantified as relevant information to farmers interested in this technology. It is expected that in the future a video can be created once the results go from the lab- to the demonstration-scale in future efforts.
Project Outcomes
This research has demonstrated that a novel urban bioremediation technology, the algal turf scrubber, can potentially be integrated into agricultural areas as well, since the waste can be disposed of successfully via co-digestion in established on-farm infrastructure. This technology provides an option for farmers interested in sustainability and direct participation in Chesapeake Bay Watershed nutrient load reduction programs, and can be used in Maryland to participate in the state's Water Quality Trading program to generate offset credits if desired. Potential challenges to integrating algae into on-farm digesters were identified, primarily the high moisture content of the algae relative to more conventional anaerobic digestion wastes, such as manure. This research was only a laboratory-scale study and additional work will be needed to verify the results at scale, but it provides a foundation for future research and future collaborations with local farmers to explore new bioremediation technology together.
The graduate Student, Danielle, had the opportunity to work on a project with an agricultural focus for the first time during her graduate studies. She have learned a lot about costs, financial and material, of introducing the novel bioremediation systems I study to agriculture areas. She hopes that this research helps farmers in Maryland by providing them an option to offset their nutrient discharges beyond more conventional agricultural stormwater management practices. She intends to continue studying practical bioremediation technologies in her future career and hopes to continue working with farmers in the Chesapeake Bay Region.
The advisor, Dr. Lansing, appreciated the scope of the work from growing algae, to digesting algae, to growing plants. Danielle was able to learn the entire process that would be required for a farmer to create an ATS on-site, harvest the algae, add the algae to the digester, and then use the digester effluent to grow crops, which is what is conducted the industry. This insight and perspective of the meaning of her lab work into a farming context was invaluable insight for Danielle. This conceptualization and real-world aspect of novel digestion research is important for her career, as she was able to understand the meaning of our work, create a FactSheet to show famers how they can relate to her work, and present this work both to farmers and the scientific community. She will be publishing this data, which I believe will be of interest to a top-tier journal, as this merging of ATS technology and digestion technology has not been done from start to finish in the inclusive way that Danielle achieved.