Final report for GS15-143
Project Information
Insect pollinators supply an ecological service to crops and flowering plants by pollinating a diversity of wild plants and increasing the size and quality of harvest in agriculture production (Allen-Wardell et al. 1998; Delaplane and Mayer 2000; Fontaine et al. 2006). Despite the honeybee’s effectiveness as a pollinator for many crops, the risks associated with reliance on a single managed pollinator species have become evident over the past decades as North American honeybee populations have declined by 25% due to the parasitic mite Varroa destructor, Colony Collapse Disorder, farming intensification, habitat fragmentation, habitat loss, and agrochemicals (Steffan-Dewenter et al. 2002; Tylianakis et al. 2005; Biesmeijer et al. 2006; National Research Council 2006; vanEngelsdorp et al. 2009). Though cotton, rice, and soybeans are considered autogamy (self-pollinating), cross-breeding (via pollinators) helps increase yield, produce more viable seed, and enhance genetic diversity of the crop (Kremen et al. 2002; Pu et al. 2014).
Emergent wetlands occur adjacent to croplands throughout the Southeastern United States and create valuable floral resources for pollinators throughout the growing season. Some of these emergent wetlands on public lands are actively managed for annual plants that produce abundant seed resources for migratory waterfowl while some emergent wetlands are more passively (less frequently or less intensely) managed for perennial plants. Pollinator communities that use emergent wetlands have been poorly documented and their benefits to plant communities on surrounding lands are not fully understood.
- Compare pollinator communities between managed emergent wetlands and adjacent croplands,
- Assess impact of management strategies on pollinator species abundance and diversity, and
- Document whether pollinator visiting flowers in wetlands are also visiting flowers in adjacent croplands.
Research

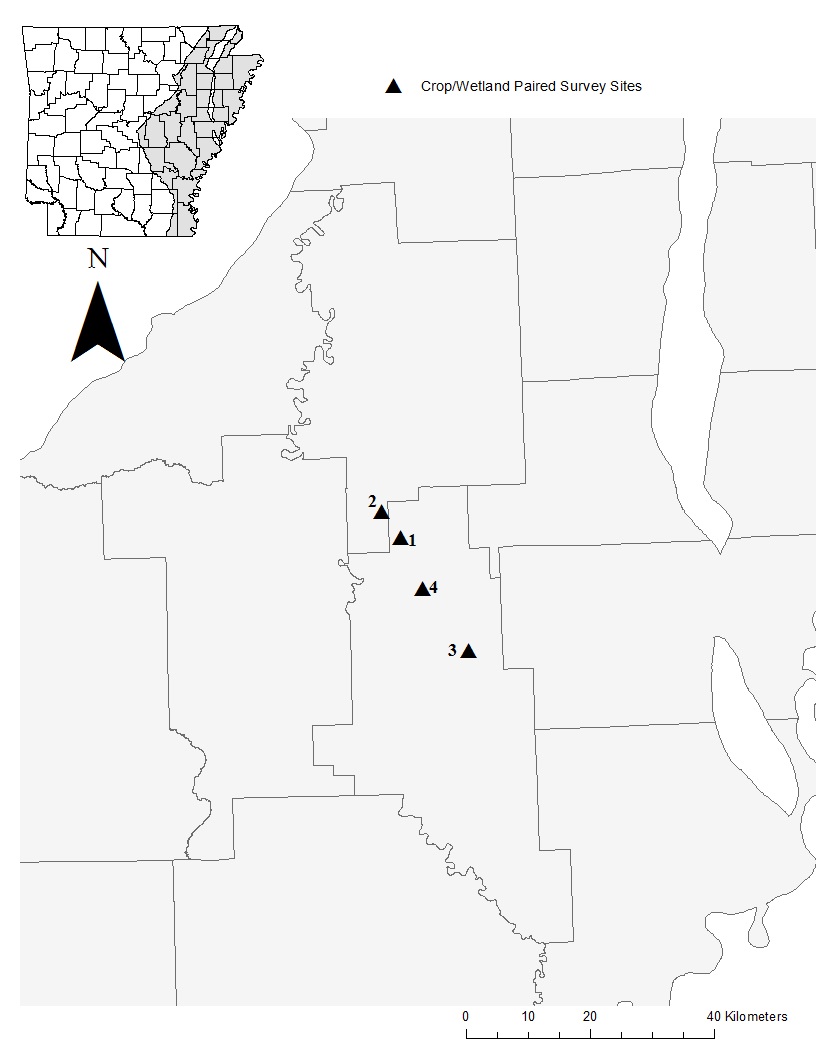
We conducted this study in the lower Mississippi Alluvial Valley (LMAV) of Arkansas (Fig. 1). The LMAV is bounded on the southwest by the West Gulf Coastal Plain and Ouachita Mountains, on the northwest by the Ozark Mountains, and on the east by the Mississippi River. The LMAV of Arkansas is a result of large rivers forming the character of the land. The Arkansas River, White River, St. Francis River, Black River, Cache River, L’Anguille River, and Mississippi River have flown through this region, cutting away older deposits and building up deposits of sand, gravel, and clay (Crow 1974). The soils in the LMAV of Arkansas are mainly comprised of clay, sand, and loess, but change with increasing distance from rivers. Historically the LMAV of Arkansas was comprised of vast wetlands in the floodplains and prairies between the floodplains (Branner 1908; Foti 2001). We argue that these prairies were wet prairies based on hydric soil characteristics found there (Branner 1908). The elevation of the LMAV varies by ~46 m throughout the entire 402 km length of the LMAV in Arkansas (Crow 1974). The region is now dominated by ~61% agriculture (soybean, rice, corn, sorghum, and cotton) with fragments of remnant emergent (1%) and bottomland hardwood (17%) forest (King et al. 2006; USDA-NASS 2016). The LMAV averages 118-134 cm of rainfall annually with an average of 35 cm of rainfall between June-September (Scott et al. 1998).
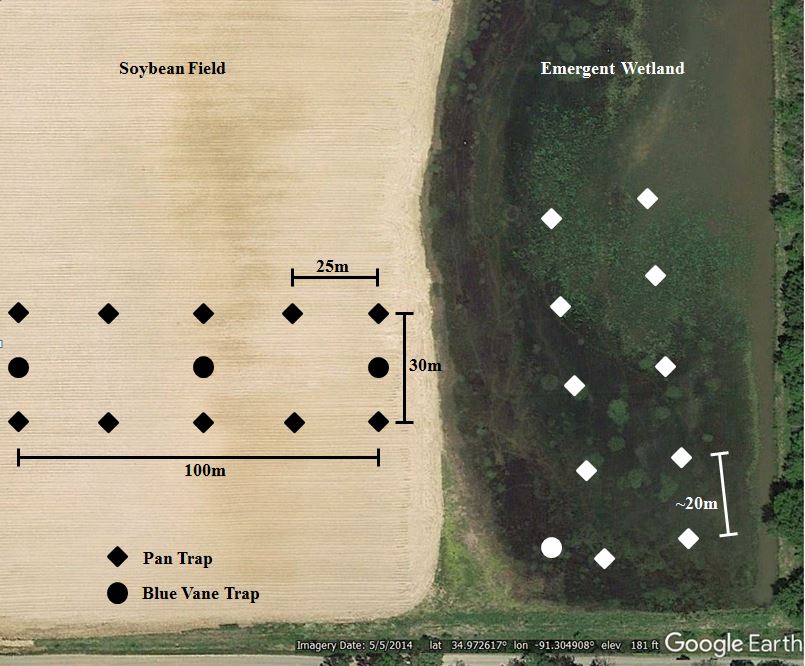
We surveyed palustrine emergent wetlands and their adjacent soybean fields in Monroe and Woodruff counties of Arkansas (Fig. 1). All of the emergent wetland sites we surveyed were in row crops before being converted back into emergent wetlands. Most of the sites we surveyed were impounded and were either being reestablished to functioning emergent wetlands through the agricultural conservation easement program (ACEP), previously known and hereafter referred to as the Wetland Reserve Program (WRP), or were reverting back to emergent wetlands through natural succession. Palustrine emergent wetlands are classified as areas <8 ha in size, lacking active wave-formed or bedrock shoreline features, water depth in the deepest part of the basin <2.5 m at low water, and salinity due to ocean-derived salts less than 0.5 ppt (Cowardin et al. 1979). All wetland sites surveyed had not been manipulated during the last 5 years. These emergent wetlands were allowed to naturally evaporate through the growing season which retained soil moisture, and provided a longer flowering period for hydrophytic plants such as Hydrolea uniflora and Ludwigia peploides ssp. glabrescens. Reduced disturbance (e.g. disking, mowing, burning) also sustained floral availability on these emergent wetlands through the growing season for bees. Wetland sites used included one Natural Area (NA) managed by the Arkansas Natural Heritage Commission (ANHC), and three private lands (Table 1), and ranged in size from 3.6 - 11 ha. Soybean fields included four private lands adjacent to emergent wetlands previously mentioned (Table 1), and ranged in size from 4.8 - 25 ha. All study site pairs were >2 km apart to reduce the chance of bees moving among sites (Araujo et al. 2004).
METHODS
In 2016, we sampled 4 paired emergent wetland and soybean sites. Sampling took place during 2 soybean reproductive stages: reproductive stage 1 (R1) and reproductive stage 2 (R2). R1 is a soybean plant having at least one flower appearing on any node on the main stem, whereas R 2 is a soybean plant having multiple flowers on the main steam with at least one flower open at one of the two uppermost main-stem nodes (McWilliams et al. 2009). Emergent wetland sites and their adjacent soybean field were sampled on the same day, except for the Hallum field site during the first collection period. Hallum’s emergent wetland was sampled on 2 August and the adjacent R1 soybean field was sampled on 5 August. I sampled bees on 20 June and 28 June (Benson Creek NA), 13 July and 20 July (Gin), 1 August and 8 August (Gumbo), and 2/5 August and 9 August (Hallum).
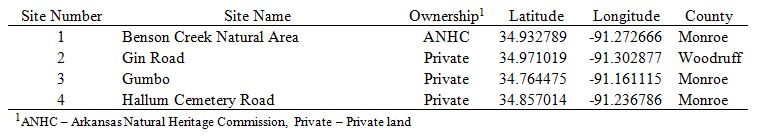
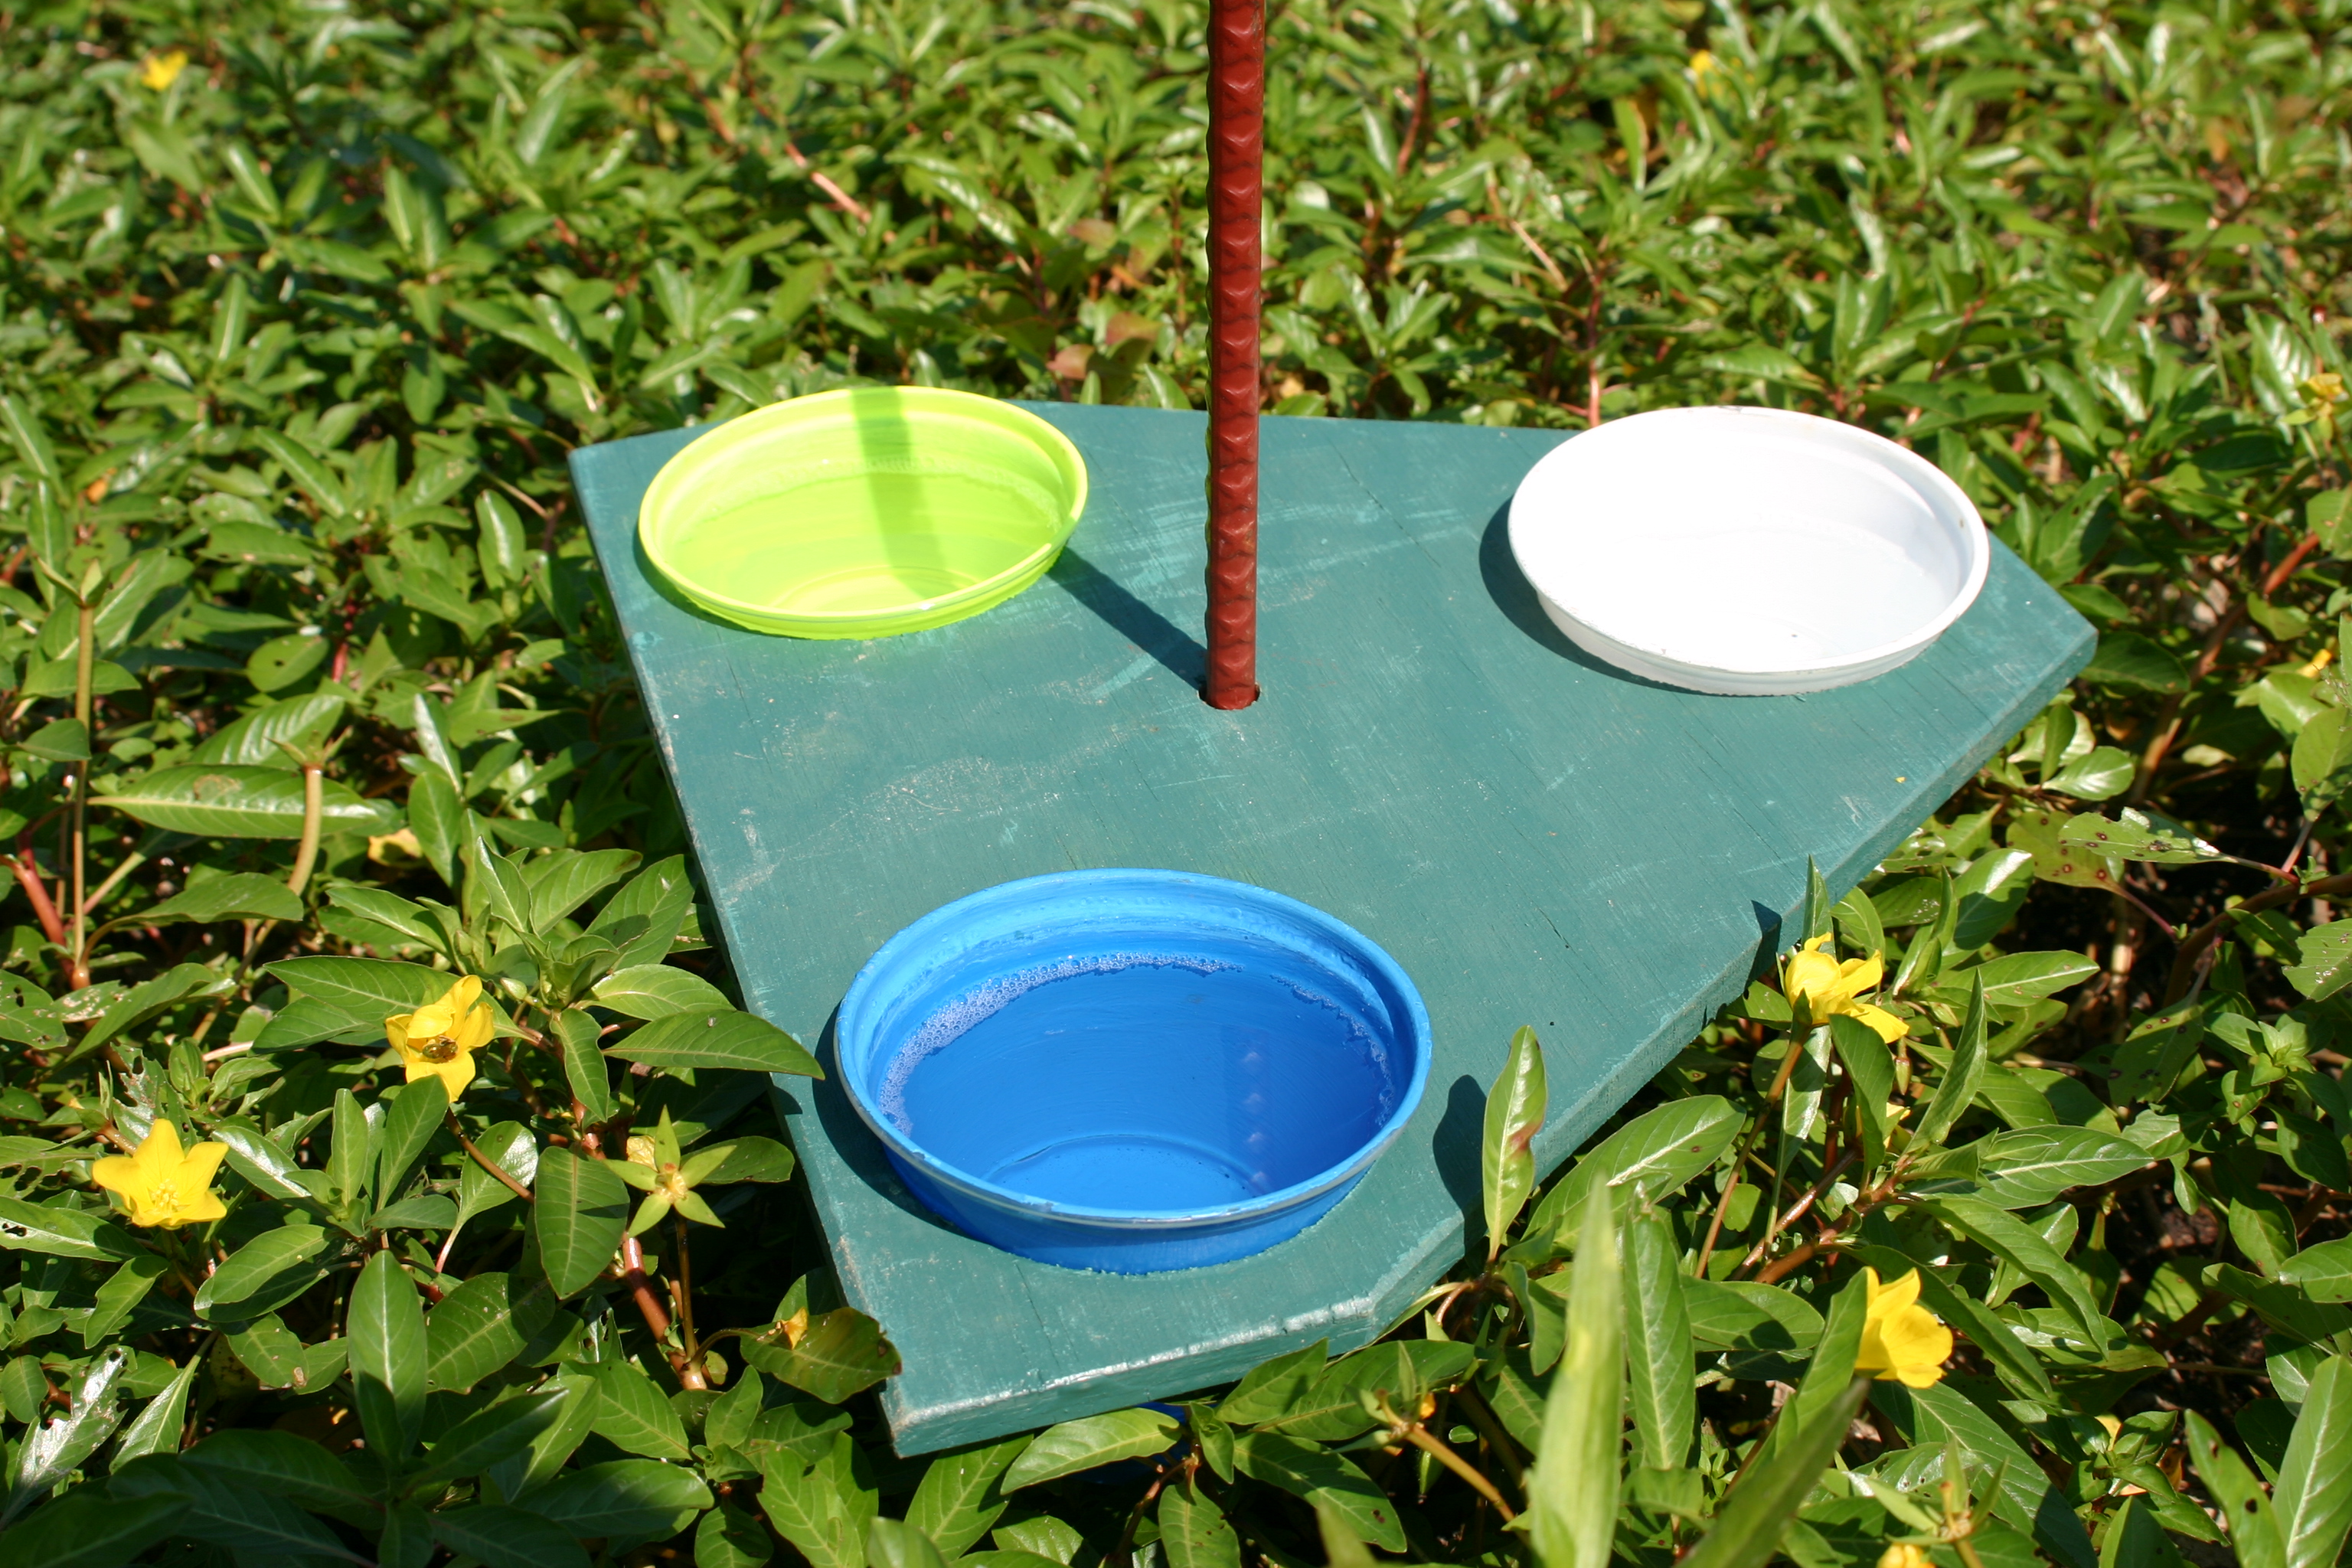
We collected bees using pan traps (Fig. 2; Droege et al. 2009; Kirk 1984; Leong and Thorp 1999), blue-vane traps (Kimoto et al. 2012; Stephen and Rao 2005), and sweep nets (Roulston et al. 2007; Stephen and Rao 2007). Pan trapping was used because it is known to attract smaller bodied bees and avoids the need for skilled collectors (Cane et al. 2000; Westphal et al. 2008). Blue-vane traps were used to collect medium to large bodied bees (Geroff et al. 2014) and sweep nets were used to collect bees that might not be represented in either pan or blue-vane traps (Cane et al. 2000;Stephen and Rao 2007). We captured bees by placing 10 pan trap stations throughout passively managed emergent wetlands along a permanent transect with a random starting location, a set interval of ~20m between stations, while following an opportunistic path avoiding open water. Ten pan trap stations were used in the adjacent soybean fields. Pan trap stations in soybean fields were arranged in a rectangular block, perpendicular to the adjacent wetland with a 50 m buffer between the wetland/soybean interface. Pan trap stations were placed along two parallel transects that were 30 meters apart. Individual pan trap stations were placed 25 meters apart, extending 100 meters into soybean fields (Fig. 3), thus the furthest pan trap was 150 m from the wetland edge. Pan trap station platforms held 3, 266 mL cups (Solo, Lake Forest, IL) that were painted either fluorescent blue, fluorescent yellow, or white (Guerra Paint and Pigment Corp., New York, NY; Krylon CoverMaxx, Cleveland, OH). These cups were filled ¾ full with a soapy water (Dawn Ultra – Original Scent, Cincinnati, OH ) mixed daily to capture visiting bees. Pan trap platforms were adjusted to the average vegetation height surrounding the platform at every collection point in passively managed emergent wetlands and were placed at flowering height in soybean fields. The pan traps were set out between 0700-900 hrs and were picked up the same day between 1800-2000 hrs. Samples were combined at each pan trap station and strained using an 180μm sieve to isolate the insects from the soapy water mix. The sample was then transferred to a Whirl-Pak (Nasco, Fort Atkinson, WI) in 70% ethanol for storage. Thus there were 10 Whirl-Pak bags from the 10 pan trap stations at a given site. We used one blue-vane trap (1.89 L. jar) per passively managed emergent wetland suspended from a shepherds hook pole, with the bottom of the trap ~ 1 m above the ground (Kimoto et al. 2012; Stephen and Rao 2005). We used three blue vane traps (1.89 L. jar) per soybean field placed at 0 m, 50 m, and 100 m directly between the two parallel transects. The blue-vane traps were filled with ~475 ml of the same soapy mix as the pan traps. These blue-vane traps were placed and collected on the same schedule as the pan traps. Samples were also strained using a 180 μm sieve and were placed in a Whirl-Pak in 70% ethanol for storage. The blue vane traps were positioned in a location that was visible across the entire field site. These blue-vane traps were placed and collected on the same schedule as the pan traps. Samples were also strained using a sieve and were placed in a Whirl-Pak in 70% ethanol for storage. We used sweep netting to sample for bees that were not attracted to the pan trap or the blue-vane trap. In passively managed emergent wetlands, we conducted 5 random transects of 50 sweeps apiece totaling 250 sweeps. These sweeps were conducted in different vegetation types at each site to capture bees that may prefer particular vegetation. In soybean fields, we conducted four random transects of 62-63 sweeps apiece totaling 250 sweeps. These sweeps were conducted perpendicular to the rectangular block to not disturb the pan and blue-vane trapping area. These sweeps were collected perpendicular to the 0-25m, 25-50m, 50-75m, and 75-100m pan trap stations. Sweep netting was conducted between 0900-1000 hrs in passively managed emergent wetlands. Sweep netting was conducted at 0900 and 1200 hrs in soybean fields. All sweep net samples were placed in one gallon Ziploc bags (S.C. Johnson, Racine, WI) and were placed in the freezer until processed. All bees were washed, dried, pinned, and labeled. We identified all bees to species, when possible, or to genus using discoverlife.org (Schuh et al. 2010). We confirmed identifications with M. Arduser – Missouri Department of Conservation (retired); H. Ikerd – USDA-Agricultural Research Service Pollinating Insect-biology, Management, Systematics Research Unit; T. Griswold – USDA-Agricultural Research Service, Pollinating Insect-biology, Management, Systematics Research Unit; J. S. Ascher – American Museum of Natural History; and K. Parys – USDA-Agricultural Research Service, Southern Insect Management Research Unit.
DATA ANALYSIS
To estimate probability of detection, species richness, extinction (ϕ), turnover (Г), and colonization between soybean fields and emergent wetland sites, we used the programs SPECRICH (Burnham and Overton 1979; Hines 1996) and COMDYN4 (Nichols et al. 1998). We found that in all cases, the data fit the model (M(h) GOF test, p>0.05 for all tests). Detection probabilities <~80% suggest that raw species counts do not represent the true number of species that occur at those sites (MacKenzie et al. 2002). Hence, if it met the assumptions we relied on estimated species richness values to describe bee communities on both the actively and passively managed sites. To assess community structure we calculated Shannon – Wiener diversity indices for bee communities in both treatment types using H = ∑ - (Pi * ln Pi) for each site over the entire growing season. Evenness was calculated using E = H/ln(S) for each site over the entire growing season where S is the species richness (Elliott 1990). The indices data were then analyzed using a one-way ANOVA with 2 treatment types.
RESULTS
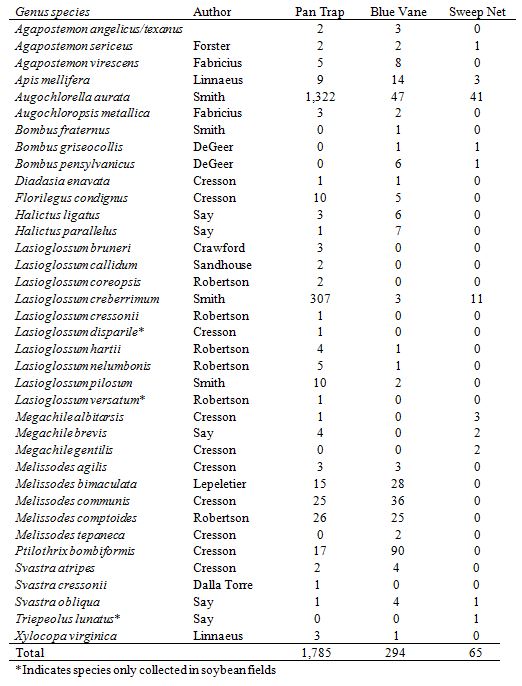
We captured 2,144 individual bees made up of 37 species and 15 genera in soybean fields; 6 (16%) were singletons. We captured 931 individual bees made up of 34 species and 16 genera in adjacent emergent wetlands; 12 (35%) were singletons. The most abundant species collected in soybean fields and emergent wetlands include Augochlorella aurata, Lasioglossum creberrimum, Ptilothrix bombiformis, Melissodes communis, Melissodes comptoides, and Melissodes bimaculata. We found that the probability of detecting a species in soybean fields was 0.92 (95% CI = 0.822-1.00) while detecting a species in adjacent emergent wetlands was 0.87 (95% CI = 0.753-1.00). Because the GOF test indicated the soybean data fit the heterogeneity model (χ² = 3.6, P = 0.06), we used the estimated species richness of 40.5 (95% CI = 37.00-45.00). For the adjacent emergent wetland sites, the GOF test indicated the data fit the heterogeneity model (χ² = 0.077, P = 0.78) so we used the estimated species richness of 39.1 (95% CI = 34.00- 45.14). The 95% confidence intervals for species richness estimates overlapped indicating that both soybean fields and emergent wetlands supported similar species richness. The extinction probability (ϕ) is the proportion of species in actively managed emergent wetlands still present in passively managed emergent wetlands. The species turnover (Г) is the proportion of species in passively managed emergent wetlands still present in actively managed emergent wetlands. We also found that the probability of a species being present in soybean fields also occurring in emergent wetlands extinction probability (ϕ = 0.7681, 95% CI = 0.539658-0.945)1.00) and species turnover (Г = 0.8197, 95% CI = 0.658807-1.00) was high. Colonization is the number of species not present in actively managed emergent wetlands, but present in passively managed emergent wetlands. We found that local colonization was 8.5 (95% CI = 0.0-17.0). Of the 37 species collected in soybean fields, 11 (30%) were unique to soybeans; whereas 8 (24%) of 34 species found in the adjacent emergent wetlands were unique to wetlands (Table 2). Three species; Lasioglossum disparile, Lasioglossum versatum, and Triepeolus lunatus, were only captured in soybeans fields throughout the entire study.
One of the passively managed emergent sites (Gumbo) had the lowest Shannon-Wiener diversity index (H = 0.347 in soybeans and H = 0.976 in emergent wetlands) and the lowest evenness (J = 0.12 in soybeans and J = 0.345 in emergent wetlands) of all the sites. The average Shannon-Wiener index was 1.688 (95% CI = 0.731- 2.646) for soybeans whereas the average Shannon-Wiener index was 1.74 (95% CI =1.042 - 2.437) for emergent wetlands. There was no difference in diversity between treatment types (F 1,7 = 0.007, p = 0.94). Species evenness of soybeans on average was 0.54 (95% CI = 0.225 - 0.855) and emergent wetlands on average was 0.59 (95% CI = 0.385 – 0.797). There was no difference in evenness between treatment types (F 1,7 = 0.071; p = 0.8). I documented higher abundances of bees in soybean fields (2,144) during bloom than their adjacent emergent wetlands (931).
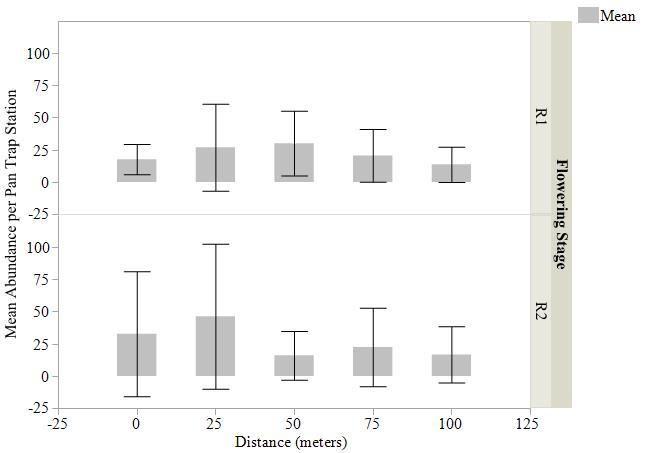
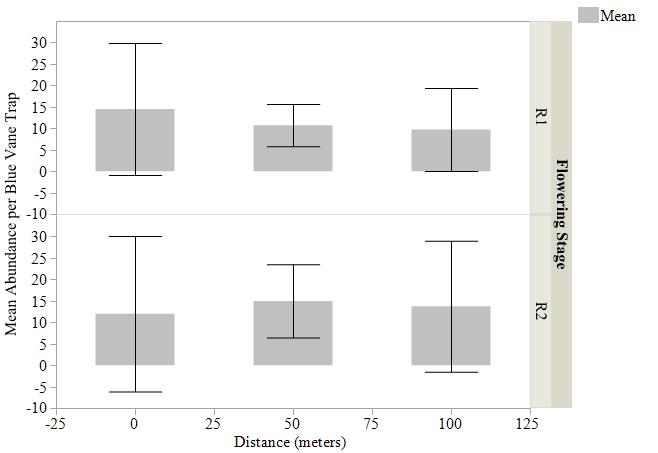
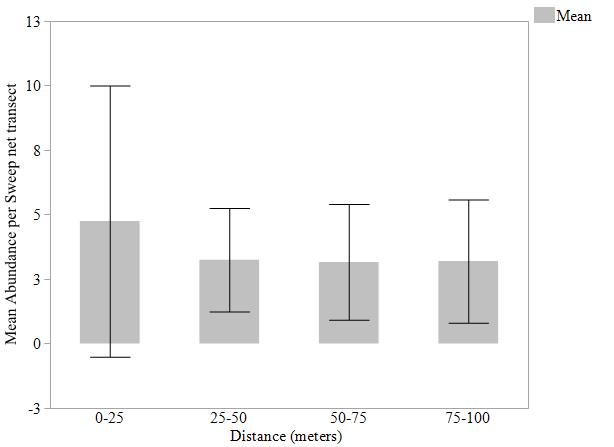
Mean abundance of bees captured by pan traps, blue vane traps, and sweep net transects were not statistically different (Fig. 4, 5, 6) at varying distances into soybean fields at R1 and R2 reproductive stages. The variation around the means was high due to the differing individuals captured at each site and should be considered. We detected bees moving up to 150 m into the soybean fields beyond the wetland edge. Per trap type, the most bees were captured in pan traps (1,785 individuals, 31 species), blue vane traps (294 individuals, 26 species), and sweep nets (65 individuals, 11 species) in soybean fields (Table 2).
DISCUSSION
Farm bill programs like the Wetland Reserve Program have the capacity to create source populations of bee diversity in a mosaic of agriculture wetland interfaces. These emergent wetlands are rare across the landscape, but have survived in large part due to easement programs through the Farm Bill. Palustrine emergent wetlands provide sufficient habitat to support a sustainable native bee community in the present of anthropogenic disturbance while providing ecological services to the surrounding plant communities including agricultural fields. Solitary bees were documented in emergent wetlands at lower quantities than in adjacent soybean fields during the same collection timeframe indicating a movement from the emergent wetlands into the soybean fields. Although bee abundances collected were not significantly different, we would argue that bees were taking advantage of the supplemental resource soybeans flowers provide during bloom. The lack of usable habitat in agricultural areas has prompted the creation of other easement programs (e.g. CP-42) and university extension example plots demonstrating the benefit of providing pollinator habitat adjacent and within agricultural production. These ecological services are important to the farming community and are slowly being incorporated into agricultural practices.
Pollinators have been documented across a range of habitat types traveling between natural areas and managed agricultural fields (Garibaldi et al. 2011). Erickson et al. (1978) found that soybean yields were significantly higher at distances up to 100 m from the A. mellifera apiaries than at greater distances into fields. We documented solitary bees 150 m into soybean fields with higher abundances that non-native honey bees. Honey bees are known for their abilities to travel great distances (17 km) to forage and also as local pollinators, but their native bee counterparts are often over looked and understudied. Garibaldi et al. (2013) found that visitation by wild insects and honey bees promoted fruit set independently, thus honey bees are supplementing pollination instead of substituting for native bees. This reiterates the importance of maintaining our native bee populations through management and restoration of natural areas.
Honey bees are also known to exploit floral resources that native bees need for survival. Though more honey bees in the environment would seem to increase pollination events, Garibaldi et al. (2013) found that an increase in wild insect visitation enhanced fruit set by twice as much as an equivalent increase in honey bee visitation. Also, honey bees do not tend to forage for long periods of time per foraging event. Mattu et al. (2012) recorded honey bees foraging on apple blossoms for 12.15-16.13 minutes per foraging event. Whereas Ordway (1966) observed Augochlorella aurata, a common eusocial bee found at all of my study sites, foraged for a minimum of 20 minutes and on average foraged for an hour before returning to their nest. This highlights the impact solitary bees have on cross-pollinating agricultural crops and in particular soybeans. Gill (2015) collected bees from soybean fields in Iowa during bloom and captured 50 species predominately in pan traps, as in this study. Gill (2015) also reported of the bees with pollen present, 38% contained soybean pollen alone or intermixed with other pollen grains.
We believe these restored emergent wetlands serve as a refuge for sensitive invertebrate communities from anthropogenic disturbances, while promoting groundwater recharge, soil retention, and providing habitat to a range of flora and fauna. These conservation easements also provide a “free source” of pollinators to surrounding croplands by promoting native bee habitat and biodiversity. These semi-natural habitats can also provide a source of non-bee pollinators that apiaries cannot. Radar et al. (2016) found that non-bees increased fruit set independently of bee visitations and performed 25-50% of the total crop flower visits. Native bees harbored in emergent wetlands and other semi-natural habitats can serve as insurance against the loss of non-native honey bees (Winfree et al. 2007). Future projects should examine how native pollinators from wetlands impact adjacent soybean and other agriculture production. Future studies should also examine maximum flight distances of solitary bees into croplands from adjacent semi-natural patches.
Educational & Outreach Activities
Participation summary:
Project Outcomes
Impacts
We collected 2,144 individual bees made up of 37 species and 15 genera during the 2016 field season. Farm bill programs like the Wetland Reserve Program have the capacity to create source populations of bee diversity in a mosaic of agriculture wetland interfaces. These emergent wetlands are rare across the landscape, but have survived in large part due to easement programs through the Farm Bill. Palustrine emergent wetlands provide sufficient habitat to support a sustainable native bee community in the present of anthropogenic disturbance while providing ecological services to the surrounding plant communities including agricultural fields. Solitary bees were documented in emergent wetlands at lower quantities than in adjacent soybean fields during the same collection timeframe indicating a movement from the emergent wetlands into the soybean fields. Although bee abundances collected were not significantly different, I would argue that bees were taking advantage of the supplemental resource soybeans flowers provide during bloom. The lack of usable habitat in agricultural areas has prompted the creation of other easement programs (e.g. CP-42) and university extension example plots demonstrating the benefit of providing pollinator habitat adjacent and within agricultural production. These ecological services are important to the farming community and are slowly being incorporated into agricultural practices.
Accomplishments
This study is one of the few studies to document bee communities in emergent wetland systems and is also a rare endeavor to study emergent wetland bee communities and their interactions with adjacent soybean fields. These records should serve as a benchmark for population surveys in the future to assess the changes in land use change and other human disturbances on bee communities in these fragile wetland systems.
These data should serve as a pilot study for future projects examining how native pollinators from wetlands impact adjacent soybean and other agriculture production. Future studies should also examine maximum flight distances of solitary bees into croplands from adjacent semi-natural patches.
LITERATURE CITED
Allen-Wardell, G., Bernhardt, P., Bitner, R., Burquez, A., Buchmann, S., Cane, J., Cox, P.A., Dalton, V., Feinsinger, P., Ingram, M., Inouye, D., Jones, C.E., Kennedy, K., Kevan, P., Koopowitz, H., Medellin, R., Medellin-Mprales, S., Nabhan, G.P., Pavlik, P., Tepedino, V., Torchop, P., and S. Walker. 1998. The potential consequences of pollinator declines on the conservation of biodiversity and stability of food crop yields. Conservation Biology 12:8-17.
Araujo, E.D., Costa, M., Chaud-Netto, J., and H.G. Fowler. 2004. Body size and flight distance in stingless bees (Hymenoptera: Meliponini): Interference of flight range and possible ecological implications. Brazilian Journal of Biology 64:563-568.
Biesmeijer, J.C., Roberts, S.P.M., Reemer, M., Ohlemüller, R., Edwards, M., Peeters, T., Schaffers, A.P., Potts, S.G., Kleukers, R., Thomas, C.D., Settele, J., and W.E. Kunin. 2006. Parallel declines in pollinators and insect-pollinated plants in Britain and The Netherlands. Science 313:351–354.
Branner, J.C. 1908. The clays of Arkansas. U. S. Geological Survey. Bulletin 351. Washington, D.C., USA. <https://pubs.usgs.gov/bul/0351/report.pdf > 25 May 2017.
Burnham, K.P., and W.S. Overton. 1979. Robust estimation of population size when capture probabilities vary among animals. Ecology 60:927-936.
Cane, J.H., Minckley, R.L., and L.J. Kervin. 2000. Sampling Bees (Hymenoptera: Apiformes) for Pollinator Community Studies: Pitfalls of Pan-Trapping. Journal of the Kansas Entomological Society 73:225-231.
Cowardin, L.M., Carter, V., Golet, F. C., and E.T. LaRoe. 1979. Classification of wetlands and deepwater habitats of the United States. U. S. Fish and Wildlife Service. FWS/OBS-79/31. Washington, DC, USA.
Crow, C.T. 1974. Arkansas Natural Area Plan. Arkansas Department of Planning. University of Arkansas Press. Little Rock, AR, USA. Delaplane, K.S. and D.F. Mayer. 2000. Crop pollination by bees. University Press, Cambridge, UK.
Droege, S., Tepedino, V.J., Lebuhn, G., Link, W., Minckley, R.L., Chen, Q., and C. Conrad. 2009. Spatial patterns of bee captures in North American bowl trapping surveys. Insect Conservation and Diversity 3:15-23.
Elliot, C.A. 1990. Appendix 3, Diversity indices. Wildlife, Forests and Forestry: Principles of Managing Forests for Biological Diversity (ed. By M.L. Hunter Jr.), pp. 297-302. Regents/Prentice Hall, Englewood, New Jersey, USA.
Erickson, E.H., Berger, G.A., Shannon, J.G., and J.M. Robins. 1978. Honey bee pollination increases soybean yields in the Mississippi delta region of Arkansas and Missouri. Journal of Economic Entomology 71:601-603.
Fontaine, C., Dajoz, I., Meriguet, J., and M. Loreau. 2006. Functional diversity of plant-pollinator interaction webs enhances the persistence of plant communities. PLoS Biol 4.
Foti, T.L. 2001. Presettlement forests of the black swamp area, Cache river, Woodruff County, Arkansas, from notes of the first land survey. USDA, Forest Service Publication. <https://www.srs.fs.usda.gov/pubs/gtr/gtr_srs042/gtr_srs042-foti01.pdf> 25 April 2017.
Garibaldi, L.A. et al. 2011. Stability of pollination services decreases with isolation from natural areas despite honey bee visits. Ecology Letters 14: 1062-1072.
Garibaldi, L.A. et al. 2013. Wild pollinators enhance fruit set of crops regardless of honey bee abundance. Science 339: 1608-1611.
Geroff, R. K., Gibbs, J., and K. McCravy. 2014. Assessing bee (Hymenoptera: Apoidea) diversity of an Illinois restored tallgrass prairie: methodology and conservation considerations. Journal of Insect Conservation 18:964.
Gill, K.A., and M.E. O’Neal. 2015. Survey of soybean insect pollinators: community identification and sampling method analysis. Environmental Entomology 44:488-498.
Hines, J.E. 1996. SPECRICH Software to compute species abundance from empirical species abundance distribution data. USGS-PWRC. <http://www.mbrpwrc.usgs.gov/software/specrich.html> 24 April 2017.
Kimoto C., DeBano S.J., Thorp R.W., Rao S., and W.P. Stephen. 2012. Investigating temporal patterns of a native bee community in remnant North American bunchgrass prairie using blue vane traps. Journal of Insect Science 12:108.
King, S.L., Twedt, D. J., and R. R. Wilson. 2006. The role of the wetland reserve program in conservation efforts in the Mississippi river alluvial valley. Wildlife Society Bulletin 34:914-920.
Kirk, W.D. 1984. Ecologically Selective Coloured Traps. Ecological Entomology 9:35-41.
Kremen, C., Bugg, R.L., Nicola, N. Smith, S.A., Thorp, R.W., and N.M.Williams. 2002. Native bees, native plants, and crop pollination in California. Fremontia 30:41-49.
Leong, J.M. and R.W. Thorp. 1999. Colour-coded sampling: the pan trap colour preferences of oligolectic and nonoligoletic bee associated with vernal pool plant. Ecological Entomology 24:329-335.
MacKenzie, D.I., Nichols, J.D., Lachman, G.B., Droege, S., Royle, J.A., and C.A. Langtimm. 2002. Estimating site occupancy rates when detection probabilities are less than one. Ecology 83:2248-2255.
Mattu, V.K., Raj, H., and M.L. Thakur. 2012. Foraging behavior of honeybees on apple crop and its variation with altitude in Shimla hills of western Himalaya, India. International Journal of Science and Nature 3:296-301.
McWilliams, D.A., Berglund, D.R., and G.J. Endres. 2009. Soybean Growth and Management Quick Guide. North Dakota State University Extension Publication A1174. North Dakota State University. <library.ndsu.edu/repository/bitstream/handle/10365/5453/a1174.pdf?sequence=1> 15 March 2017.
National Research Council. 2006. Status of Pollinators in North America. National Academy Press, Washington, DC, USA.
Nichols, J.D. Boulinier, T., Hines, J.E., Pollock, K.H., and J.R. Sauer. 1998. Estimating rates of local species extinction, colonization, and turnover in animal communities. Ecological Applications 8:1213-1225.
Ordway, E. 1966. The bionomics of Augochlorella striata and A. persimilis in eastern Kansas (Hymenoptera: Halictidae). Journal of the Kansas Entomological Society 39:270-313.
Pu, D., Shi, M., Wu, Q., Gao, M., Liu, J., Ren, S., Yang, F., Tang, P., Ye, G., Shen, Z., He, J., Yang, D., Bu, W., Zhang, C., Song, Q., Xu, D., Strand, M.R., and X. Chen. 2014. Flower-visiting insects and their potential impact on transgene flow in rice. Journal of Applied Ecology 51:1357-1365.
Radar, R., et al. 2016. Non-bee insects are important contributors to global crop pollination. PNAS 113:146-151.
Roulston, T.H., Smith, S.A., and A.L. Brewster. 2007. A comparison of pan trap and intensive net sampling techniques for documenting a bee (Hymenoptera: Apiformes) fauna. Kansas Entomological Society 80:179-181.
Schuh, R.T., Hewson-Smith, S., and J.S. Ascher. 2010. Specimen databases: A case study in entomology using web-based software. American Entomologist 56:206-216.
Steffan-Dewenter, I., Münzenberg, U., Bürger, C., Thies, C. and T. Tscharntke. 2002. Scale-dependent effects of landscape context on three pollinator guilds. Ecology 83:1421–1432.
Stephen W.P. and S. Rao. 2005. Unscented color traps for non-Apis bees (Hymenoptera: Apiformes). Journal of the Kansas Entomological Society 78:373–380.
Stephen W.P. and S. Rao. 2007. Sampling native bees in proximity to highly competitive food resources (Hymenoptera: Apiformes). Journal of the Kansas Entomological Society 80:369-376.
Tylianakis, J.M., Klein, A.M. and T. Tscharntke. 2005. Spatiotemporal variation in the effects of a tropical habitat gradient on Hymenoptera diversity. Ecology 86:3296–3302.
USDA National Agricultural Statistics Service (NASS) Cropland Data Layer (CDL).Published crop-specific data layer<http://nassgeodata.gmu.edu/CropScape/> 23 April 2017.
VanEngelsdorp, D., Evans, J. D., Saegerman, C., Mullin, C., Haubruge, E., et al. 2009. Colony collapse disorder: A descriptive study. PLoS ONE 4.
Westphal, C., Bommarco, R., Carre´, G., Lamborn, E., Morison, N., Petanidou, T., Potts, S.G., Roberts, S.P.M., Szentgyo¨rgyi, H., Tscheulin, T., Vaissie`re, B.E., Woyciechowski, M., Biesmeijer, J.C., Kunin, W.E., Settele, J. and I. Steffan-Dewenter. 2008. Measuring bee diversity in different European habitats and biogeographical regions. Ecological Monographs 78:654–671.
Winfree, F., Williams, N.M., Dushoff, J., and C. Kremen. 2007. Native bees provide insurance against ongoing honey bee losses. Ecology Letters 10:1105-1113.