Final report for GW18-126
Project Information
Problem: Lameness affects 16% of dairy cows in the US (USDA, 2016) and is associated with
reduced milk production and premature culling, raising welfare, environmental, and economic concerns.
Lameness is often caused by foot warts (FW) and sole ulcers (SU), claw lesions that arise from a combination of genetic and environmental factors. Genomic regions identified in this study can be incorporated into selection indices, allowing producers to select for cows genetically protected against FW and SU. These future generations of healthier and more efficient cows will produce milk with a smaller environmental footprint.
Research approach: To detect susceptibility loci, a genome-wide association study (GWAS) was performed with a mixed linear model in GCTA for each condition using single nucleotide polymorphism (SNP) genotypes from the high density SNP array (777K SNPs) and binary case/control and quantitative (number of lesions divided by the total number of hoof trimming records) phenotypes from cows across five dairies (FW n = 85, SU n = 120, controls n = 129; 23 cows had both FW and SU). For each GWAS, the number of effective SNPs (NES) was calculated as the number of SNPs that were not in linkage disequilibrium and used as the denominator to define Bonferroni-corrected thresholds of significance (p < 0.05/NES) and suggestive significance (p < 1/NES). To assess the predictability of SNP effects estimated from the GWAS while avoiding overfitting, polygenic risk scores were calculated using SNP effects estimated from cross-validated best linear unbiased prediction (cvBLUP).
Outreach: We have communicated with the producers of the dairies we are working with and the local county advisor. We will also communicate our findings directly with other local producers at conferences as well as through the extension team in the Animal Science Department at the University of California, Davis. We will also share our findings through trade publications as we did with our initial findings. The goal will be to provide producers with a genetic foundation for the reduction of both FW and SU, thereby reducing lameness.
The broad, long-term goal of this proposal is to reduce the incidence of lameness and
improve hoof health of Holstein dairy cattle. Thus, the objectives for this proposal are to:
- Perform a genome wide association analysis to identify QTL regions contributing to
genetic susceptibility to FW and SU
Western SARE. - Utilize the the SNPs of largest effect to develop a predictive model to reduce
susceptibility to FW or SU that can be used in conjunction with the current selection tools
for milk production attributes to reduce the prevalence of FW and SU within a herd while
maintaining overall milk quantity and quality
Cooperators
Research
Our study targeted five Holstein dairy producers in the Central Valley of California using freestall barns to minimize inconstancies in phenotyping due to environmental variance. Pedigree data was obtained from DairyComp records to identify breeding lines that tended to produce more cases or controls. Hoof trimming records from these dairies were used to select cases and controls. Cases were defined as cows that had at least one foot wart (FW) or sole ulcer (SU) diagnosis, whereas controls were cows that have had two or fewer lameness events that were determined to not be either FW or SU (that is, they may have had laminitis, sole hemorrhage, white line abscess, sole abscess, sole fracture, wall abscess, or foot rot) and were at least 6 years old. Dairy personnel collected whole blood samples from selected cases and controls. From the blood samples, we extracted DNA using the QIAGEN QIAamp® DNA Blood Mini Kit (QIAGEN Inc., Valencia, CA). Quality and quantity of DNA was determined using the NanoDrop® (ND-1000 v3.2.1) spectrophotometer (Thermo Scientific, Wilmington, DE). DNA was then SNP genotyped using the BovineHD BeadChip (Illumina Inc., San Diego, CA) at GeneSeek (Lincoln, NE). Illumina’s GenCall algorithm was used to call SNP genotypes. We combined these new SNP genotype data with those we obtained previously for a total of 386 cows from five dairies; during the grant period we increased our sample size by more than 250%.
We used PLINK 1.9 (Chang et al., 2015; Purcell and Chang, 2015) for quality filtering to remove SNPs and individuals with genotyping rates less than 95%. SNPs with minor allele frequencies less than 5% were also removed to exclude rare variants. SNPs with genotypic frequencies deviating from Hardy-Weinberg equilibrium in controls (p < 10E-6) were also removed to exclude SNPs with homozygote frequencies that were higher than expected due to genotyping errors. Two phenotyping methods were tested for association with SNP genotypes: binary case/control phenotypes and quantitative phenotypes, which were calculated as the count of lesions divided by the total number of hoof trimming records per cow. To identify SNPs segregating strongly with FW and SU phenotypes, genome-wide association analyses were performed in GCTA (Yang et al., 2011). For each phenotyping method, GCTA fit a linear mixed model (LMM) to test whether each SNP was associated with phenotype. The LMM included a genetic relatedness matrix as a covariate to correct for population stratification during association testing. Farm was also included as a covariate in the LMM to adjust for differences among the five dairies. The number of effective SNPs (NES) was calculated for each GWAS as the number of SNPs not in linkage disequilibrium (Li et al., 2012), and the NES was used as the denominator to define Bonferroni-corrected thresholds of significance (p < 0.05/NES) and suggestive significance (p < 1/NES).
Suggestive and significant SNPs were annotated using Ensembl’s Variant Effect Predictor module (McLaren et al., 2016) to find genes within 32.5 kb of the SNPs, as the average linkage disequilibrium block size in Holstein cattle is 32.5 kb (Pérez O’Brien et al., 2014). Functions of these genes were obtained using the mammalian phenotype option in the MGI database (http://www.informatics.jax.org/batch). Functionally relevant genes were defined as those that could potentially play a role in the etiology of FW and SU. Because FW is an infectious disease in which treponemes are thought to invade the skin through hair follicles (Evans et al., 2009), genes involved in the immune response, skin morphology and hair morphology were considered functionally relevant. SU is a metabolic disease affecting the suspension system and digital cushion supporting the pedal bone within the foot (Shearer and van Amstel, 2017). Accordingly, genes associated with lipid metabolism, glucose metabolism, and bone mineralization were considered functionally relevant to SU.
To assess the predictive value of genome-wide SNPs, polygenic risk scores (PRSs) were calculated as the sum of risk alleles at each SNP weighted by the SNP effect. SNP effects were estimated using cross-validated best linear unbiased prediction (cvBLUP) in GCTA (Yang et al., 2011), which uses leave-one-individual-out cross validation to avoid overfitting. Because the Illumina 50K SNP array is used more often for genomic prediction in industry, the 50K SNPs were extracted from the 777K SNP genotypes and also used as the input for cvBLUP-based PRSs. We assessed the calculated predictability of the full HD SNP array and the 50K subset of PRSs by evaluating how strongly the cvBLUP-based PRSs correlated with the cows’ actual phenotypes.
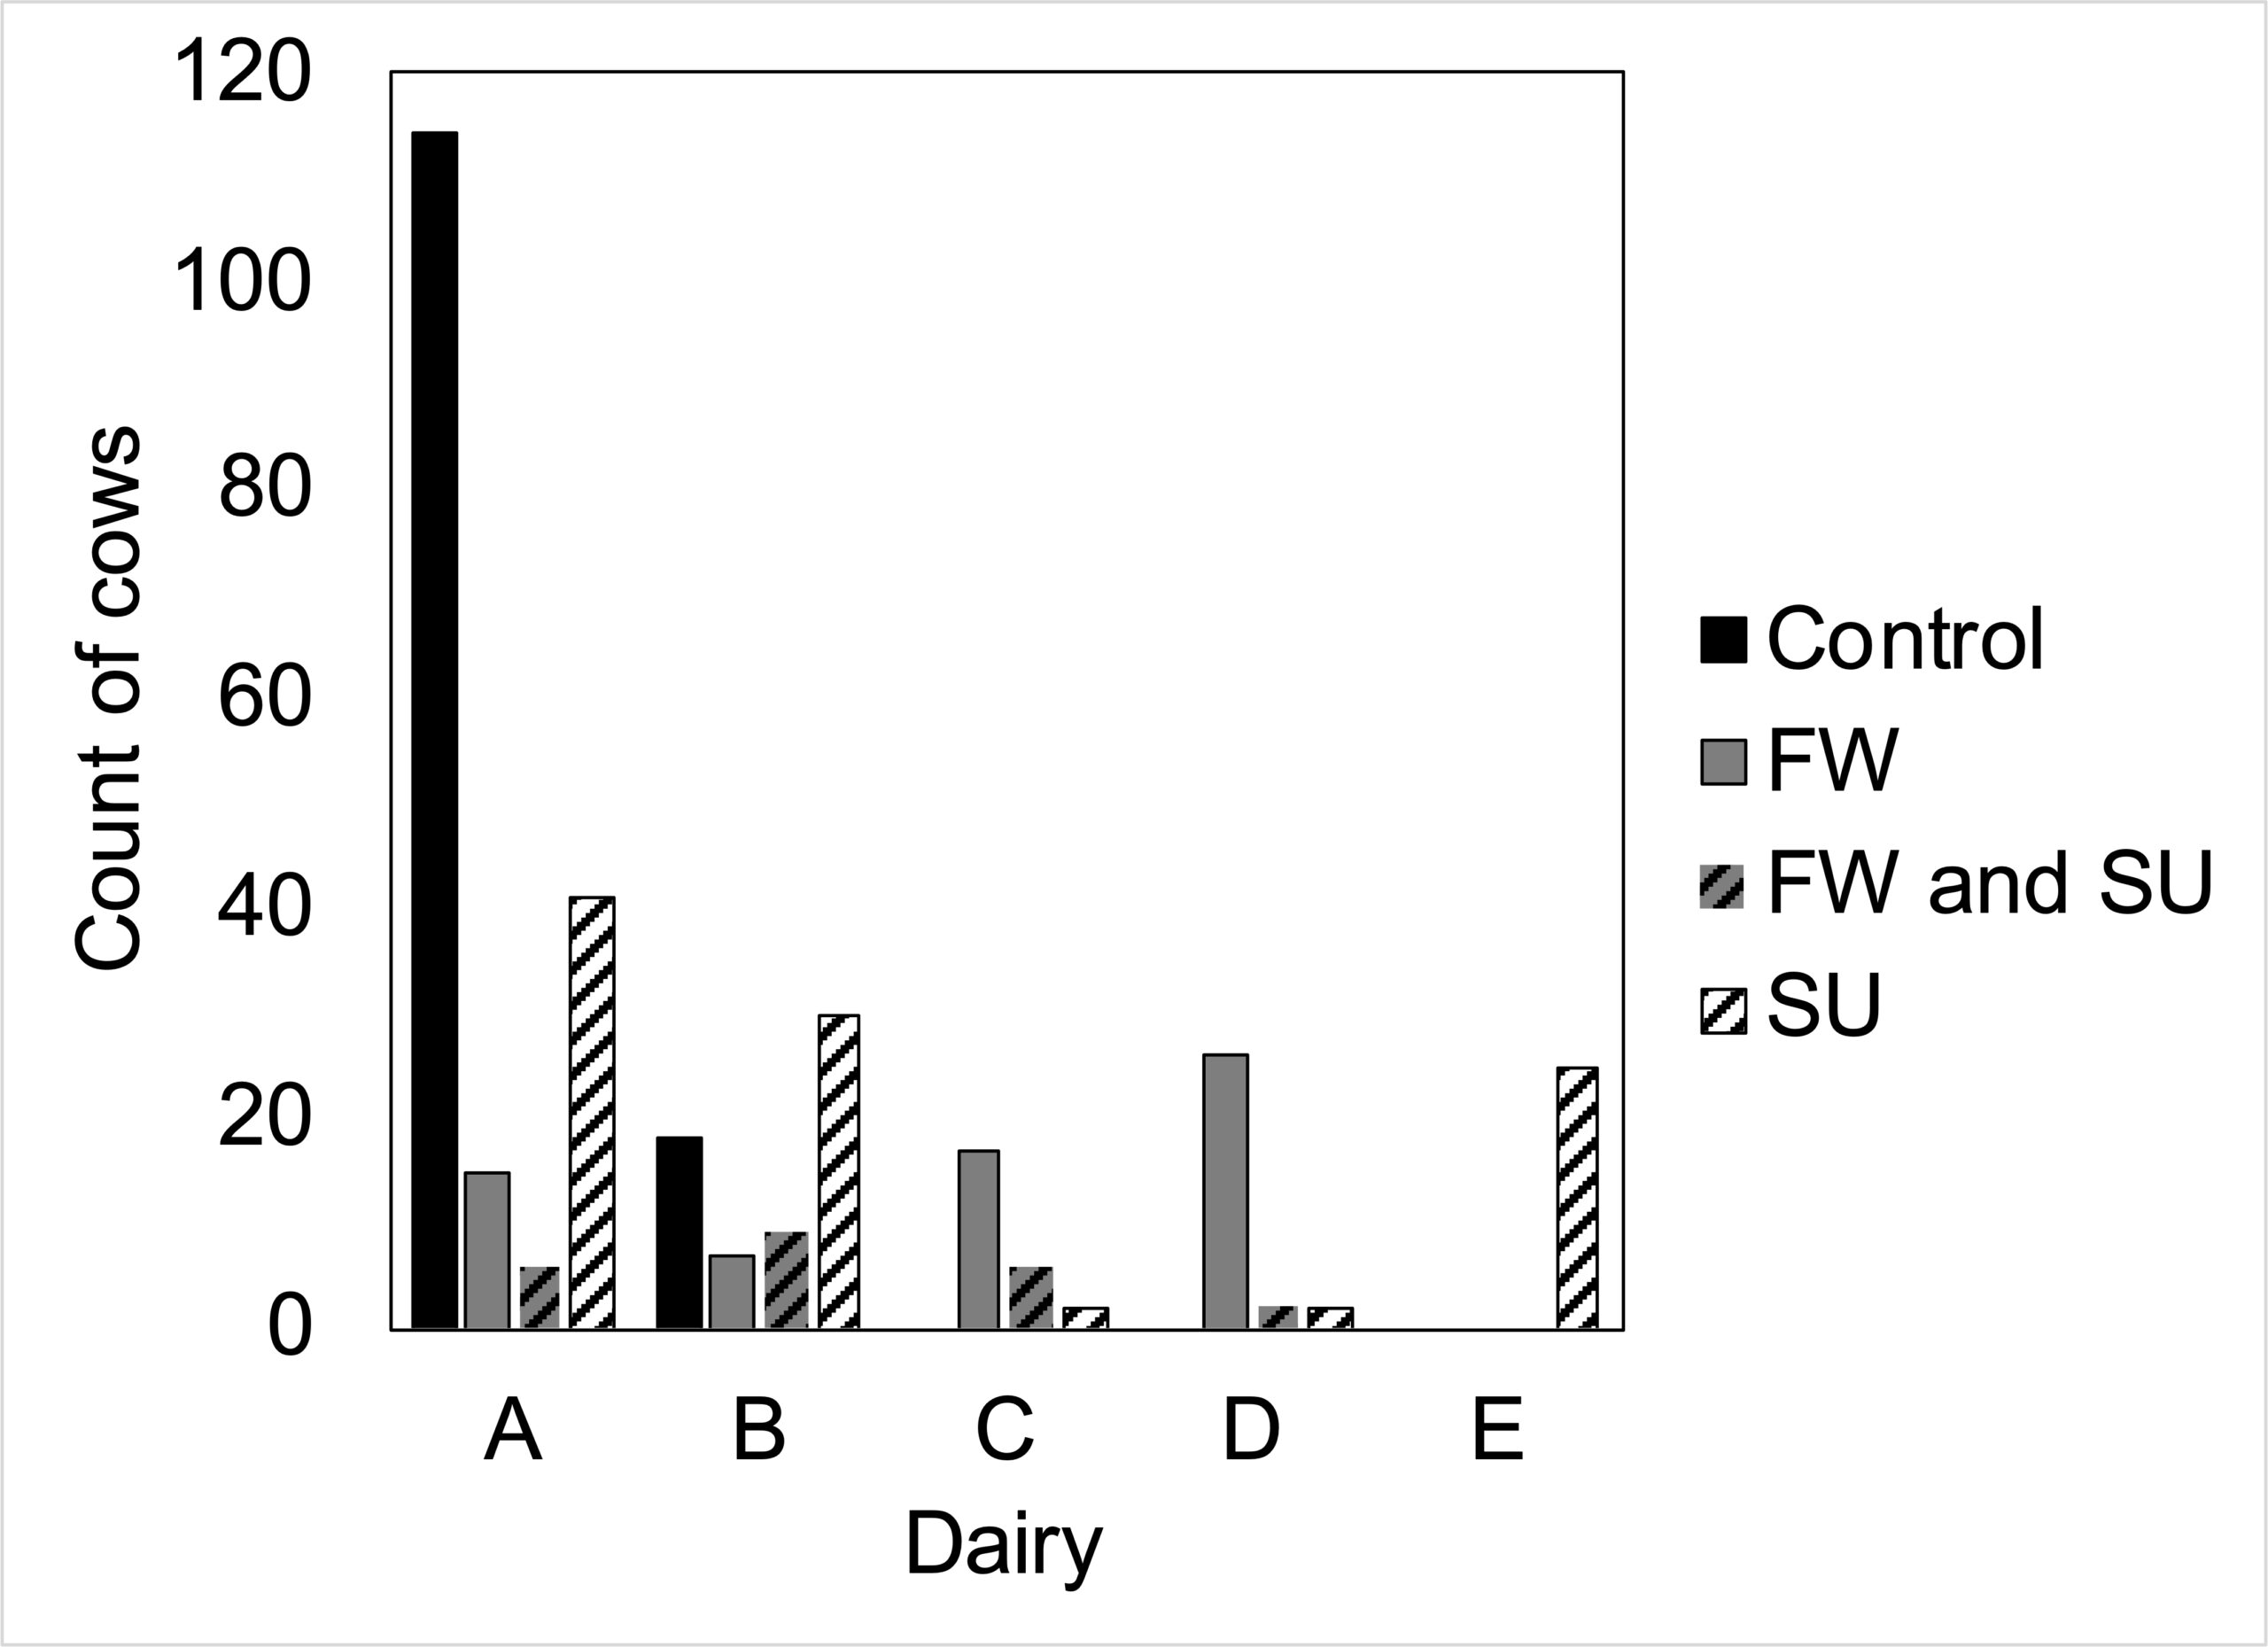
Five dairies participated in our study, although only two dairies had control cows that met our stringent age requirement whereas cases were sampled from all five dairies (Figure 1). After quality filtering, 311 cows were analyzed (FW n = 85, SU n = 120, controls n = 129; 23 cows had both FW and SU). Three additional control samples collected during the grant period were excluded from analyses due to lameness events that occurred after collection. Another 63 cows were excluded because they were from our previous population (i.e. before the grant period) and did not meet our current stringent phenotyping criteria.
Dairy producers in this study employed various methods of environmental control to reduce lameness. Anecdotally one dairy producer participating in this study believed lameness events decreased by hoof trimming cows at dry off in addition to the initial mid-lactation trimming and by employing daily footbaths for a month on heifers returning from pasture freshening, essentially eradicated FW in the herd. A second dairy producer maintained low incidence of overall lameness (< 5% on a 1400 head milking herd) through daily footbaths and in-pen hoof trimming done on an as-needed basis. In addition to environmental control, two dairy producers were performing genomic testing to identify heifers who may be genetically predisposed to lameness.
Pedigree data analyzed for the dairies under studyindicated that some bulls used at Dairy A and B were more prone to siring cases, other bulls were more prone to siring controls, and other bulls had no substantial difference in the proportion of cases and controls sired. The difference in proportions of cases and controls among half-sibs supports that a genetic component is contributing to FW and SU susceptibility, and we attempted to find the genomic regions contributing to this genetic component through the GWAS.
We found multiple peaks from the GWAS, some of which reached significance and suggestive significance. The multiple peaks reflect the multiple loci contributing to FW and SU susceptibility. which was expected due to the polygenic and highly complex nature of FW and SU susceptibility. Some of the suggestive SNPs were in or near genes with functions potentially related to the etiology of FW or SU.
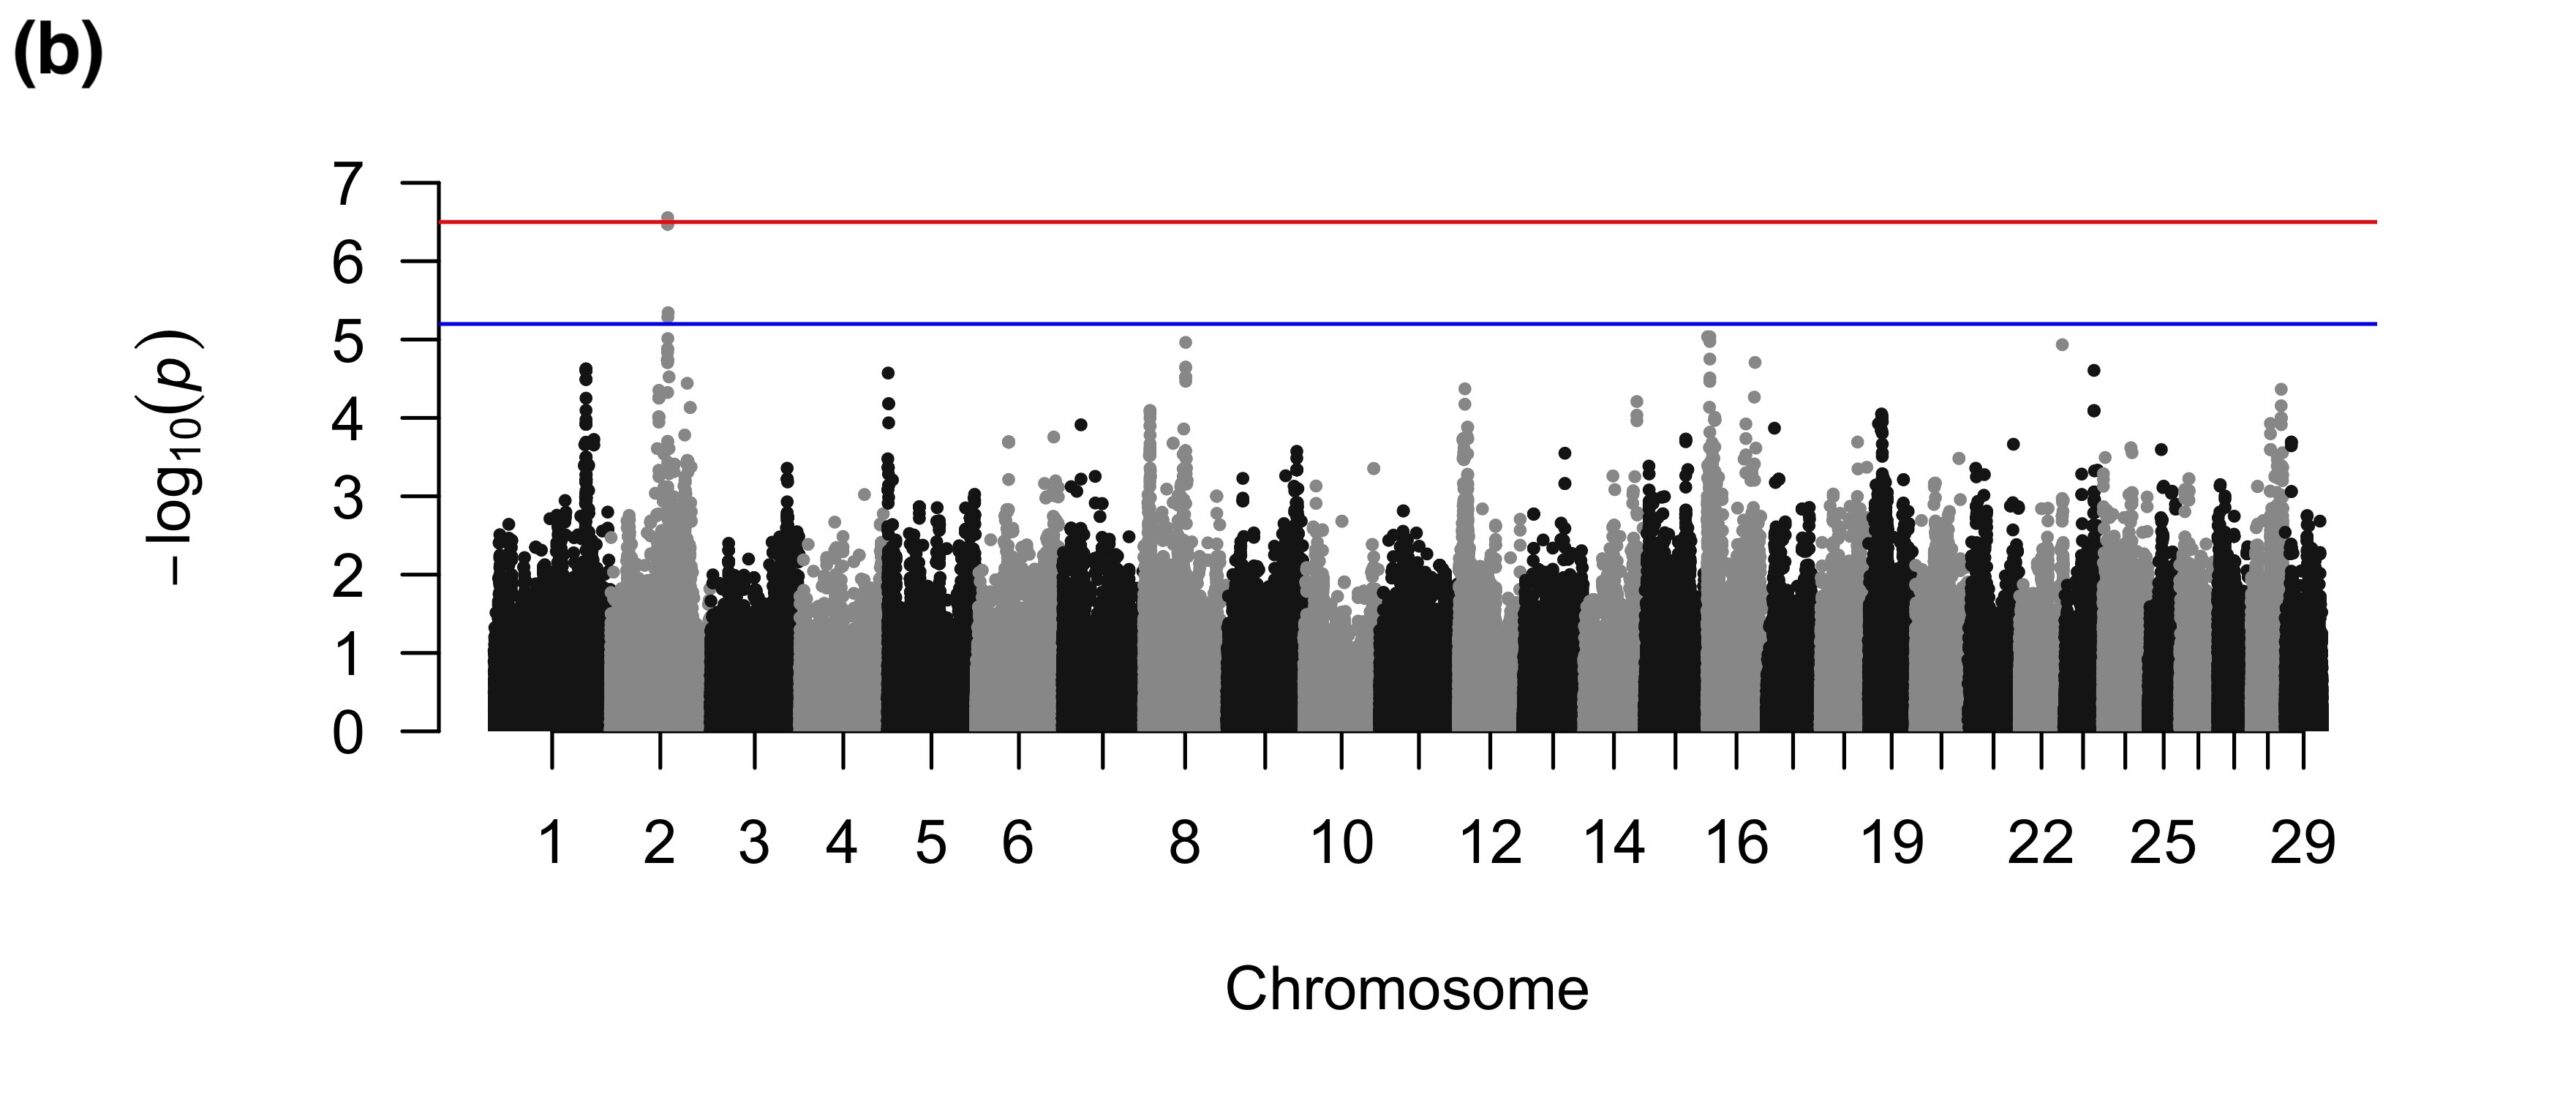
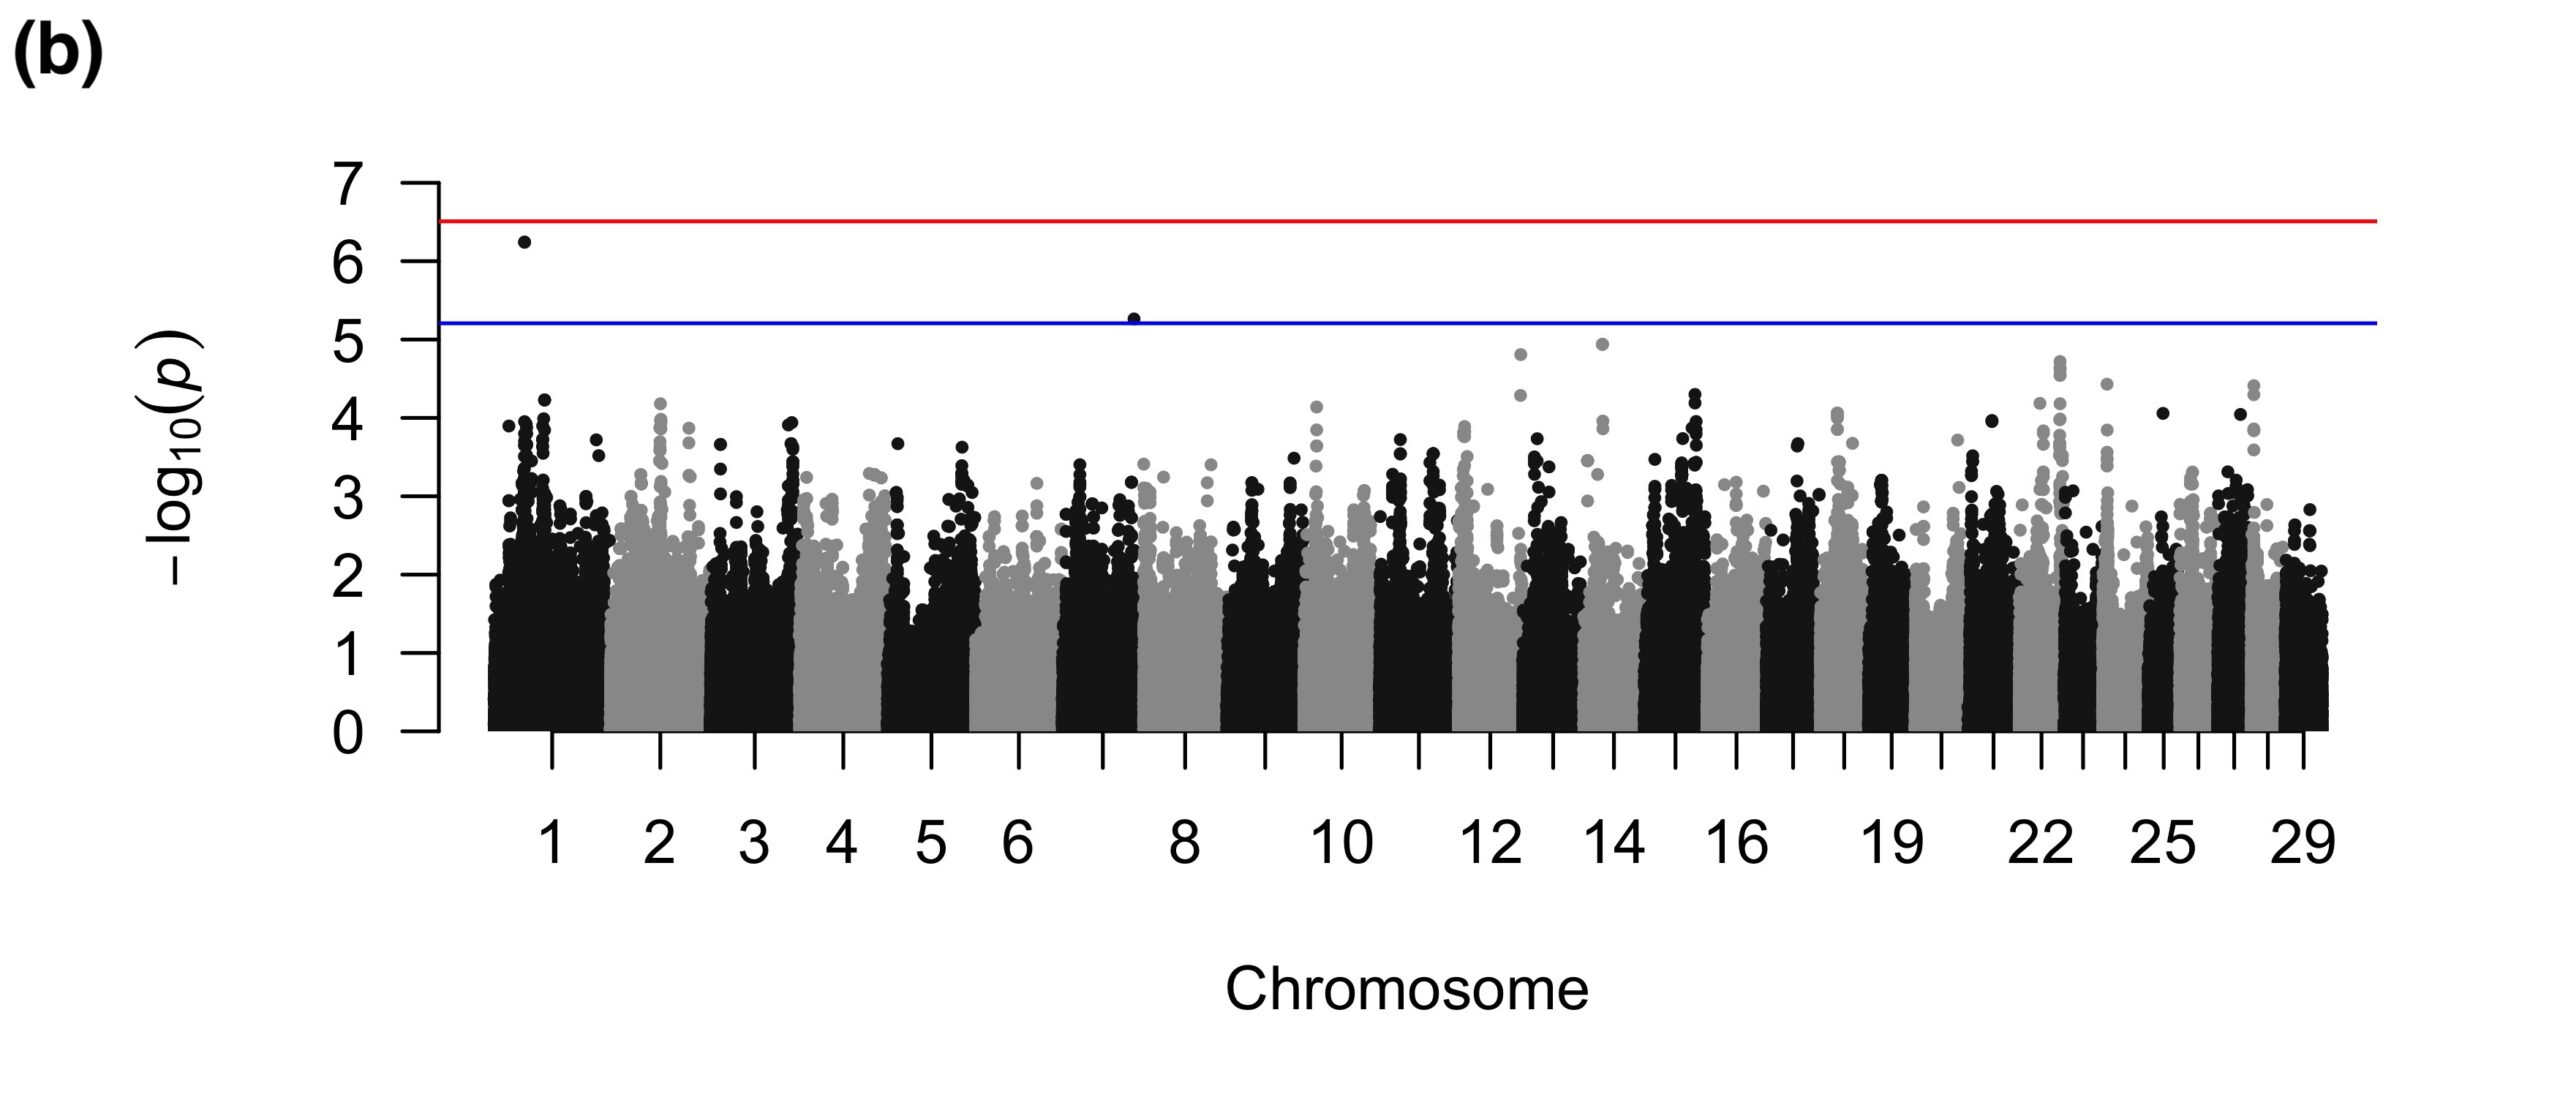
The binary FW GWAS revealed 15 suggestive SNPs on BTA1 and two suggestive SNPs on BTA2 (Figure 2a). The SNPs on BTA1 fell in introns of a gene related to body weight and neuronal function, which are not apparently related to FW. One of the suggestive SNPs on BTA2 was near a spliceosomal snRNA, whereas the other SNP was intergenic. The quantitative FW GWAS also detected SNPs on BTA2; interestingly, the one significant and eight suggestive SNPs for the quantitative analyses were in a different region than those detected in the binary GWAS and all were intergenic (Figure 2b).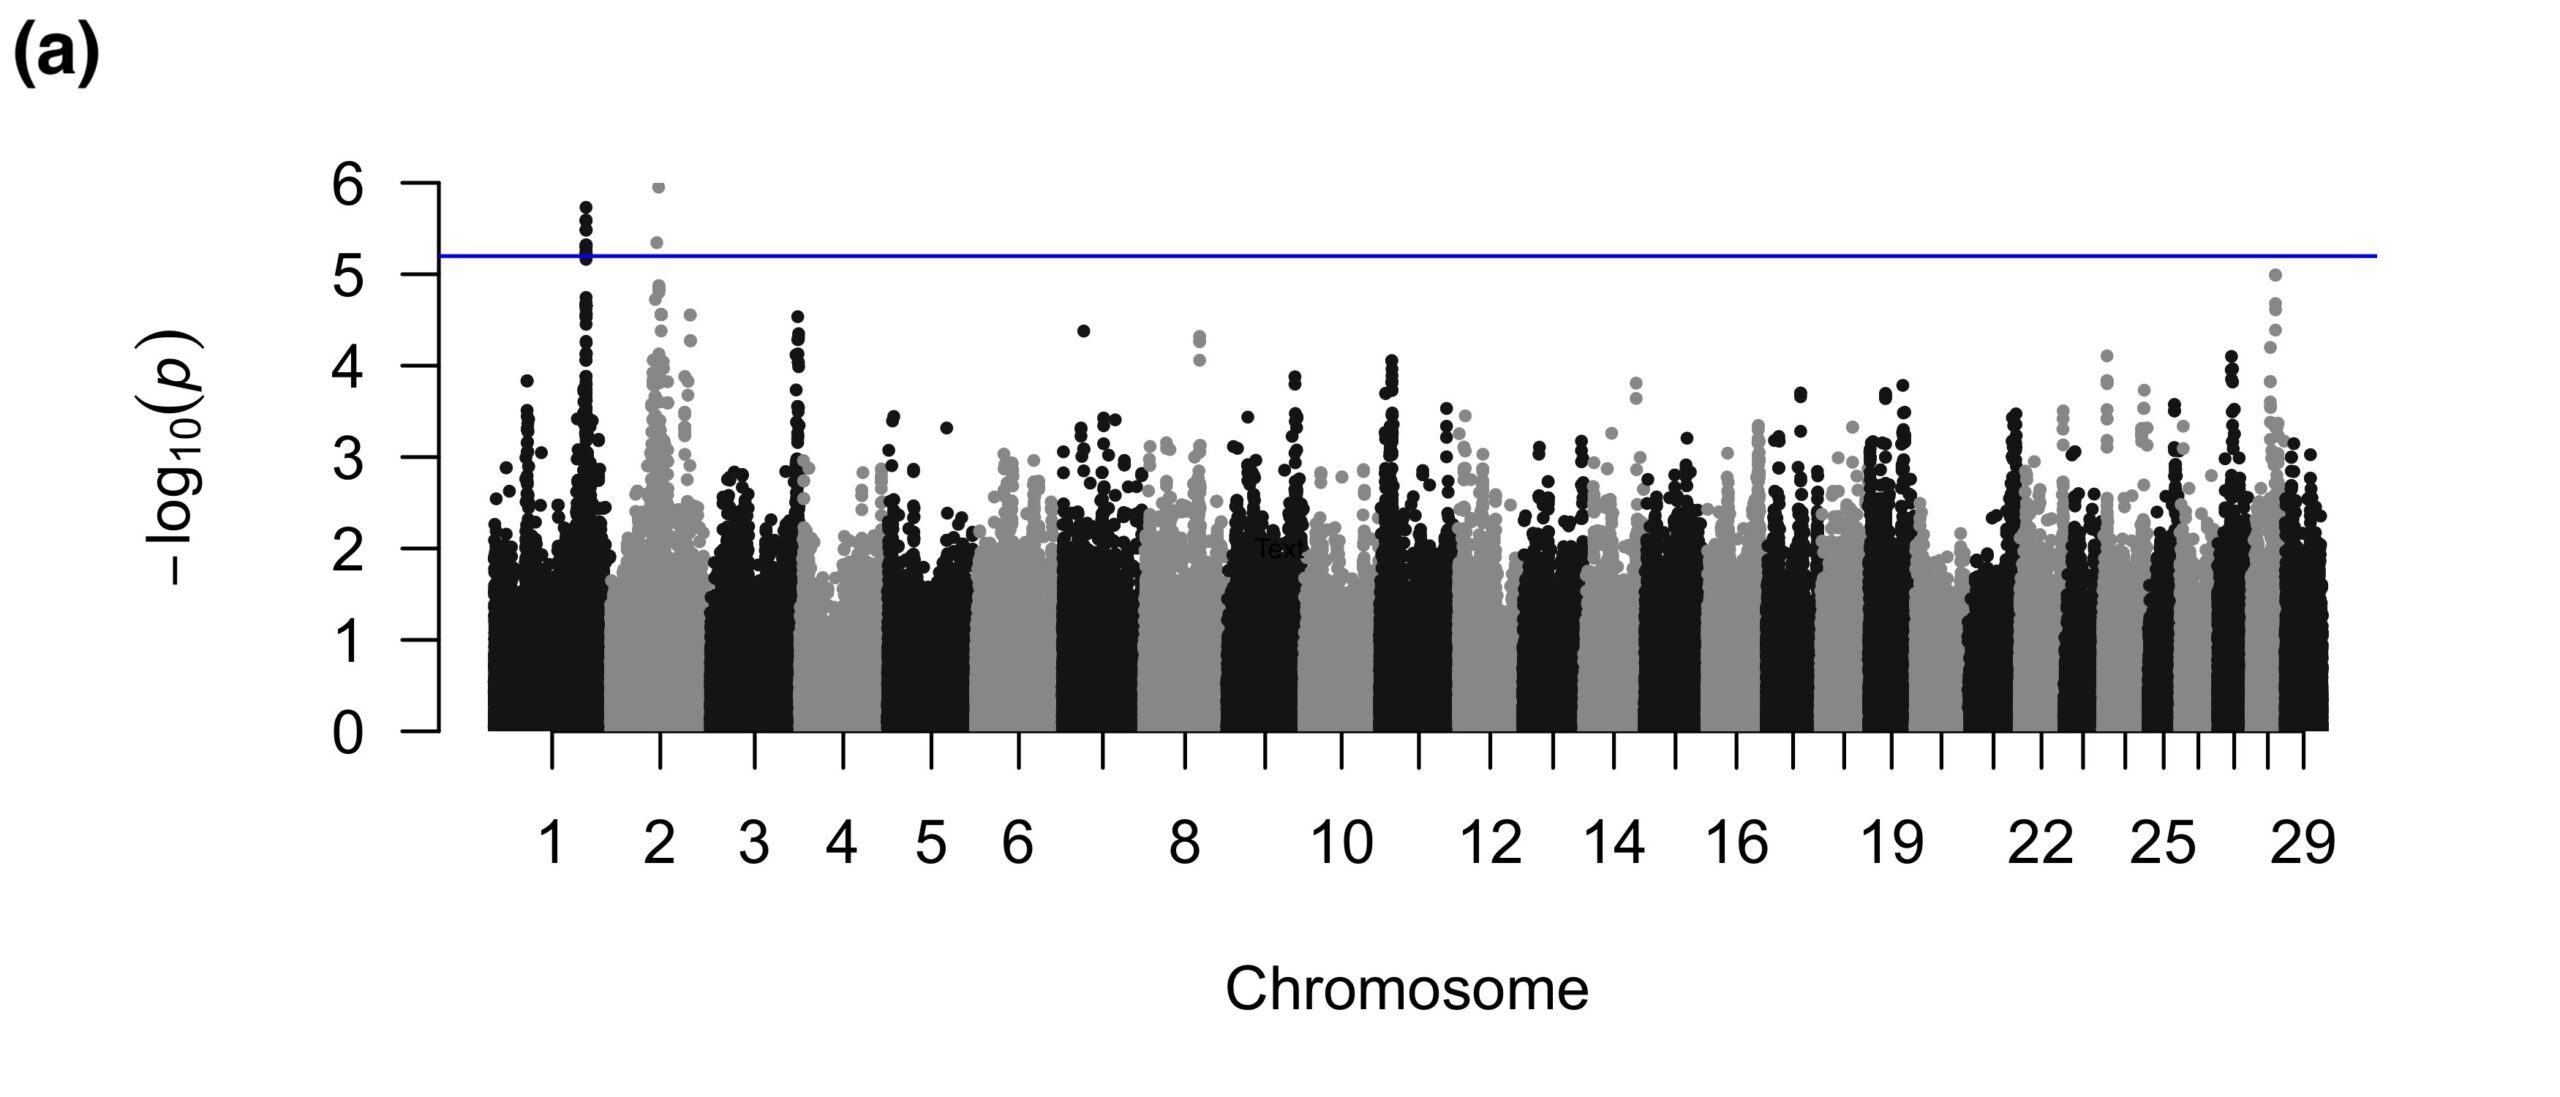
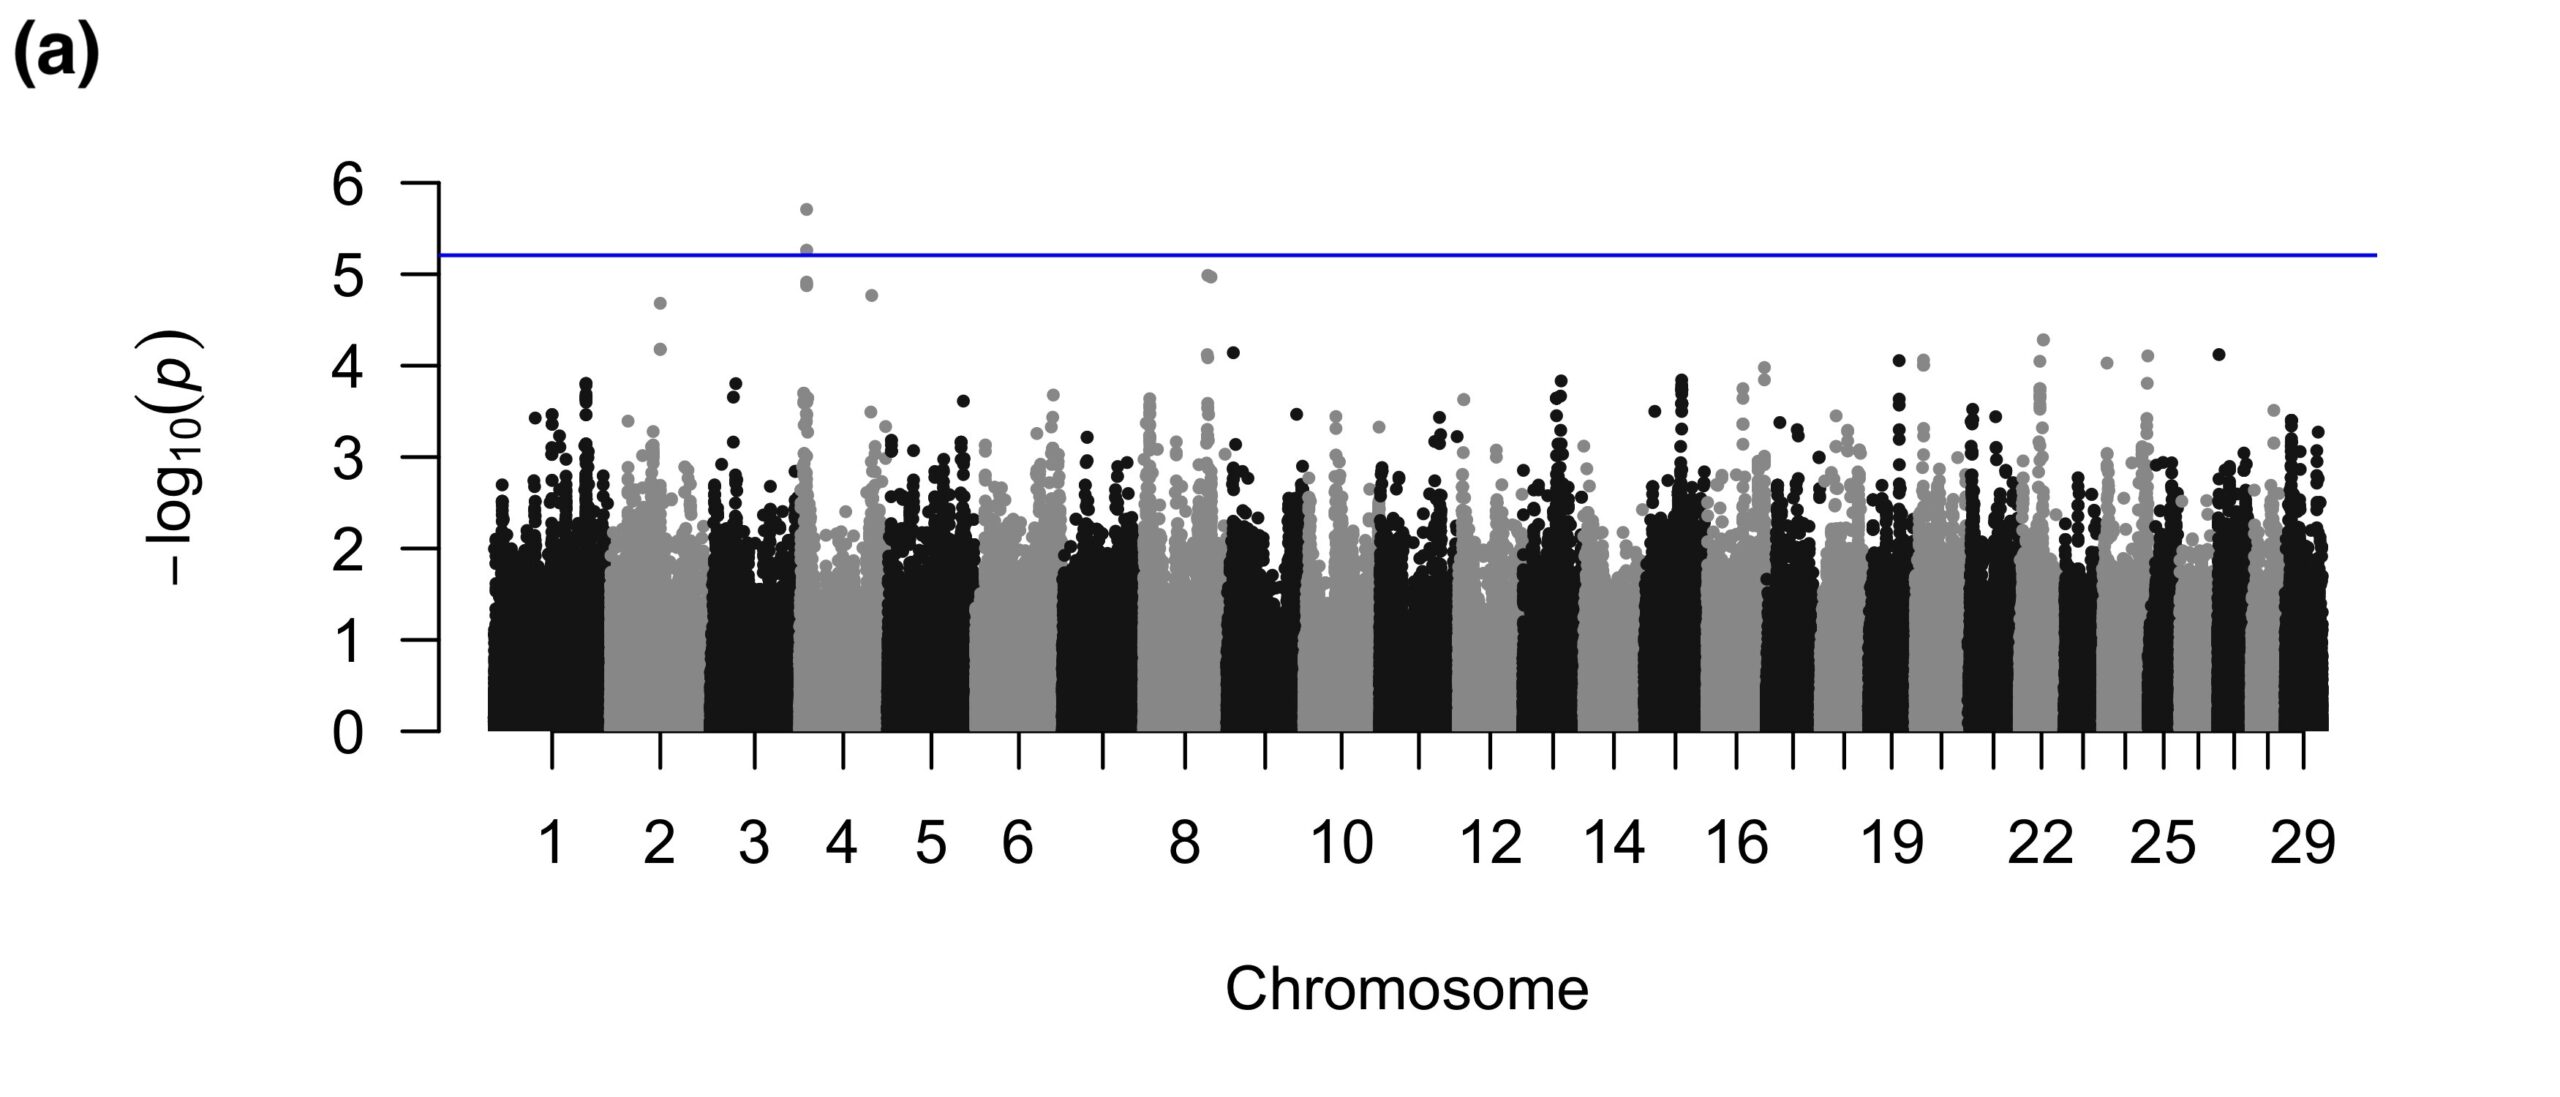
For SU, the binary GWAS found three suggestive SNPs in introns of a gene related to immune function (Figure 3a), which could be involved in the inflammation of sole soft tissues that sometimes precedes the development of a SU (Newsome et al., 2017). The quantitative GWAS found two suggestive SNPs on BTA1 that were intronic to a gene that was not apparently related to SU and one intergenic suggestive SNP on BTA7 (Figure 3b).
Inspecting the most strongly associated SNPs for candidate genes could potentially elucidate the mechanism of FW and SU development offering selection insight. It is also possible to circumvent the actual combined the two approaches. We demonstrated that when all SNPs, regardless of association significance or functional relevance, were used to calculate cvBLUPs, the PRSs based on the cvBLUP SNP effects were strongly correlated with phenotypes (> 0.9 after adjusting for farm differences) using the quality-filtered 550K SNPs from the HD SNP array and the quality-filtered 33K SNPs from the 50K SNP array. The strong correlation between PRSs and actual phenotypes indicates that within this population of five dairies, the SNP genotypes of the cows were strongly predictive of phenotypes. Furthermore, genomic prediction using the industry standard 50K SNP array was sufficient to accurately predict phenotypes in this population. Thus, in addition to our data pointing to some candidate genes to explore further, our results indicated that the SNP genotyping can be used effectively to predict susceptibility for FW and SU and incorporated into future genotyping selection practices.
Our results demonstrated that FW and SU susceptibility are complex traits with a nontrivial environmental effect, and the remaining genetic component is likely comprised of many small effect loci contributing to disease. Certain genomic regions were identified as potentially associated with either overall susceptibility (binary) or severity of disease (quantitative) and using genome-wide SNPs generated highly predictive cvBLUP-based PRSs. The identified genomic regions and the SNP effects estimated from cvBLUP should be useful in combination with current genetic methods (e.g. bull proofs, genotyping heifers) and supplement environmental control to reduce FW and SU.
Citations
Chang, C.C., C.C. Chow, L.C. Tellier, S. Vattikuti, S.M. Purcell, and J.J. Lee. 2015. Second-generation PLINK: rising to the challenge of larger and richer datasets. Gigascience 4:7. doi:10.1186/s13742-015-0047-8.
Evans, N.J., J.M. Brown, I. Demirkan, P. Singh, B. Getty, D. Timofte, W.D. Vink, R.D. Murray, R.W. Blowey, R.J. Birtles, C.A. Hart, and S.D. Carter. 2009. Association of unique, isolated treponemes with bovine digital dermatitis lesions. J. Clin. Microbiol. 47:689–696. doi:10.1128/JCM.01914-08.
Li, M.-X., J.M.Y. Yeung, S.S. Cherny, and P.C. Sham. 2012. Evaluating the effective numbers of independent tests and significant p-value thresholds in commercial genotyping arrays and public imputation reference datasets. Hum. Genet. 131:747–756. doi:10.1007/s00439-011-1118-2.
McLaren, W., L. Gil, S.E. Hunt, H.S. Riat, G.R.S. Ritchie, A. Thormann, P. Flicek, and F. Cunningham. 2016. The Ensembl Variant Effect Predictor. Genome Biol. 17:122. doi:10.1186/s13059-016-0974-4.
Newsome, R.F.F., M.J.J. Green, N.J.J. Bell, N.J.J. Bollard, C.S.S. Mason, H.R.R. Whay, and J.N.N. Huxley. 2017. A prospective cohort study of digital cushion and corium thickness. Part 1: Associations with body condition, lesion incidence, and proximity to calving. J Dairy Sci 100:4745–4758. doi:10.3168/jds.2016-12012.
Pérez O’Brien, A.M., G. Mészáros, Y.T. Utsunomiya, T.S. Sonstegard, J.F. Garcia, C.P. Van Tassell, R. Carvalheiro, M.V.B. da Silva, and J. Sölkner. 2014. Linkage disequilibrium levels in Bos indicus and Bos taurus cattle using medium and high density SNP chip data and different minor allele frequency distributions. Livest. Sci.. doi:10.1016/j.livsci.2014.05.007.
Purcell, S., and C. Chang. 2015. PLINK 1.9. https://www.cog-genomics.org/plink2.
Shearer, J.K., and S.R. van Amstel. 2017. Pathogenesis and Treatment of Sole Ulcers and White Line Disease. Vet Clin North Am Food Anim Pr. 33:283–300. doi:10.1016/j.cvfa.2017.03.001.
USDA. 2016. Dairy 2014, Dairy Cattle Management Practices in the United States. USDA–APHIS–VS–CEAH–NAHMS, Fort Collins, CO.
Yang, J., S.H. Lee, M.E. Goddard, and P.M. Visscher. 2011. GCTA: a tool for genome-wide complex trait analysis. Am. J. Hum. Genet. 88:76–82.
Research outcomes
Education and Outreach
Participation summary:
We have maintained regular contact with the dairy producers, all of whom are interested in genomic selection and having more refined and financially feasible options. We will continue to collect samples to refine our genome wide association analyses before we present our findings to other producers and other stakeholders at conferences. Our poster abstract for the American Dairy Science Association Annual Meeting 2020 was accepted, but due to the COVID-19 pandemic, we are postponing our attendance to 2021. We have also submitted a poster abstract to the Annual International Symposium on Milk Science and Health. We have worked with the local county advisors to share our approach and they in turn have let producers know of our efforts. We are in the process of drafting manuscripts and once published will actively disseminate our findings.
To engage the public, Ellen Lai, the doctoral student, has also been communicating our research through giving talks to high school students during their visit to the UC Davis campus, designing and exhibiting a booth Picnic Day at UC Davis (an annual campus-wide open house event for the public), and becoming a finalist in the UC Davis Grad Slam competition, in which participants have three minutes to convey the significance of their research to a lay audience.