Final report for GW18-151
Project Information
In low rainfall areas of the northern Great Plains, cover cropping is aimed at greening the summer fallow period. Over time, soils may improve sufficiently so that the increased crop return outweighs the cost of cover crops. This study utilized two on-farm sites (Amsterdam and Conrad, MT) that were begun in 2012 (SARE Project SW11-099) in dryland Montana to compare different plant functional groups’ effects on soil properties. Eleven treatments were included in this replicated plot-scale study, including paired plant species representing four plant functional groups (brassicas, fibrous rooted, nitrogen fixing, and tap rooted crops) in various combinations and sole pea and chemical fallow as controls. The experimental design provides a unique opportunity to test each functional group, whereby 1) each group appears separately as four functional group treatments (‘presence’), 2) they appear together in a complete mixture, and 3) the complete mixture minus each functional group (‘absence’). Due to the semi-arid climate, biomass production is low and so more time is required to see soil differences, highlighting the importance of this 8-year long term study. This research investigated the role of cover crops verse fallow ground, plant functional groups within cover crop mixtures, and diversity within mixtures, which all may allow for more strategic design of cover crop seed mixes for targeted soil improvement. Cover crops containing nitrogen fixers produced more biomass than mixes that didn’t contain nitrogen fixers at Amsterdam, but not consistently so at Conrad. This study found that when comparing soil that grew cover crops to bare soil (summer fallow), no differences were seen in soil enzymes or arbuscular mycorrhizal colonization after four cover crop cycles. Potentially mineralizable nitrogen (PMN) was higher in the cover crop plots (pea and full mix) than the summer fallow plot at the Amsterdam site at the medium N rate (p < 0.01). When comparing the four functional groups not many differences were seen in the biological soil parameters. Soil enzymes, PMN, and microbial biomass did not show any differences by plant functional group. Arbuscular Mycorhizal Fungi (AMF) had higher colonization rates in the wheat following the fibrous root treatment than the brassica treatment at the Conrad site, likely due to the fact that brassica’s do not make mycorrhizal associations (p < 0.01). Summer fallow had a higher wheat grain yield at Amsterdam than the full mix and the pea treatment for the medium N rate, whereas no differences were seen between the three at the Conrad site. As expected, wheat following a mix that contain nitrogen fixers tended to have higher protein content than mixes without nitrogen fixers. This research provides a strong cautionary statement about producer expectations in soil improvement with cover crops in this low rainfall, semi-arid region.
Soil and Agronomic Objectives
1. To investigate how biomass production compares among the ten cover crop treatments included in this study.
2. To measure how plant functional groups affect biological, chemical, and physical soil properties, and subsequent wheat yields and protein, differently.
Educational Implications
3. To increase local producer knowledge of the value, or lack there-of, for cover crop mixtures compared with less diverse cover crops for biomass production, soil water and nitrogen use, and change in biological, chemical, and physical soil properties.
4. To provide producers with information regarding the potential benefits of alternative cover crops through scientific publications, extension publications, popular press articles, social media, public presentations, and research summaries and factsheets.
The results of this research will provide fundamental knowledge on the ability of different plant functional groups to change soil properties distinctly. This base knowledge will be helpful in optimizing strategies for deploying cover crop mixtures over time and to serve specific functions
to the soil.
Cooperators
- (Educator and Researcher)
- (Educator and Researcher)
Research
Study sites
The study takes place on two private farm fields located near Amsterdam(N 45.72°, W 111.37°) and Conrad (N 48.22°, W 111.48°), Montana. Both sites had extensive no-till farming histories prior to this study and were managed as commercial wheat farms. The Amsterdam field site receives an average of 356 mm of precipitation annually and has a silt loam soil type which is classified as frigid, Aridic Calciustoll. The Conrad site receives an average of 280mm of precipitation annually and has a clay loam soil type that is classified as frigid, Aridic Argiustolls. Table 1 shows initial conditions at each field site.
|
Table 1. |
||
|
Site |
Amsterdam |
Conrad |
|
Elevation (ft) |
4740 |
3410 |
|
Texture |
Silt loam |
Clay loam |
|
pH |
8.2 |
6.5 |
|
SOM (%) |
2.4 |
2.4 |
|
NO3-N (ppm) |
6.0 |
8.5 |
|
Olsen P (ppm) |
13 |
28 |
|
Extractable K (ppm) |
359 |
498 |
Study Design
The study consists of four randomized complete blocks with 11 treatment plots. Four plant functional groups were examined: brassicas, fibrous root crops, nitrogen fixers, and tap root crops. Table 2 shows the species and varieties selected for this study. Brassicas were selected for rapid establishment of ground cover and their unique phytochemistry; fibrous roots were chosen for their expansive root system and hence C inputs into the soil; nitrogen fixers were picked for their capacity to add nitrogen to the system; and tap roots were chosen for the deeper rooted structures to penetrate hard pans and reduce soil compaction. Two species of a functional group were grown in individual plots (8 x 12m), along with a full mix plot containing all four functional groups (8 cover crop species). There were also 4 additional treatments that contain the full mix minus each functional group (containing 6 cover crop species). The last two treatments were a sole species cover crop (Pea) and a chemical fallow plot, which were used as control plots.
|
Table 2. Plant species included in 10 cover crop treatments and a chemical fallow control. |
||
|
Treatment |
|
Plant Species |
|
Fallow |
Fallow |
Incidental weeds |
|
Pea |
Pea |
Forage Pea |
|
Full Mix |
Full |
Forage pea (Pisum sativum L. cv. Arvika) Black lentil (Lens culinaris Medik. cv. Indianhead) Oat (Avena sativa L.) Canaryseed (Phalaris canariensis L.) Turnip (Brassica rapa L.) Safflower (Carthamus tinctorius L.) Forage Radish (Raphanus sativus L. var. longipinnatus) Winter canola (Brassica napus L.) |
|
Brassicas |
Brass |
Forage radish, Winter canola |
|
Minus Brassicas |
Mbrass |
All but canola, radish and turnip |
|
Fibrous Roots |
Fiber |
Oat, Canaryseed |
|
Minus Fibrous Roots |
Mfiber |
All but oat and canaryseed |
|
Nitrogen Fixers |
Nfix |
Forage pea, Black lentil |
|
Minus Nitrogen Fixers |
Mnfix |
All but pea and lentil |
|
Taproot |
TR |
Turnip, Safflower |
|
Minus Taproots |
MTR |
All but turnip and safflower |
Plot Design
Each of the 11 treatments was randomly assigned to an 8 x 12-m plot in each of the 4 replicated blocks (Figure 1). The cover crop plots were planted in early May and all species were planted 1 to 2 cm deep. All treatment plots were seeded at 120 plants m-2 to eliminate biasing biomass in favor of plant species with higher grain seeding rates. The subsequent year, following cover crop treatments, wheat was grown to assess a cash crop response to the cover crop treatments. Each wheat cycle, winter wheat and spring wheat were rotated in. Wheat was seeded in rows perpendicular to the cover crop rows. Nitrogen fertilizer was applied to the wheat crop at three different rates, (0 lbs N-ac-11, 60 lbs N-ac-11, and 120 lbs N-ac-1) with a split plot design. The study began in 2012 with the first round of cover crop treatments and has followed this rotation and fertilizer treatments since. Cover crop plots were terminated with glyphosate in early July after approximately 60 days of growth.
Soil Investigation
Soil samples were taken in early April 2019 at the time of wheat planting (about 10 months after cover crops were terminated). The timing provides a measure of soil conditions at the point when the wheat began seasonal growth. The fallow, sole pea, and full mix treatment groups were measured at all three fertilization rates. Samples for the remaining treatments were taken at the middle nitrogen fertilization rate (60 lbs N-ac-1), unless otherwise stated. Soil push corers (2-cm dia), were used to sample the top 10 cm of soil. Six composite cores were taken in each treatment plot. The corer was rinsed with ethanol and then flamed to sterilize the coring instrument between plots. Field moist composited samples were put through a 2-mm sieve and stored at 4 °C until lab analyses were performed.
Biological
Potentially Mineralizable Nitrogen
Potentially mineralizable nitrogen (PMN) was analyzed as adapted from Keeney (1982), by calculating the difference between plant-available nitrogen at the time of soil collection and after an incubation period. Six flasks received 5g of soil, three of which were analyzed immediately using the 1 M KCl extraction method and analyzed using a Lachat auto analyzer (Lachat Instruments, Loveland, CO). The additional three flasks were pumped with N2 gas for 5 seconds to create anoxic conditions and were kept in a dark incubator at 30 °C for 14 days. These samples were then analyzed using the same KCl extraction method and Lachat.
Soil enzymes
Soil enzyme activity was analyzed for all treatments using the procedure outlined by Dick (1996; 2011) and Parham and Deng (2000). 1 g of field-moist soil was weighed in duplicate for each sample along with controls. Samples were incubated with the enzyme-specific substrate for 1 hr at 37 °C, then filtered and analyzed spectrophotometrically. Five enzymes were analyzed: b-1,4-glucosidase (EC 3.2.1.21), b-1,4-N-acetyl glucosaminidase (EC 3.2.1.30), arylsulfatase (EC 3.1.6.1), acid phosphatase and alkaline phosphatase (EC 3.1.3.1/2). Geometric means were calculated for each plot by taking the fifth root of the products of all enzymatic activity (Garcia-Ruiz et al., 2008). Enzyme analyses were performed on the four functional groups (brassica, fibrous root, tap root, nitrogen fixers), the full mix, and both controls (summer fallow, sole pea) at the 60 lbs N-ac--1 fertilization rate. b-1,4-N-acetyl glucosaminidase was also analyzed at all three nitrogen fertilization rates for the fallow, pea, and full mix treatments.
Microbial Biomass
Microbial biomass was measured on soil from the four functional group plots (brassica, fibrous root, tap root, nitrogen fixers), the full mix, and both controls (summer fallow, sole pea) at the 60 lbs N-ac-1 fertilization rate, using substrate induced respiration (SIR; Fierer et al., 2003). 5 g of soil was weighed and put into a 50mL falcon tube, then a yeast solution was added and tubes were put on a shaker table for 4 hours. The CO2 concentration in the headspace of the tubes were measured at the time of yeast addition, as well as 2 hours and 4 hours after the yeast addition, via gas chromatography (Varian CP 3800 gas chromatograph; O’Dea, 2011). The rate of SIR is used as an index of microbial biomass (Fierer et al. 2003).
Mycorrhizal colonization
Mycorrhizal colonization was measured on wheat that was grown following the four functional groups (brassica, fibrous root, tap root, nitrogen fixers), the full mix, both controls (summer fallow, sole pea), and the minus brassica treatment at the 60 lbs N-ac- fertilization rate. Single wheat plants were harvested at the time of wheat anthesis in duplicate, and roots were collected for analysis. Roots were cleared with KOH and stained with trypan blue (McGonigle et al., 1990). Mycorrhizal structures (arbuscules, vesicles, hyphae) were counted using the gridline intersection method on a compound microscope under 200x magnification.
Physical
Soil water was measured to a 36-in depth using the gravimetric weight loss method at the time of cover crop termination in July and measured again at time of wheat seeding in early April. Four depth increments were measured: 0-4 in, 4-12 in, 12-24 in, and 24-36 in and two composite samples were collected for each treatment. Soil bulk density was calculated for all four depths as well. Prior to spring wheat planting, water infiltration was measured for the big three treatments (fallow, sole pea, and full mix) at the middle N rate only, using double-ring infiltrometers. Soil penetration resistance measurements were taken within (or in close proximity to) the infiltrometer ring 24-48 hours after infiltration measurements were taken, using a hand-held static cone penetrometer. Soil penetration resistance was measured in this way because consistent soil moisture is important to accurately compare soil compaction when using a hand-held static cone penetrometer (Durham Geo-Enterprises Inc.- Nova Metrix, Wakefield, MA).
Chemical
The chemical parameters were measured at all three nitrogen fertilization rates for the sole pea, fallow, and full mix treatments. The chemicals parameters were only measured at the 60 lbs-N-ac-1 for the remaining 8 treatments. Soil nitrate was measured in four increments for the top 36 inches in early spring at the time of wheat planting. Depth increments include: 0-4 in, 4-12 in, 12-24 in, and 24-36 in and two composite samples were collected for each treatment. Nitrate was measured by using soil that had been oven dried at 50°C and sieved through a 5mm sieve. 5g of soil from each sample was then added to 25mL of KCl and mechanically shaken for 30 minutes and filtered through a Whatman #5 filter. The solution was then analyzed using a latchet auto analyzer (Lachat Instr., Loveland, Colorado).
Cover Crop Biomass and Quality
Above-ground cover crop biomass was sampled by hand immediately prior to glyphosate application in all 11 treatments. Plants were cut at the soil surface (for turnip, the root bulb portion above soil surface is included), separated by functional group or weeds, dried for >72 hour at 50°C and weighed directly out of the oven. Then each sample is ground to pass a 2-mm sieve for analysis of C and N with a LECO combustion analyzer (LECO Corp., St. Joseph, Michigan).
Wheat Analysis
Wheat from each treatment plot was measured after fully maturing. Wheat biomass samples were collected for a 3 ft-row for each subplot. This allowed net primary production and harvest index to be measured. The rest of the subplot was harvested using a plot combine to measure grain yield, grain protein, and test weight. Grain moisture, protein, and test weight was analyzed with an Infrared 1241 Grain Analyzer at a 120 g kg–1 water content standard.
Statistical Analysis
The R statistical package was used for all statistical analyses for the objectives in this study. Cook’s distance with a value of 4, was used to assess outliers. Residuals vs fitted value plots and Q-Q plots were used to check the assumptions (normality and equal variance) for both ANOVAs and mixed models. If an assumption was not met, transformations were used to normalize data. Several enzymes were log transformed (base 10) before being analyzed. Linear mixed effects models were used, where block was always the random effect variable, treatment was the fixed effect variable and the soil/wheat parameter was the response variable. Site locations were analyzed separately due to site differences and varying levels of precipitation. Mixed models and two way ANOVAs were used to test for a treatment effect on all parameters. Interaction terms were considered when appropriate and top down model refinement techniques were used. Significant differences were determined using Fisher’s LSD ( α = 0.10).
The first objective of this study was to investigate how biomass production compares among the ten cover crop treatments included in this study and incidential weeds in the fallow control (Figure 1). Legume treatments (pea and nitrogen fixers) yielded best at the Amsterdam site. This indicates that nitrogen was limiting plant growth. At the Amsterdam site, there was 2.5 times more biomass for the nitrogen fixer treatment than for the minus nitrogen fixer treatment (p-value < 0.0001). At the Conrad site, there was almost 2 times more biomass for the nitrogen fixer treatment than for the minus nitrogen fixer treatment (p-value = 0.01). This supports the previous claim that the system was nitrogen limited.
A contrast was run between the 2-species treatments (functional groups) and the 6-species treatments (minus functional groups) for each site to test if biomass was associated positively with a higher number of species in the mix. The Amsterdam site revealed no statistical difference between the 2-and 6-species treatments (p-value = 0.33). At the Conrad site, the 6-species treatments out-yielded the 2 species treatments by about 20% (p-value = 0.01), however there was greater variation due to the higher mass of weeds at this site.
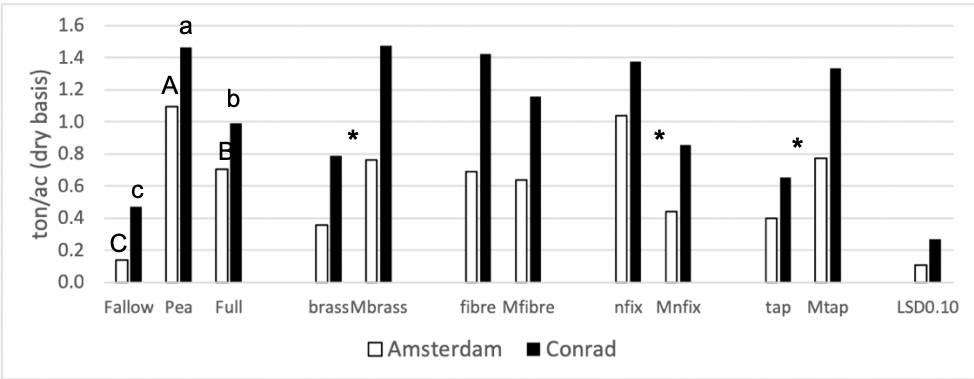
Figure 1: 2018 Cover crop biomass (tons acre- dry basis) for all 11 treatment. Each site location was analyzed separately. Summer fallow, full mix, and pea are compared then pairwise comparisons for each of the four functional groups (BC, FR, NF, TR) and their corresponding minus treatments are compared individually. Means that differ from one another (P<0.10) are marked with different letters. Means that do not differ (P>0.10) are left blank. * = pairwise comparison at both sites differ from one another.
The second objective of this study was to measure how plant functional groups affect biological, chemical, and physical soil properties, and subsequent wheat yields and protein, differently. Many soil parameters were chosen to investigate, with a strong focus being placed on the biological soil parameters. Figure 2 shows the available soil water to a 3-foot depth after the cover crops have been terminated. By looking at figures 1 and 2, water use is proportional to the amount of biomass each treatment grew, which is to be expected.
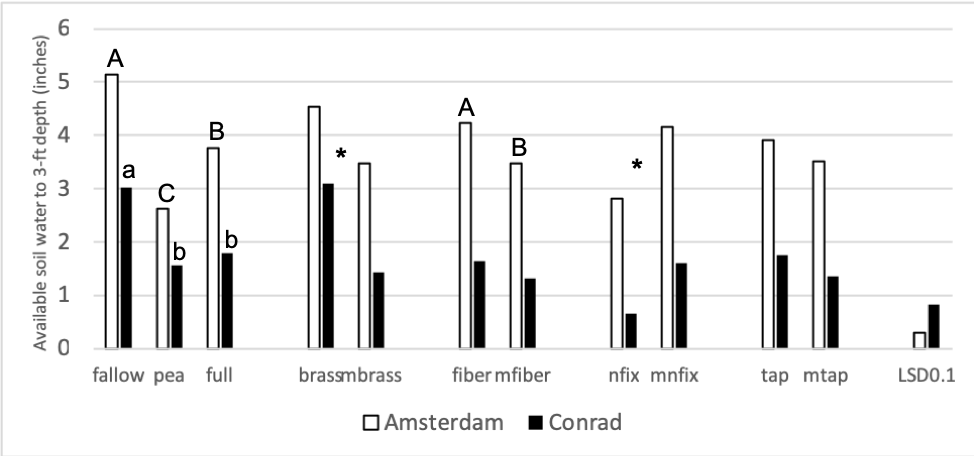
Figure 2: Available soil water (inches) to a 3 ft depth at the time of cover crop termination in 2018. Each site location was analyzed separately. Summer fallow, full mix, and pea are compared then pairwise comparisons for each of the four functional groups (BC, FR, NF, TR) and their corresponding minus treatments are compared individually. Means that differ from one another (P<0.10) are marked with different letters. Means that do not differ (P>0.10) are left blank.
Figure 3 shows soil nitrate-N levels after cover crop termination in 2018 for the fallow, pea, and full treatments. There were no statistical differences between nitrate values for fallow, pea, and the full mix at Conrad and there were no differences between pea and the full mix at Amsterdam. At Amsterdam, the fallow treatment had 2 times as much nitrate- N in the soil than the pea and fallow treatments. The observed soil nitrate values at Conrad were highly variable due to drought experienced in the previous wheat stage in 2017.
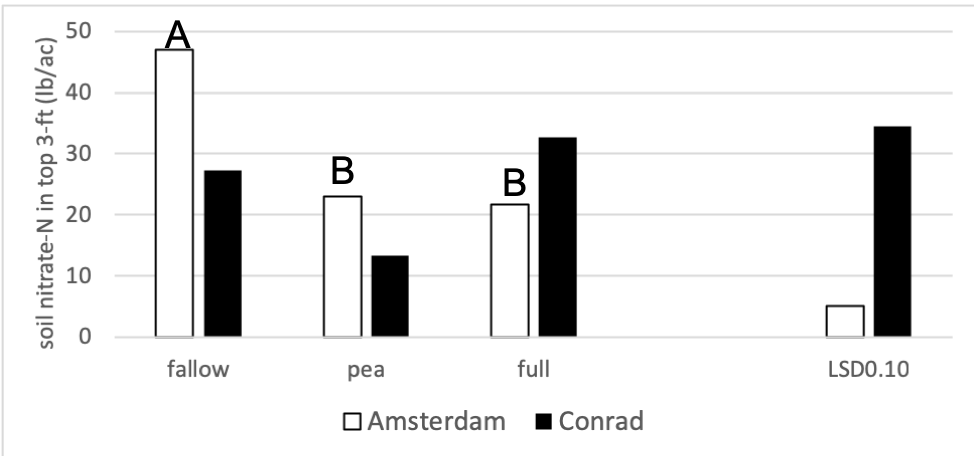
Figure 3: Soil nitrate-N (lbs acre-1) in the top 3 ft for the fallow, full mix and pea treatments in 2018. Each site location was analyzed separately. Means that differ from one another (P<0.10) are marked with different letters. Capitol letters represent the Amsterdam site. Means that do not differ (P>0.10) are left blank.
Potentially Mineralizable Nitrogen
Potentially mineralizable nitrogen was measured at all three nitrogen rates for the full mix, summer fallow, and sole pea treatments. To maintain a balanced design, we analyzed this data set separately from the rest of the PMN data. A mixed linear effects model was used where treatment and fertilizer rate were fixed effects and block was a random effect. Interaction terms were not significant to the model. At both the Amsterdam and Conrad sites fertilizer rate did not significantly change PMN values. After accounting for differences due to block and fertilizer rate, a treatment affect was present at both Conrad (F = 4.37, p = 0.02) and Amsterdam (F = 21.1, p < 0.0001). Figure 5 shows the average PMN values for the fallow, full mix, and pea treatments at three N rates (high, medium, low) at both site locations. At Conrad, Pea had higher PMN values than summer fallow (p < 0.01) after accounting for block and fertilizer rate. There was little to no evidence showing differences among any other pairwise comparison. At Amsterdam, both pea and the full mix have higher PMN values than summer fallow (p < 0.01 for both), after accounting for fertilizer
PMN was measured for all 11 cover crop/control treatments at the medium nitrogen rate (60 lbs N-ac-1) (Figure 4). At the Amsterdam site, both pea and the full mix have higher PMN values than summer fallow at the medium nitrogen rate (p <0.01), while there were no differences between the full, pea, and summer fallow treatments at Conrad. Pre-planned orthogonal contrasts were used to compare the presence vs absence of each functional group (functional group vs minus functional group) at the medium nitrogen rate. There were no differences between any of the pairs at either site. A two-species (the four single-functional group treatments) verse six-species (four minus treatments) contrast was analyzed at both field sites for the medium nitrogen rate (60 lbs N-ac-1). At both sites, the six species mixes had higher PMN values than the two species mixes (Amsterdam: p = 0.0037, Conrad: p = 0.0222).
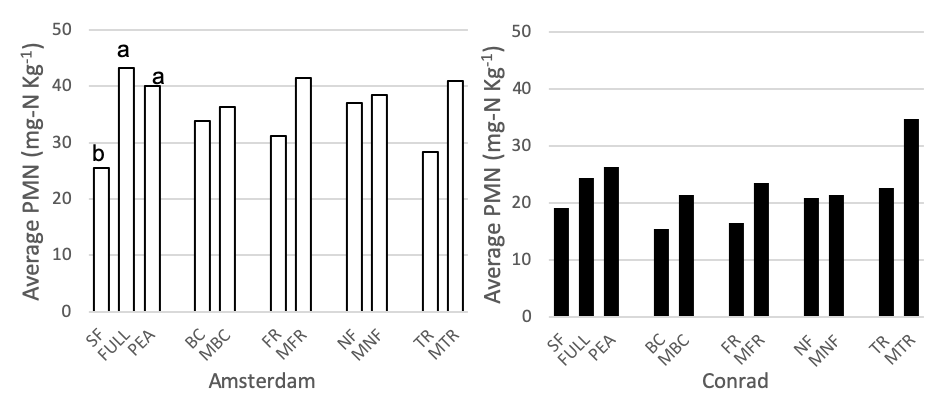 Figure 4. Potentially mineralizable nitrogen (mg-N Kg-1) for 11 treatments at the medium nitrogen rate, following four rotations of cover crops at two field sites (2019). Summer fallow, full mix, and pea are compared then pairwise comparisons for each of the four functional groups (BC, FR, NF, TR) and their corresponding minus treatments are compared individually. Means that differ from one another (P<0.10) are marked with different letters. Means that do not differ (P>0.10) are left blank.
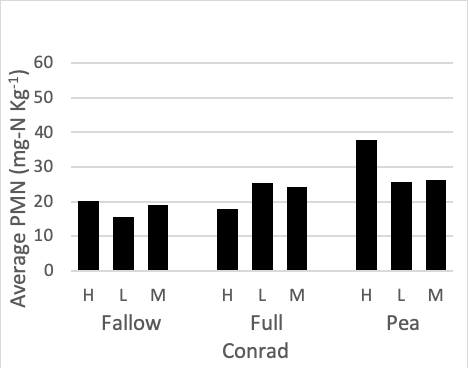
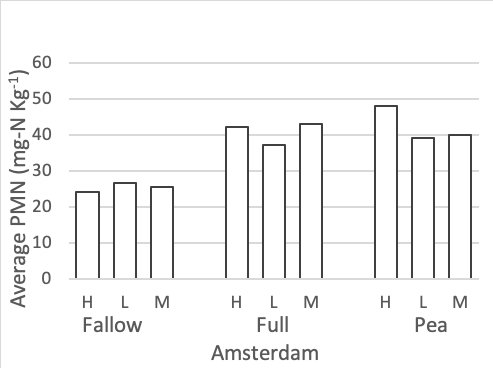
Figure 5. Potentially mineralizable nitrogen (mg-N Kg-1) for summer fallow, full 8-spp mix, and sole pea treatments at three nitrogen rate (high: 120 lbs-N ac-1, medium: 60 lbs-N ac-1, low: 0 lbs-N ac-1), following four rotations of cover crops at two field sites (2019).
Mycorrhizal Colonization
The four functional groups, minus brassica, full mix, and both control (sole pea and summer fallow) treatment plots were measured for mycorrhizal colonization during the subsequent wheat phase (Figure 6). At Conrad, arbuscular mycorrhizal colonization of wheat was 9% higher in the fibrous root plot than the full mix (p = 0.0015, t-value = 3.64) and 10% higher in the fibrous plot than the brassica plots (p = 0.0006, t-value = 4.04). At the Amsterdam location no differences between treatments were seen. Many studies have shown that reducing or eliminating the fallow periods (bare soil) with the use of cover crops increases arbuscular mycorrhizal fungus formation in the soil (Garcia-Gonzalez et al., 2016; De Vries and Bardgett 2012; Schipanski et al. 2014). However, none of these experiments took place in a semi-arid environment with such limiting annual precipitation.
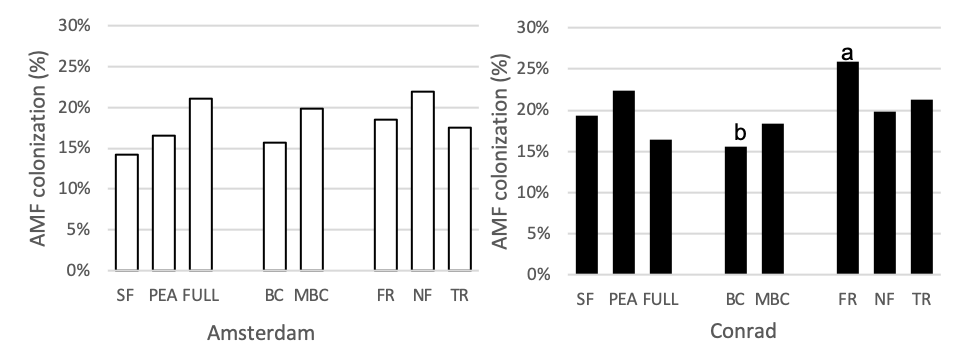
Figure 6. Arbuscular mycorrhizal colonization (%) for 8 treatments at the medium nitrogen rate, following four rotations of cover crops at two field sites (2019). Summer fallow, full mix, and pea are compared then the four functional groups (BC, FR, NF, TR) are compared separately. Means that differ from one another (P<0.10) are marked with different letters. Minus BC was included in this analysis and compared to the functional groups. Means that do not differ (P>0.10) are left blank.
Soil Enzymes
There were no differences in soil enzymatic geometric mean when comparing treatment effect at either site. After two rotations of cover crops, higher soil enzyme geometric means were observed in cover crop treatments compared to summer fallow (Housman et al., 2012). However, after 4 rotations of cover crops (8 years) distinct differences were not seen (Figure 7).
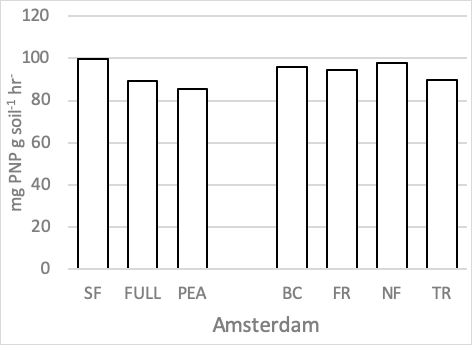
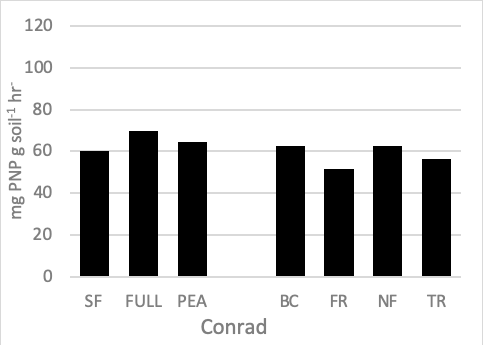
Figure 7. Geometric mean enzymatic activity (mg PNP g soil-1 hr-1) of five soil enzymes (ß- glucosidase, ß -glucosaminidase, acid and alkaline phosphatases, and arylsulfatase) for 7 treatments at the medium nitrogen rate, following four rotations of cover crops at two field sites. Means that do not differ (P>0.10) are left blank (without letters).
|
Table 3. Enzymatic activity (mg PNP g soil-1 hr-1) of five soil enzymes (ß- glucosidase, ß -glucosaminidase, acid and alkaline phosphatases, and arylsulfatase) for 7 treatments at the medium nitrogen rate, following four rotations of cover crops at two field sites. A = Amsterdam, C = Conrad |
||||||||||||
|
|
Acid Phosphatase |
Alkaline Phosphatase |
Arylsulfatase |
B-glucosidase |
B-glucosaminidase |
Geometric mean |
||||||
|
Treatment |
A |
C |
A |
C |
A |
C |
A |
C |
A |
C |
A |
C |
|
SF |
90.62 |
193.32 |
330.25 |
73.42 |
327.14 |
48.48 |
84.40 |
81.53 |
12.53 |
17.74 |
99.65 |
60.41 |
|
FULL |
88.05 |
217.80 |
336.47 |
72.85 |
259.67 |
70.85 |
78.75 |
92.03 |
10.33 |
17.17 |
89.55 |
69.56 |
|
PEA |
89.10 |
170.30 |
296.12 |
70.65 |
251.30 |
82.58 |
76.30 |
87.90 |
10.44 |
19.18 |
85.55 |
64.51 |
|
BC |
92.82 |
168.61 |
303.75 |
79.45 |
318.10 |
84.43 |
85.28 |
75.54 |
11.08 |
17.23 |
95.80 |
62.69 |
|
FR |
84.03 |
202.93 |
333.26 |
37.18 |
302.91 |
42.83 |
82.66 |
68.37 |
11.11 |
19.03 |
94.56 |
51.47 |
|
NF |
95.27 |
199.27 |
347.58 |
53.97 |
303.28 |
51.52 |
84.60 |
86.14 |
10.95 |
21.60 |
98.03 |
62.49 |
|
TR |
82.12 |
189.30 |
298.88 |
59.60 |
316.23 |
52.39 |
76.27 |
70.00 |
10.51 |
17.97 |
89.61 |
56.35 |
|
p-value |
0.79 |
0.69 |
0.2 |
0.22 |
0.44 |
0.6 |
0.79 |
0.28 |
0.86 |
0.72 |
0.53 |
0.41 |
|
F-stat6,18 |
0.52 |
0.65 |
1.63 |
1.52 |
1.02 |
0.77 |
0.52 |
1.35 |
0.41 |
0.61 |
0.88 |
1.09 |
|
LSD (0.1) |
ns |
ns |
ns |
ns |
ns |
ns |
ns |
ns |
ns |
ns |
ns |
ns |
Microbial Biomass
Mixed linear regression models were used to assess SIR-induced respiration rate as an index of microbial biomass at each site separately. Figure 8 shows the average SIR-induced respiration rate for the fallow, full mix, pea and four functional group mixes. Soil that had pea growing in it prior, had a higher microbial respiration rate than soil following summer fallow at the Conrad site (p = 0.0353, t-value = 2.28). The same pattern was seen at the Amsterdam site but was less significant (p = 0.06, t-value = 1.98). At the Conrad site, some evidence showed the full mix treatment plot had higher microbial biomass than the summer fallow treatment (p = 0.07, t-value = 1.92). No statistical differences were seen between functional groups at either field site.
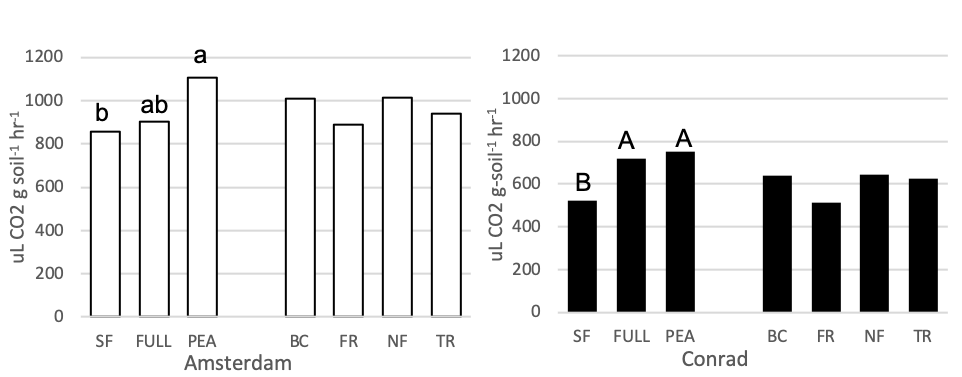
Figure 8. Microbial biomass (uL CO2 g-soil-1 hr-1) for 7 treatments at the medium nitrogen rate, following four rotations of cover crops at two field sites (2019). Summer fallow, full mix, and pea are compared then the four functional groups (BC, FR, NF, TR) are compared separately. Means that differ from one another (P<0.10) are marked with different letters. Means that do not differ (P>0.10) are left blank.
There were no observed differences in soil biological parameters between cover crop plant functional groups in this study. In semi-arid environments, where the system is most likely limited by biomass or carbon inputs, the soil microbial organisms are processing the cover crop biomass quickly enough where any soil biological changes that may have been present during cover crop growth, does not persist in the soil long enough for the changes to be seen by the cash crop (soils taken at wheat seeding). Although observed differences in enzyme activity was not seen, Lehman et al. (2015) points out an important limitation on current soil enzyme interpretation and how its real-world application is to optimize ecosystem functions and services from soil enzymes, the processes that control soil enzymatic communities (structure and function) must be understood. Enzyme geometric means were used in this study because it is considered unreliable to assume a single enzyme can represent the cycling of nutrients in the soil. This is because the total microbial activity serves much more complex functions within the soil which many biochemical reactions contribute to (Gil-Sortes, 2005). Enzyme production should increase when simple nutrients are scarce and complex nutrients are abundant because the enzymes have the ability to break down these complex nutrients (Allison and Vitousek, 2005), but in semi-arid environment such as this cover crop biomass may be the ultimate limiting factor.
Wheat Yield
Wheat yield for both site locations at three N rates are shown in Table 4. At the medium nitrogen rate, wheat following summer fallow had a higher yield than following the full mix or pea at the Amsterdam site, while no differences were seen for this same comparison at the Conrad site. Wheat following N fixers, at the medium N rate, had a higher yield than minus N fixers at the Conrad site. Brassica had a higher yield than minus brassica at the Amsterdam site at the medium N rate and this brassica response was observed at both sites for the previous wheat cycle (Housman et al., 2012).
|
Table 4. Spring wheat yield (bu/ac @ 12% moisture) for 11 cover crop treatments x 3 N application rates (0, 60, and 120 lb N/ac) at Amsterdam and Conrad, MT, 2019. |
|||||||
|
|
Amsterdam |
|
Conrad |
||||
|
Treatment |
0 |
60 |
120 |
|
0 |
60 |
120 |
|
Fallow |
32.2 B |
53.3 A |
53.6 A |
|
24.2 C |
38.6 |
33.9 |
|
Full mix |
36.7 AB |
49.7 B |
50.3 AB |
|
28.3 B |
38.4 |
35.3 |
|
Pea |
41.5 A |
47.2 B |
48.1 B |
|
36.0 A |
35.6 |
34.1 |
|
|
|
|
|
|
|
|
|
|
Brassica |
32.5 |
52.0 |
56.7 |
|
25.7 |
34.6 |
30.8 |
|
M Brass |
36.2 |
44.8 |
51.7 |
|
28.1 |
38.5 |
37.1 |
|
|
|
|
|
|
|
|
|
|
Fibrous |
26.9 |
46.6 |
49.2 |
|
23.4 |
40.1 |
32.6 |
|
M Fibr |
37.3 |
45.4 |
52.2 |
|
31.9 |
36.3 |
32.7 |
|
|
|
|
|
|
|
|
|
|
Legume |
37.7 |
44.3 |
46.0 |
|
40.0 |
39.4 |
35.7 |
|
M Legu |
28.8 |
47.0 |
55.7 |
|
22.2 |
31.7 |
27.5 |
|
|
|
|
|
|
|
|
|
|
Tap |
29.0 |
51.2 |
56.5 |
|
27.4 |
40.9 |
33.2 |
|
M Tap |
33.9 |
54.3 |
51.6 |
|
29.1 |
33.6 |
31.5 |
|
LSD0.10 |
5.8 |
3.1 |
5.0 |
|
3.1 |
7.1 |
5.7 |
|
When means in the top tier of table are followed by the same or no letter, they do not differ (P > 0.10). For each paired comparison of presence and absence of each functional group, bolded values differ (P<0.10). |
|||||||
Wheat Protein
Wheat protein content for both site locations at three N rates are shown in Table 5. At the medium N rate, wheat following pea had higher protein levels than following summer fallow or the full mix at both sites. For presence vs absence comparisons at the medium N rate, wheat following any mix containing N fixers had higher protein than the mix with no N fixers at Amsterdam.
|
Table 5. Spring wheat grain protein (@ 12% moisture) for 11 cover crop treatments x 3 N rates (0, 60, and 120 lb N/ac) at Amsterdam and Conrad, MT, 2019. |
|||||||
|
|
Amsterdam |
|
Conrad |
||||
|
Treatment |
0 |
60 |
120 |
|
0 |
60 |
120 |
|
Fallow |
10.6 B |
12.8 B |
14.5 B |
|
11.0 A |
13.2 B |
15.8 B |
|
Full mix |
10.7 B |
12.4 C
|
14.4 B |
|
9.5 B |
13.1 B |
16.1 B |
|
Pea |
11.8 A |
14.2 A |
14.9 A |
|
11.1 A |
16.2 A |
16.8 A |
|
|
|
|
|
|
|
|
|
|
Brassica |
10.6 |
12.3 |
14.1 |
|
9.5 |
13.5 |
16.3 |
|
M Brass |
10.6 |
13.2 |
14.6 |
|
9.5 |
14.4 |
16.3 |
|
|
|
|
|
|
|
|
|
|
Fibrous |
10.3 |
12.1 |
14.4 |
|
11.4 |
13.5 |
16.3 |
|
M Fibr |
10.5 |
12.9 |
14.4 |
|
11.1 |
14.9 |
16.7 |
|
|
|
|
|
|
|
|
|
|
Legume |
11.9 |
14.3 |
14.9 |
|
11.0 |
15.3 |
16.7 |
|
M Legu |
10.1 |
12.0 |
14.1 |
|
9.8 |
12.9 |
16.7 |
|
|
|
|
|
|
|
|
|
|
Tap |
10.0 |
11.8 |
14.2 |
|
11.1 |
13.2 |
15.9 |
|
M Tap |
10.9 |
12.9 |
14.5 |
|
9.5 |
13.4 |
16.5 |
|
LSD0.10 |
0.47 |
0.34 |
0.20 |
|
1.35 |
1.08 |
0.38 |
|
When means in the top tier of table are followed by the same or no letter, they do not differ (P > 0.10). For each paired comparison of presence and absence of each functional group, bolded values differ (P<0.10). |
|||||||
The third objective of this project was to increase local producer knowledge of the value, or lack there-of, for cover crop mixtures compared with less diverse cover crops. The field day presentations at both the Montana State University Research Post Farm and the Northern Agricutural Research Center (NARC) brought the findings of this study directly to local Montana producers. Oral presentations were given and an abundant amount of time was left for producers and agricultural professionals to ask specific questions about the research. This on farm presentation style attracted local producers specifically and seemed to both increase knowledge of potential benefits of cover crops and warn them of potential downfalls of growing cover crops in such a dry environment.
The final objective (objective 4) of this research project was to provide producers with information regarding the potential benefits of alternative cover crops through scientific publications, extension publications, popular press articles, social media, public presentations, and research summaries and factsheets. Several public presentations were given on the research project and factsheets were handed out at these presentations to anyone who was interested. A masters thesis will be completed and published on the project as well in summer of 2020.
References
Allison, S.D., Vitousek, P,. 2005. Responses of extracellular enzymes to simple and complex nutrient inputs. Soil Biology and Biochemistry 37, 937-944.
de Vries, F. T., & Bardgett, R. D. (2012). Plant–microbial linkages and ecosystem nitrogen. retention: lessons for sustainable agriculture. Frontiers in Ecology and the Environment, 10(8), 425-432.
Fierer, N., “Soil Microbial Biomass Determination.” Schimel Laboratory Protocols, UC Santa Barbara, 10 April 2003. Web. 1 June 2014.
García González, Irene & Quemada, M. & Gabriel, Jose & Hontoria Fernández, Chiquinquirá. (2016). Arbuscular mycorrhizal fungal activity responses to winter cover crops in a sunflower and maize cropping system. Applied Soil Ecology. 102. 10-18. 10.1016/j.apsoil.2016.02.006.
García-Ruiz, R., Ochoa, V., Hinojosa, M.B., Carreira, J.A., 2008. Suitability of enzyme activities for the monitoring of soil quality improvement in organic agricultural systems. Soil Biology and Biochemistry 40, 2137-2145.
Gil-Sotres, F., Trasar-Cepeda, C., Leirós, M. C., & Seoane, S. (2005). Different approaches to evaluating soil quality using biochemical properties. Soil Biology and Biochemistry, 37(5), 877-887.
Hausman, M. 2016. Multi-species cover crops in the northern great plains: an ecological perspective on biodiversity and soil health. Master’s Thesis, Montana State University, Bozeman, MT.
Keeney, D. 1982. Nitrogen – availability indices. In: Methods of Soil Analysis, Part 2: Chemical and Microbiological Properties (ed. S. Segou), pp. 711–733. SSSA, Madison, WI.
Lehman, R., Cambardella, C., Stott, D., Acosta-Martinez, V., Manter, D., Buyer, J., Karlen, D. (2015). Understanding and Enhancing Soil Biological Health: The Solution for Reversing Soil Degradation. Sustainability, 7(1), 988–1027. doi:10.3390/su7010988
McGonigle, T.P., Miller, M.H., Evans, D.G, Fairchild, G.L., Swan, J.A., 1990. A new method which gives an objective measure of colonization of roots by vesicular- arbuscular mycorrhizal fungi. New Phytologist 115, 495-501.
Parham, J.A. and Deng, S.P. 2000. Detection, quantification and characterization of b-glucosaminidase activity in soil. Soil Biol. Biochem. 32, 1183–1190.
Schipanski,M.E., Barbercheck, M., Douglas, M.R., Finney, D.M., Haider, K., Kaye, J.P., Kemanian, A.R., Mortensen, D.A., Ryan, M.R., Tooker, J., White, C., 2014. A framework for evaluating ecosystem services provided by cover crops in agroecosystems. Agricultural Systems 125, 12-22.
Research outcomes
Education and Outreach
Participation summary:
MSU Graduate Symposium – In April 2018, I presented my preliminary research at a seminar sponsored by Montana State University – Dept. of Land Resources and Environmental Sciences (MSU-LRES). Informing my fellow graduate students as well as professors and extension staff about my research to raise awareness at MSU of the need for this research and education.
Soil Science Society of America and American Society of Agronomy – In November 2019, I presented a poster outlining my research and findings at these combined national annual meetings which typically attract more than 3,000 attendees from around the world. This allowed me to share my work directly with other professionals, fellow students and researchers.
Northern Agriculture Research Station April 2019 Field day - I gave a 15 minute oral presentation focusing on the microbial activity aspects of this project to agricultural producers, professionals, and researchers from northern Montana.
Montana State University 2019 Post Farm Field day - I gave a 15 minute oral presentation on my research results to producers, professionals, and researchers from southern Montana.
Great Plains Soil Fertility Conference 2020 - In March 2020, I gave a 20 minute oral presentation discussing my results to agricultural professionals and researchers from across the Great Plains.