Final report for GW19-201
Project Information
The state of Hawaiʻi enacted the Greenhouse Gas Sequestration Task Force act to begin establishing soil health criterion for a certification program where farmers and landowners may be rewarded for healthy management practices. For soil health to be accurately used as a tool, indicators must be calibrated for local conditions to establish sensitive, farmer accessible indicators, threshold values of measured indicators, and to understand soil health’s relationship to yield and carbon sequestration. Previous research identified 14 sensitive soil health indicators for Hawaiʻi, but needs to be further refined and validated to calculate soil health scores and indices, and to be relevant to farmer needs, including yield. Our research will address these shortcomings by establishing replicated on-field demonstration trials of varying management practices. We will work with farmers and facilitate farmer-to-farmer training sessions and farm tours through annual soil health workshops and a developed soil health web tool. These strategies will allow us to understand which soil health indicators are important to farmers and effectively connect soil science to farmer decision-making. Our objectives are to: (i) validate Soil Health Index for Hawaiʻi, (ii) analyze and monitor soil health for two-years to quantify management effects, and through seasons and crop cycles to identify best soil sampling time, (iii) utilize collected soil health data to initialize Soil Health Web Tool for Hawaiʻi to develop realistic management recommendations for farmers with quantified soil health benefits across the diverse land uses and soils in Hawaiʻi, and (iv) solidify farmer network in Hawaiʻi through annual soil health workshops, farmer-to-farmer training sessions, and farm tours. Our research will establish criterion for a farmer incentive program for sustainable management, use soil health to improve air and water quality, mitigate climate change, and maintain our soil resources, and empower producer decision-making through the workshops and web tool.
- Validate Soil Health Index for Hawaiʻi, including: (i) establishing baselines for a variety crop and soil types, (ii) measuring indicator sensitivities, (iii) calibrating index and scoring for different agricultural management practices in diverse soil types, and (iv) assessing the relationship between the index and yield.
- Analyze and monitor soil health for two-years (aggrading, degrading, maintaining) to quantify management effects, and through seasons and crop cycles to identify best soil sampling time.
- Utilize collected soil health data to initialize Soil Health Web Tool for Hawaiʻi to develop realistic management recommendations for farmers with quantified soil health benefits across the diverse land uses and soils in Hawaiʻi.
- Solidify farmer network in Hawaiʻi through annual soil health workshops, farmer-to-farmer training sessions, and farm tours.
Cooperators
- - Producer (Educator and Researcher)
- (Educator and Researcher)
Research
Project sites:
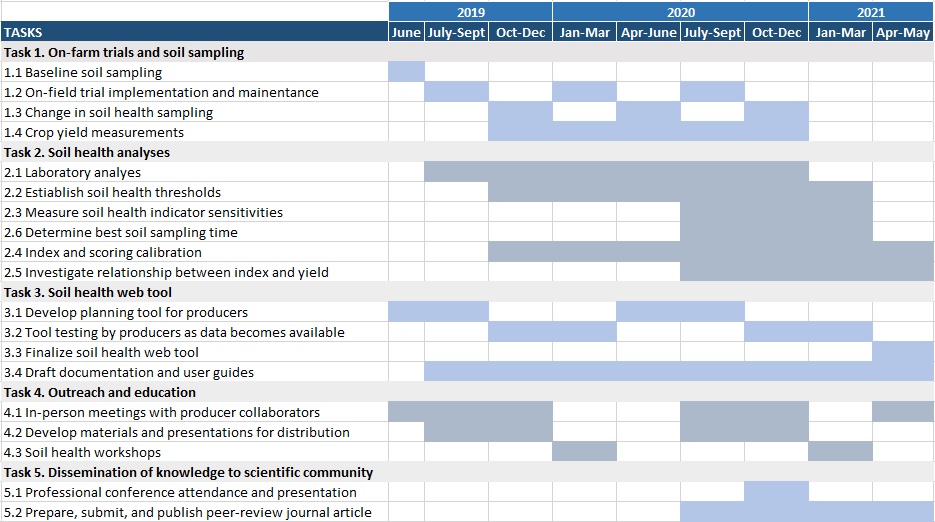
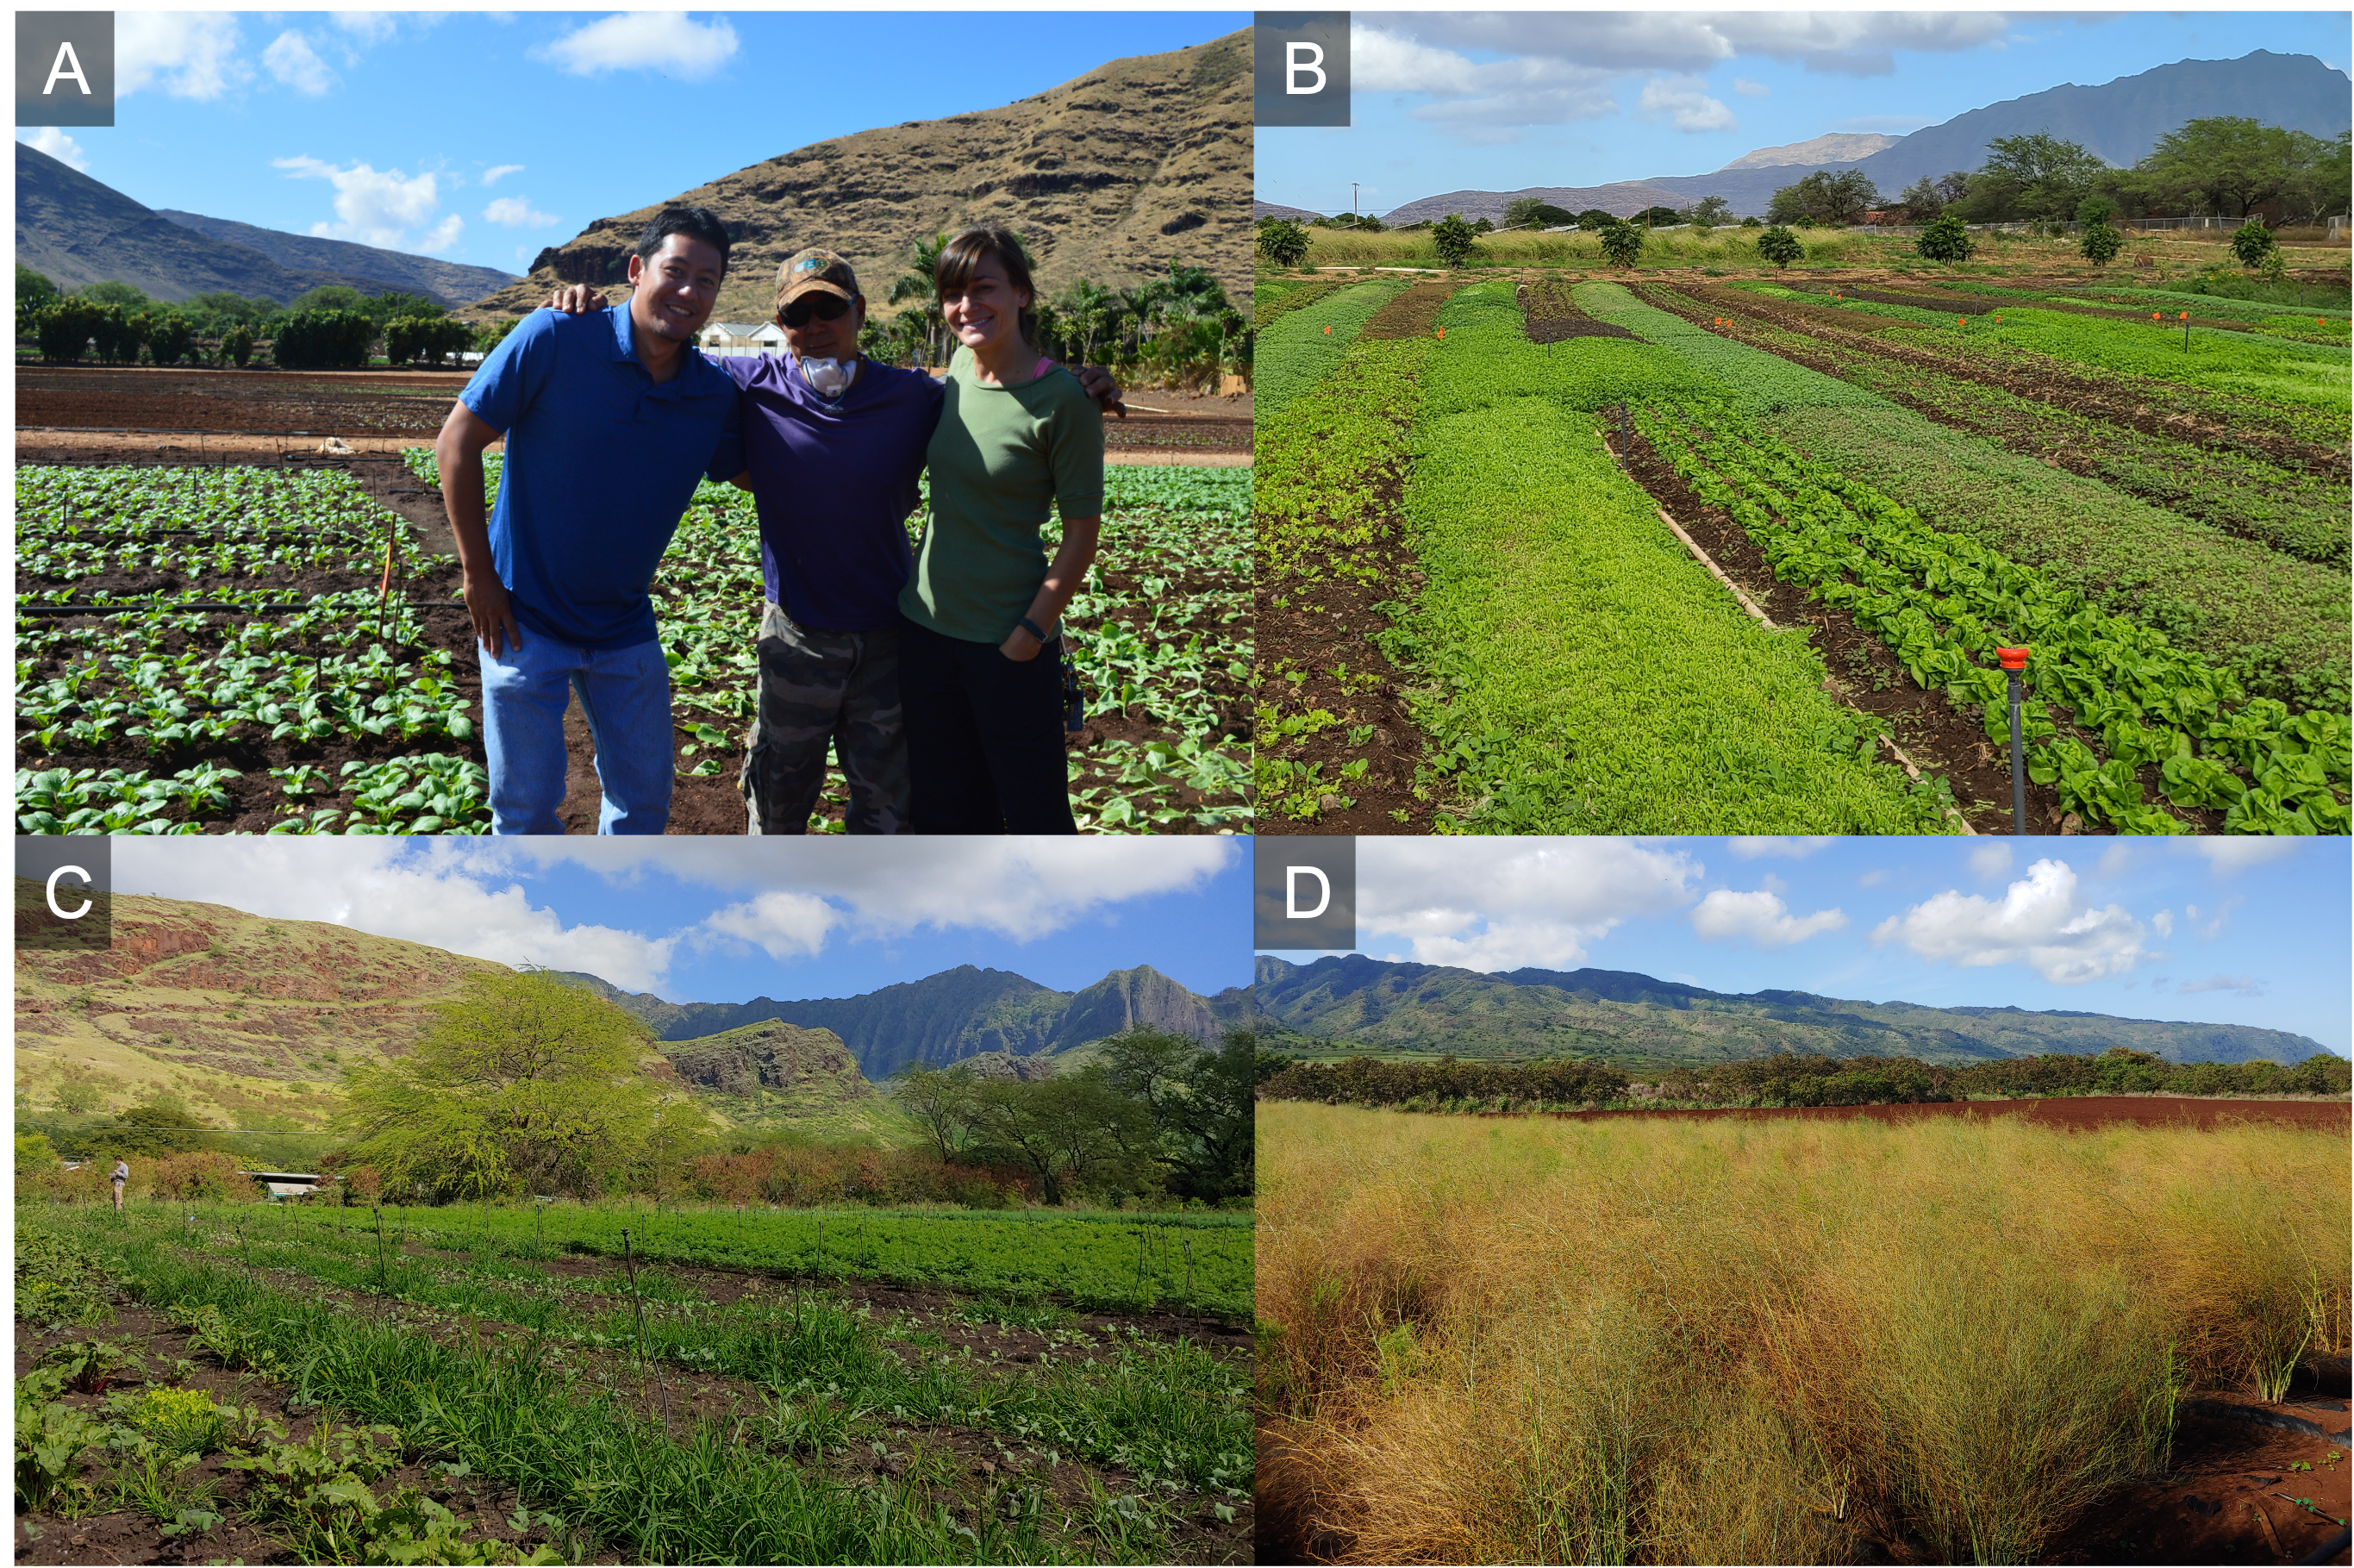
Initial meetings with farmers and collaborators occurred during September-October 2019. By April 2020, plot locations were identified, baseline soil samples were taken, and current farmer practice (FP) and experimental management practices were finalized (Table 1). At this point, the Covid-19 pandemic began and access to the farms was severely limited during a time of great difficulty for our partners. In late November 2020 some access restrictions began to ease and soil health sampling resumed. During the project period, one original producer could no longer participate and one producer had to terminate their experimental plots. Because of the pandemic and other pest-related issues, we were unable to complete all planned visits to each site and collect all planned soil samples. Therefore, this report will focus on what we were able to learn in partnership with four producers, MAʻO Organic Farm, Owen Kaneshiro Farm, Twin Bridges Farm, and Kahumana. However, two other producers, Tolentino Farm and Aloun, received baseline soil health assessments.
| Table 1. Current crop and farmer practice (FP), and selected soil health management strategies at each of the participating farms. | |||||
|
Farm (crop) |
Current FP |
First strategy |
Second strategy |
Third strategy |
Fourth strategy |
|
Farm 1 (Pak Choi) |
Broadcast applications of 21-0-0 (200 lbs N/acre) |
75% FP |
50% FP + Sunn Hemp |
No fertilizer + Sunn Hemp |
None |
|
Farm 2 (Salad mix greens; then roots) |
High inputs of local fish/bone meal by-product (“tankage”) with known accumulation of excess soil P (350-560 lbs N/acre) |
50% FP |
Feather meal applied at same rate at FP |
Feather meal applied at 50% FP |
None |
|
Farm 3 (Salad Mix Greens; then beets) |
High inputs of local fish/bone meal by-product (“tankage”) (225 lbs N/acre) |
50% FP |
Feather meal applied at same rate at FP |
Feather meal applied at 50% FP |
No fertilizer |
|
Farm 4 (Asparagus) |
Blended NPK fertilizer with known accumulation of excess soil P (128 lbs N/acre + 50 lbsP2O5/acre) |
100% Blended NK and no P + compost |
75% Blended NK and no P + compost |
50% Blended NK and no P + compost |
None |
|
FP = farmer practice; N = nitrogen; P = phosphorus; K = potassium |
|||||
| Table 2. Essential site data for each farm. | ||||||
|
Farm |
Soil order |
Soil series |
Mineralogy |
Past land use |
MAT (°C) |
MAP (cm) |
|
Farm 1 |
Mollisol |
Ewa |
HAC |
PIAL |
23.83 |
55.32 |
|
Farm 2 |
Vertisol |
Lualualei |
HAC |
PIAL |
23.83 |
55.32 |
|
Farm 3 |
Vertisol |
Lualualei |
HAC |
PIAL |
23.83 |
55.32 |
|
Farm 4 |
Mollisol |
Waialua |
HAC |
PIAL |
22.94 |
83.79 |
| HAC = high activity clays; PIAL = previously intensive agricultural lands: sites with a history of long-term sugarcane or pineapple monocrop agriculture; MAT = mean annual temperature; MAP = mean annual precipitation | ||||||
The locations of the trial fields were co-determined with the producers at each farm. At Farm 1 the total field size was 400 ft x 25 ft, with 200 ft x 25 ft in non-cover crop treatments (FP and first strategy) and 200 ft x 25 ft in cover crop treatments (second and third strategy). At Farm 2 the total field size was 150 ft x 20 ft across four 5-ft beds. Each treatment was applied to 3000 ft2. At Farm 3 total field size was 30 ft x 35 ft split equally into five treatments. At Farm 4 total field size was 30 ft x 200 ft split equally into four treatments.
Soil health sampling and testing:
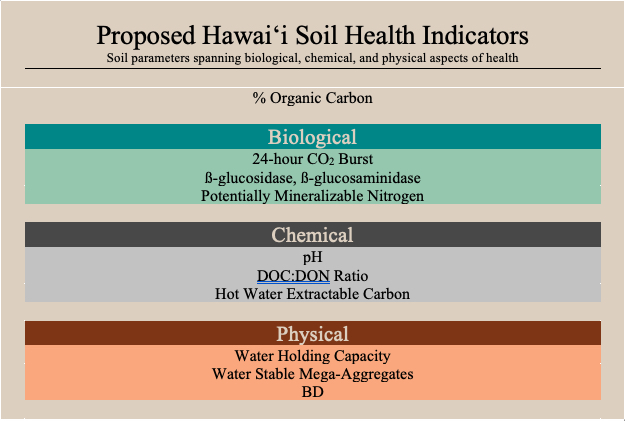
At each farm, the area designated for receiving each treatment was split into 3 areas, which were sampled over time (described in the case studies below). Therefore, replicate baseline and latitudinal (i.e., over time) samples were taken within each treatment plot and are not field-scale replicates. The soil health baseline samples were taken from each plot prior to the implementation of treatments. Briefly, we sampled soil from 0-15 centimeters of the mineral A-horizon and three subsamples from the same vicinity were homogenized to comprise one soil sample. More specifically, within each delineated treatment area, three separate subsamples were taken from across the plot (i.e., the plot was visibly separated into thirds). Before soil samples were taken, organic debris on the soil surface was carefully removed. After sampling, the soils were immediately frozen at -4 ºC until lab processing began. Eleven parameters were measured as indicators of soil health at the University of Hawaiʻi Mānoa Soils and Ecosystems Lab (Fig. 2). These indicators are classified as overarching (% Organic Carbon) or as biological, chemical, and physical parameters each with a functional role in organic matter, carbon (C), or nutrient cycling and/or creating an environment where soil organisms may thrive (Table 3).
| Table 3. Methods and functional interpretation of 11 parameters classified as biological, chemical, or physical and tied to soil function or health were measured for each sample. | |||
|
Parameter |
Method Reference |
Function |
Functional Reference |
|
% OC |
(Moebius-Clune, 2016) |
Associated with organic matter content, which correlates with various critical soil functions. |
(Moebius-Clune, 2016) |
|
24-hr CO2 burst |
(Haney and Haney, 2010) |
Rapid soil quality indicator of microbial activity, highly related to soil fertility |
(Haney and Franzluebbers, 2009; Haney et al., 2018) |
|
ß-glucosidase |
(Tabatabai, 2018) |
Recycling C compounds into energy for microbes, a reliable predictor of organic matter decomposition |
(Alkorta et al., 2003; Acosta-Martinez et al., 2018) |
|
ß-glucosaminidase |
(Parham and Deng, 2000) |
Soil enzymes to decompose organic matter and release nutrients into plant available forms of N |
(Parham and Deng, 2000; Alkorta et al., 2003; Acosta-Martinez et al., 2018) |
|
Potentially mineralizable N |
(Drinkwater et al., 2015) |
Estimate of the capacity of the soil microbes to recycle nitrogen into plant available forms |
(Moebius-Clune, 2016) |
|
pH |
Influences essential nutrient availability, plant toxicity, and microbial community |
(Frostegård and Bååth, 1996; Karlen et al., 2003) |
|
|
DOC:DON Ratio |
(Haney et al., 2008, 2018; Haney and Haney, 2010) |
Balance of C and N forms in solution, imbalance of inorganic N forms and/or DOC indicates disturbance, N deposition, or inefficient nutrient cycle |
(Jansen et al., 2014) |
|
Hot water extractable carbon |
(Ghani et al., 2003) |
Associated with biological activity as the hot water lyses microbe cells and releases biomass components |
(Haney et al., 2018) |
|
Water holding capacity |
(Awale et al., 2017) |
Vital for sustained plant growth and supporting microbial life |
(Moebius-Clune, 2016; Haney et al., 2018) |
|
% WSA in the mega size class |
(Kemper and Rosenau, 2018) |
Increased water infiltration, water storage, water and gas exchange, and resistance to erosion |
(Arai et al., 2014) |
|
BD |
(Arshad and Coen, 199x) |
Degree of soil compaction and potential root growth restriction and pore space. |
(Moebius-Clune, 2016) |
| OC = organic carbon; CO2 = carbon dioxide; β=beta, DOC = dissolved organic carbon; DON = dissolved organic nitrogen; WSA, water stable aggregates; BD = bulk density | |||
We performed return sampling as frequently as possible given key crop cycles and accessibility to the farms during Covid-19 restrictions. A total of 204 samples were analyzed with the support provided by this project. Six farms were provided baseline soil health assessment reports, which include results of each indicator alongside the median values for all samples in our database with the same mineralogy (e.g., high activity clay, low activity clay, poorly- and non-crystalline mineral). The data are also presented graphically, so show where the samples fell within the distribution of all other values for that mineralogy currently in our database.
Examples of a Hawaiʻi Soil Health report for baseline samples taken from one plot (three samples) of a high and low activity clay soil for two of our participating farms are provided.
Soil health indexing:
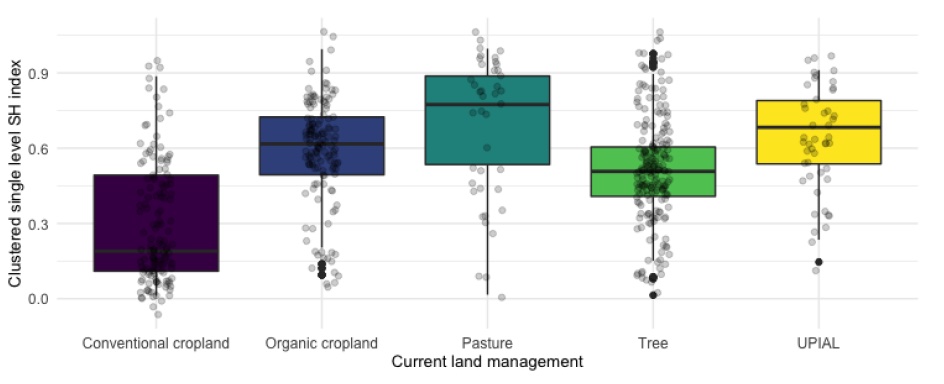
The Hawaiʻi Soil Health Research Group recently developed a soil health index that uses a novel structural equation modeling approach to the scoring function (Maaz et al. in review). Our index provides scores ranging from 0 (lowest) to 1 (highest). Our scoring approach outperformed the most popular and conventional methods and reconceptualized soil health indicators into functional properties rather than biological, chemical, and physical categories (Fig. 3).
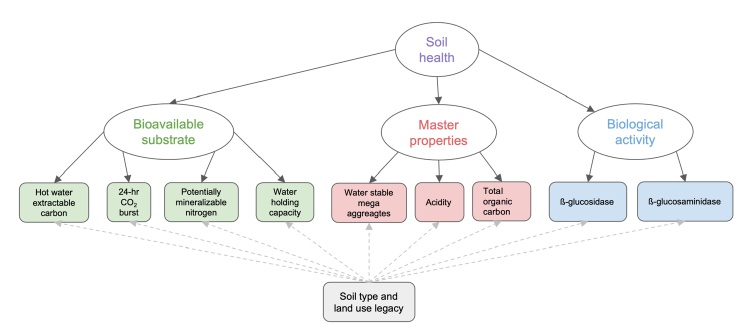
Our scoring function adjusts for inherent differences due to mineralogical class and intensive land use history to properly assess contemporary management practices and land use across a diversity of soils and land use histories present in Hawaii and other tropical and island regions (Fig. 4).
Because this index remains under review, the index scores are not yet included in the baseline soil health report, but are reported here for six farms. Additionally, four on-farm “case studies” were developed to communicate specific stories about the impact of soil health management strategies on soil health and yields and explore the index, factor scores, and indicators for the first time.
Baseline soil health index for farms:
The baseline soil health index for our six participating farms ranged from 0.11 ± 0.01 to 0.67 ± 0.04 (Table 5). Factor 1 “substrate accessibility” ranged from 0.12 ± 0.01 to 0.80 ± 0.03, Factor 2 “master soil variables” ranged from 0.09 ± 0.01 to, and Factor 3 “biological activity” ranged from 0.16 ± 0.03 to 0.62 ± 0.06.
| Table 5. Soil health index and factor scores (reported on a scale of 0-1) for the baseline samples at all six farms. Values are mean ± standard error. The number of samples represented in each mean is indicated following the farm name. | ||||
|
Farm |
Index |
Factor 1 |
Factor 2 |
Factor 3 |
|
Farm 1 (n = 12) |
0.14 ± 0.01 |
0.14 ± 0.02 |
0.15 ± 0.02 |
0.25 ± 0.06 |
|
Farm 2 (n = 12) |
0.31 ± 0.07 |
0.29 ± 0.07 |
0.35 ± 0.08 |
0.44 ± 0.06 |
|
Farm 3 (n = 12) |
0.67 ± 0.04 |
0.80 ± 0.03 |
0.39 ± 0.03 |
0.62 ± 0.06 |
|
Farm 4 (n = 12) |
0.43 ± 0.03 |
0.42 ± 0.03 |
0.62 ± 0.04 |
0.19 ± 0.03 |
|
Farm 5 (n = 12) |
0.11 ± 0.01 |
0.12 ± 0.01 |
0.09 ± 0.01 |
0.16 ± 0.03 |
|
Farm 6 (n = 12) |
0.52 ± 0.05 |
0.59 ± 0.06 |
0.46 ± 0.04 |
0.43 ± 0.06 |
Case studies exploring soil health index and parameters over time:
Farm 1
Site overview
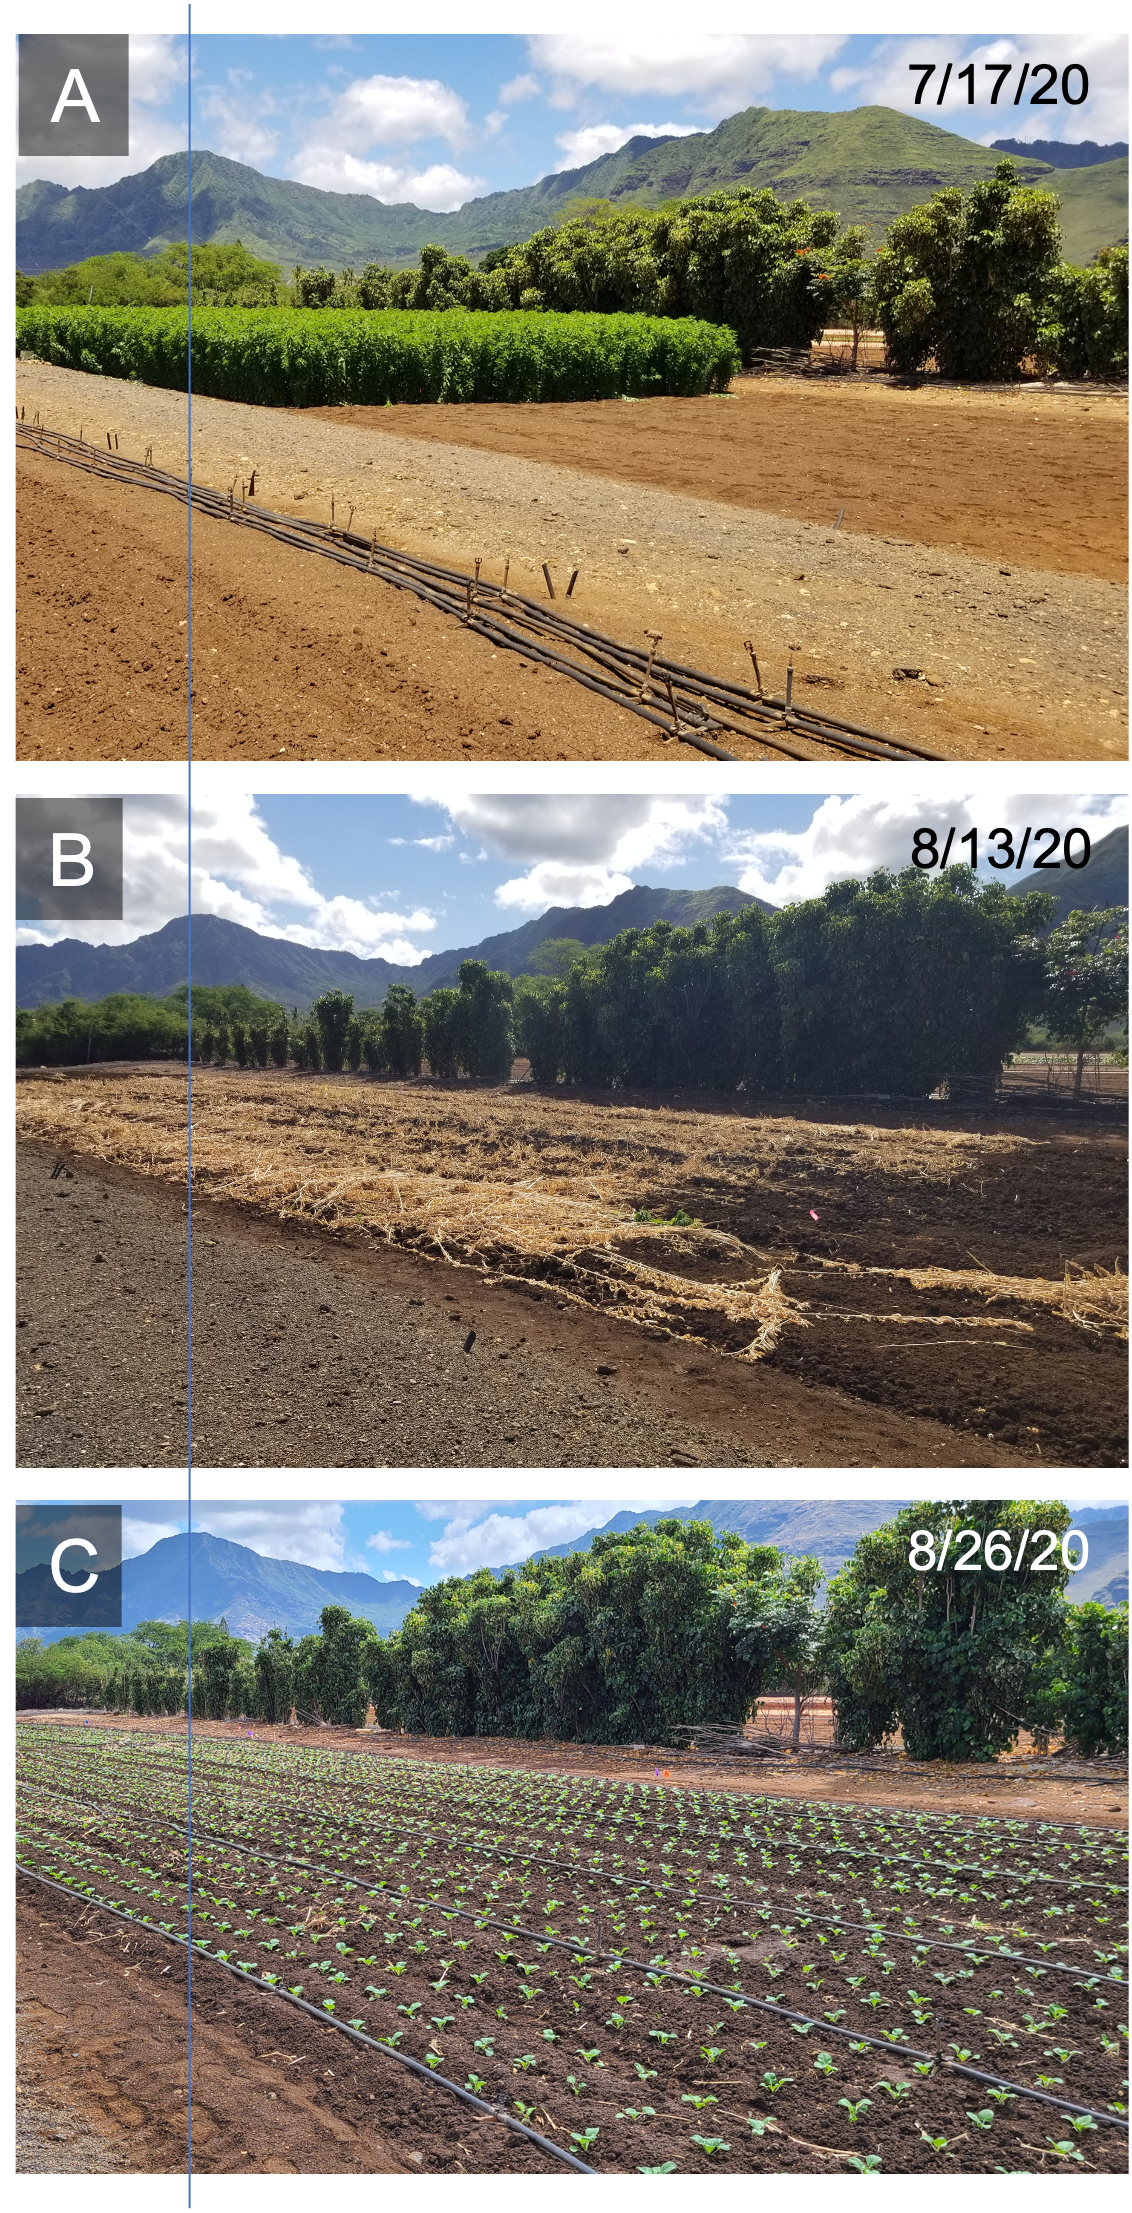
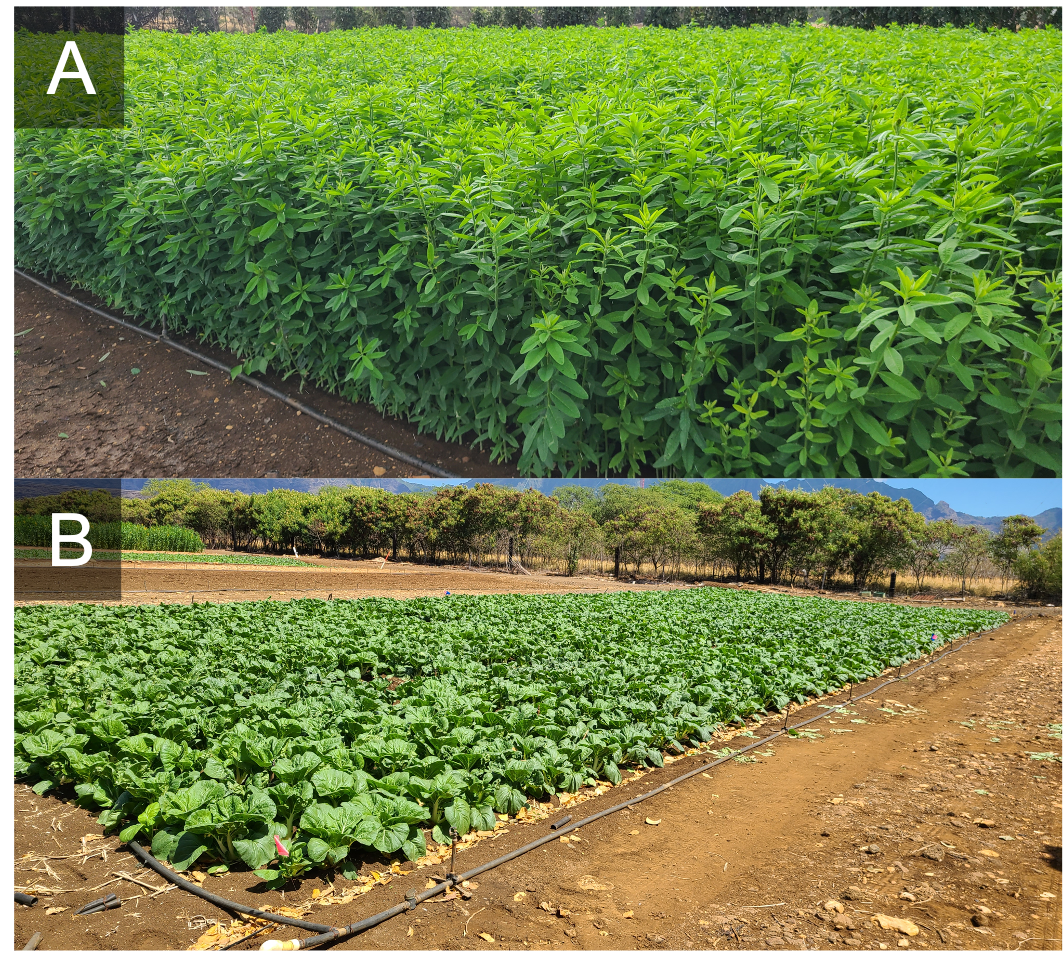
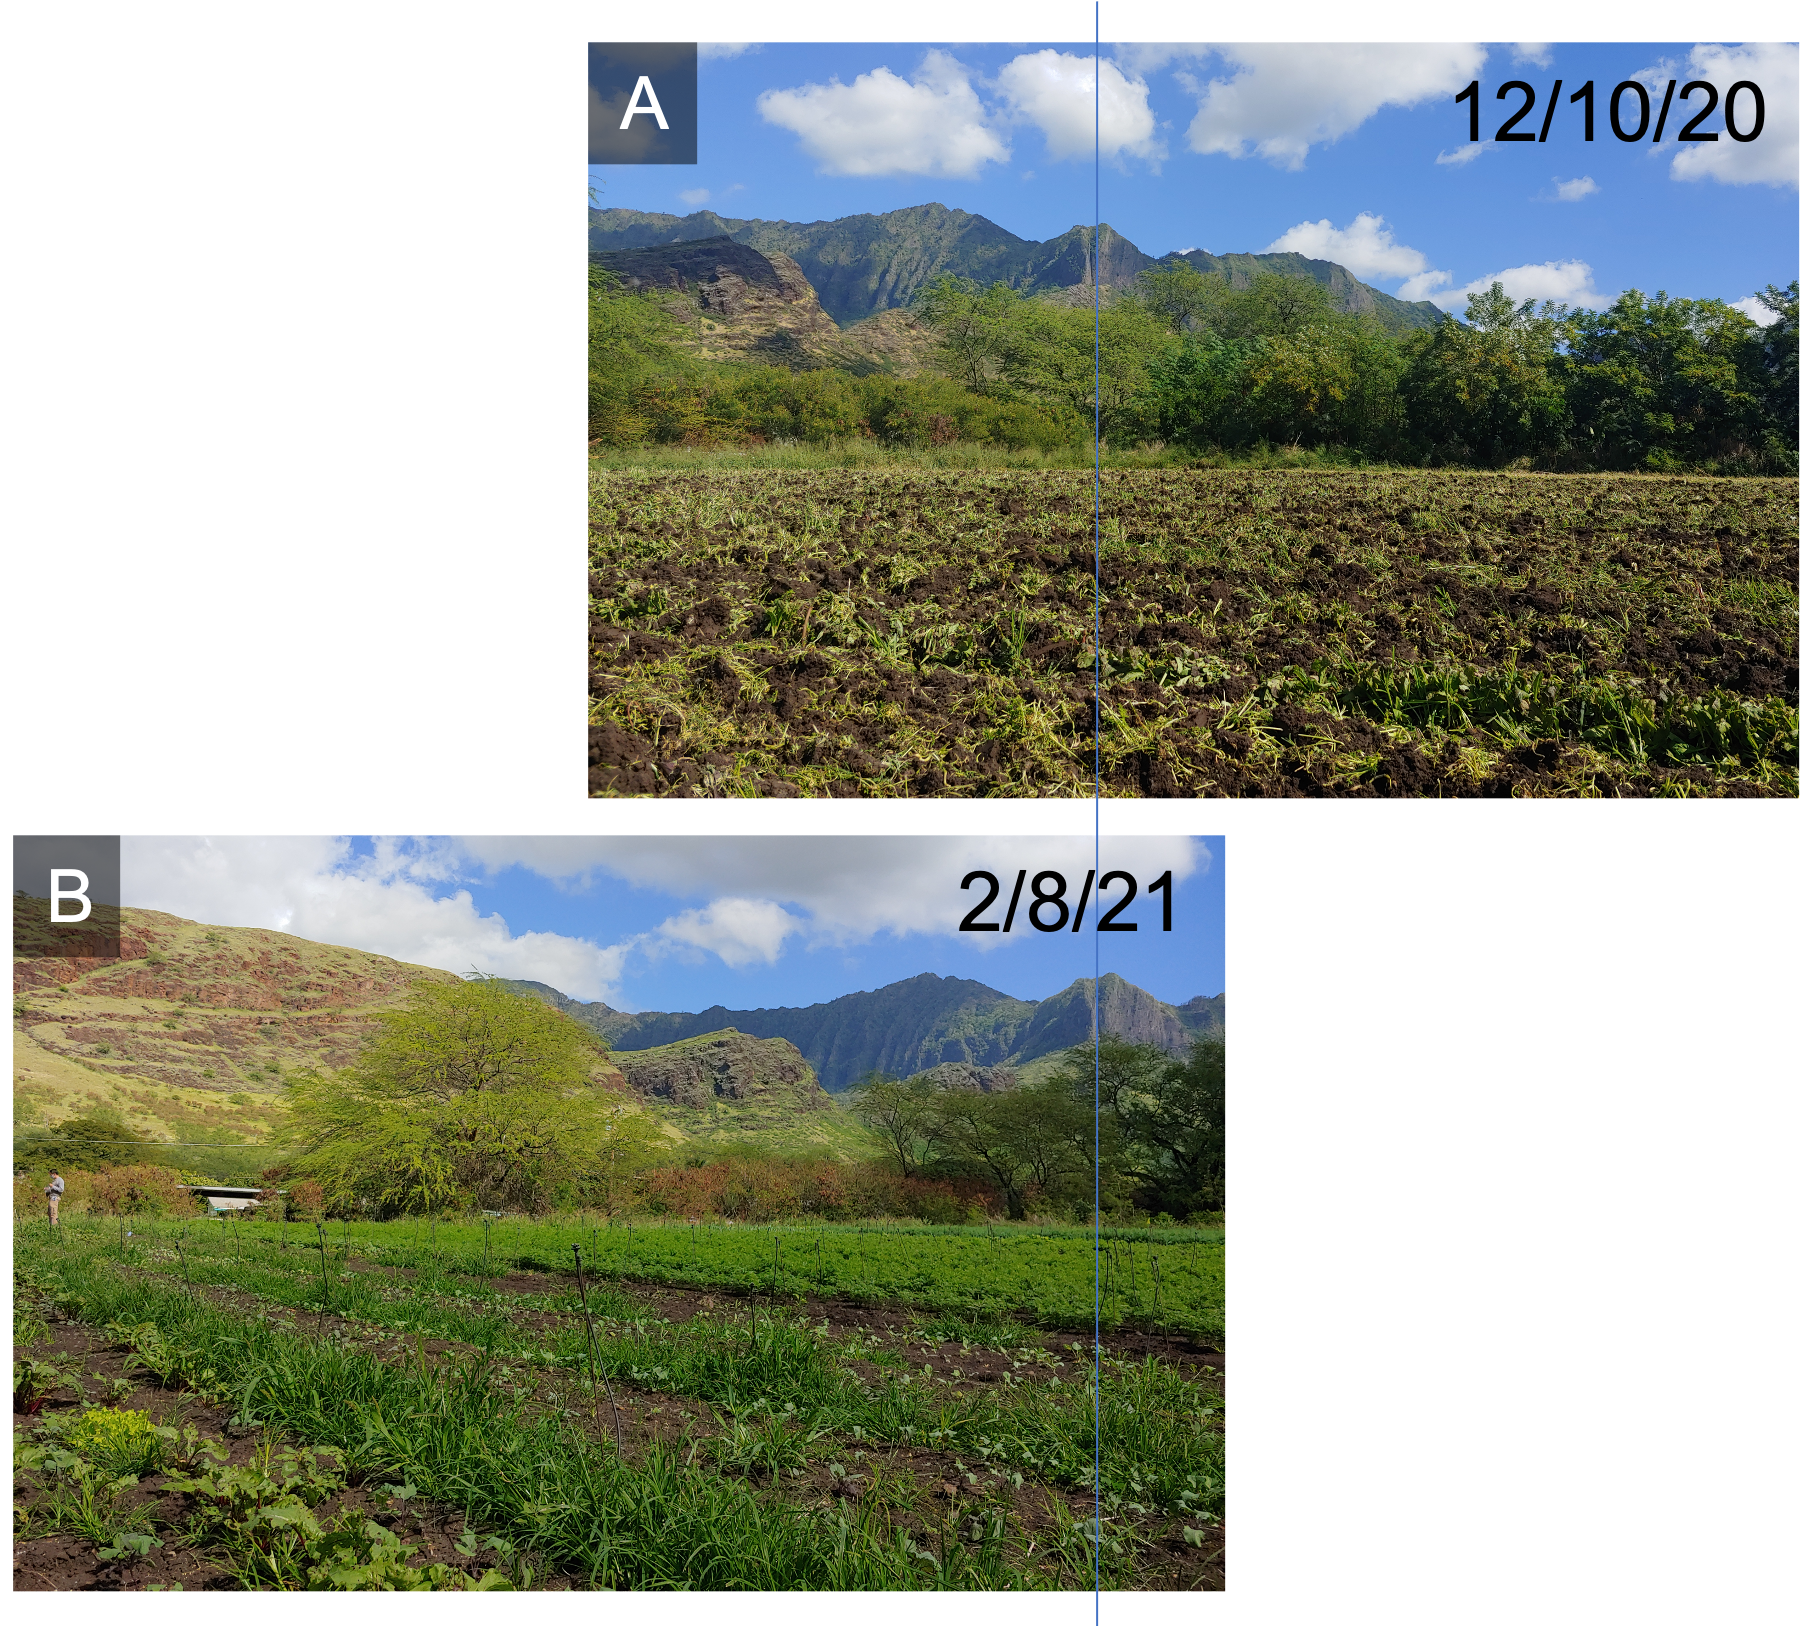
The soil is a Mollisol of the Ewa series, which are high activity clays, and have a long intensive land use history. The primary crop was pak choi (Fig. 4). The current farmer practice (FP) was broadcast applications of 21-0-0 (200 lbs N/acre). A challenge at this farm is nutrient management and there is interest in Sunn Hemp (Fig. 5), therefore strategy 1 was 75% N from FP, strategy 2 was 50% FP + Sunn Hemp, strategy 3 was no fertilizer + Sunn Hemp.
Soil health index, factor scores, and yield observation
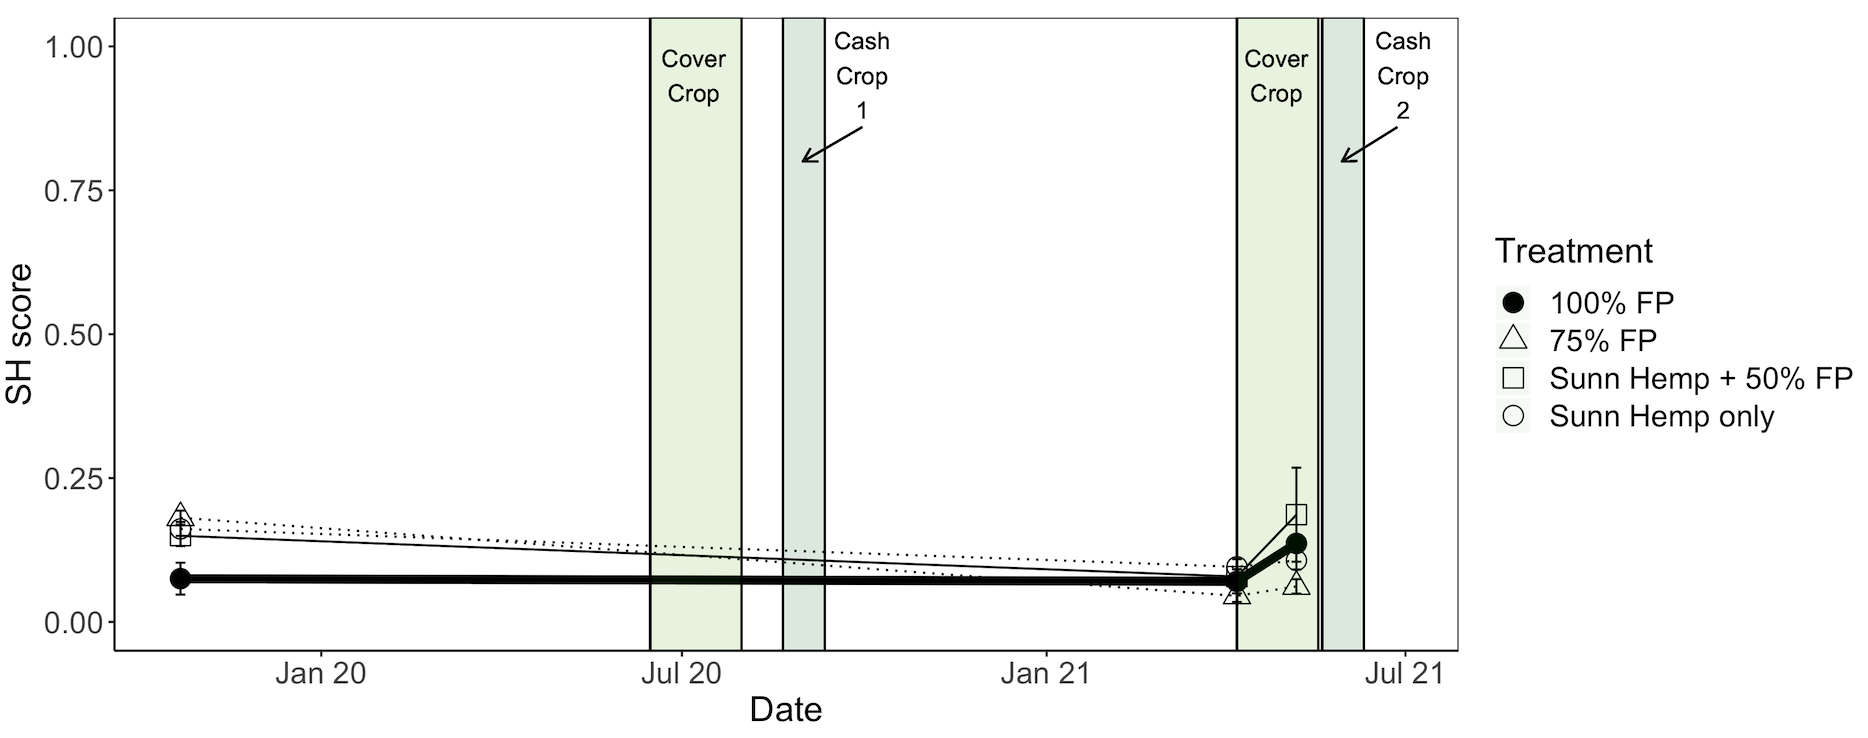
Soil health scores started and remained lower than 0.25 over the course of the monitoring at this farm (Fig. 7). Scores improved the most from the sampling point prior to cover crop planting to the sampling point during the cover crop rotation for the Sunn Hemp + 50% FP treatment, but within-plot variability was high. Yields during the second cash crop cycle were significantly lower for the Sunn Hemp only treatment compared to all others.
Farm 2
Site overview
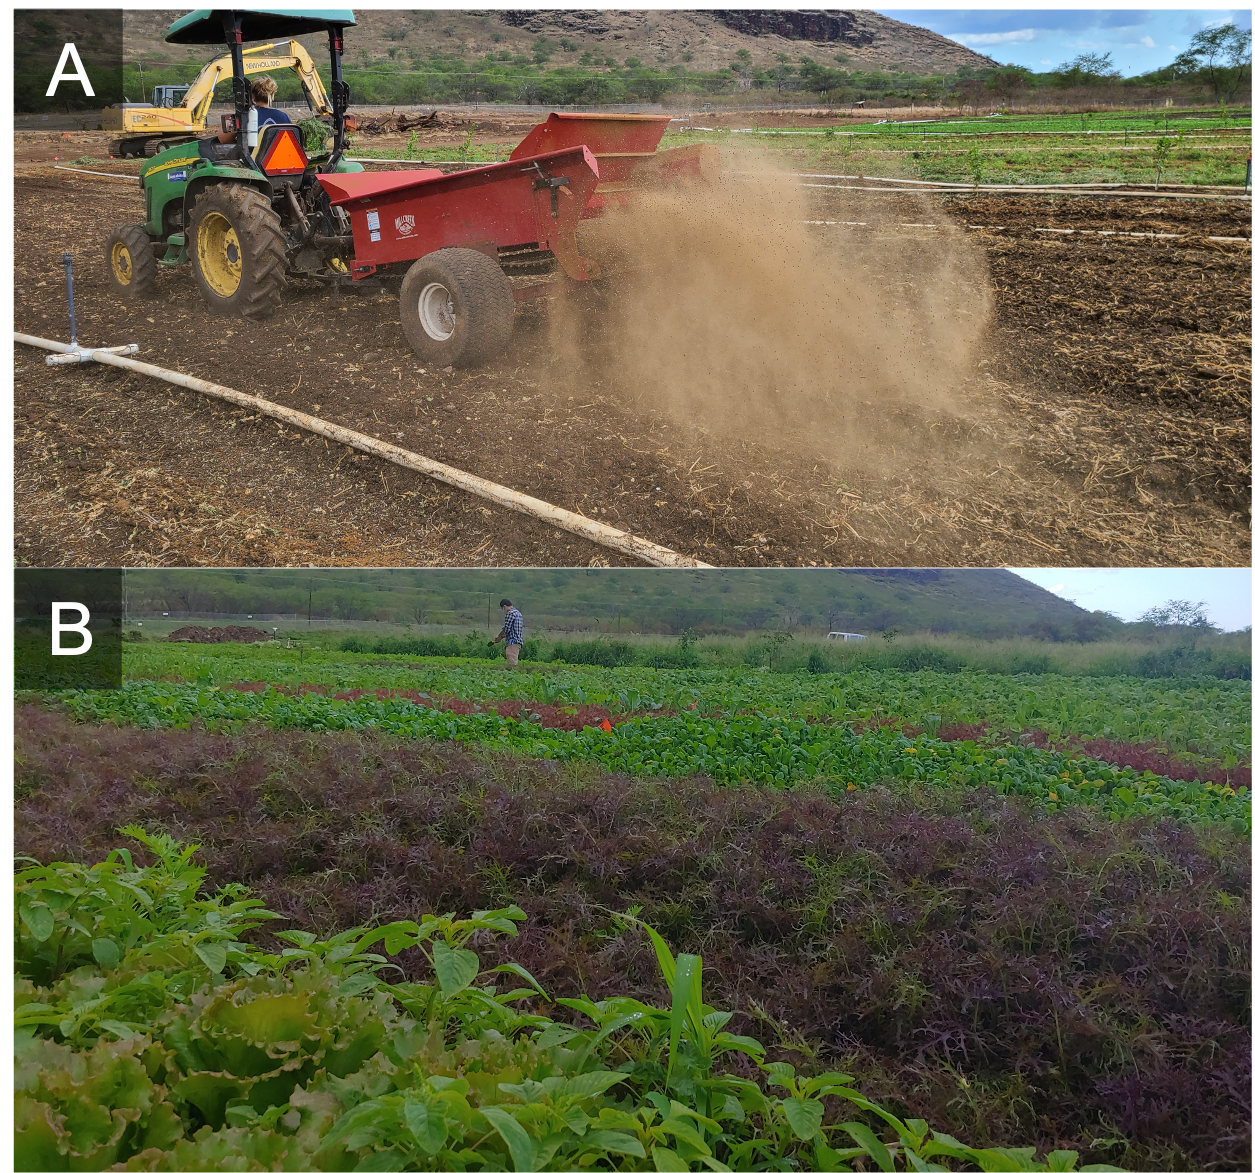
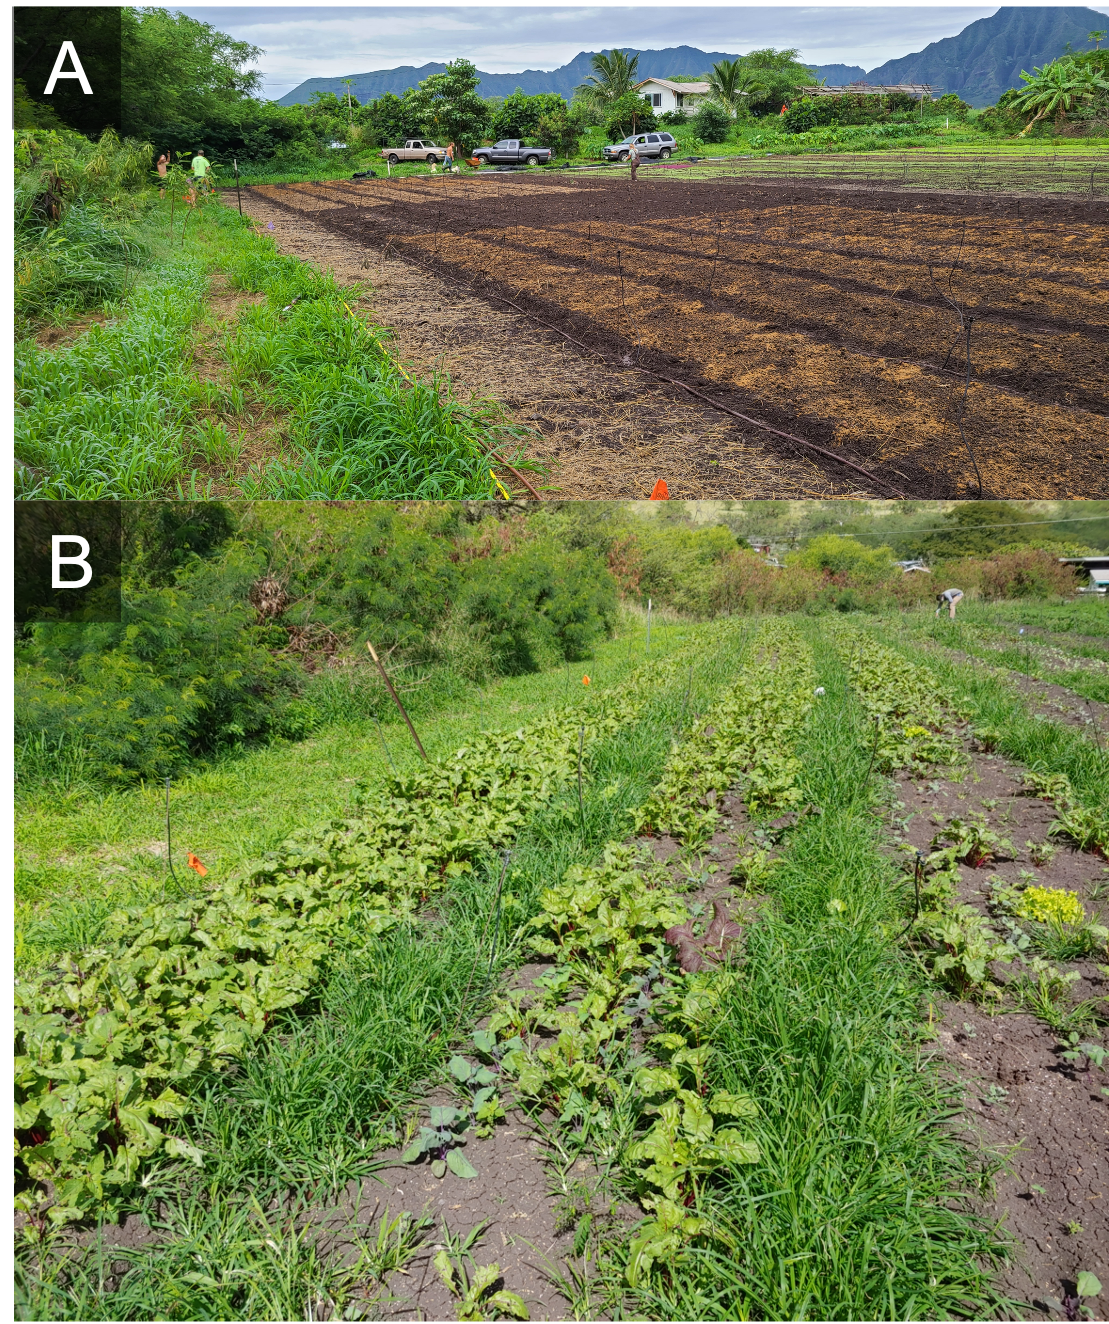
The soil is a Vertisol of the Lualualei series, which are high activity clays, and have a long intensive land use history. The primary crop was salad mix greens and roots (Fig. 8). The current farmer practice (FP) was local fish/bone meal by-product (“tankage”) at a rate of 350-560 lbs N/acre (Fig. 9). A challenge at this farm is high N inputs and known accumulation of excess soil P, therefore strategy 1 was 50% N from FP, strategy 2 was feather meal applied at the same N rate at FP, and strategy 3 was feather meal applied at 50% FP.
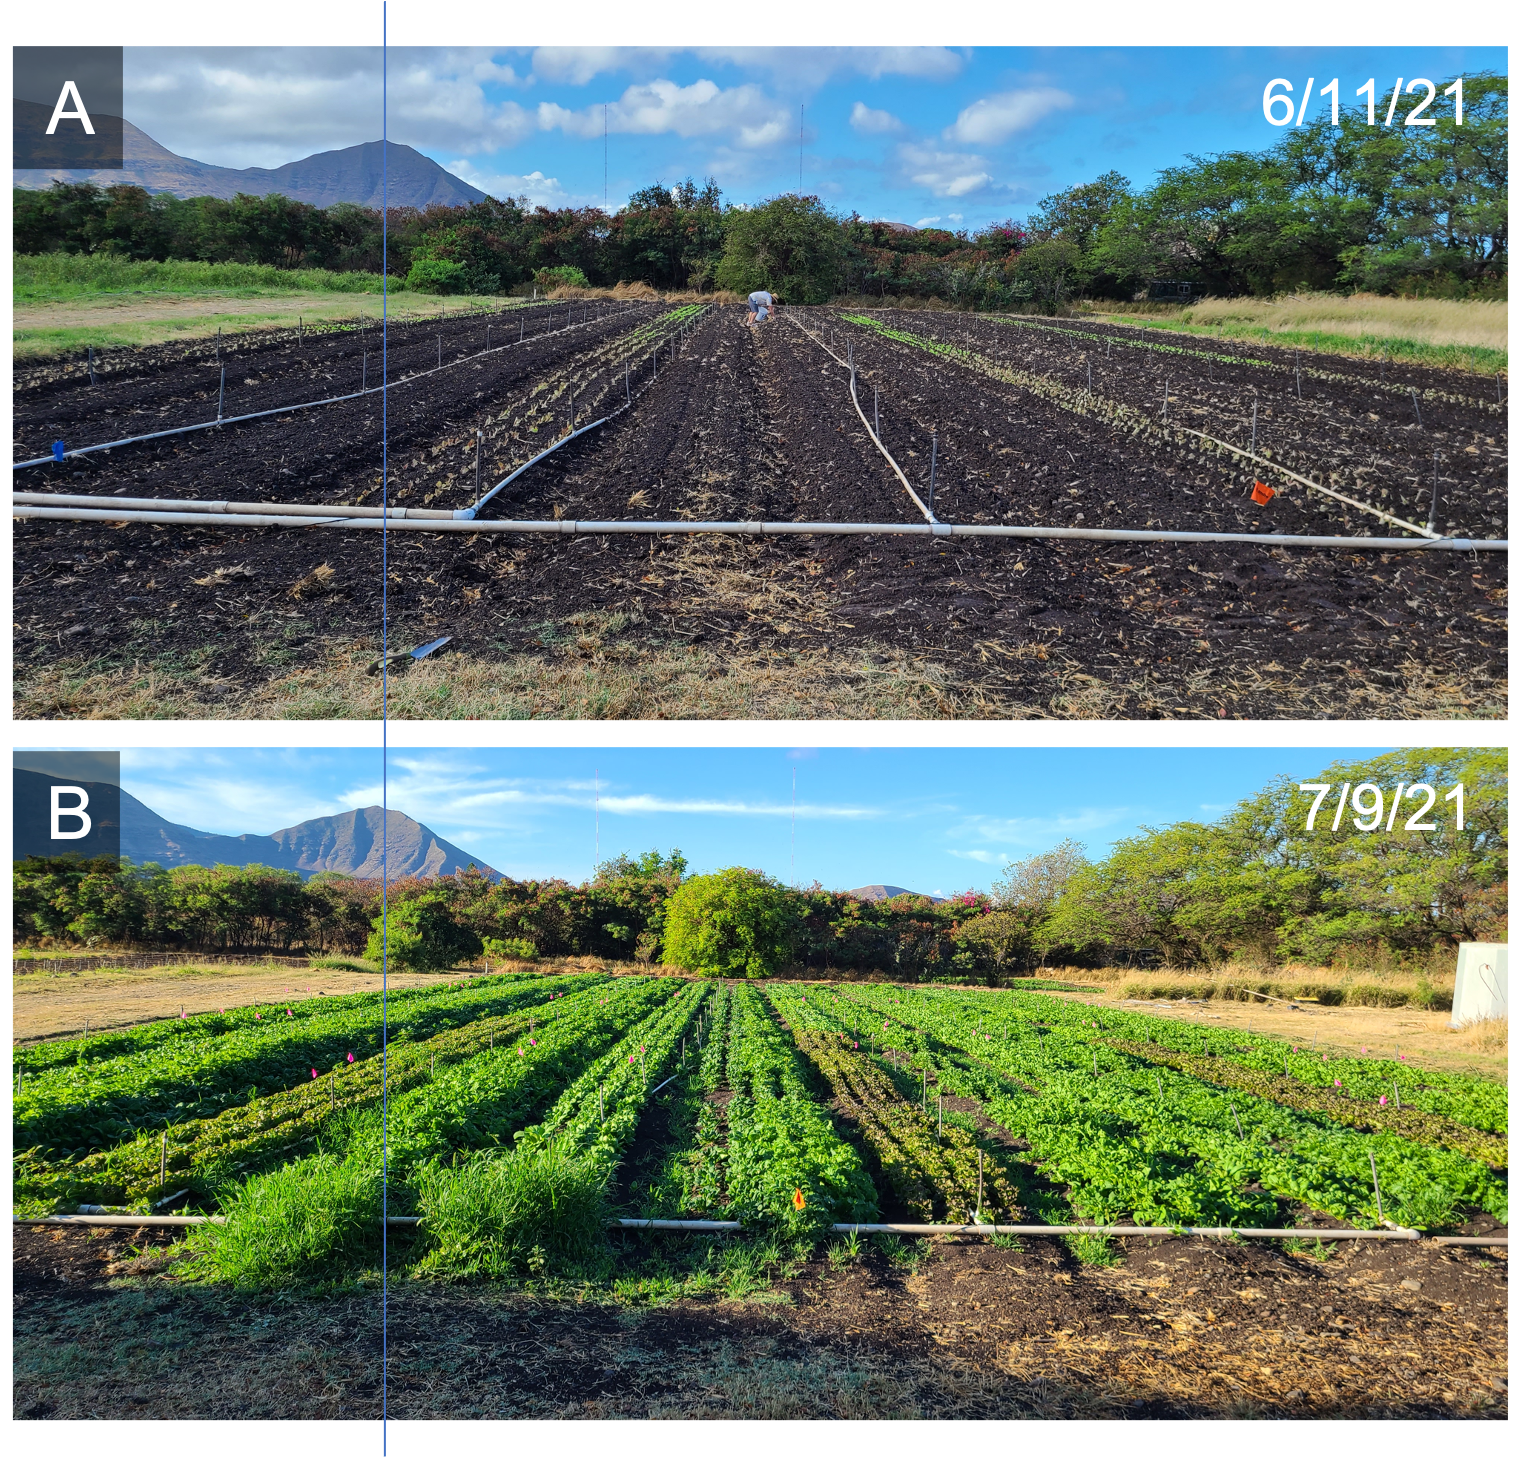
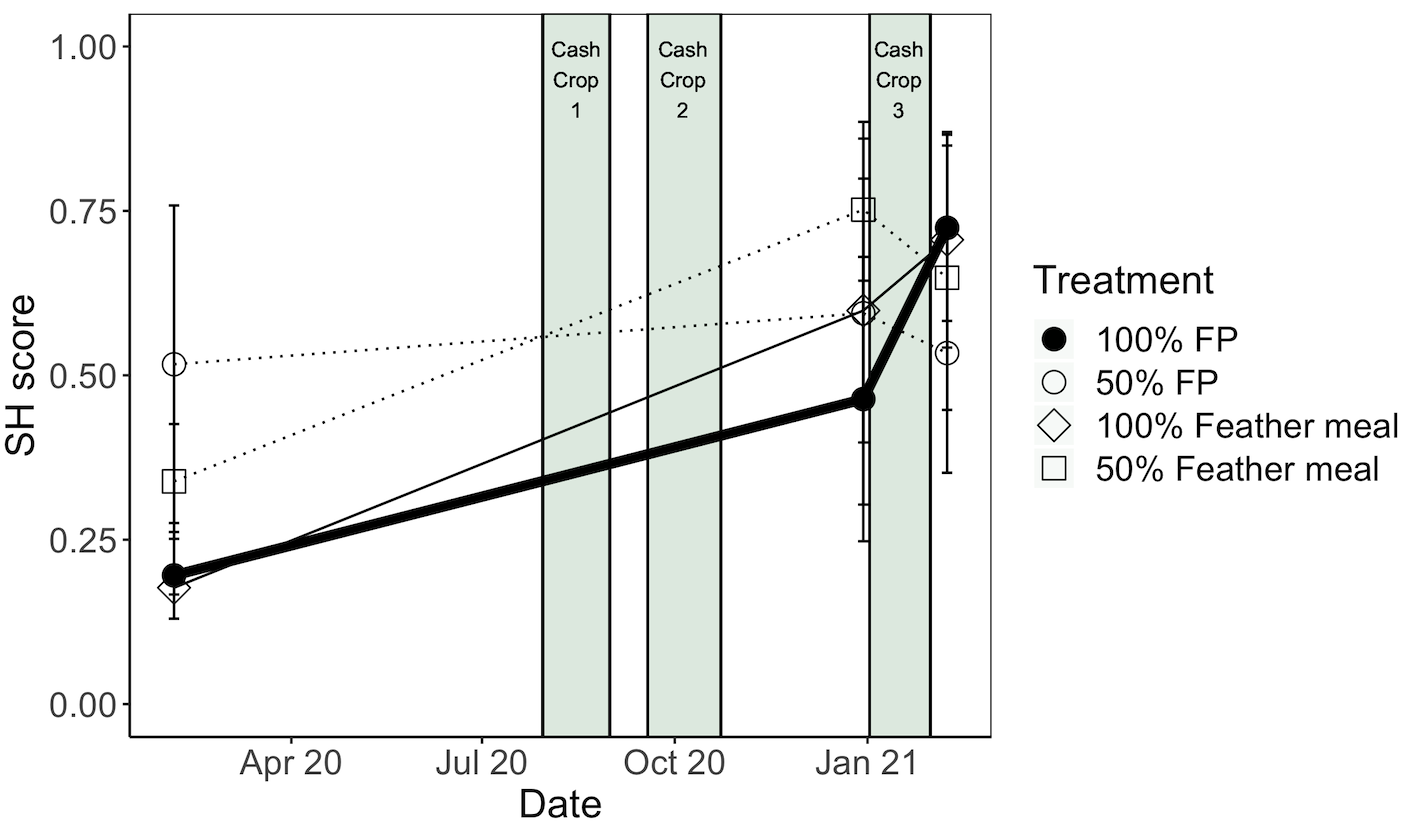
Soil health index, factor scores, and yield
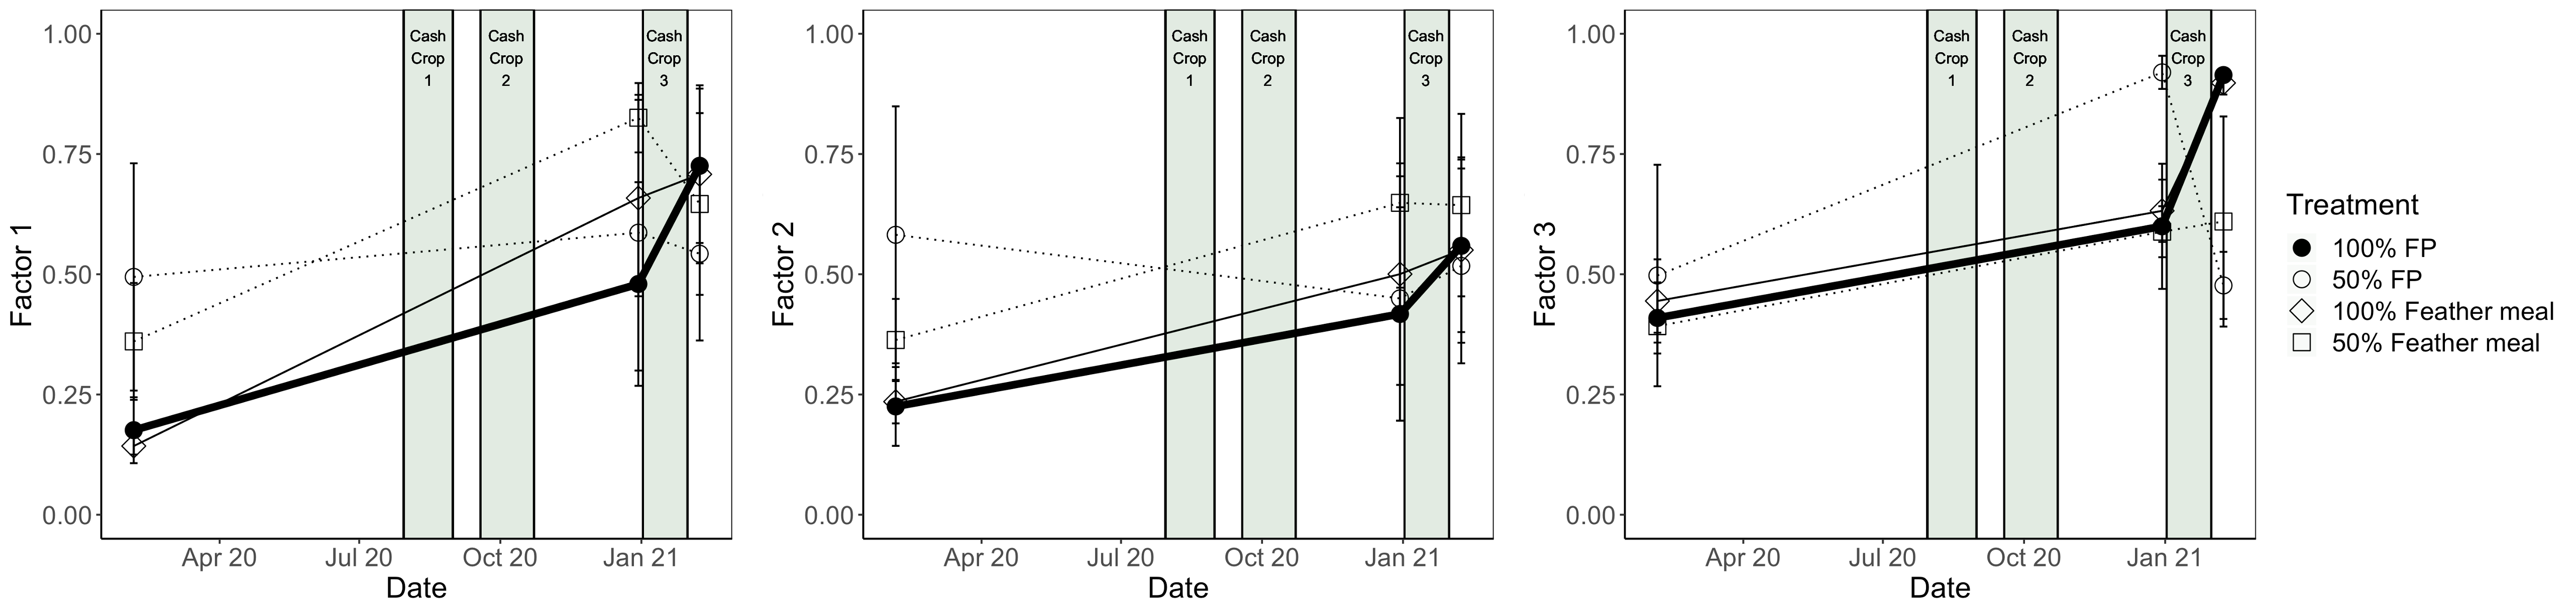
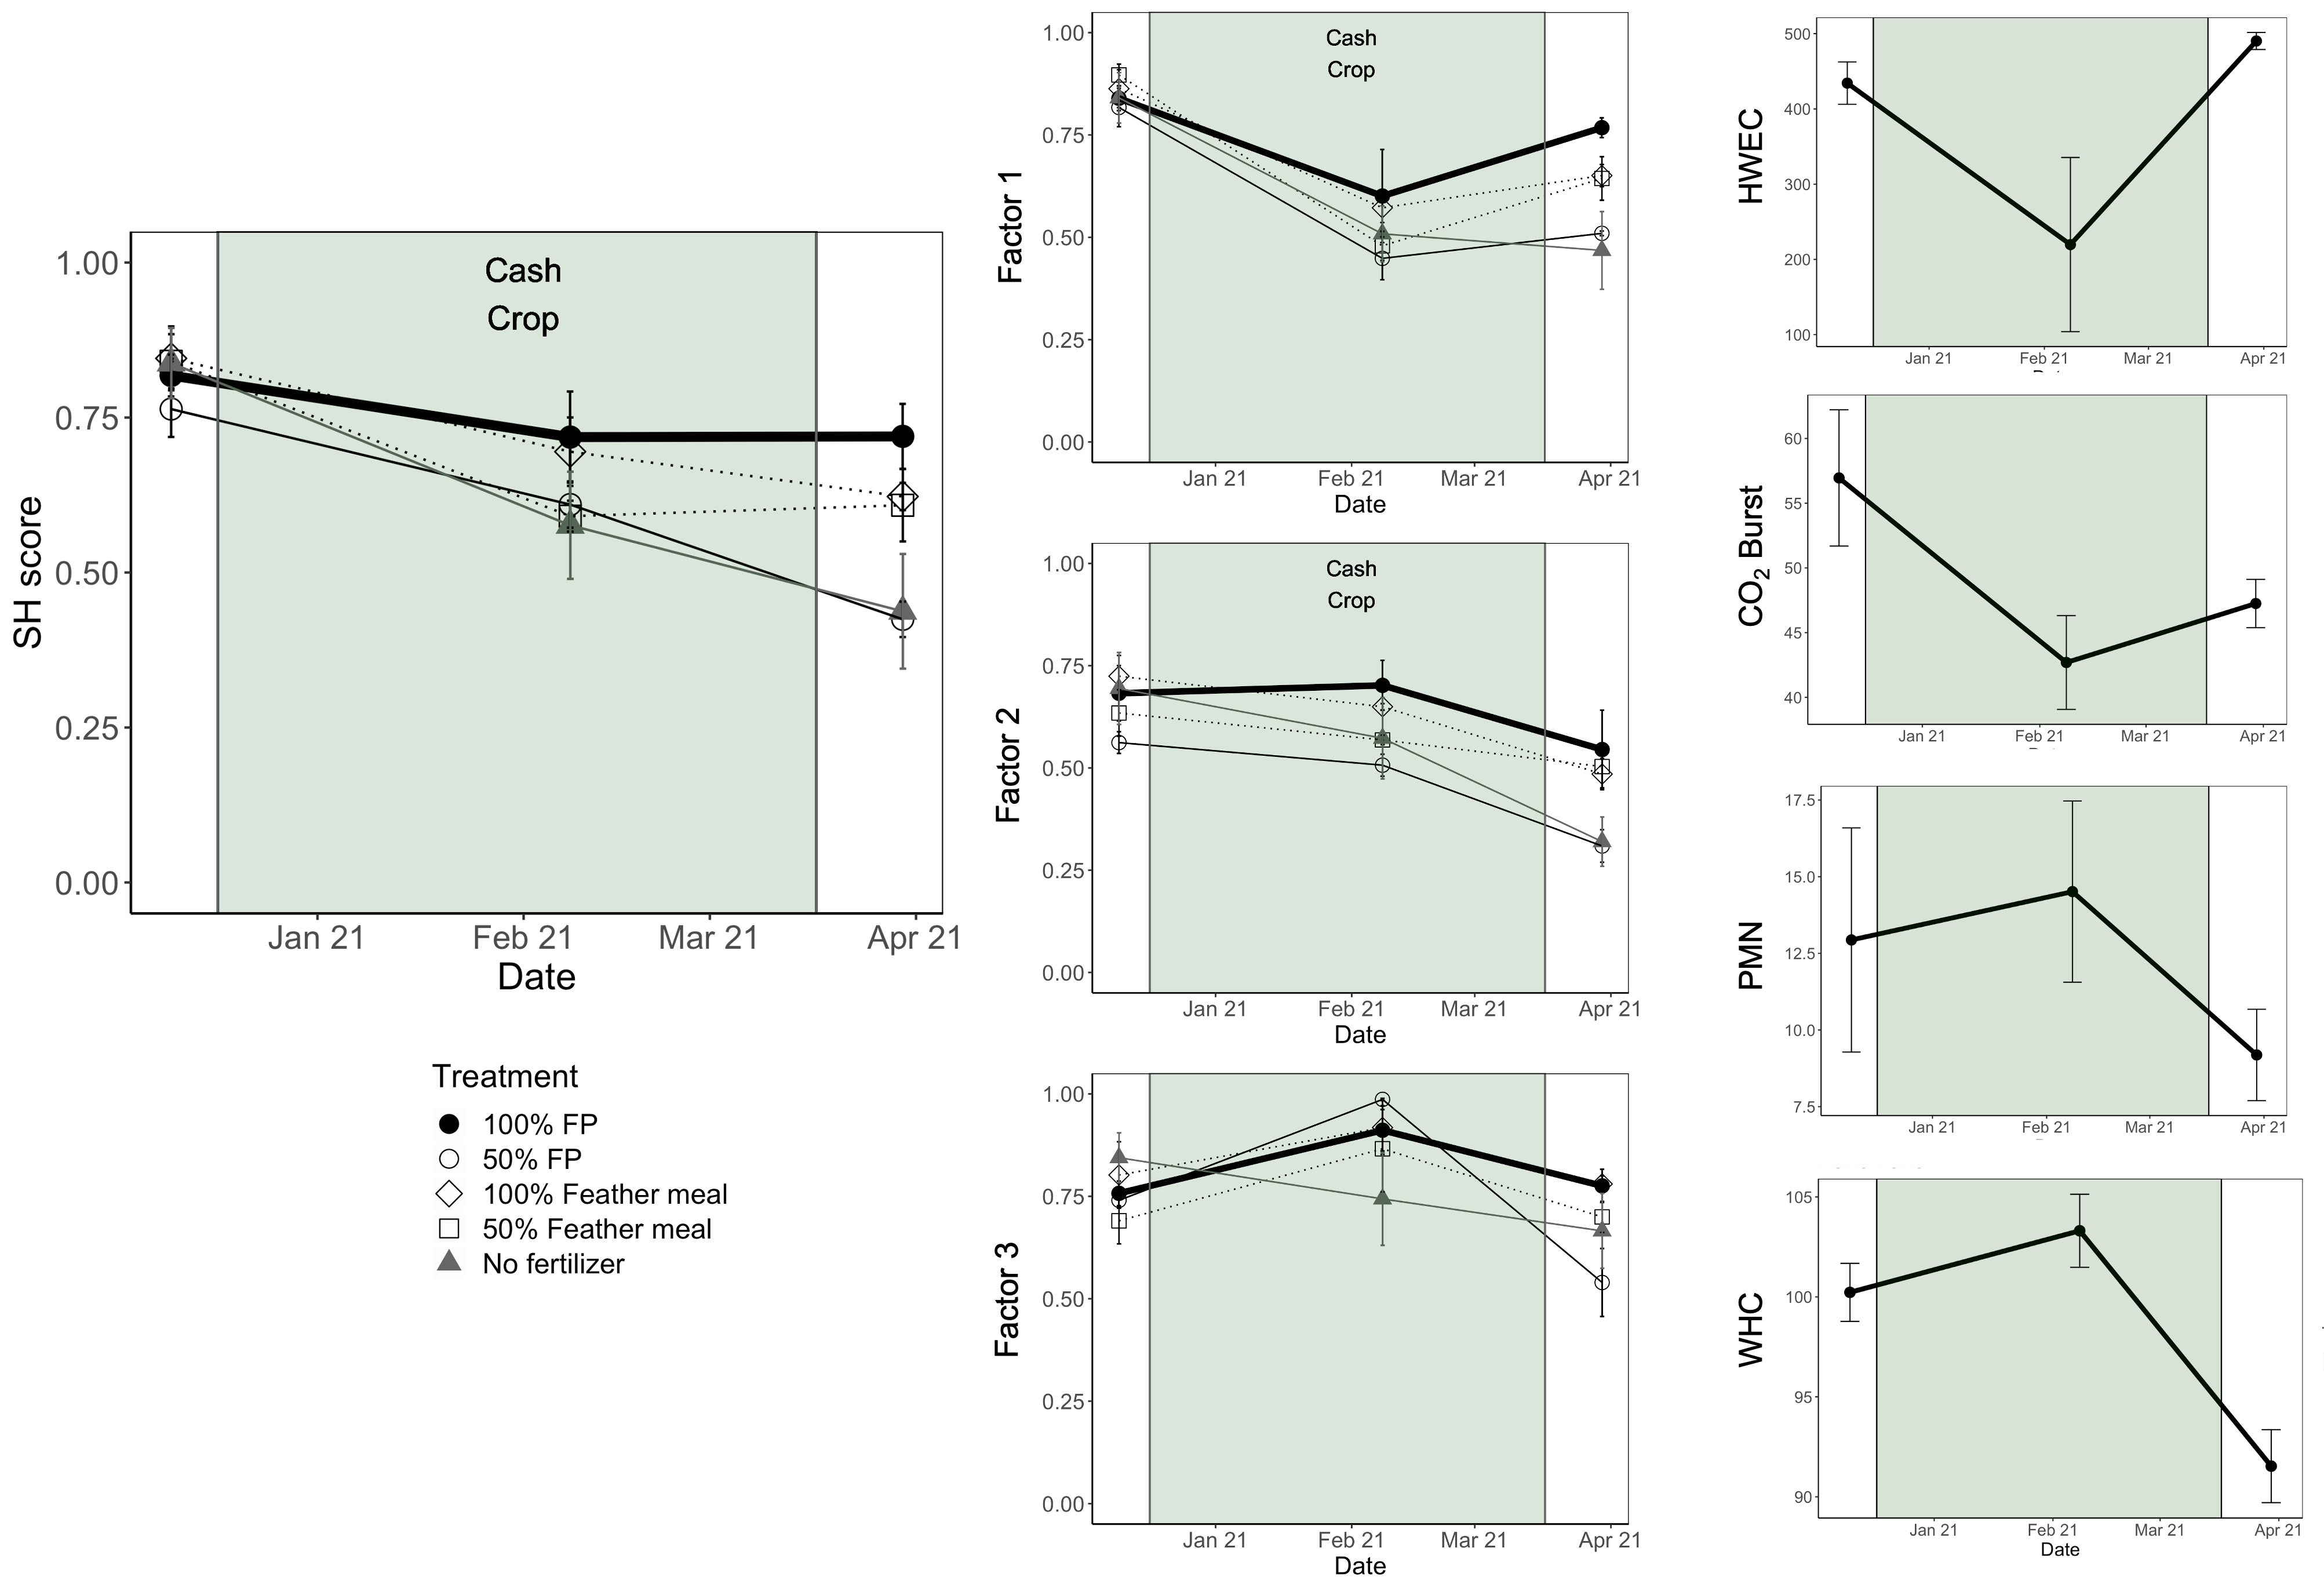
Although within-plot variability was high, the soil health score improved over time for the farmer practice and 100% N amendment rate with feather meal (Fig. 10). Both 50% N treatments declined rapidly during the 3rd cash crop cycle. The farmer practice and 100% feather mean treatments increase over time through multiple crop cycles; whereas 50% farmer practice and feather meal increase, then decrease (Fig. 11). This overall pattern was consistent for all three factor scores. Factor 2 appears to be the most stable for all treatments, whereas factor 3 dropped most rapidly particularly for the 50% feather meal treatment. In this case, yields were significantly higher for the 100% farmer practice and feather meal treatments than the 50% feather meal. 100% feather meal yields were significantly greater than either of the 50% N treatments.
Farm 3
Site overview
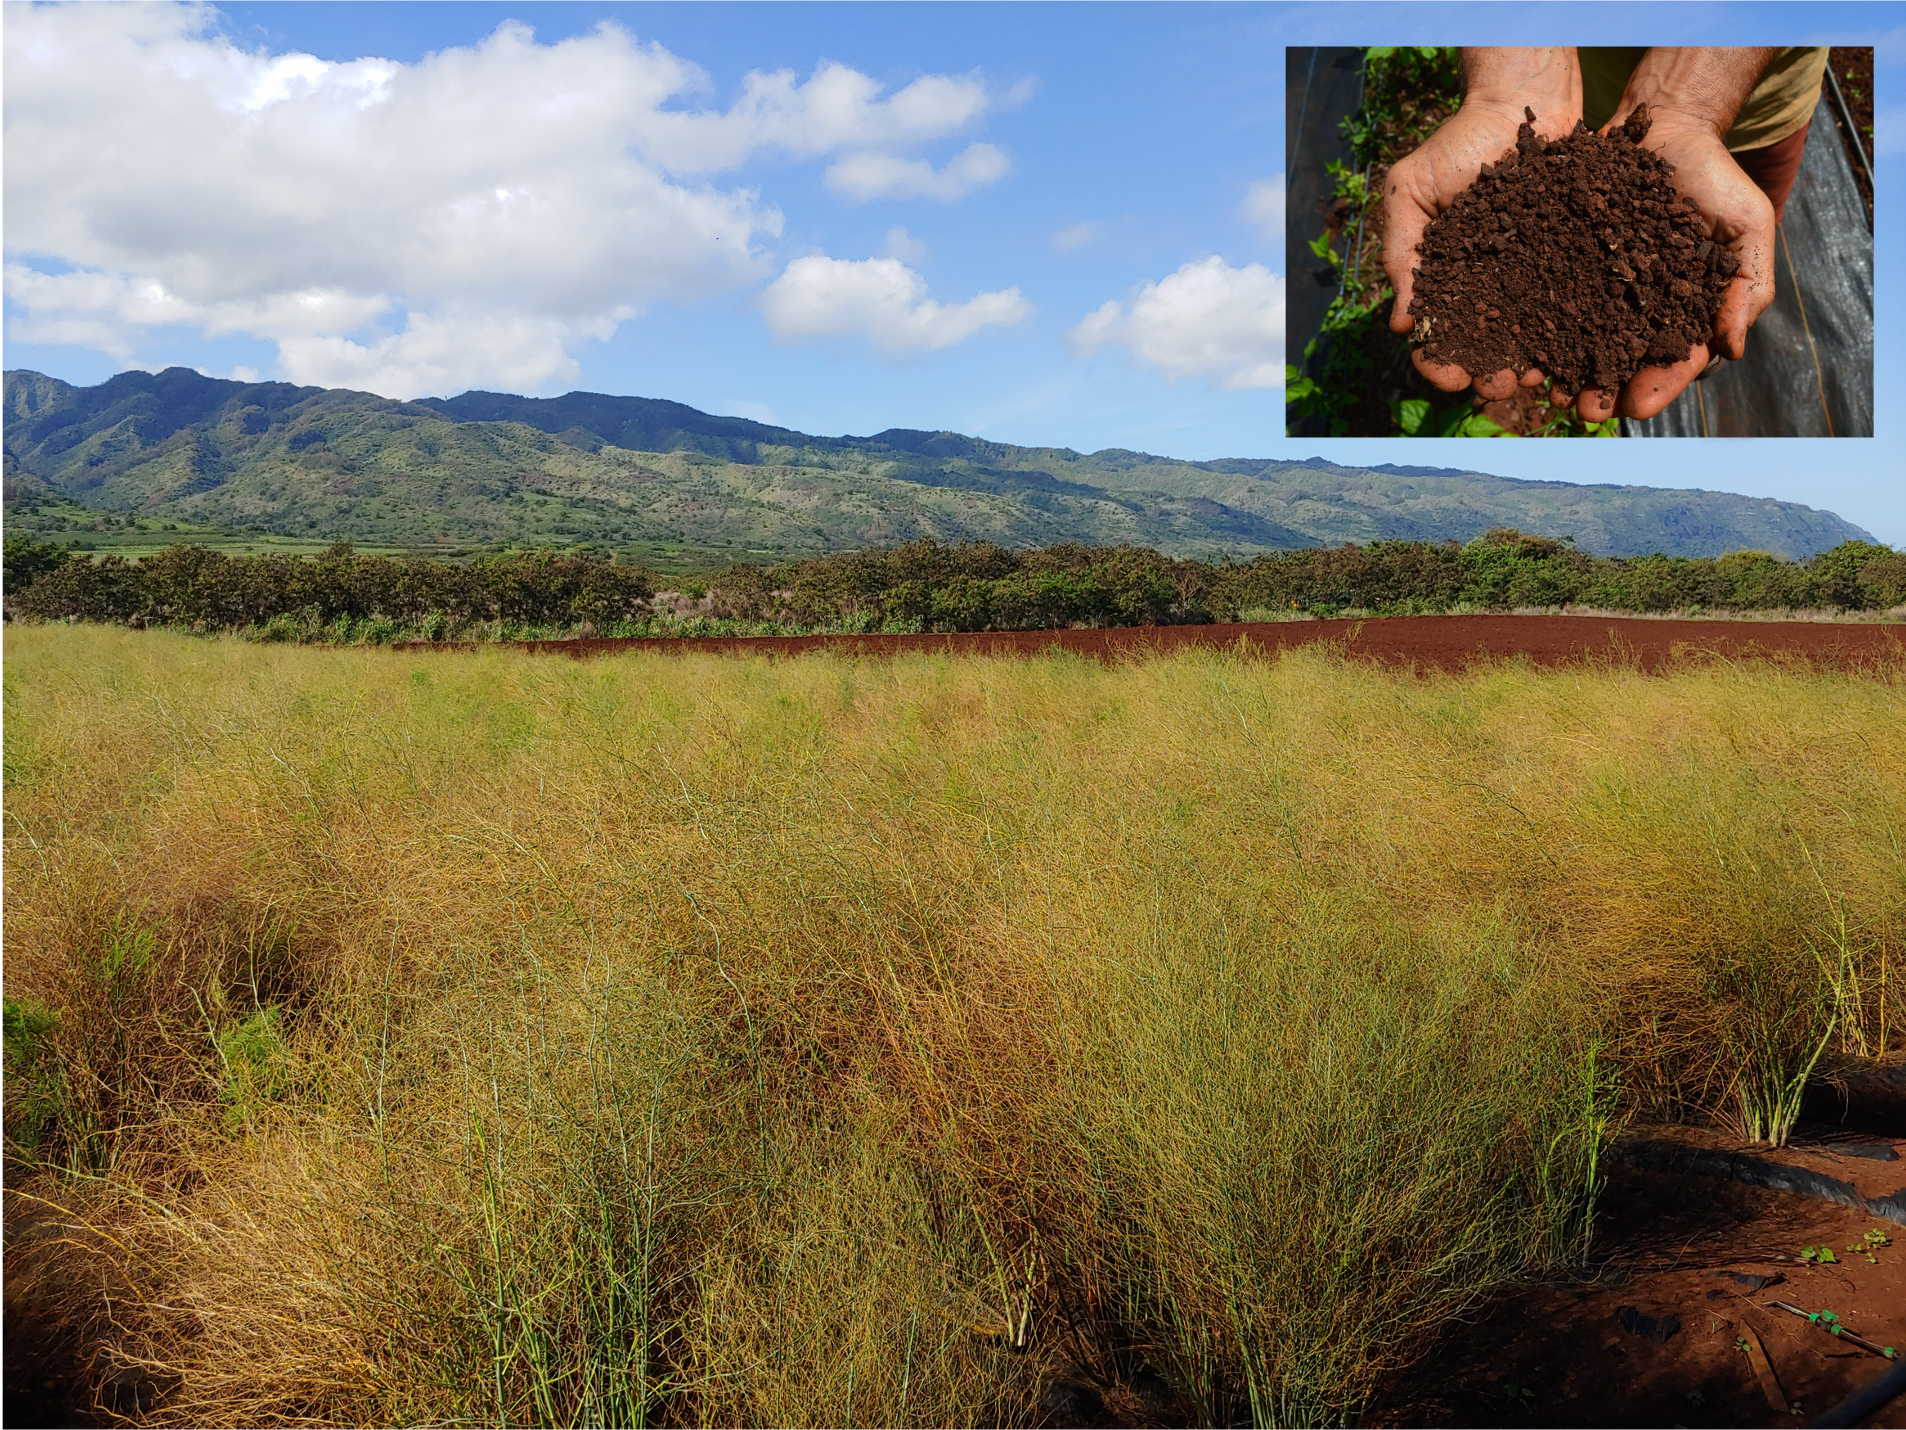
The soil is a Vertisol of the Lualualei series, which are high activity clays, and have a long intensive land use history. The primary crop was salad mix greens and beets (Fig. 12). The current farmer practice (FP) was local fish/bone meal by-product (“tankage”) added at 225 lbs N/acre (Fig. 13). A challenge at this farm is high nutrient inputs, therefore strategy 1 was 50% N from FP, strategy 2 was feather meal applied at the same N rate at FP, strategy 3 was Feather meal applied at 50% FP, and strategy 4 was no fertilizer added at all.
Soil health index, factor scores, and indicators
The soil health score for the current farmer practice remained high through the cash crop cycle, while other treatments (particularly the no fertilizer and 50% farmer practice) declined (Fig. 14). When broken out into the three factor scores, the current farmer practice increased slightly for some (Factor 2 and 3) and decreased for the other (Factor 1) in the middle of the crop growth cycle. Factor 1 is indicative of “substrate accessibility”, of which hot water extractable and CO2 burst dipped and potentially mineralizable N and water holding capacity peaked during the crop cycle. This exercise allowed us to observe how sensitive each indicator, factor score, and soil health score is to timing in a crop cycle for the first time.
Observations with yield
The current farmer practice was best for soil health, however this crop cycle had low yield outcomes. Although not significant, yield for the farmer practice was second lowest only to the no fertilizer treatment. 50% farmer practice had the greatest yield, significantly higher than no fertilizer, but the lowest soil health. No fertilizer had both low soil health and low yield.
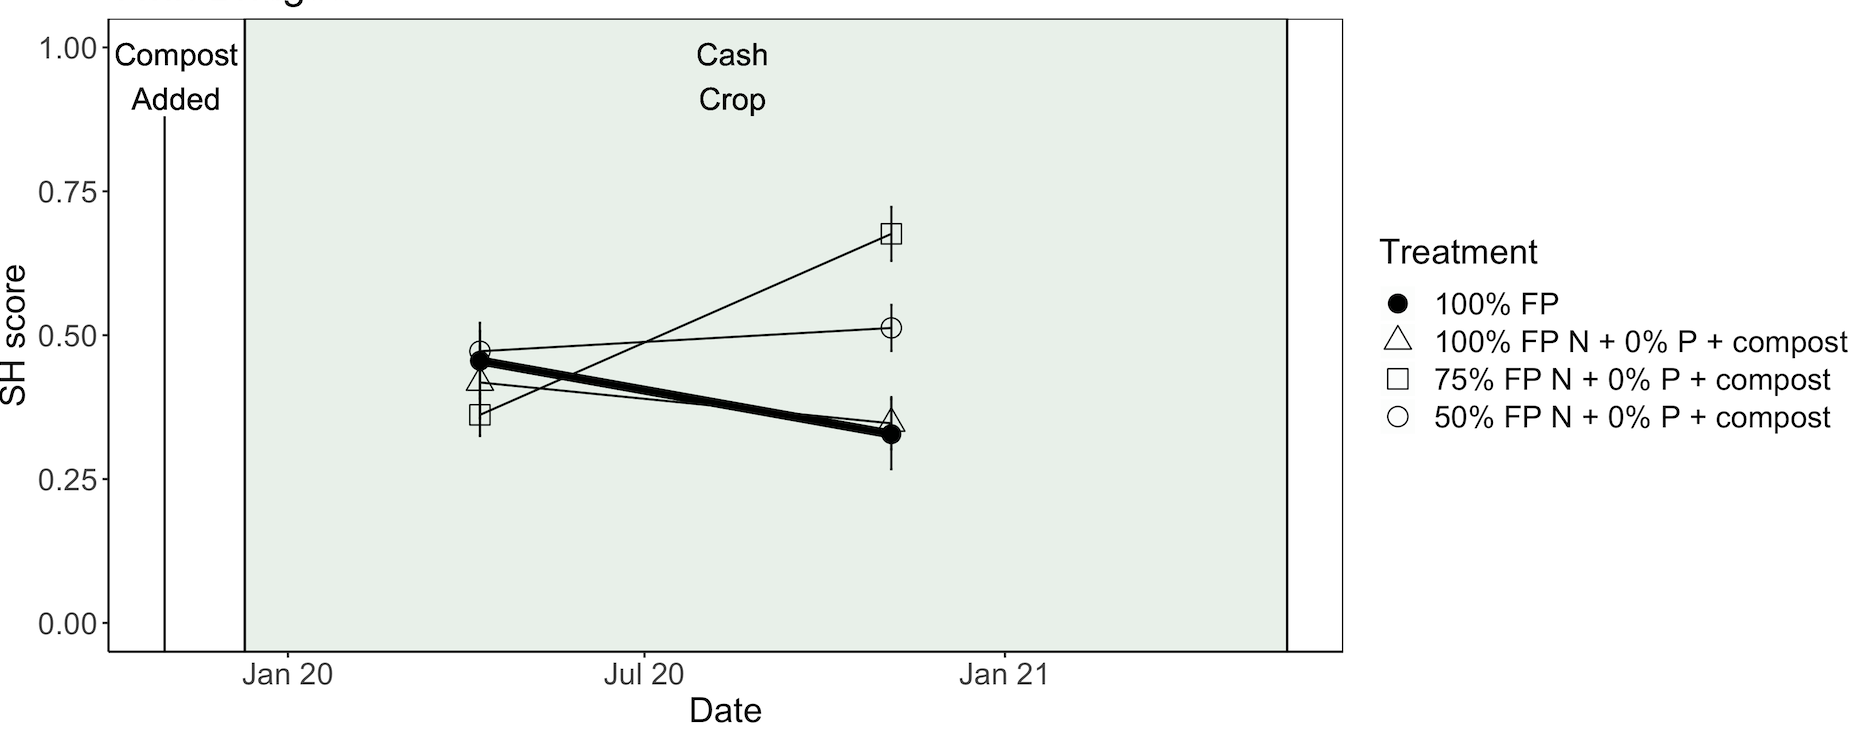
Farm 4
Site overview, soil health index, and yield observations
The soil is a Mollisol of the Waialua series, which are high activity clays, and have a long intensive land use history. The primary crop for this trial was asparagus (Fig. 15). The current farmer practice (FP) was blended NPK fertilizer at a rate of 128 lbs N/acre + 50 lbsP2O5/acre. A challenge at this farm is known accumulation of excess soil P, therefore strategy 1 was 100% Blended NK and no P + compost, strategy 2 was 75% Blended NK and no P + compost, and strategy 3 was 50% Blended NK and no P + compost. The demonstration plots at this farm were large and measurements spread over a long period of time compared to the other farms (Fig. 16). Overall, yield outcomes during our measurement period were poor and there were no significant differences among the treatments. Soil health declined with 100% FP both with and without compost. Interestingly, the intermediate 75% FP input rates + compost had the best soil health outcome, followed by 50% FP + compost.
References:
Acosta-Martinez, V., Cano, A. & Johnson, J. Simultaneous determination of multiple soil enzyme activities for soil health-biogeochemical indices. Applied Soil Ecology 126, 121–128 (2018).
Alkorta, I. et al. Soil Enzyme Activities as Biological Indicators of Soil Health. Reviews on Environmental Health 18, (2003).
Arai, M. et al. Changes in water stable aggregate and soil carbon accumulation in a no-tillage with weed mulch management site after conversion from conventional management practices. Geoderma 221–222, 50–60 (2014).
Arshad, M. A. & Coen, G. M. Characterization of soil quality: Physical and chemical criteria. American Journal of Alternative Agriculture 7, 25 (1992).
Awale, R., Emeson, M. A. & Machado, S. Soil Organic Carbon Pools as Early Indicators for Soil Organic Matter Stock Changes under Different Tillage Practices in Inland Pacific Northwest. Front. Ecol. Evol. 5, 96 (2017).
Crow, S.E., H. Hubanks*, J.L. Deenik, T. McClellan Maaz, C. Tallamy Glazer, E. Vizka*, J. Rivera-Zayas. In review. Dynamic soil health properties reveal legacy of intensive agriculture in (sub)tropical natural and working landscapes. Frontiers in Environmental Science. ID 991262
Drinkwater, L. E., Cambardella, C. A., Reeder, J. D. & Rice, C. W. Potentially Mineralizable Nitrogen as an Indicator of Biologically Active Soil Nitrogen. in SSSA Special Publications (eds. Doran, J. W. & Jones, A. J.) 217–229 (Soil Science Society of America, 2015). doi:10.2136/sssaspecpub49.c13.
Frostegård, A. & Bååth, E. The use of phospholipid fatty acid analysis to estimate bacterial and fungal biomass in soil. Biol Fert Soils 22, 59–65 (1996).
Ghani, A., Dexter, M. & Perrott, K. W. Hot-water extractable carbon in soils: a sensitive measurement for determining impacts of fertilisation, grazing and cultivation. Soil Biology and Biochemistry 35, 1231–1243 (2003).
Haney, R. L. & Haney, E. B. Simple and Rapid Laboratory Method for Rewetting Dry Soil for Incubations. Communications in Soil Science and Plant Analysis 41, 1493–1501 (2010).
Haney, R. L. & Franzluebbers, A. J. Soil CO2 evolution: Response from arginine additions. Applied Soil Ecology 42, 324–327 (2009).
Haney, R. L., Haney, E. B., Smith, D. R., Harmel, R. D. & White, M. J. The soil health tool—Theory and initial broad-scale application. Applied Soil Ecology 125, 162–168 (2018).
Jansen, B., Kalbitz, K. & McDowell, W. H. Dissolved Organic Matter: Linking Soils and Aquatic Systems. Vadose Zone Journal 13, vzj2014.05.0051 (2014).
Karlen, D. L., Ditzler, C. A. & Andrews, S. S. Soil quality: why and how? Geoderma 114, 145–156 (2003).
Kemper, W. D. & Rosenau, R. C. Aggregate Stability and Size Distribution. in SSSA Book Series (ed. Klute, A.) 425–442 (Soil Science Society of America, American Society of Agronomy, 2018). doi:10.2136/sssabookser5.1.2ed.c17.
McClellan Maaz, T., R.H. Heck, C.T. Glazer, M.K. Loo, J. Rivera Zayas, A.R. Krenz, T. B. Beckstrom, S.E. Crow†, J.L. Deenik†. In review. Measuring the unmeasurable: A structural equation modeling approach to assessing soil health. Science of the Total Environment. STOTEN-D-22-13493
Moebius-Clune, B. N. (2016). Comprehensive assessment of soil health: the Cornell framework manual
Parham, J. A. & Deng, S. P. Detection, quantification and characterization of β-glucosaminidase activity in soil. Soil Biology and Biochemistry 32, 1183–1190 (2000).
Tabatabai, M. A. Soil Enzymes. in SSSA Book Series (eds. Weaver, R. W. et al.) 775–833 (Soil Science Society of America, 2018). doi:10.2136/sssabookser5.2.c37.
Research outcomes
Education and Outreach
Participation summary:
By leveraging this project and other soil health efforts we created a Hawaiʻi Soil Health website where we publish news, blogs, outreach activities, and links to our Hawaiʻ`i Soil Health Tool. The Hawaiʻi Soil Health Tool allows producers to plot their fields on a map and interactively interface with their soil health results.
In August 2020, we started our soil health webinar series. For the first of the series we invited all College of Tropical Agriculture and Human Resources (CTAHR) extension agents and specialists for a two-part webinar — soil health basics for Hawaiʻi and Hawaiʻi Soil Health web tool tutorial. The first week we presented the basics and background of soil health and testing in Hawaiʻi and used local results from these demonstration trials and other activities. The second week we demonstrated the Hawaiʻi Soil Health Tool and guided extension agents and specialists through a tutorial of using the tool. The third week in the series (as well as a follow up repeat to reach underrepresented ranching partners) was more personalized to a small, committed group of outreach and extension partners. Videos of these recordings are posted on the Hawaiʻi Soil Health website for viewing at any time. Because many of our relationships to producers and land owners are through extension agents and specialists we began with their training to help during future webinars with producers and with recruiting new producers and land owners to attend. In November 2022, we used data collected from the WSARE project in the first webinar of our follow up series as our first look at the power of soil health testing over time to see change in index and factor scores, in addition to individual indicators of interest.
Surveys of the attendees from webinar 1 (basics of soil health and soil health testing) and 2 (demonstration of the Hawaii Soil Health Webtool) demonstrated interest and application in our topics. After webinar 1, respondents indicated that attendance improved their awareness of soil health (highest ranked, 4.4 out of 5 possible) and provided new knowledge (4.3) and skills (4.2). After webinar 2, these scores improved even higher with respondents indicating that we improved understanding of the webtool (4.7), provided new skills in how to use the tool (4.7) and improved confidence in using the tool (4.7). After the first webinar each respondent indicated they would share their new knowledge of soil health with 10+ people, and after the second, each estimated they would show 13.8 people on average the new tool. In the next year, attendees indicated that they would use their knowledge in educational programs, to inform producers, and improve their communication to producers and 70% indicated that they would recommend a producer-focused soil health webinar series to their network.
After webinar 3, which was two sessions with smaller groups of extension colleagues, we received feedback on their programs and interests in terms of conservation practices, fertilizer option, tree-based systems, Master Gardener, media for tool training, and collaboration with us for extension. They also listed the types of deliverables they would be most interested in, the most important were workshops/field days and extension bulletins/fact sheets, followed by videos and infographics.