Final report for GW20-204
Project Information
An 88% increase in the demand of ruminant meat as a result of changing diets and a projected world population of 9 billion humans (Searchinger et al. 2014), is a direct call to ranchers. This challenge is amplified two-fold because 1) non-native plant invasion decreases rangeland productivity and 2) control is expensive- land owners in Montana spend $4,583 annually controlling non-natives on the average grazing unit (Mangold et al. 2018). Alarmingly, the aggressive non-native annual, cheatgrass, is spreading in south-western Montana. We must create effective management solutions against this plant.
We aim to answer the following: 1) Do non-native plants alter nutrients? and 2) Does a novel seed mix out perform a traditional one? To answer these questions herbicide (imazapic) will be applied to control cheatgrass in the fall, and restoration seeding in the spring at six sites in the Centennial Valley, MT. The site-specific seed mix composition will be informed by site characteristics and soil nutrients as part of a greenhouse trial, prior to seeding in the field.
Outreach methods include: field day presentations, academic presentations, and multi-media providing project updates and results. We project that the novel seed mix will have higher establishment and productivity compared to traditional seed mix following herbicide application.
- Control cheatgrass infestations using herbicide (imazapic), at water tanks that have been heavily disturbed. Plots will be established in summer 2020 prior to fall herbicide application. Cheatgrass cover will be monitored to assess herbicide efficacy (Summer 2020/21/22).
- In a controlled greenhouse study, quantify a site-specific seed mix’s potential to establish, remain productive, and compete with cheatgrass based on site characteristics and soil nutrients. Use site conditions (soil moisture/temperature) and soil nutrients to inform a greenhouse trial of candidate species (winter 2021) to be sown at water tank sites.
- Evaluate combinations of seed mixes (traditional and novel mix) to utilize available soil nutrients, deter cheatgrass and restore productivity at watering tanks post herbicide application. Seeding will occur in spring 2021 based on results from objective 2. Establishment success and biomass production of the seed mixes will be analyzed yearly (summer 2021/22).
Cooperators
- - Producer
- - Producer
- - Producer
- - Producer
- (Researcher)
- - Producer
- - Producer
- (Researcher)
- (Researcher)
Research

Four high-use livestock water tanks, in the Centennial Valley, MT, were chosen as sites to analyze the effect of herbicide, grazing, and seed mixes on cheatgrass abundance and plant community structure for this study. Drs. Rew, Cutting, and I, selected sites that were found to be most similar in terms of use by cattle, which we determined by the amount of bare ground, abundance of cheatgrass (Bromus tectorum) and site characteristics (elevation, aspect, proximity, etc.). Cattle are only present for specific times of the year as allowed by grazing permit, creating short periodic events of disturbance, typically starting in late August and ending in mid-September.
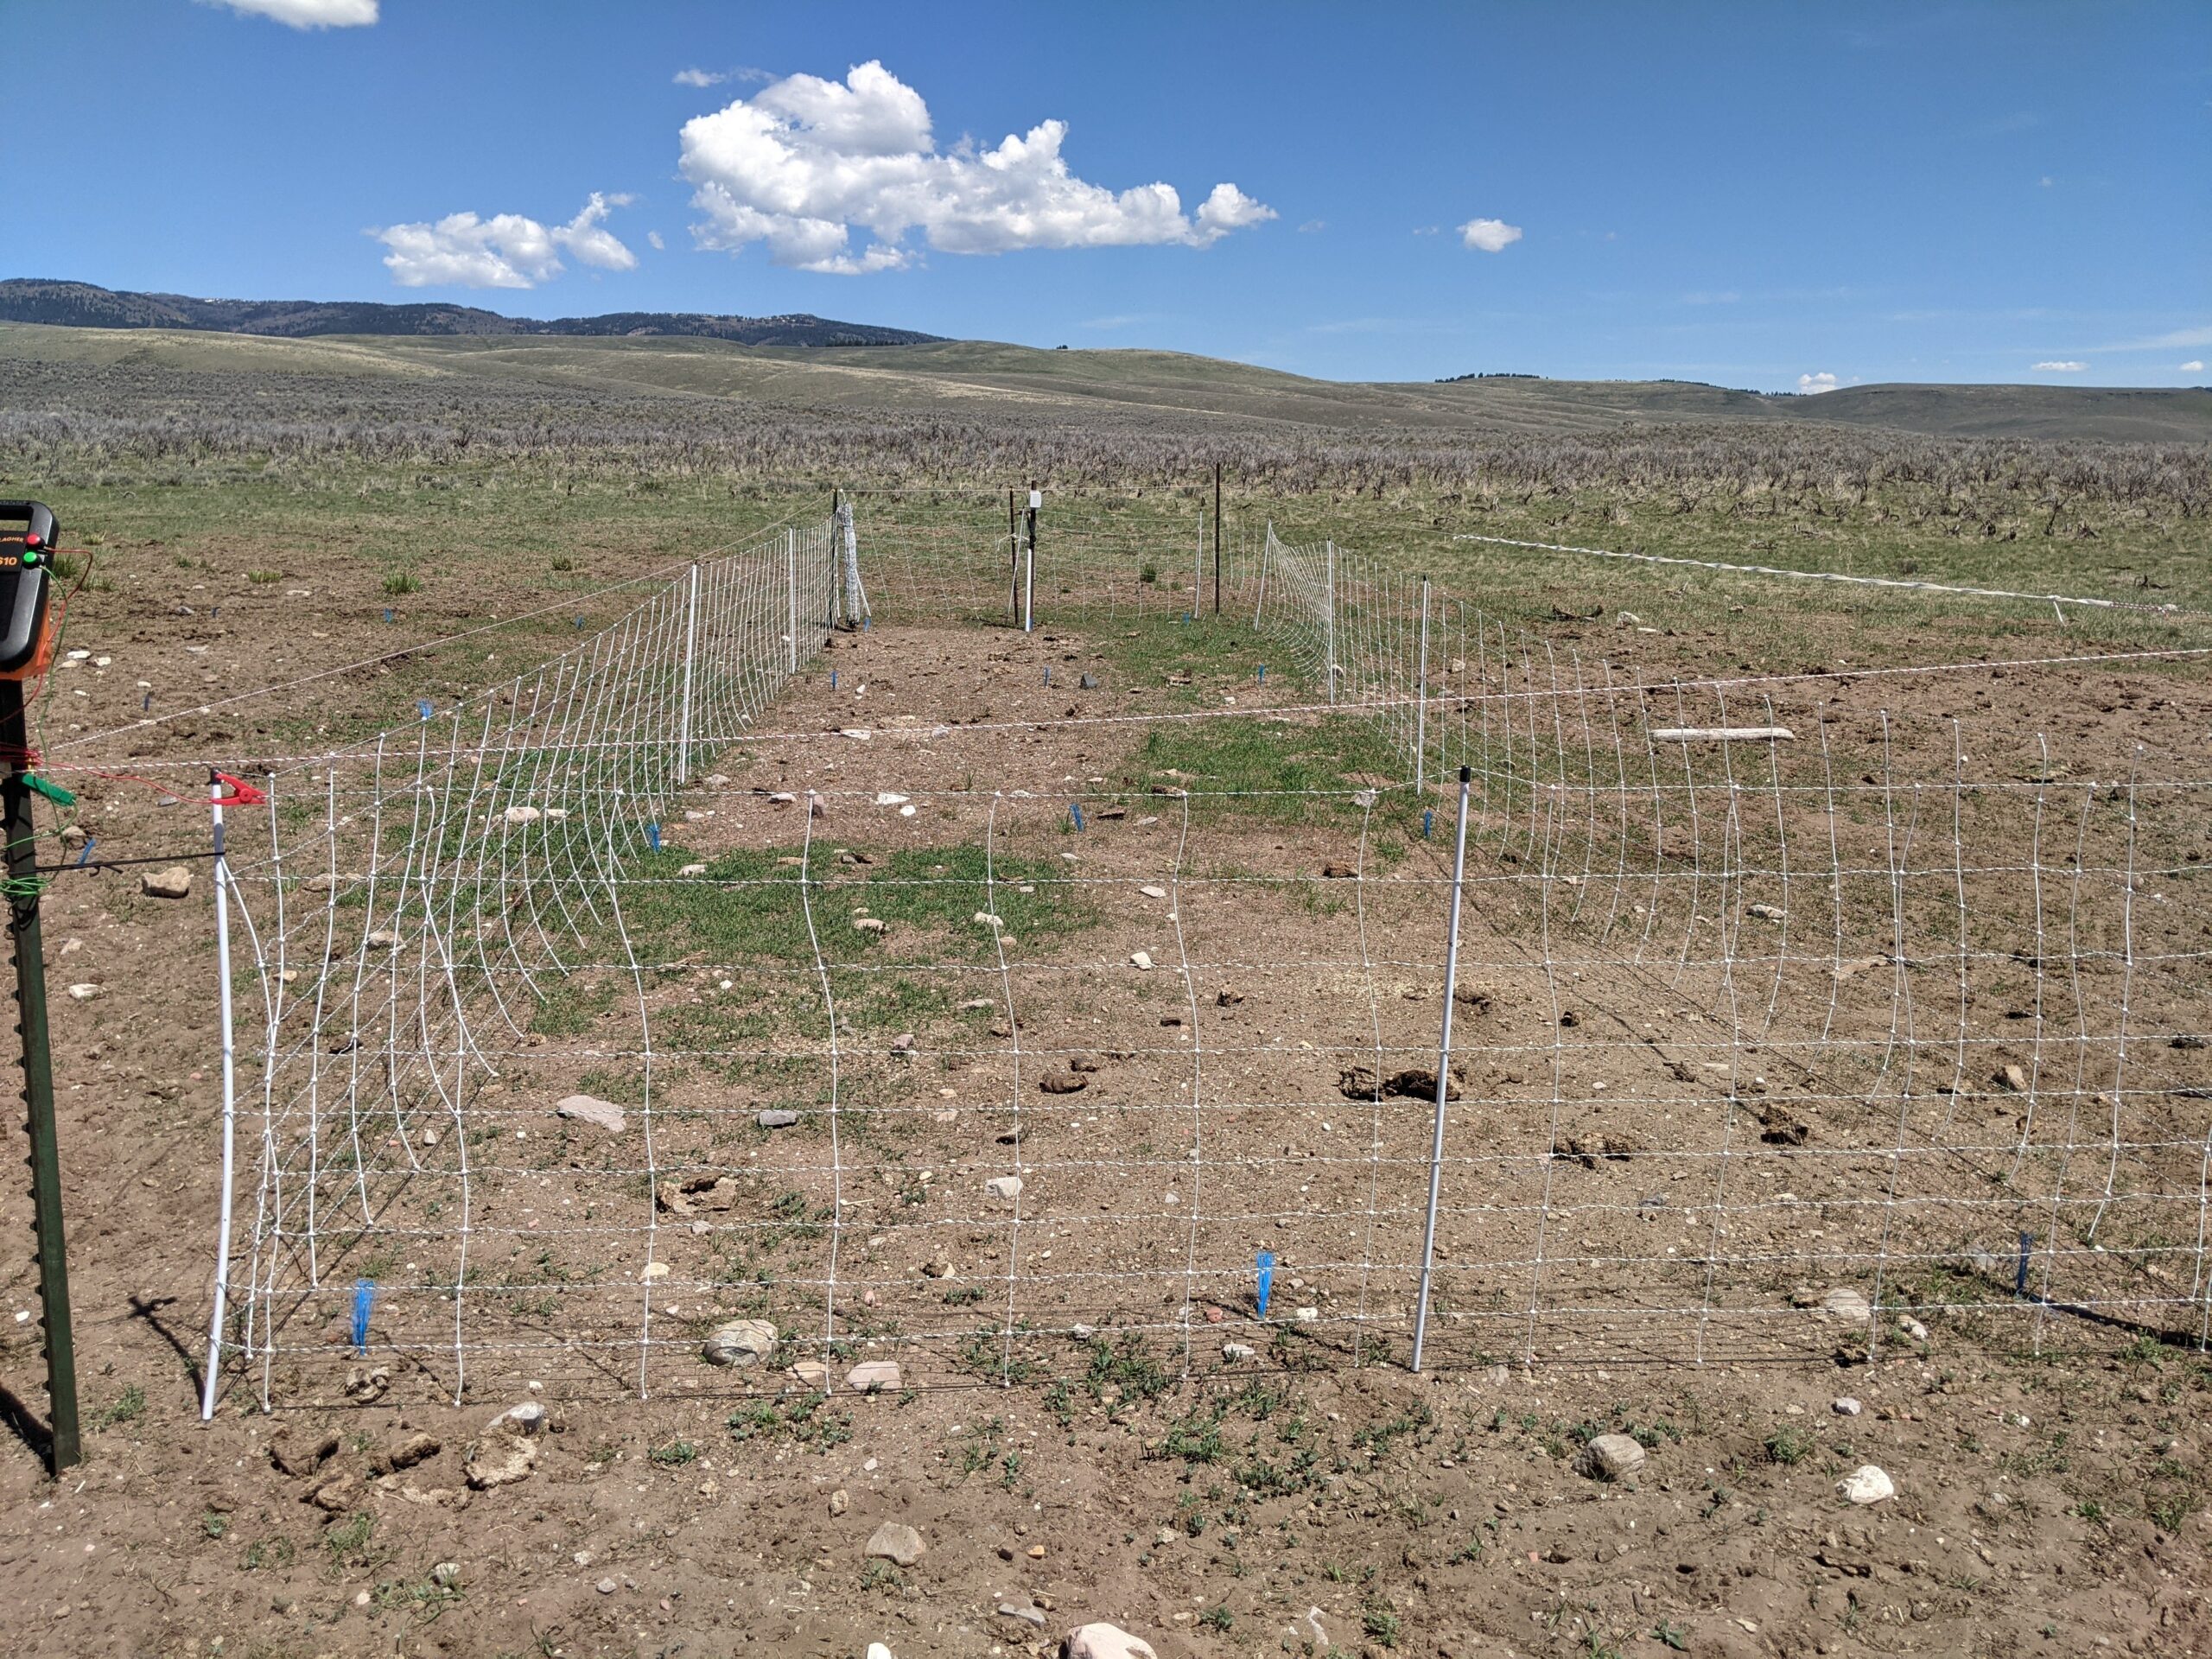
In May 2021, grazing exclosures were constructed to account for the potential impacts of cattle trampling on seed mix establishment (native/ruderal) in both sprayed and non-sprayed treatments (Figure 1 ). Due to concerns from producers and managers about the size of the grazing exclosures the pellet seeding method was dropped from the project. However, this method is being assessed in another Western SARE grant (project number: SW20-915) conducted by Dr. Lisa Rew and colleagues. The grazed and non-grazed exclosures measured 40.5m2 each. Within each of the exclosures (grazed/non-grazed) six smaller rectangular plots (6.75m2) were marked out, half of which received an herbicide application of imazapic (6oz/ac/ai) in October of 2020 (Figure 1), which addressed the first objective; to remove cheatgrass. Within each of these six plots, three square frames (1.5m2) were established and received a seeding treatment (native, ruderal, or no seed) (Figure 1). This study design allowed us to monitor the effects of herbicide (objective 1), the establishment of seed mixes and plant community structure on grazed and non-grazed land. Centimeter accuracy GPS locations were taken to ensure we could re-visit each frame in the grazed treatment if flagging/road-hairs were pulled by cattle or other ungulates over the course of the season.
The second objective was to use environmental data collected at our sites to inform a site-specific seed mix trial. However, due to the two-year cycle of this funding, we did not have enough time to implement objective two in its entirety as written in the project proposal. I felt planting candidate seed mixes in the first growing season and tracking their growth and nutrient uptake over two growing seasons would provide more valuable and scientifically robust results for producers. As a result, our second objective became; to determine which seed mix (native/ruderal) would best compete with cheatgrass in a greenhouse study, before establishing a field trial. The native seed mix contained species with high observed abundance in the Centennial Valley and included: bluebunch wheatgrass (Agropyron spicatum), prairie junegrass (Koelaria macrantha), and green needlegrass (Stipa viridula). The ruderal mix included: intermediate wheatgrass (Agropyron intermedium), thickspike wheatgrass (Agropyron dasystachium), and triticale (Triticale secale). Intermediate and thickspike wheatgrass were chosen because of their rhizomatous root structure and triticale due to its high productivity (typically grown for fodder/forage) and sterility (triticale is a second-generation sterile hybrid between wheat (Triticum) and rye (Secale)).
Therefore, during the winter of 2020-21, we conducted competition experiments to assess competitive ability of the two seed mixes. Mixes were grown at a density that imposed competition: 24 plants per pot (7.5-inch diameter). In the first experiment each seed mix was split into three competition treatments: 1) each species grown alone (intra-specific competition), 2) each species of the same mixture grown together (inter-specific competition) and 3) each seed mixture grown with cheatgrass (inter-specific competition). In the second experiment we compared each mix’s ability to suppress cheatgrass at three densities, high (18:6), equal (12:12), and low (6:18). Each species within the mix was represented equally at each density. For example, 18 cheatgrass, 2 bluebunch wheatgrass,2 green needlegrass, 2 prairie junegrass, were sown in the high cheatgrass density treatment. In a third experiment, the nutrient availability in pots that contained bluebunch wheatgrass and cheatgrass, grown in monoculture (24 plants/pot) and in competition at equal densities (12 plants/species/pot), was assessed. Plant available nutrients were recorded using Plant Root Simulator (PRS®) probes (Western AG Innovations, Saskatoon, Canada) placed in 24 total pots (eight total replicates per plant combination). Plants were allowed to grow for 30 days, during which time PRS® probes were present. Above ground biomass was used to quantify competitive effects in all experiments, except the third, which was quantified by plant available soil nutrients.
For all greenhouse experiments plants were grown in a 50:50 (by volume) mix of sunshine mix #1 and Montana State University (MSU) Mix soil from the Montana State University Plant Growth Center (PGC) (Bozeman, MT, USA). The sunshine mix #1 is a soil-less mix of Canadian Sphagnum peat moss and Perlite, buffered with dolomitic lime, and containing a starter fertilizer and wetting agent. The pH as of December 2020, was 5.8. The MSU Mix is a mix of mineral soil, Canadian Sphagnum peat moss, and washed concrete sand that is blended at a 1:1:1 by volume ratio. This soil contains Aqua-Gro 2000G as a wetting agent, at the rate of one pound per yard, to increase soil moisture retention, and is steam pasteurized. As of December 2020, the MSU mix had pH of 7.4. The growth center has a functional range of ~20°C (16-27°C) during the day and ~16°C (10-24°C) at night, and an average photoperiod of 16 hours. Plants were grown for a total of 60 days and watered by hand every other day as needed.
The third objective was to track seasonal levels of plant available nutrients in the field. Plant Root Simulator® probes were deployed at one site (Tank 82), in the non-grazed exclosure and compared between two treatments: 1) sprayed and seeded with the native seed mix, and 2) no-spray or seeding. Three, one-month burial periods were conducted (May-June, June-July, September-October) in 2021 and four one-month burial periods were conducted in 2022 (May-June, June-July, July-August, September-October). The “late summer” burial period (July-August) was added in 2022 to create greater temporal resolution of nutrient availability over the course of the growing season and it served as a proxy for the “fall” burial period that was not included in this report due to timing constraints (i.e., final report deadline before termination of “fall” burial period). There were not enough observations to statistically test if nutrient availability patterns varied by year and season. Therefore, 2021 and 2022 nutrient availability for each season was combined to test whether there were differences in nutrient availability across seasons. PRS® probes were sent to Western AG Innovations (Saskatoon, Canada) for analysis of available nutrients. Soils from each of the four water tanks were classified as predominately sand (91%,5%,4%; sand, silt, clay respectively: Agvise, Benson, MN, USA) (Table 1) and had an average pH of 7.3 (Table 1) which closely matches the pH (7.4) of the soils used in the greenhouse study.
Grazing, Herbicide and Year Effect on Cheatgrass Abundance and Plant Community
Overall, cheatgrass abundance was relatively low in 2021, and did not differ between treatments (Figure 2), speculatively due to drought. Cheatgrass abundance, however, did increase overall in 2022 (Figure 2) leading to greater cheatgrass abundance in non-grazed and non-sprayed plots compared to those that were non-grazed and sprayed, and grazed (both sprayed and non-sprayed). The greatest increases in cheatgrass abundance from 2021 to 2022 were in the non-grazed and non-sprayed plots (51% increase in abundance) and the non-grazed and non-sprayed plots (35% increase in abundance) (Figure 2). The combination of reduced disturbance experienced by plants in the non-grazed plots likely allowed populations to recover from a history of prior disturbance. This could be due to increased recruitment from the seedbank and/or increased seedling survival from said seedbank. Fall germination by cheatgrass allows it to establish itself in preparation for optimum growing conditions in the spring. As a result, the warm and wet spring in 2022 compared to 2021, while beneficial for all plants likely disproportionately favored cheatgrass. This suggests that increases in cheatgrass abundance seen in both the sprayed and non-sprayed treatments were in response to environmental factors and treatment effects. Despite these increases, it is important to notice that cheatgrass abundance was comparatively lower in the sprayed vs. non-sprayed plots in 2022.
Plant Community Response
This analysis was added after the proposal was written and serves to elucidate treatment effects and provides greater context for objectives 1 and 3. Plant community response to grazing, herbicide, and seeding mix were quantified by using species richness and Shannon’s alpha diversity index. Cheatgrass was omitted from the species richness analysis because it was a target species for removal, i.e., inclusion of cheatgrass could artificially create differences between successful treatments. Cheatgrass was included in the Shannon’s alpha diversity index which (like others) incorporates both species richness and abundance to incorporate a measure of community evenness. Therefore, an increase in alpha diversity can result from increased evenness, species richness, or both.
Cumulative species richness, for all treatments combined, increased from 2021 to 2022 by ~2 species on average. Specifically, species richness did not differ in the grazing nor for seed mix treatments, but there was ~1 more species in the non-sprayed compared to the sprayed treatment.
Overall, there was a more diverse and evenly distributed plant community in 2022 than 2021. The grazed treatment had both a less diverse and less evenly distributed plant community on average compared to the non-grazed treatment. Lastly, the sprayed plots had less plant diversity than non-sprayed.
Seed Mix Competition Study: Greenhouse Experiment
Individual Species Monocultures (Intra-species competition)
When species were grown in monoculture at a planted density of 12 plants per pot, there were no differences in relative biomass production between any of the species, across both native and ruderal mixes, except for triticale and prairie junegrass, with the former producing the most biomass and the latter the least.
Mix Monocultures (Intra-mix competition)
Comparatively, when species from each mix were grown together in a pot in equal density, we found triticale produced the most biomass of either mix (Figure 3). Within the ruderal mix, intermediate and thickspike wheatgrass produced the same amount of biomass. In the native mix, green needlegrass produced more biomass than prairie junegrass, which produced the least amount of biomass in the native mix. Bluebunch wheatgrass’ biomass was not statistically different than prairie junegrass or green needlegrass.
Mix Competition with Cheatgrass (Inter-specific competition)
When the ruderal mix was grown in competition with cheatgrass we found that triticale produced more biomass than all other species including cheatgrass (Figure 4). There was no difference in biomass between any of the other species, including cheatgrass. The native mix showed a different pattern in species biomass (Figure 5). Cheatgrass and bluebunch wheatgrass produced more biomass than prairie junegrass. Green needlegrass statistically was not different in biomass production compared to any of the other species in the native mix (Figure 5).
Density Effects
Cheatgrass was suppressed to the same extent at the high and equal densities by the native mix. Conversely, the ruderal mix suppressed cheatgrass to the same degree at high, equal, and low densities (Figure 6). Cheatgrass biomass was highest when grown in low density with the native seed mix. Worth noting is that cheatgrass biomass was the same at equal and low densities of the ruderal mix, which were the same in the high and equal densities for the native mix (Figure 6). Based on findings from the seed mix competition with cheatgrass experiment (above), the suppression of cheatgrass by the ruderal mix is likely due to triticale (Figure 4). While the native mix’s suppression of cheatgrass is likely due to its collective competitive ability (Figure 5). It is also possible that the increased biomass of cheatgrass when grown at low density and in competition with the native mix may have resulted from a decrease in intraspecific competition experienced by cheatgrass.
Nutrient Availability: Greenhouse
For the greenhouse study (and field study discussed below) we used Plant Root Simulator (PRS®) probes to sample for nutrients essential for plant growth: ammonium (NH4+ ), nitrate (NO3-), zinc (Zn), boron (B), lead (Pb), aluminum (Al), iron (Fe),copper (Cu), magnesium (Mg), manganese (Mn), cadmium (Cd), sulfur (S), potassium (K), phosphorous (P), and calcium (Ca).
Available nitrate (Figure 7) and phosphorous (Figure 8) were reduced by cheatgrass presence compared to bluebunch wheatgrass. Growing the species in competition resulted in the same nitrate levels compared to cheatgrass grown alone (Figure 7) and resulted in an intermediate level of phosphorous between each species grown alone (Figure 8). No other nutrient levels differed between bluebunch wheatgrass grown alone, cheatgrass grown alone, and cheatgrass and bluebunch grown together.
Our greenhouse competition study suggests that triticale and bluebunch wheatgrass are both competitive with cheatgrass and ideal candidates for restoration seeding. Additionally, cheatgrass and bluebunch wheatgrass have varying degrees of impact on nutrient availability, and its impact on plant community and restoration warrants further investigation.
Seed Mix Competition Study: Field
The native and ruderal seed mixes were applied at four field sites. Only a few individuals of triticale (n=18) established and grew to maturity by the end of summer 2021; it was the only species from either seed mix to establish and was found in all herbicide and grazing treatment types. The lack of establishment of seeded species, likely due to a strong drought in 2021, make this result un-surprising, but nonetheless disappointing. Despite the strong potential for the ruderal mix to reduce cheatgrass abundance in the greenhouse experiment (largely due to triticale), the lack of establishment of seeded species in the field in the spring of 2021 rendered a field comparison, between the two mixes, impossible.
Nutrient Availability: Field
Plant Root Simulator (PRS®) probes were used to analyze available nutrients in the rooting zone of plants at a single field site. We compared the sprayed and non-sprayed treatments within the non-grazed exclosure, to better understand how herbicide application and cheatgrass reduction effected nutrient availability. Subsequently, each nutrient was analyzed for differences by season, year and herbicide treatment, there were not enough observations to evaluate if seasonal patterns differed by year (i.e., season by year interaction).
Seasonality
Nitrate (Figure 9), phosphorous, calcium, magnesium, sulfur, iron, zinc, and lead all exhibited the highest relative availability in the spring decreasing to fall (Table 2). However, copper and cadmium did not follow the same pattern, instead they peaked in the late summer. None of the other nutrients differed by season.
Year
Nitrate (Figure 9), phosphorous, potassium, calcium, magnesium, sulfur, manganese, zinc, and lead all had greater availability in 2021 than in 2022 (Table 3). Cadmium was an exception, having lower availability in 2021 than in 2022. None of the other nutrients differed by year.
Herbicide Treatment
Sulfur, iron, manganese, zinc, and lead were more available in the sprayed compared to the non-sprayed treatment (Table 4). Nitrate was most available in 2021 in the sprayed vs non-sprayed treatments, but in 2022 there was no difference between sprayed and non-sprayed treatments. Copper was more abundant in the sprayed treatment in 2022 only. No other nutrients differed by treatment.
Thus, in summary three consistent patterns emerged: all nutrients that differed by season had greater levels of availability in the spring and lower levels in the fall except for copper and cadmium which spiked in late summer (Table 2). Secondly, there was greater nutrient availability in 2021 than 2022 for all nutrients that differed by year except for cadmium, which had greater levels in 2022 (Table 3). Lastly, the sprayed plots had greater nutrient availability than the non-sprayed plots for nutrients that differed by treatment, this pattern was dependent on year for nitrate (Figure 9 & Table 4).
In general soil nutrient availability can be regulated by decomposition rates of litter, litter quantity and quality, and uptake by plants and soil microbes, though it is acknowledged that there are other inputs such as cattle/wildlife excrement etc. This study did not directly test the mechanisms responsible for soil nutrient flux or availability, however, it is plausible that some of the observed changes in vegetation could be correlated with changes in nutrient levels, though this is purely speculative.
A 25% cover reduction in litter at this site from 2021 (74% cover) to 2022 (49% cover) was observed, which did not differ between sprayed and non-sprayed treatments. Litter can be lost in these systems due to decomposition or physical removal (e.g., wind), though these mechanisms are not mutually exclusive. If decreased litter was the result of increased decomposition, then an increase in overall soil available nutrients in 2022 compared to 2021 should have been observed, it was not. Conversely, if litter loss was due to physical removal, it could result in lower observed soil nutrient availability in 2022, as observed. Increases in both cheatgrass (+36% cover) and overall vegetation cover (+61% cover, including cheatgrass), could represent an increase in uptake by plants and their respective soil microbial communities. Interestingly, litter and vegetation cover did not differ between sprayed and non-sprayed treatments, and therefore can only help to elucidate yearly nutrient flux, not the differences in nutrient availability between the herbicide treatments. In this regard, our greenhouse study and plant community analysis provide potential insights. As discussed above, nitrate and phosphorous levels were different when cheatgrass and bluebunch wheatgrass were grown together vs. alone, indicating that nutrient availability is affected even in simple two species interactions. Further, ~1 more species was observed on average in the non-sprayed vs. sprayed treatment and ~3 more species in 2022 than 2021 were observed at this specific site. Shannon’s diversity index followed the same pattern, having greater diversity in the non-sprayed vs. sprayed treatment and more diversity in 2022 than in 2021. This pattern is consistent with the species richness and diversity trends for the entire study. Unlike, the other sites, the plant community evenness did not differ by year or treatment, i.e. the relative abundance of species remained the same as richness changed. An increase in species richness and diversity from 2021 to 2022, decreased litter, and increased vegetative cover could explain the decrease in available nutrients from 2021 to 2022. Similarly, the increased nutrient availability in the sprayed vs. non-sprayed treatment may also be attributable to the difference in species richness and diversity observed but a definitive mechanism is not clear.
Seasonal and yearly nutrient fluctuation is common and can be attributed to environmental and biological variation (e.g., soil moisture, temperature, microbial activity, plant growth) and was observed for 10 of the 15 nutrients tested. However, the overall increased nutrient availability in sprayed plots compared to the non-sprayed plots in the non-grazed treatment are likely directly linked to plant community composition as a response to herbicide. Irrespective, of the mechanism, it appears that the herbicide (imazapic) application resulted in a flush of nutrients for six of the 15 nutrients in the sprayed plots.
Research outcomes
Non-native plant management typically begins with control of the target species and is followed by restoration seeding. This study aimed to determine how well herbicide would control cheatgrass at water tanks that receive periodic high use by cattle, and subsequently how well ruderal and native seed mixes that were tested in a greenhouse study for their competitive ability to suppress cheatgrass and uptake nutrients, would perform in a field setting. Disturbance caused by cattle at these water tanks resulted in less cheatgrass abundance and removed any differences that may have been seen due to a single fall herbicide application. Comparatively, non-grazed treatments received the most benefit from herbicide application, i.e., sprayed plots had less cheatgrass abundance than non-sprayed plots. I hypothesized that, reduced competition resulting from the herbicide treatment would increase seed mix establishment following herbicide treatment, but this was not the case. Lack of establishment was likely due to abiotic conditions such as drought. The greenhouse competition studies provided informative results, that suggest triticale should be considered as a restoration species to compete with cheatgrass in the future. Along with its competitive ability to suppress cheatgrass biomass in the greenhouse, triticale is mostly sterile, highly productive, and an annual, making it a direct competitor for soil nutrients.
Nutrient availability proved to be a dynamic component of this project, especially the greater amounts of nutrients found in the sprayed vs. non-sprayed plots for some of the nutrients, and the overall decrease in availability of nutrients from 2021 to 2022. While we could not attribute these differences in uptake to our seed mixes, we can attribute some of these differences to herbicide application and vegetative growth. Herbicide effects are often relegated to target/non-target plant removal, but this study shows herbicide application can alter nutrient availability. In this instance, differences in plant community composition resulting from herbicide application could explain soil nutrient differences observed. Regardless of mechanism, the interaction of herbicide application and nutrient availability is an important consideration for land managers, producers, and restoration practitioners.
From a restoration standpoint, if these water tanks were to be moved or retired from use, based on the results of this study, it would be recommended that herbicide (imazapic) should be used to control cheatgrass initially, and that some benefit will result from a single application but based on other findings, at least two years of fall herbicide application would provide better control. Following herbicide application, a seeding campaign to restore productivity and increase resistance to non-native plant invasion and expansion is prudent.
Education and Outreach
Participation summary:
Gave an on-site presentation about non-native plant ecology and restoration practices/research in the Centennial Valley, to a Montana State University Yellowstone Ecology class (15 participants) in conjunction with United States Fish and Wildlife Service biologist Dr. Kyle Cutting. We discussed the implications of non-native plant control, the goals of restoration, and the balance between active management, science, and ranching (Summer 2021).
Shared results and progress from this study during a Park County Non-native Plant Extension meeting with Drs. Jane Mangold and Lisa Rew (Winter 2021).
Shared the results and progress of this study as part of a Centennial Valley Research Field Day Tour to 70 participants ranging from stakeholders, grant participants, federal employees, and interested citizens (Summer 2022).
Presented research and results of this study with two Montana State University classes on-site in the summer of 2022 (July 10th, 2022).