Final report for GW20-205
Project Information
As the state of Montana has grown to become the largest pulse crop producing state in the US, it is crucial to refine practices and management strategies that improve grain yield while maintaining or improving grain quality such as protein. While soil fertility and water management practices have been evaluated for field pea and other pulse crops to maximize grain yield, those practices do not always result in increasing protein content. Discovering the intra-field variables that control how and to what extent protein is formed in the grain is important to Montana pea producers as the plant-based protein market continues to grow, along with the possibility for price premiums for high protein pea. To untangle the many variables such as management, environment, and climate, producers in key pulse growing regions have been identified to establish intra-field experiments in order to determine what specific factors control both yield and protein in pea. Within a field, specific zones will be identified based on soil texture, topography, and NDVI measurements. Within each zone, spatially paired soil and whole plant sampling will be conducted to determine the relationship of different soil parameters to grain yield and protein. The outcomes and results of this study will allow producers to predict grain yield and protein based on current or expected field conditions and will give insight into the factors that determine variability and formation of protein and grain yield in pea.
Soil and Agronomic Objectives
- To investigate if and how much topography (slope and aspect), soil texture, and varying soil nutrient levels influence pea yield and protein variability within a field unit at the three locations in this study.
- To measure how varying soil fertility programs (specifically different historical N management programs), soil texture, and other environmental factors influence grain yield and protein content of pea at one location in this study.
Educational Objectives
- Inform producers of the field-scale conditions and/or variables to adjust and manage to not only maximize grain yield, but also maintain or improve pea grain protein content.
- Provide producers and other members of the agronomic sector information on what field-scale variables influence pea grain protein through scientific publications, extension publications, social media, public presentations, and producer-friendly factsheets.
The results of this study will assist in providing both the research community and producers a platform with which to study the intra-field factors that govern field yield variability and protein, as well as plant-scale protein formation characteristics and trends. This base knowledge will be valuable to researchers and producers by identifying specific factors that a cropping system should manage for to improve grain quality while maintaining grain yield.
Research Timeline:
April 2020: Establish individual study locations in collaboration with the producer cooperators. Following field pea emergence across the field selected at each location, soil samples will be taken to determine soil texture variability across each of the three field sectors (bottom, sidehill, hilltop) and within the nitrogen treatments (Mr. Merja location). Soil samples will be GPS-referenced for whole plant sampling prior to harvest.
June-July 2020: NDVI readings will be taken across each location to determine if there is a relationship between plant greenness, field variability, grain yield, and grain protein content.
July-August 2020: Prior to field harvest of the pea crop by the producer for spatial grain yield data, whole plant samples will be taken at the same location within each plot as the soil samples, using the GPS reference. These whole plant samples will be used to determine if pea protein varies within a plant, between treatment groups, and to determine harvest index.
September-October 2020: Lab analysis of protein and harvest index will be completed for all locations and treatment groups in the research project. After lab analysis of all samples has been completed, this initial one-year study will be complete.
Cooperators
- (Researcher)
- - Producer
- - Producer
- - Producer
Research
At the start of the 2020 growing season, the three farmers across Montana involved with this project assisted us in identifying a suitable spring or winter pea field that would allow us to examine field zone differences (e.g., slope aspect, elevation, irrigation vs. dryland, and historical nitrogen management) and variability between the field and plant scale in reference to grain protein variance. In mid-June of 2020, Dr. Perry Miller and Samuel Koeshall (Ph.D. student) scouted each field site to determine an approximate sampling scheme and understand any unique field characteristics that might confound plant sampling before farmer-cooperator field harvest. Two field sites were located near Sun River, one field site was located ~ 20 miles east of Conrad, and the final field site was located near Amsterdam. Google Earth Pro was used to identify and construct a pseudo-replication sampling plan and identify the individual field zones of interest. About 5-7 days before farmer cooperator harvest of the respective pea fields (early August), in-field sampling of the select field zones was conducted. A 1-meter x 2-row whole plant biomass sample cut at the soil surface was taken at each identified sampling location with a field zone. Before the whole sample was bagged, 20 randomly sampled pods (10 top and 10 bottom pods) from the sampling area were pulled from individual plants to give the researchers the ability to compare how pod location within a plant influences grain protein and how field vs. plant-scale observed protein varies. All samples were brought back to the MSU-Bozeman Cropping Systems Lab and oven-dried at 50 degrees C for at least 72hrs. to measure dry matter. Whole plant samples were weighed for whole plant biomass and subsequently threshed for grain yield. Top and bottom pod samples were hand-shelled and weighed for grain weight. The grain from the whole plant samples and pod samples was subsampled and finely ground via a Udy mill before being prepared for CNS analysis to obtain nitrogen content and estimated protein content, which is estimated by taking the N% times a conversion factor of 6.25. All data analyses were completed in R 4.0.2 using a mixed model approach to account for pseudo-replication and significant mean differences were separated using Tukey HSD with a cutoff of alpha = 0.10. Field vs plant-scale protein variability was tested using a Modified signed-likelihood ratio test (SLRT) for equality of CVs’. Overall linear regression relationships were plotted and a Pearson Correlation test was used to evaluate relationship strengths. Observed precipitation (mm) and mean air temperature (C) along with the 30-year means for precipitation and temperature are shown in Figures 1-3 for each field site, starting in September 2019 and ending in August 2020 to align with the harvest of the previous year's crop or seeding of winter pea at Chester, MT.
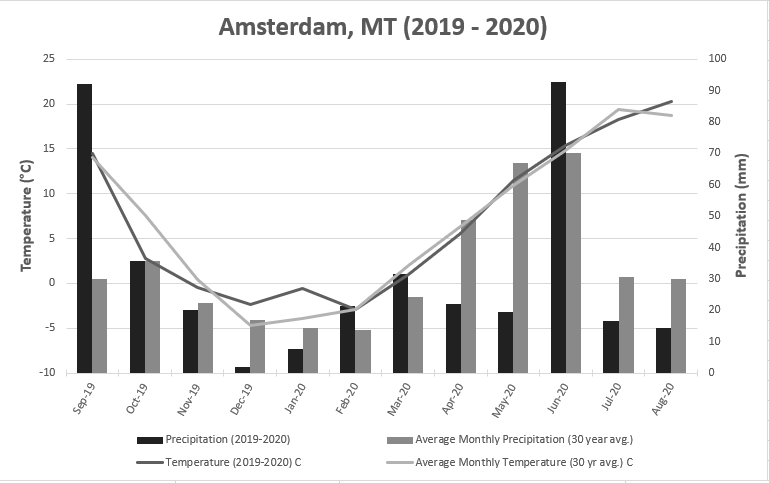
Figure 1. Observed mean air temperature and monthly precipitation with 30-year mean air temperature and precipitation at Amsterdam, MT for September 2019 to August 2020.
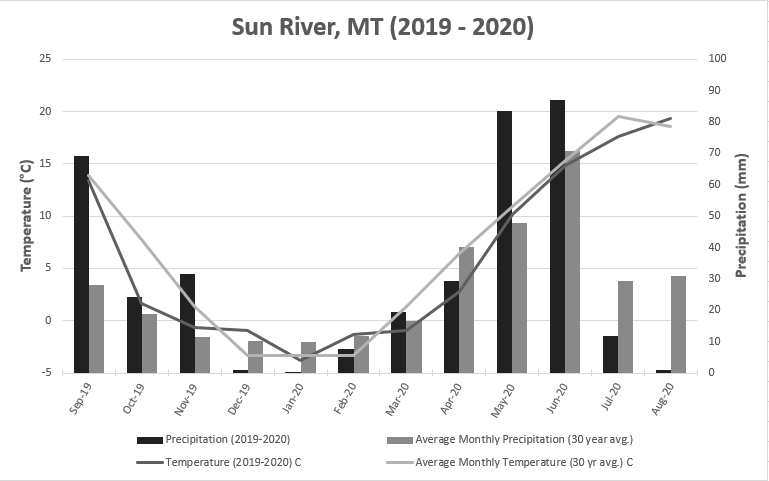
Figure 2. Observed mean air temperature and monthly precipitation with 30-year mean air temperature and precipitation at Sun River, MT for September 2019 to August 2020.
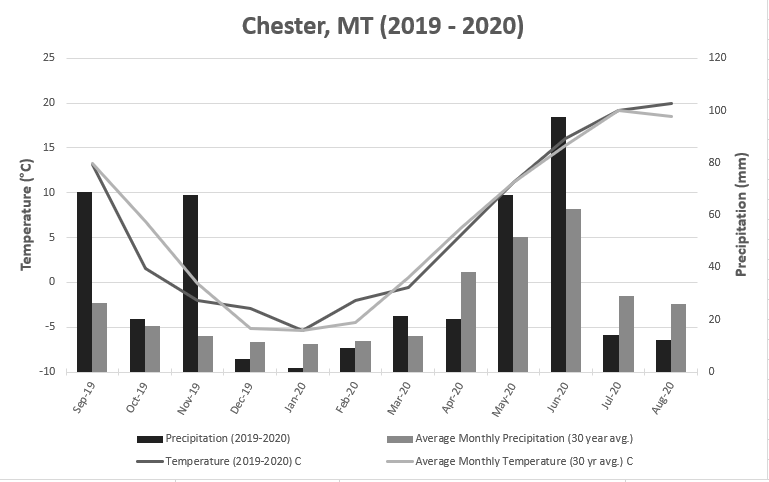
Figure 3. Observed mean air temperature and monthly precipitation with 30-year mean air temperature and precipitation at Chester, MT for September 2019 to August 2020.
In most instances across the individual field sites, field zone (topography or N management) and pod location within the plant influenced final grain yield and grain protein (Tables 1-3). At the Sun River dryland site that was managed under a dryland pea program for 2020 that has historically had variable rate N applications applied during previous winter wheat crops, N management did not affect grain yield but did influence observed grain protein (p = 0.0034). Additionally, the pod location within the plant altered observed grain protein (p = 0.037). The field zones that received the highest historical N rates resulted in a grain N% of 3.48%, while the zones that did not receive N resulted in a 3.30% grain N content for the 2020 field pea crop. Additionally, the bottom pods displayed a grain N% of 0.13% points greater than the top pods, most likely as a result of pod formation beginning with the lowermost pods and working up the plant during the reproductive stages.
At the Sun River irrigated field site, topography (bottom vs top of hill slope) influenced both grain yield (p = 0.0004) and grain N% (p = 0.0251) with pod location only affecting grain N% (p = 0.0001) (Table 2). The top hill zone resulted in a grain yield of 921 kg ha-1 more than the bottom hill zone. The top hill zone also had a greater grain N% content of 0.18% points over that of the bottom hill zone. Pod location resulted in a larger within-plant grain N% difference than that of the Sun River dryland site as the bottom pods had a 0.33% grain N% content greater than the top pods from the same field.
At the Chester site, which was our single Austrian winter pea field, all explanatory variables influenced grain yield and grain N% content, with a significant interaction between slope aspect and pod location for grain N% content (p = 0.0984) (Tables 3 - 5). Our observations and yield data indicate that a North facing field zone yielded the most grain, followed by a zone with no slope (Flat) (Tables 3 - 4). Additionally, the North facing field zone reduced the top vs. bottom pod grain N% difference previously seen at the Sun River field sites as there was only a 0.02%-point difference between the top and bottom pods sampled in the North facing slope zone (Table 5). Although the results from this field site are intriguing, we believe some of our results are confounded with a possible nodulation failure as many of the plants that were sampled during our in-person scouting trip did not have any viable N-fixing root nodules. However, due to extreme heat experienced during vegetative stages of pea across Montana, early abortion of nodules might just have been unavoidable during the 2020 growing season, regardless of the best management practices followed.
In terms of grain yield vs. protein relationships across our field sites of interest, we observed that there is not a consistent relationship among MT growing regions, although varying management (dryland vs. irrigated) resulted in little to no relationship change (Figure 4). Taking into account the three field sites that grew yellow spring pea, historically lower yield potential growing regions in MT (such as Sun River sites in this study) may have a future advantage over higher precipitation regions due to a positive yield vs. protein relationship that shows there is the possibility to grow a high yielding pea that simultaneously yields a relatively high grain protein content (Figure 4), especially if pea buyers continue to implement premiums for delivery of high protein peas.
Finally, we found that out of the three yellow pea field sites the Sun River irrigated field site had a protein variability difference between the field and plant-scale samples (p = 0.0943) (Figure 5). This tells us that management practices such as increased seeding rates should be evaluated to reduce plant height and in turn, reduce the number of pods per plant to reduce observed protein differences between top and bottom pods. By reducing the within-plant protein variability, the observed field-scale variability is reduced, leading to more consistent deliveries of pea grain to a buyer or fractionation facility that results in the producer receiving a protein premium, in some cases up to USD $1.00 over market price, or at the very least, avoiding rejection due to low protein pea grain.
Tables and Figures
Table 1. ANOVA and Least Square Means with Tukey HSD letter differences for Sun River dryland field site from 2020 sampling.
|
Source of Variation (S.V) |
Grain Yield |
Grain N |
|
kg/ha |
% |
|
|
N management |
0.43 |
0.0034 |
|
Pod location |
- |
0.037 |
|
Interaction (N*P) |
- |
0.54 |
|
N management |
||
|
High |
4749 |
3.48 a |
|
Zero |
4583 |
3.30 b |
|
Pod Location |
||
|
Top |
- |
3.32 b |
|
Bottom |
- |
3.45 a |
|
*CLD letters denote a significant difference at alpha = 0.10 via Tukeys HSD. |
||
Table 2. ANOVA and Least Square Means with Tukey HSD letter differences for Sun River irrigated field site from 2020 sampling.
|
Source of Variation (S.V) |
Grain Yield |
Grain N |
|
kg/ha |
% |
|
|
Topography |
0.0004 |
0.0251 |
|
Pod location |
- |
0.0001 |
|
Topography |
||
|
Top Hill |
4600 a |
3.36 a |
|
Bottom Hill |
3679 b |
3.18 a |
|
Pod Location |
||
|
Top |
- |
3.11 b |
|
Bottom |
- |
3.44 a |
|
*CLD letters denote a significant difference at alpha = 0.10 via Tukeys HSD. |
||
Table 3. ANOVA results for Chester Austrian winter pea site from 2020 sampling.
|
Source of Variation (S.V) |
Grain Yield |
Grain N |
|
kg/ha |
% |
|
|
Slope Direction |
0.0251 |
0.0677 |
|
Pod location |
- |
0.0004 |
|
Interaction |
- |
0.0984 |
*CLD letters denote a significant difference at alpha = 0.10 via Tukeys HSD.
Table 4. Least Square Means and Tukey HSD letter differences from Chester Austrian winter pea site from 2020 sampling for grain yield.
|
Zone |
Grain Yield |
|
kg/ha |
|
|
overall p-value |
0.0251 |
|
North |
1410 a |
|
Flat |
1251 ab |
|
South |
994 b |
*CLD letters denote a significant difference at alpha = 0.10 via Tukeys HSD.
Table 5. Least Square Means and Tukey HSD letter differences from Chester Austrian winter pea site from 2020 sampling for grain N% content.
|
Slope x Pod Location |
Grain N |
|
% |
|
|
overall p-value |
0.0984 |
|
Flat - bottom |
2.23 c |
|
North - bottom |
2.52 ab |
|
South - bottom |
2.43 ac |
|
Flat - top |
2.39 ab |
|
North - top |
2.54 ab |
|
South - top |
2.58 b |
*CLD letters denote a significant difference at alpha = 0.10 via Tukeys HSD.
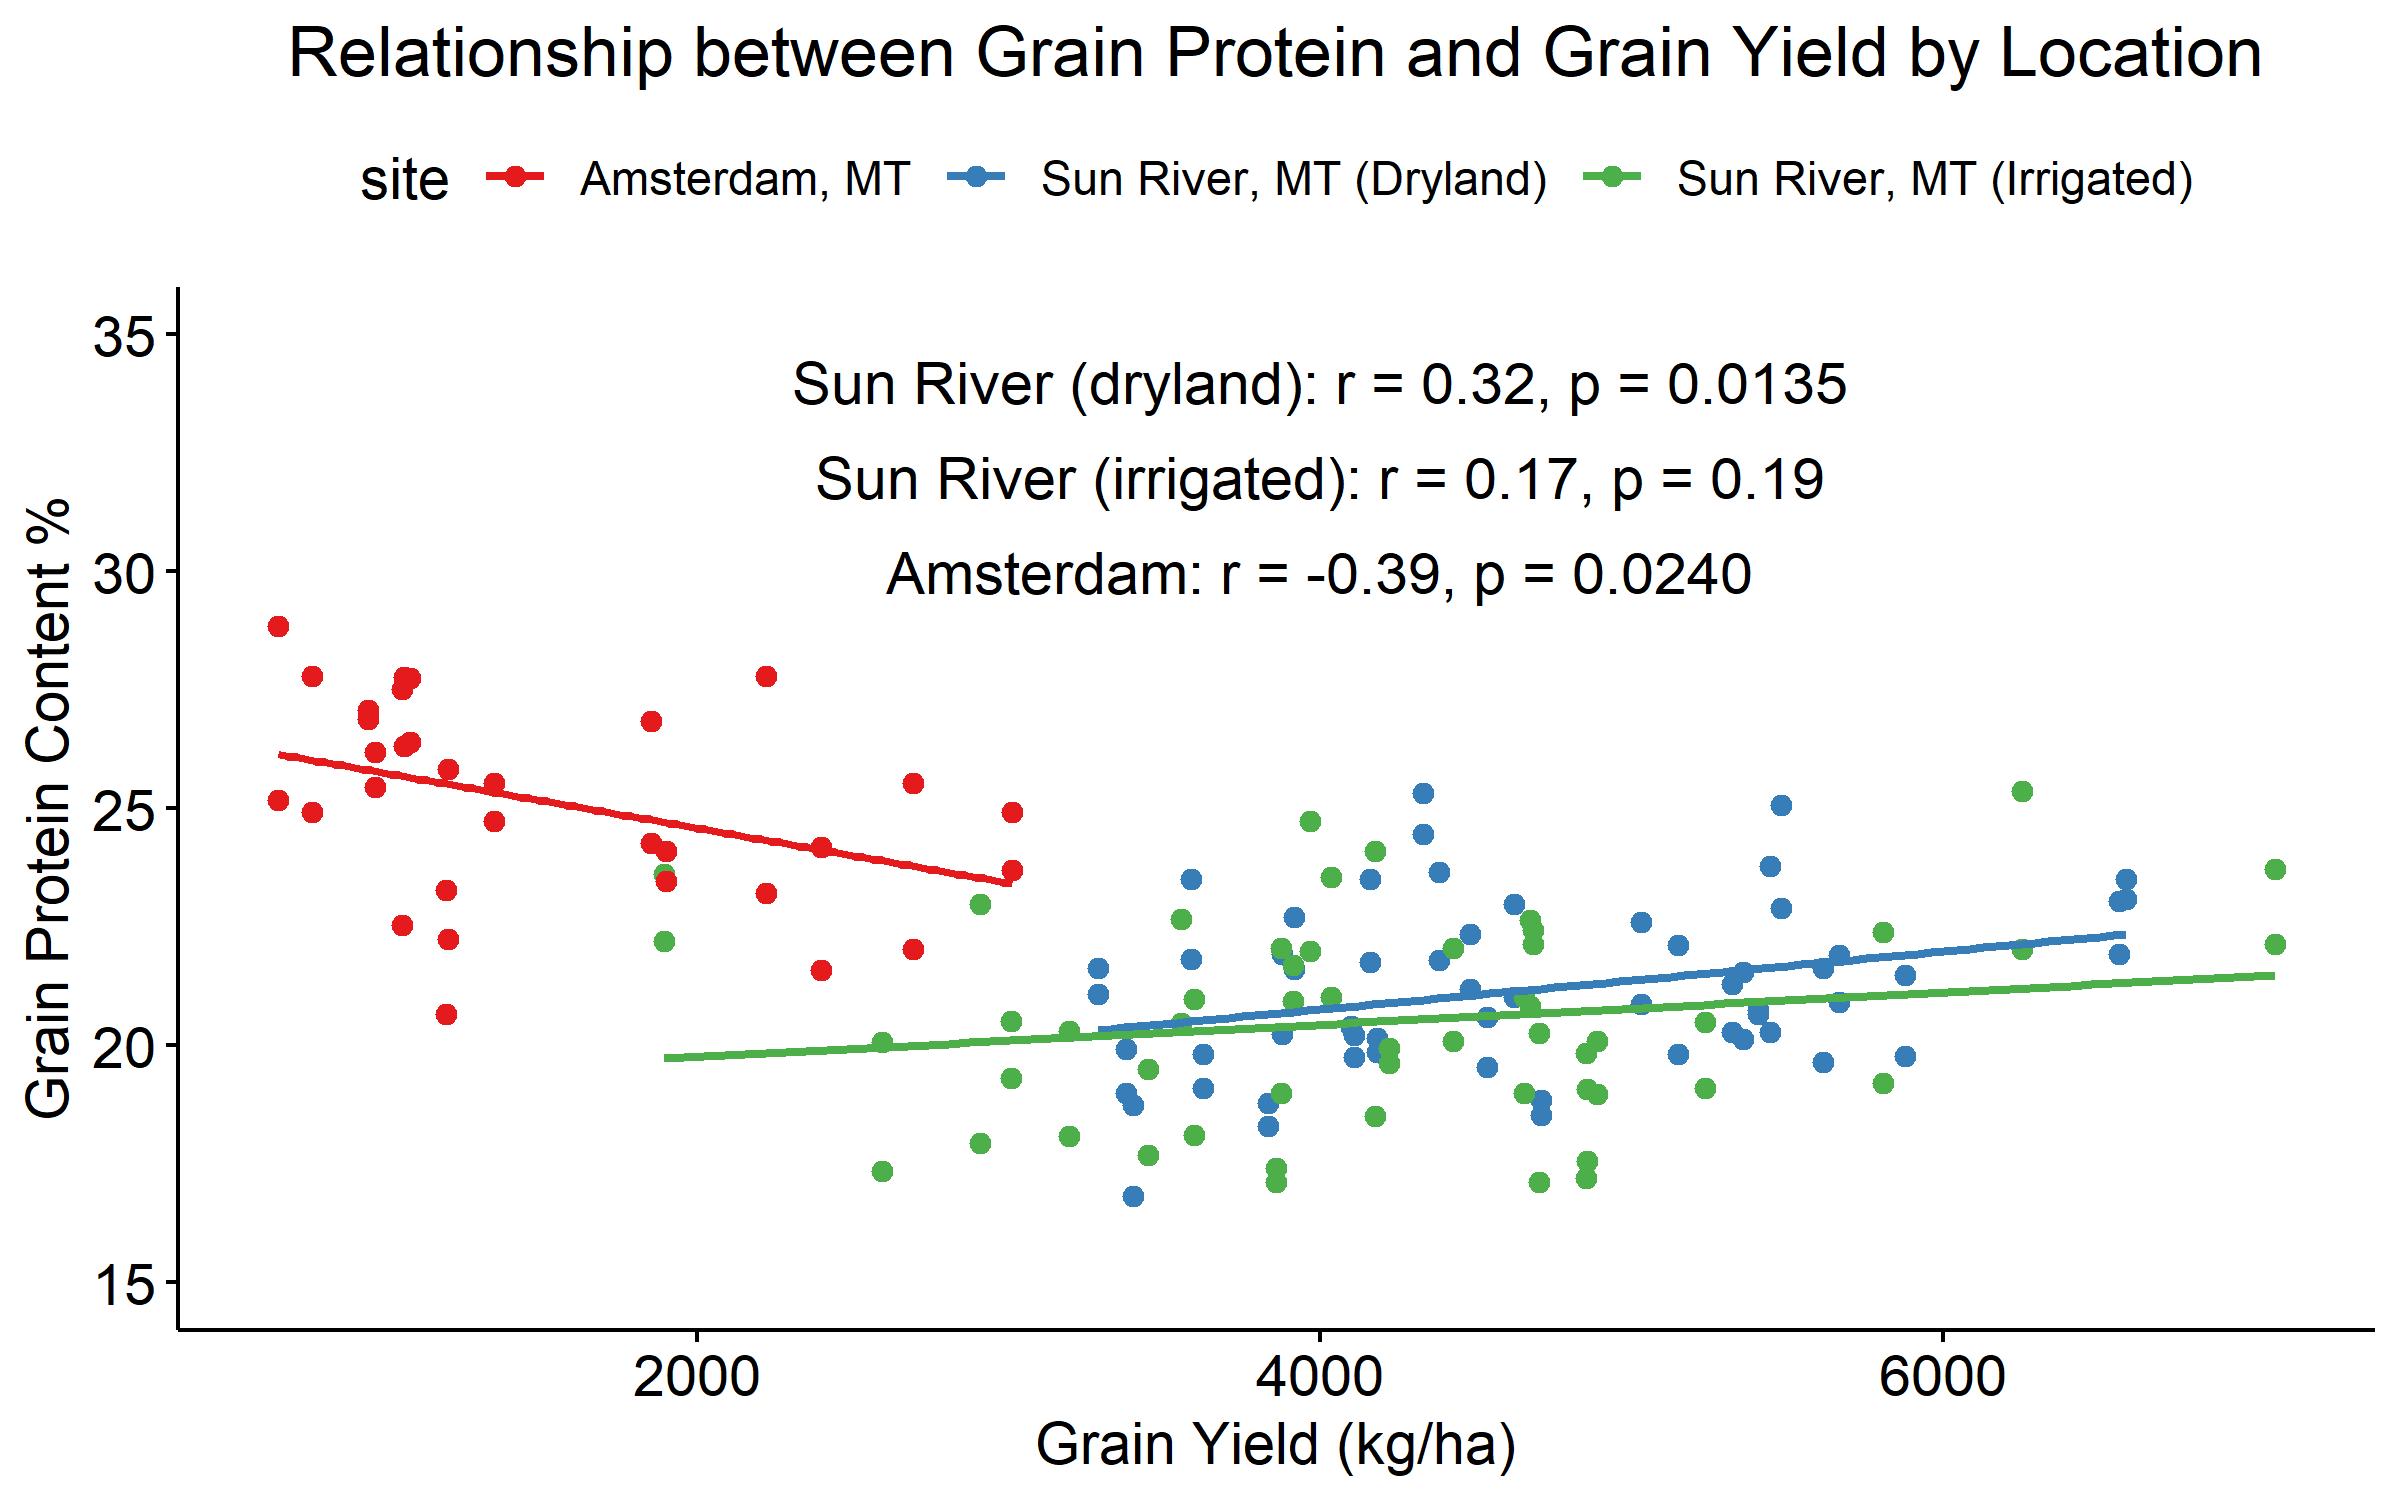
Figure 4. Overall grain yield vs. grain protein relationships across three 2020 MT field sites with Pearson’s Correlation results and significance.
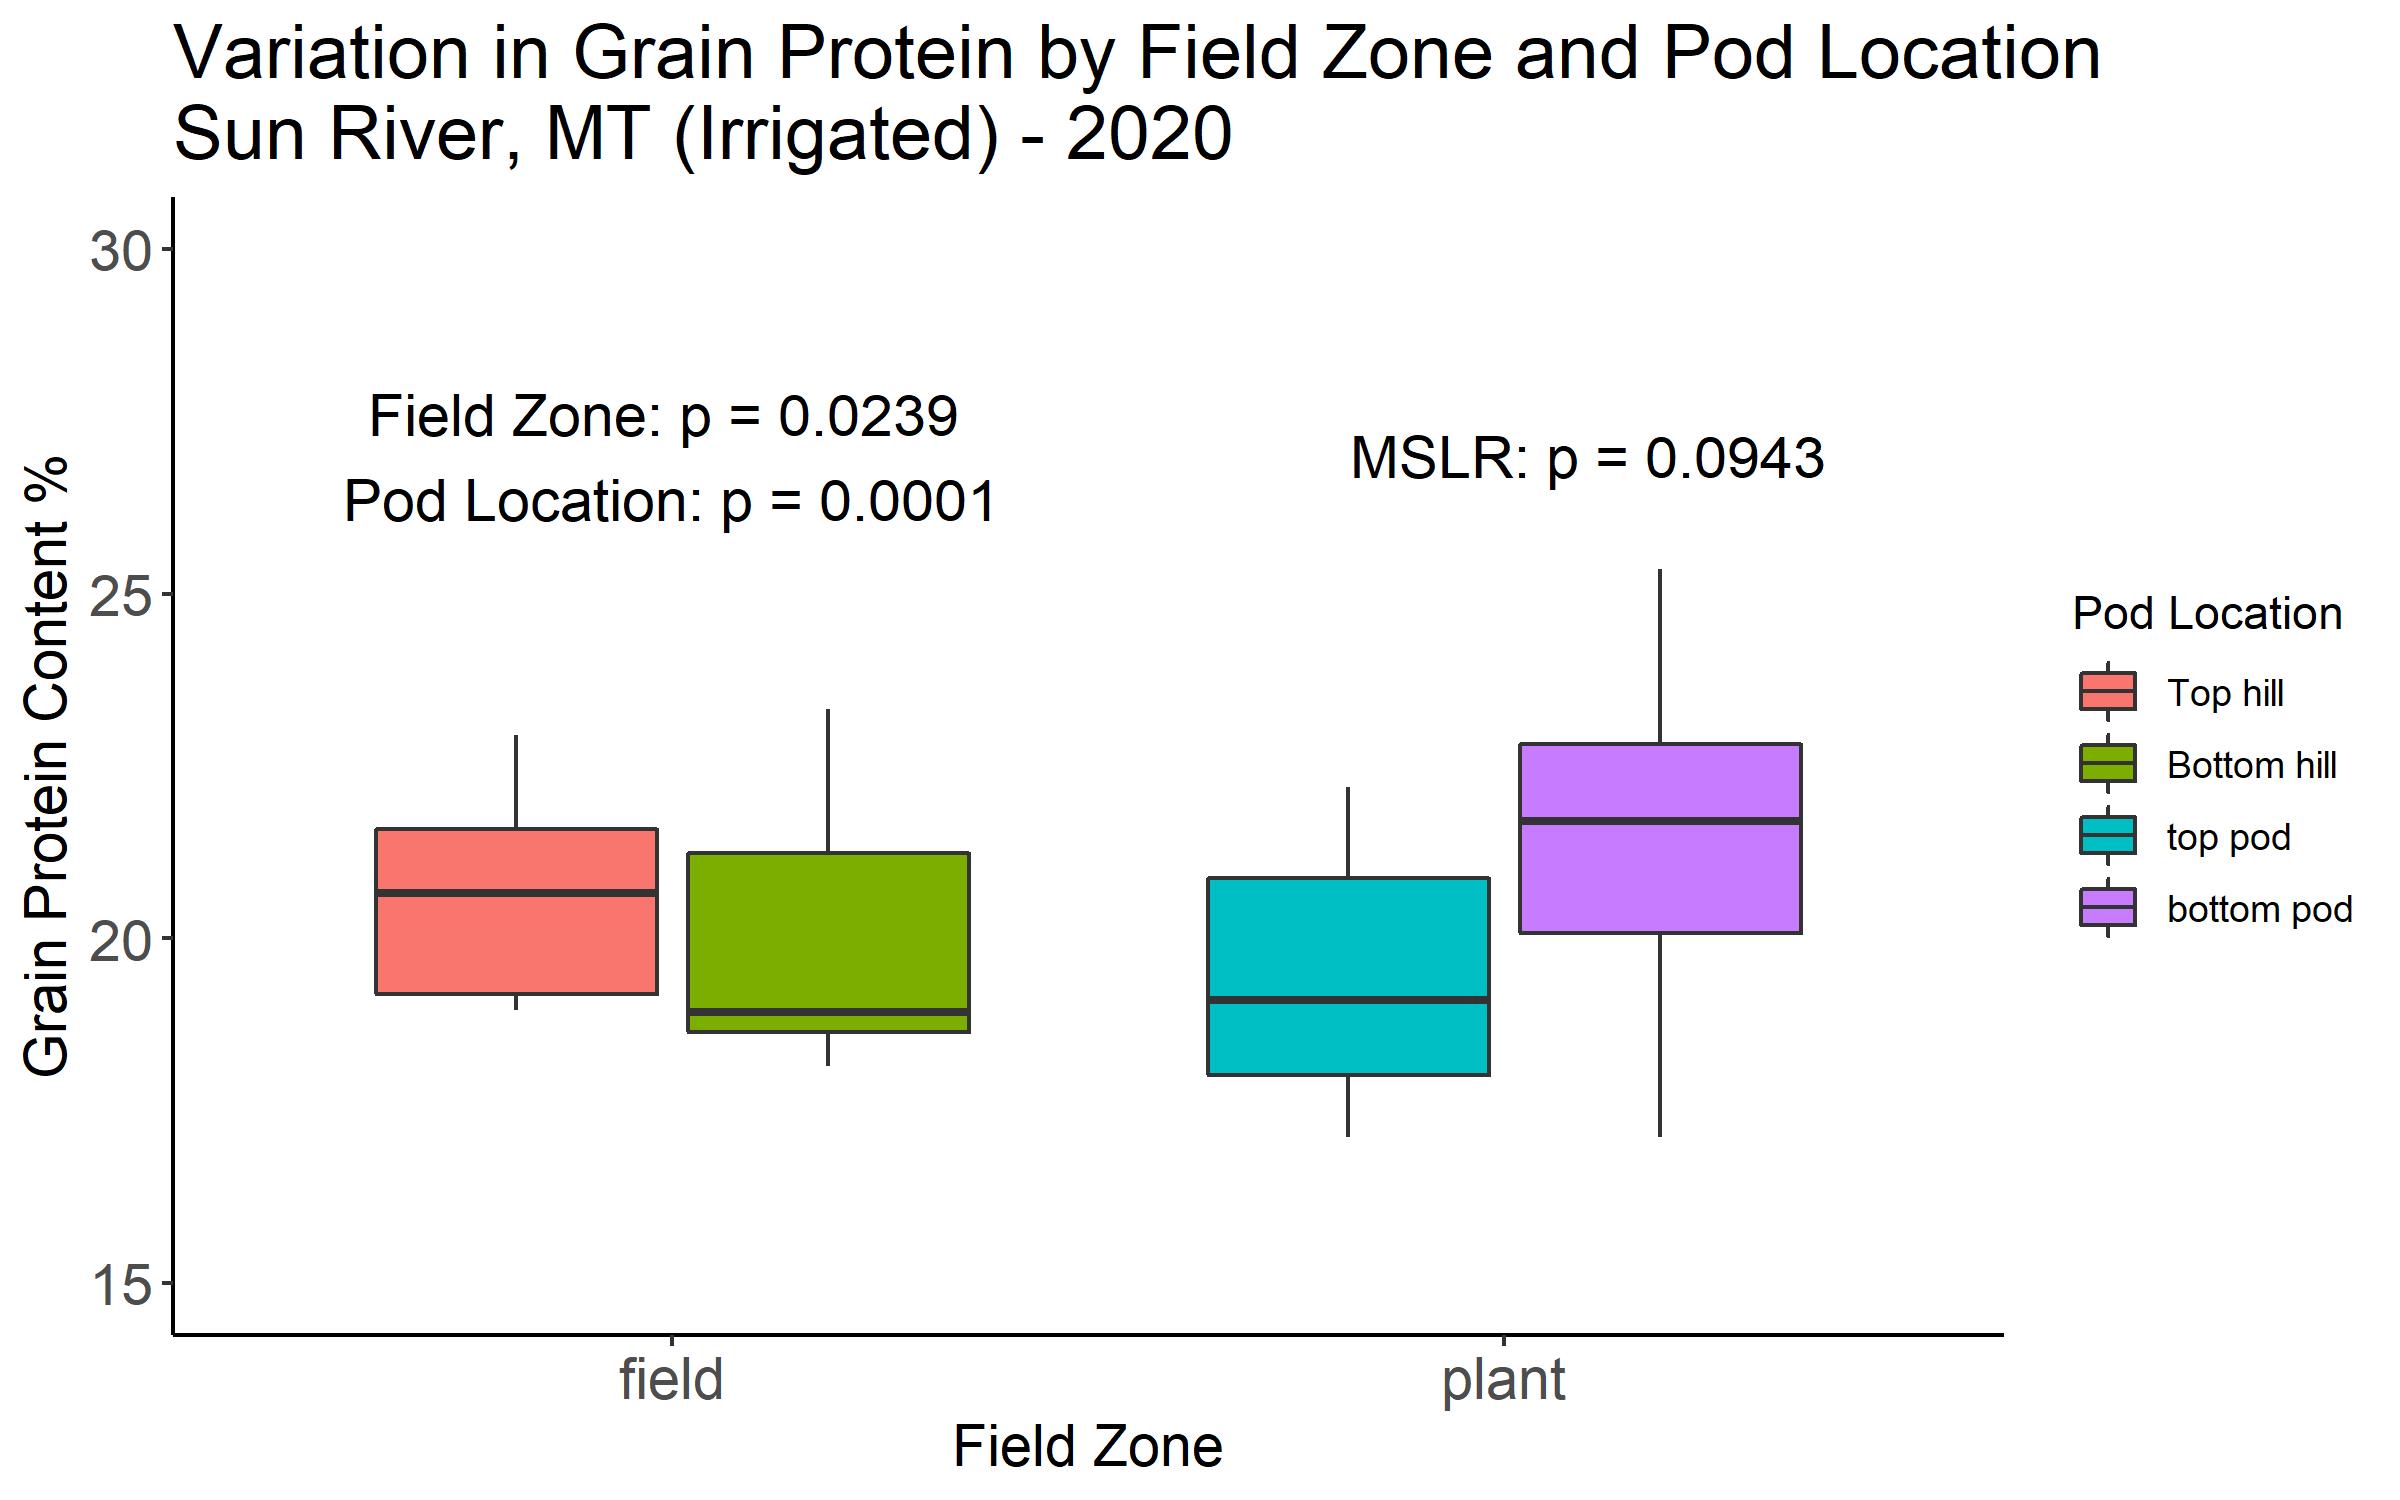
Figure 5. Comparison of grain protein content variability between the field and plant scale for the field zone of interest (top vs. the bottom of hill slope) and pod location within a plant.
Research outcomes
Education and Outreach
Participation summary:
The ability to carry out any outreach regarding communication of results and recommendations has been severely limited due to the cancellation of extension meetings, academic meetings, and farmer field days. We will be aiming to disseminate this information as able in the future.