Final report for GW21-220
Project Information
Hemp production in the U.S. has seen inconsistent performance due to genetic and environmental interactions that influence crop chemistry. This research will evaluate how the phytochemistry of common hemp varieties changes when grown in different New Mexico environments and with different cultural practices. The goal of this research is to help NM farmers better anticipate the results from their hemp crops. By establishing continued two-way communication with local producers, this work can be best tailored to represent the real-world interests of the NM hemp industry. The primary cultural practice of interest is irrigation method. Irrigation infrastructure exists across NM in several forms, some of which may contribute to under-performing hemp production. Changes in hemp biomass chemistry impact downstream product potential. Production environment and practices will be correlated to biomass yields of stalks, seeds, and flowers, and CBD content of floral material. Small-scale extraction with supercritical carbon dioxide will be used to compare extracts from test crops with those found in retail hemp markets. Project results will be disseminated among registered hemp producers and processors through the New Mexico Department of Agriculture (NMDA) and New Mexico Environment Department (NMED); to the NM agricultural community and general public through regional meetings, field day demonstrations, and NMSU Extension publications; and to the wider scientific community and hemp industry stakeholders through open-access digital content including peer-reviewed journal articles and demonstration videos. Lessons learned and relationships developed during this project will serve as the foundation for future hemp research at NMSU.
The first research objective is to evaluate how the phytochemistry of common hemp varieties differs from their expected profiles when grown at multiple sites throughout New Mexico. Factors to be considered are environmental conditions at each location and production practices.
The second research objective is to determine how differences in phytochemical profiles correlate to the quality of hemp extracts for cannabinoids. This information will be used to identify inputs that result in high-quality products for downstream manufacturing. This will aid in developing tools for NM producers to consult in order to produce a crop that will result in the highest quality end product.
The first educational objective is to establish recommendations for hemp producers as they decide which varieties to grow and which cultural practices to implement. These recommendations will be shared as digital content, such as production management videos and extension fact sheet publications, as well as presentations and interactions at in-person events such as field days.
The second educational objective is to aid in the development of courses for a hemp production certificate program at New Mexico State University (NMSU). As the state’s land-grant institution, NMSU is best positioned to aid in statewide agricultural efforts. With the increased interest in hemp production across NM, it is vital that NMSU act as an agricultural leader to guide the establishment of this new industry within NM agricultural sectors.
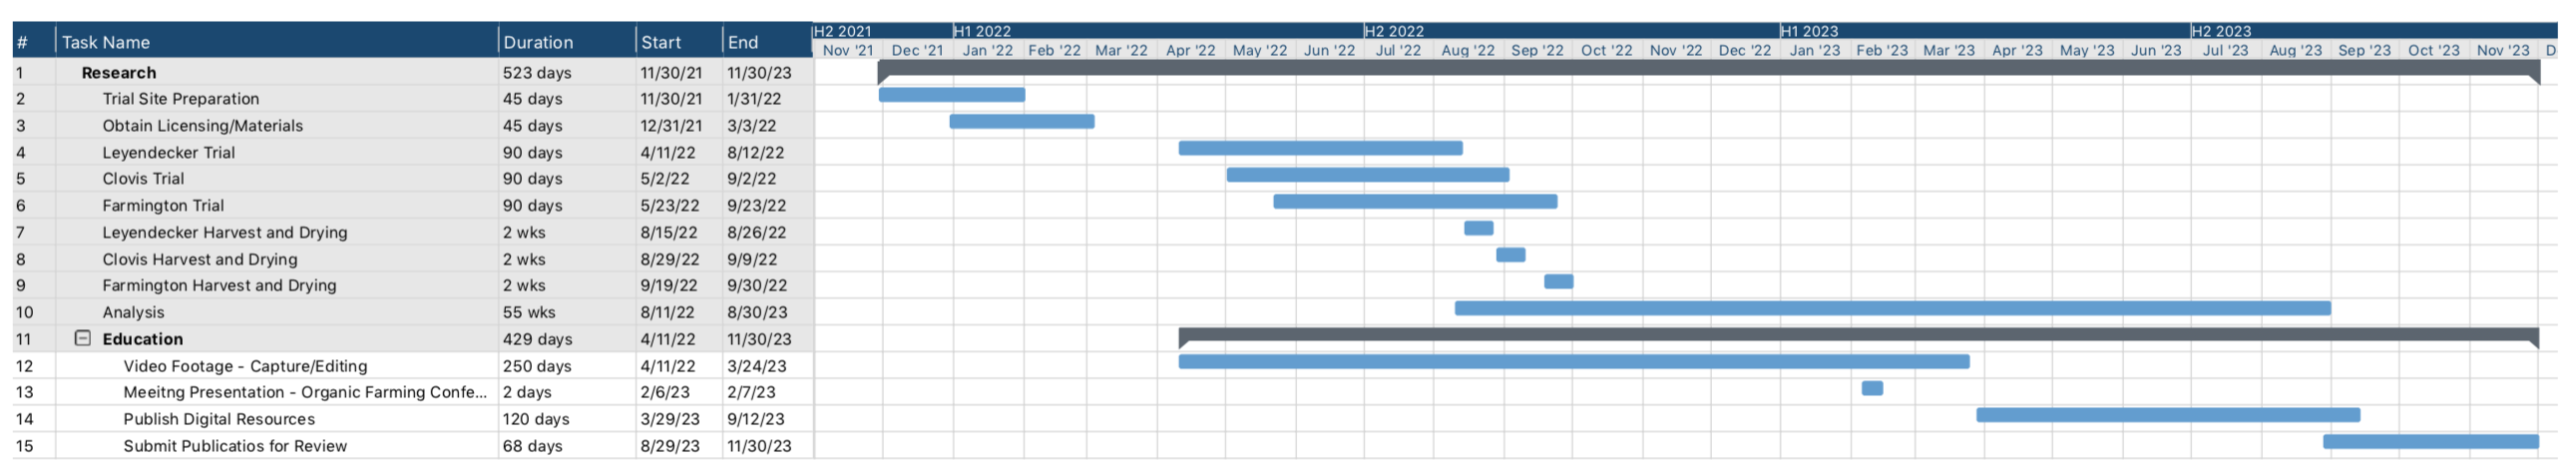
The project will begin December 1, 2021 with preparations for the 2022 production season through the following March: obtaining appropriate licensing, procuring hemp genetic material and COAs, and preparing soils at production sites. Planting will start in the month of March 2022 with the timing dependent on temperatures at each location. Cultivation will take place through October 2022, at the latest, depending on the harvest times required for legal compliance. After harvest and drying near the production site, biomass materials (~500 g per variety per treatment per location) will be packaged in opaque vacuum-sealed bags and transported to the NMSU main campus in Las Cruces, NM for analysis. Information dissemination will begin during cultivation, with results being provided as they become available after initial evaluation. The remaining biomass will be used to conduct small-scale the carbon dioxide SFE for cannabinoids to evaluate extract quality. Completion of all analyses is expected before September 2023, with continued result dissemination to stakeholders through December 2023. The Gantt Chart (Figure 2) provides approximate time frames for completing the tasks over the funding period.
Cooperators
- (Educator and Researcher)
- - Technical Advisor - Producer
- (Educator and Researcher)
Research
There were two main objectives to this research: 1) evaluate how the phytochemistry of common hemp varieties differs from their expected profiles when grown at multiple sites throughout New Mexico as influenced by environmental conditions and production practices; and 2) determine how phytochemical profiles in resulting hemp crops impact choices for post-harvest processing to ensure a profitable feedstock is maintained for downstream product manufacturing.
Licensing was obtained from the New Mexico Department of Agriculture (NMDA) per the hemp plan approved by the United States Department of Agriculture (USDA) according to the final rule for Establishing A Domestic Hemp Program (2021). Licenses for each trial site were obtained prior to procuring propagative materials and planting. The production trials were conducted at three NMSU facilities representing the different geographical regions of the state: the Leyendecker Plant Science Center in Las Cruces (south), the Agricultural Science Center at Los Lunas (mid), and the Sustainable Agriculture Science Center at Alcalde (north). Each location operated under annual production licenses between March 18 and November 13, 2022.
Two high-cannabidiol (CBD) varieties, ‘The Wife’ (US) and ‘Sweetened’ (US), were grown at all sites. Two dual-type (grain/fiber) industrial varieties, ‘Orion 33’ (France) and ‘Félina 32’ (France), were grown at all sites. Fiber-type variety ‘Futura 83’ (France) was only grown at the Leyendecker site. CBD varieties were transplanted by hand and spaced 3 feet apart, in six rows of five plants each. The transplant material (seedlings, approximately six weeks old) of high-CBD varieties (‘Sweetened’ and ‘The Wife’) were provided by Rich Global Hemp. The industrial varieties ‘Felina 32,’ ‘Orion 33,’ and ‘Futura 83’ were sourced from KonopiUS. The dual-type varieties were direct seeded at a rate of 40 lb./acre, in alternating rows (3 per plot) of 20 ft in length. A diagram depicting the common plot is provided in Figure 1.
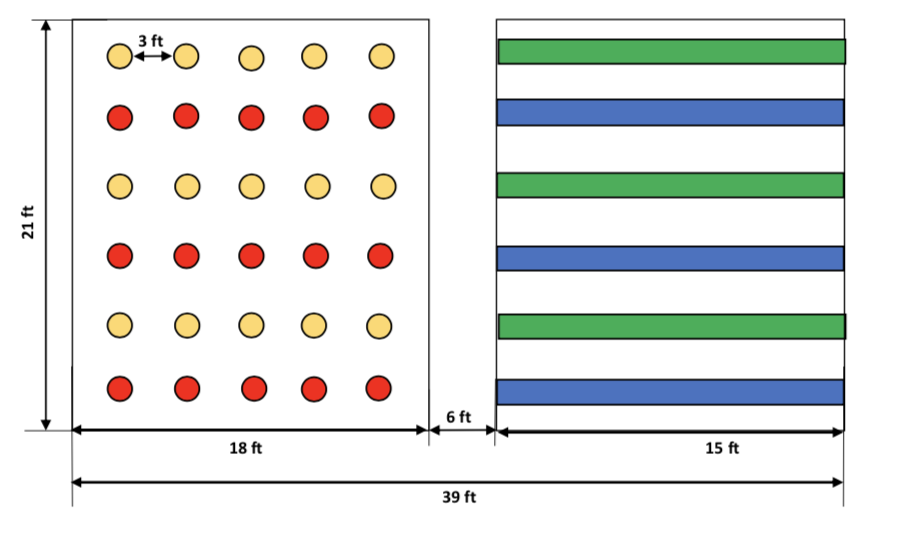
Figure 1. Plot design for trial locations (additional rows were added at Leyendecker for the inclusion of ‘Future 83’)
All sites used irrigation, with fertigation approximately every two weeks, and manual weed control. Duplicate plots were set up at all three locations. The common plot received the same treatment at all locations: sufficient water and use of an all-purpose liquid fertilizer (12-4-8) (Scotts Miracle-Gro Company, Marysville, OH, USA) at manufacturer-recommended rates. At Leyendecker, the second treatment plot investigated water stress by applying irrigation at 50% lower frequency compared to the common plot. At Alcalde, the second plot investigated organic management by using an OMRI-certified organic fertilizer (11-3-8) instead of the Miracle Gro. At Los Lunas, the intended companion planting treatment failed due to miscommunication; seedlings were mistakenly removed during general field maintenance as weeds. Planting dates were targeted for approximately two weeks after the historic last frost dates (McGue et al., 2021; Old Farmer's Almanac, 2023). Seasons were extended as long as possible while avoiding the risks of plants exceeding the legal tetrahydrocannabinol (THC) limit or exposure to the first frost (Table 1).
Table 1. Summary of planting dates and cultural/sustainability treatments applied at each trial location
|
Location |
Planting Date * |
Harvest Date |
| Leyendecker Plant Science Research Center |
April 18 |
September 17 |
|
Agricultural Science Center at Los Lunas |
May 4 |
September 21 |
|
Sustainable Agriculture Science Center at Alcalde |
May 13 |
September 28 |
* Transplanting and direct seeding were performed approximately 2 weeks after the historic last frost dates (± 5 days) at each location (Old Farmer’s Almanac, 2021; Southwest Hemp Extension Council, 2020)
Because clonal propagative material was not available, all CBD-type transplants were grown as seedlings for four weeks by the supplier. Plants were notably stressed and root-bound upon receipt from the supplier. As a result, all transplants at Leyendecker were stressed when planted on April 18. The seedlings for the other sites were transplanted from 1-inch cells to 4-inch pots and kept in an outdoor shade house until their planting dates of May 3 and May 13; these transplants showed improved growth/mortality compared to the initial transplants at Leyendecker.
There were not defined conditions for management of pest, diseases, weeds, or nutrient deficiencies, including pesticide/herbicide applications or micronutrient supplementation. This was to allow for observations of potential issues, such as prevalent weed species, present diseases, or symptoms of nutrient deficiency, in order to provide greater insight for development of realistic recommendations for producers. Although there is a dominant view among CBD-hemp producers that the presence of male hemp plants in a field will dramatically decrease CBD content, this has been disputed by fiber/grain producers. In this study, no male plants of the fiber or grain varieties were removed. This allowed for observation of how the presence of male plants impacts the CBD content of the female floral structures.
Monitoring for legal compliance was conducted periodically throughout the production season. Sampling methods were performed according to the USDA final rule for Establishing A Domestic Hemp Program (2021). The first test was conducted at the initiation of flowering. Once monitoring results indicated plants were nearing their legal limit (total THC was approaching 0.3%), a harvest notice was filed with NMDA. After receiving harvest certificates, materials from the CBD-type varieties were harvested for yield data. The industrial (grain/fiber) types were grown to observe photoperiod response so no yield data was collected.
Upon harvest, plant materials were dried under ambient conditions in a sheltered building until the moisture content of the flowers was approximately 10%. After drying, the major components (stalks/stems vs. flowers/leaves) were separated and the yields recorded for each plant by weight. The average weights of each component per variety per management technique at each location were determined from the plant replicates. Floral material was analyzed for cannabinoid content and essential oil (EO) profiles. American Society of Brewing Chemists (ASBC) methodology was used for characterization of biomass (primarily floral material) due to the limited number of standardized analysis methods for hemp, and because of the similarity between hop and hemp inflorescences from their shared family phylogenetic categorization. Each analysis was performed in triplicate to obtain data for statistical analysis:
- Essential oil extraction by steam distillation (ASBC Hops Method 13, 2008)
- Essential oil characterization by gas chromatography mass spectroscopy (Sexton et al., 2018)
- Cannabinoid extraction with supercritical fluid (CO2) and characterization by gas chromatography mass spectroscopy (Rochfort et al., 2020; Sexton et al., 2018)
Materials used for hemp production and analyses included:
- Hemp seedlings: 90 per variety (180 total)
- Hemp seeds: approx. 1/4 lb. per variety (<1 lb. total per variety)
- Irrigation equipment and supplies
- Fertilizer
- Drying space (climate-controlled space)
- Solvents/analysis gases
- Standards (cannabinoids, essential oils)
- Sample storage containers
Data obtained from the production trials and subsequent analyses included: total yield per plant, flower yield per plant, average cannabinoid content in plants and extracts, and average essential oil profile in plants and extracts. Statistical analysis was performed to identify any significant factors or interactions among the variety x location x treatment combinations. This data allows for comparison of product quality from similar management practices at different geographic locations and from different management practices, enabling recommendations for producers regarding cultivar selection and management practices to yield the highest quality product.
EO and cannabinoid profiles of the extracts obtained from populations under common management conditions were evaluated using gas chromatography mass spectroscopy (GC-MS). A C6-C30 alkane standard (Sigma-Aldrich) was used to aid in identification of EO. A standard mixture of CBD, THC, and cannabinol (CBN) (Restek) was used to aid in identification of major cannabinoids. The instrument (Varian Saturn 2000/2000R, 3800 Gas Chromatograph; Varian, USA) used helium as a carrier gas, a DB-5 column (Sigma-Aldrich), and 1-uL injection volume. Sample concentration and additional instrument conditions varied based on sample type and target analytes (Table 2). Data deconvolution was performed with MS-DIAL (ver. 4.9.221218), using retention indices and the ADAMS library (4th ed.) for metabolite identification with a minimum peak abundance of 40,000.
Table 2. Settings for gas chromatography mass spectroscopy based on hemp extract sample type and target analyte group; SFE, supercritical fluid extraction
|
Conditions |
Sample Type |
||
|
Steam Distillation, Essential Oils |
SFE, |
SFE, |
|
|
Sample Concentration |
10% (v/v) |
75 mg/mL |
25 mg/mL |
|
Split Ratio |
1:20 |
1:20 |
1:30 |
|
Temperature Range (°C) |
60-246 |
60-246 |
60-300 |
|
Ramp Rate (°C/min) |
3 |
3 |
8 |
Statistical analysis was performed using SAS statistical software (SAS Studio ver. 3.81; SAS Institute Inc., Cary, NC, USA). Significance was evaluated at α = 0.05. Yield data was analyzed with analysis of variance (ANOVA) in separate two-factor designs for the standard plots (variety x location) and treatment plots (variety x treatment) at individual locations (Leyendecker and Alcalde). Post-hoc testing for all mean comparisons used the Tukey-Kramer adjustment.
Harvest Inspection Results
NMDA officials took compliance samples prior to harvest. These samples, analyzed by Scepter Labs in Santa Fe, NM, indicated that three varieties exceeded legal THC limits. At the Leyendecker site, variety 'Future 83' tested above the legal limit and was destroyed under NMDA supervision. At Los Lunas, both CBD-types ('The Wife' and 'Sweetened') tested above the legal limit and were destroyed under NMDA supervision. All plants at the Alcalde site passed initial harvest inspection potency analysis where a collective, mixed sample was taken from both plots for the varieties in question. Subsequent testing after post-harvest conditioning and extraction of plants separated by treatment revealed that organically-grown ‘The Wife’ exceeded the THC limit. As such, all herbaceous material and associated extracts were disposed of according to federal and state recommended guidelines. Potency results are summarized in Table 3.
|
Table 3. Harvest Potency Analysis for Hemp Trials |
|||||
|
Variety |
Site |
Total Cannabidiol |
Total Tetrahydrocannabinol (THC) ii (w/w %) |
||
|
Actual iii |
Expected iv |
Actual iii |
Expected iv |
||
|
Sweetened |
Leyendecker |
16.26 |
9-12 |
0.34 |
< 0.3 |
|
Leyendecker (Water-stress) |
9.69 |
0.09 |
|||
|
Los Lunas |
17.00 |
0.62 |
|||
|
Alcalde |
9.18 |
0.32 |
|||
|
Alcalde (Organic) |
6.91 |
0.26 |
|||
|
The Wife |
Leyendecker |
13.32 |
10-14 |
0.27 |
|
|
Leyendecker (Water-stress) |
10.79 |
0.14 |
|||
|
Los Lunas |
15.32 |
0.60 |
|||
|
Alcalde |
8.72 |
0.32 |
|||
|
Alcalde (Organic) |
9.08 |
0.43 |
|||
|
Orion 33 |
Leyendecker |
2.25 |
2-5 |
0.07 |
|
|
Los Lunas |
0.98 |
< LOQ v |
|||
|
Alcalde |
2.22 |
0.04 |
|||
|
Felina 32 |
Leyendecker |
4.92 |
2-3 |
0.2 |
|
|
Los Lunas |
1.19 |
0.04 |
|||
|
Alcalde |
2.26 |
0.04 |
|||
|
Futura 83 |
Leyendecker |
1.93 |
2-3 |
1.92 |
|
i Total Cannabidiol (CBD) = CBD + (CBDA 0.877)
ii Total Tetrahydrocannabinol (THC) = THC + (THCA 0.877)
iii Results from Scepter Labs (n = 1)
iv Expected results based on varietal information from suppliers (Rich Global Hemp, 2023; KonopiUS, 2023; Northeast Heritage, 2023; iHempFarms, 2023; Horizon Hemp Seeds, 2023).
v LOQ: Limit of quantitation
Photoperiod Response of Grain and Fiber Varieties
All industrial (grain/fiber; dual-purpose) varieties were screened for flowering time (photoperiod response) to evaluate their suitability for production at low latitudes. The observed growth cycles were compared to expected growth cycles, highlighting the number of days in the vegetative phase (Figure 2). Expected growth cycles were developed using data reported from databases, producers, and suppliers (HEMP-it, 2023; Horizon Hemp Seeds, 2019; iHempFarms, 2023). The indicator for the shift from vegetative growth to reproduction was not consistently defined by the sources; here, the observation used was the presence of terminal flowering (Carlson et al., 2021) in more than half of the individuals in the plot. Shortened vegetative growth phases were observed in six of seven varieties. For comparison, the figure contains similar data from hemp trials conducted at NMSU the previous year (2021). The total season length for the 2021 plots was notably shorter than expected due to delayed plantings (Figure 2A-C). Although 2022 expected and observed growth cycle diagrams showed similar total season lengths, there was still an observed reduction in length of the vegetative growth stage (Figure 2E-G). This shortened vegetative growth period is considered a main contributor to the smaller plant sizes and decreased fiber/grain yields. At all locations, both varieties exhibited premature reproductive growth and did not reach their full size before ending their vegetative phase. It is unlikely that Orion 33 or Felina 32 will be suitable for production anywhere in New Mexico. At the southernmost location, ‘Future 83’ also exhibited premature reproductive growth.
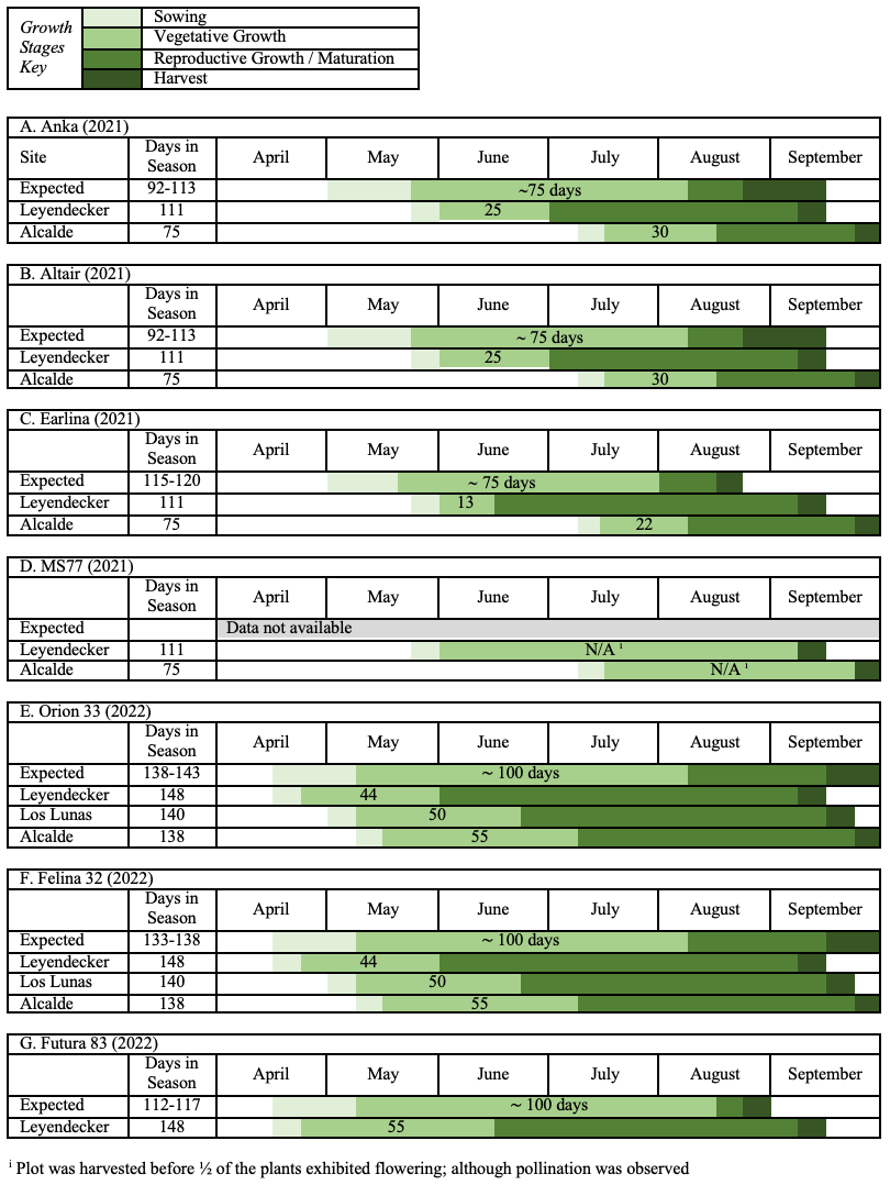
Figure 2. Expected and observed growth stages for grain and fiber varieties of hemp (Cannabis sativa L.) grown in New Mexico
Yield of High-CBD Varieties
Extractable yield of compliant populations accounted for 31-70% of the dry biomass, averaging 126-442 g per plant across location, variety, and treatment (Table 4). A higher extractable yield was obtained with organically-grown ‘The Wife’ from Alcalde, however, this group was determined to exceed the legal THC limit after post-harvest processing. The majority of individual plants had extractable yields below the expected ranges for high-CBD varieties grown outdoors (0.5-1 lb./plant or 227-454 g/plant) (Michigan Department of Agriculture, Plant Protection Division, 2020). Statistical analysis indicated that the variety × location interaction was significant (p = 0.0386), however, post-hoc mean comparisons did not detect differences between any location-variety pairs. Only one sample had both satisfactory yield and satisfactory total CBD content (Table 4, Table 5): ‘Sweetened’ grown under standard management at Leyendecker (308 ± 216 g/plant, 16.26% total CBD).
|
Table 4. Yield of Extractable i Biomass from High-Cannabidiol (CBD) Hemp (Cannabis sativa L.) |
||||
|
Variety |
Location |
Treatment |
n |
Extractable yield per plant, g×plant-1 (avg ± SD ii) |
|
Sweetened |
Leyendecker |
Standard |
8 |
308 ± 216 |
|
Water-stress |
7 |
138 ± 65 |
||
|
Alcalde |
Standard |
9 |
166 ± 141 |
|
|
Organic |
9 |
261 ± 198 |
||
|
The Wife |
Leyendecker |
Standard |
8 |
129 ± 61 |
|
Water-stress |
6 |
126 ± 41 |
||
|
Alcalde |
Standard |
9 |
209 ± 132 |
|
|
Organic |
9 |
543 ± 237 |
||
i Extractable yield is the sum of the floral and leaf material containing any cannabinoids.
ii SD: standard deviation
Steam Distillation Results – Yield and Essential Oil Profiles
The yield of essential oils (Table 5) collected directly from steam distillation was not significantly different for the variety x location model under common management (p = 0.0540). Similarly, the yield was not significant for the variety x treatment model for organic management at Alcalde (p = 0.3919) or for water-stress at Leyendecker (p = 0.0821).
|
Table 4. Steam Distillation Yields |
|||
|
Variety |
Location |
Treatment |
Yield, Oil Collected mL (avg i ± SD ii) |
|
Sweetened |
Leyendecker |
Standard |
1.01 ± 0.20 |
|
Water-stress |
0.72 ± 0.16 |
||
|
Alcalde |
Standard |
1.25 ± 0.23 |
|
|
Organic |
1.21 ± 0.42 |
||
|
The Wife |
Leyendecker |
Standard |
1.26 ± 0.30 |
|
Water-stress |
1.12 ± 0.19 |
||
|
Alcalde |
Standard |
1.75 ± 0.36 |
|
|
Organic |
1.40 ± 0.55 |
||
i n=3
ii SD: standard deviation
Using the specified alignment parameters, 117 unique compounds were detected among steam distillation samples for variety x location populations under common management strategies; 78 of which were identified through library matching. The 50 most abundant compounds, accounting for 86-89% of the total volatile profile, are listed in Table 6 in order of elution. A complete list detailing the identified compounds is provided in the following file: SteamDistillation_GCMS.
Table 6. 50 most abundant compounds detected in steam distillation essential oil profiles of hemp grown under standard conditions
|
Sample |
Growth Location |
Leyendecker |
Alcalde |
||||||||||||
|
Variety |
The Wife |
Sweetened |
The Wife |
Sweetened |
|||||||||||
|
Compound |
% (normalized based on total ion chromatogram) |
||||||||||||||
|
Unknown 1 |
0.74 |
± |
0.22 |
0.14 |
± |
0.10 |
0.70 |
± |
0.49 |
0.49 |
± |
0.30 |
|||
|
α-Pinene |
5.57 |
± |
1.22 |
0.33 |
± |
0.25 |
4.91 |
± |
3.81 |
3.81 |
± |
2.22 |
|||
|
Unknown 2 |
0.92 |
± |
0.36 |
0.03 |
± |
0.02 |
0.93 |
± |
0.78 |
0.78 |
± |
0.39 |
|||
|
α-Fenchene |
4.51 |
± |
2.99 |
0.03 |
± |
0.03 |
4.60 |
± |
4.51 |
4.51 |
± |
1.63 |
|||
|
cis-meta-Mentha-2,8-diene |
3.84 |
± |
1.35 |
0.33 |
± |
0.19 |
3.71 |
± |
2.81 |
2.81 |
± |
1.47 |
|||
|
Unknown 3 |
1.16 |
± |
0.18 |
1.83 |
± |
0.79 |
1.13 |
± |
0.40 |
0.40 |
± |
0.07 |
|||
|
Unknown 4 |
1.31 |
± |
0.22 |
1.43 |
± |
0.21 |
1.30 |
± |
0.46 |
0.46 |
± |
0.08 |
|||
|
Myrcene |
6.40 |
± |
1.67 |
4.42 |
± |
0.89 |
6.30 |
± |
1.96 |
1.96 |
± |
0.94 |
|||
|
meta-11-Mentha-1(7),8-diene |
4.41 |
± |
1.82 |
1.38 |
± |
1.53 |
5.90 |
± |
3.25 |
3.25 |
± |
1.03 |
|||
|
α-Phellandrene |
6.40 |
± |
1.67 |
4.42 |
± |
0.89 |
7.04 |
± |
2.77 |
2.77 |
± |
0.94 |
|||
|
Unknown 6 |
0.54 |
± |
0.36 |
0.11 |
± |
0.14 |
1.17 |
± |
1.08 |
1.08 |
± |
0.15 |
|||
|
Unknown 7 |
4.41 |
± |
1.82 |
1.03 |
± |
1.74 |
5.90 |
± |
3.25 |
3.25 |
± |
1.33 |
|||
|
(Z)-β-Ocimene |
2.16 |
± |
0.32 |
2.31 |
± |
0.47 |
1.86 |
± |
0.74 |
0.74 |
± |
0.24 |
|||
|
Unknown 9 |
2.29 |
± |
0.32 |
1.40 |
± |
1.28 |
2.17 |
± |
1.44 |
1.44 |
± |
0.49 |
|||
|
(E)-β-Ocimene |
0.88 |
± |
0.59 |
0.50 |
± |
0.77 |
0.96 |
± |
0.96 |
0.96 |
± |
0.46 |
|||
|
γ-Terpinene |
0.63 |
± |
0.52 |
0.37 |
± |
0.64 |
1.10 |
± |
1.18 |
1.18 |
± |
0.55 |
|||
|
α-Guaiene |
0.28 |
± |
0.04 |
0.83 |
± |
0.78 |
0.29 |
± |
0.10 |
0.10 |
± |
0.03 |
|||
|
Unknown 11 |
0.82 |
± |
0.16 |
1.53 |
± |
1.06 |
0.82 |
± |
0.29 |
0.29 |
± |
0.07 |
|||
|
Unknown 12 |
2.92 |
± |
0.87 |
3.56 |
± |
1.22 |
3.11 |
± |
0.25 |
0.25 |
± |
0.43 |
|||
|
Aromadendrene |
2.00 |
± |
0.79 |
1.45 |
± |
1.49 |
2.15 |
± |
0.28 |
0.28 |
± |
0.37 |
|||
|
Myltayl-4(12)-ene |
0.39 |
± |
0.04 |
0.83 |
± |
0.64 |
0.68 |
± |
0.31 |
0.31 |
± |
0.26 |
|||
|
9-epi-(E)-Caryophyllene |
0.49 |
± |
0.06 |
0.71 |
± |
0.35 |
0.63 |
± |
0.05 |
0.05 |
± |
0.21 |
|||
|
Unknown 13 |
1.48 |
± |
0.26 |
2.11 |
± |
0.89 |
1.49 |
± |
0.36 |
0.36 |
± |
0.14 |
|||
|
β-Acoradiene |
1.44 |
± |
0.65 |
1.40 |
± |
0.70 |
1.41 |
± |
0.27 |
0.27 |
± |
0.26 |
|||
|
γ-Gurjunene |
0.61 |
± |
0.27 |
0.30 |
± |
0.21 |
0.51 |
± |
0.06 |
0.06 |
± |
0.19 |
|||
|
Aciphyllene |
0.47 |
± |
0.26 |
0.45 |
± |
0.44 |
0.41 |
± |
0.10 |
0.10 |
± |
0.26 |
|||
|
γ-Cadinene |
0.78 |
± |
0.39 |
0.74 |
± |
0.66 |
0.60 |
± |
0.13 |
0.13 |
± |
0.51 |
|||
|
α-Bulnesene |
0.78 |
± |
0.39 |
0.74 |
± |
0.66 |
0.60 |
± |
0.13 |
0.13 |
± |
0.51 |
|||
|
Unknown 18 |
0.54 |
± |
0.20 |
0.84 |
± |
0.28 |
0.57 |
± |
0.50 |
0.50 |
± |
0.50 |
|||
|
Unknown 19 |
0.62 |
± |
0.17 |
1.13 |
± |
0.76 |
0.38 |
± |
0.28 |
0.28 |
± |
0.10 |
|||
|
Unknown 20 |
3.67 |
± |
1.31 |
4.76 |
± |
2.65 |
3.17 |
± |
3.21 |
3.21 |
± |
2.90 |
|||
|
Unknown 21 |
3.67 |
± |
1.31 |
3.56 |
± |
3.75 |
3.19 |
± |
3.25 |
3.25 |
± |
2.96 |
|||
|
Lippifoli-1(6)-en-5-one |
1.49 |
± |
0.37 |
1.75 |
± |
0.74 |
1.14 |
± |
0.54 |
0.54 |
± |
0.41 |
|||
|
Unknown 22 |
0.50 |
± |
0.50 |
3.78 |
± |
3.71 |
2.36 |
± |
3.91 |
3.91 |
± |
2.94 |
|||
|
trans-Dauca-4(11),7-diene |
2.81 |
± |
0.77 |
5.72 |
± |
2.75 |
0.91 |
± |
0.76 |
0.76 |
± |
0.91 |
|||
|
Maaliol |
0.26 |
± |
0.39 |
2.96 |
± |
4.84 |
1.81 |
± |
3.13 |
3.13 |
± |
2.03 |
|||
|
1,10-di-epi--Cubenol |
2.80 |
± |
0.75 |
5.66 |
± |
1.64 |
2.56 |
± |
1.65 |
1.65 |
± |
0.43 |
|||
|
2,7Z-Bisaboladien-4-ol |
0.36 |
± |
0.02 |
0.82 |
± |
0.56 |
0.27 |
± |
0.08 |
0.08 |
± |
0.03 |
|||
|
Hinesol |
1.79 |
± |
0.46 |
3.66 |
± |
1.15 |
1.69 |
± |
1.07 |
1.07 |
± |
0.25 |
|||
|
Unknown 29 |
1.86 |
± |
0.53 |
3.50 |
± |
0.71 |
2.06 |
± |
1.79 |
1.79 |
± |
0.37 |
|||
|
α-Eudesmol |
0.58 |
± |
0.16 |
1.16 |
± |
0.39 |
0.47 |
± |
0.39 |
0.39 |
± |
0.08 |
|||
|
8-hydroxy-Isobornyl isobutanoate |
0.42 |
± |
0.10 |
0.78 |
± |
0.26 |
0.32 |
± |
0.22 |
0.22 |
± |
0.05 |
|||
|
Unknown 32 |
1.14 |
± |
0.28 |
2.17 |
± |
0.74 |
0.92 |
± |
0.67 |
0.67 |
± |
0.16 |
|||
|
Unknown 33 |
1.15 |
± |
0.28 |
1.56 |
± |
0.47 |
0.86 |
± |
0.76 |
0.76 |
± |
0.13 |
|||
|
Occidenol |
0.41 |
± |
0.11 |
0.72 |
± |
0.23 |
0.27 |
± |
0.16 |
0.16 |
± |
0.04 |
|||
|
Unknown 34 |
0.77 |
± |
0.19 |
1.47 |
± |
0.49 |
0.33 |
± |
0.22 |
0.22 |
± |
0.08 |
|||
|
Unknown 35 |
1.07 |
± |
0.33 |
2.03 |
± |
0.60 |
0.98 |
± |
0.91 |
0.91 |
± |
0.16 |
|||
|
Longiborneol acetate |
1.00 |
± |
0.24 |
2.20 |
± |
0.91 |
0.83 |
± |
0.52 |
0.52 |
± |
0.08 |
|||
|
2Z,6Z-Farnesol |
1.39 |
± |
1.01 |
0.94 |
± |
0.79 |
0.52 |
± |
0.78 |
0.78 |
± |
1.00 |
|||
|
11-alphaH-Himachal-4-en-1-beta-ol |
1.40 |
± |
1.02 |
0.95 |
± |
0.79 |
0.53 |
± |
0.79 |
0.79 |
± |
1.00 |
|||
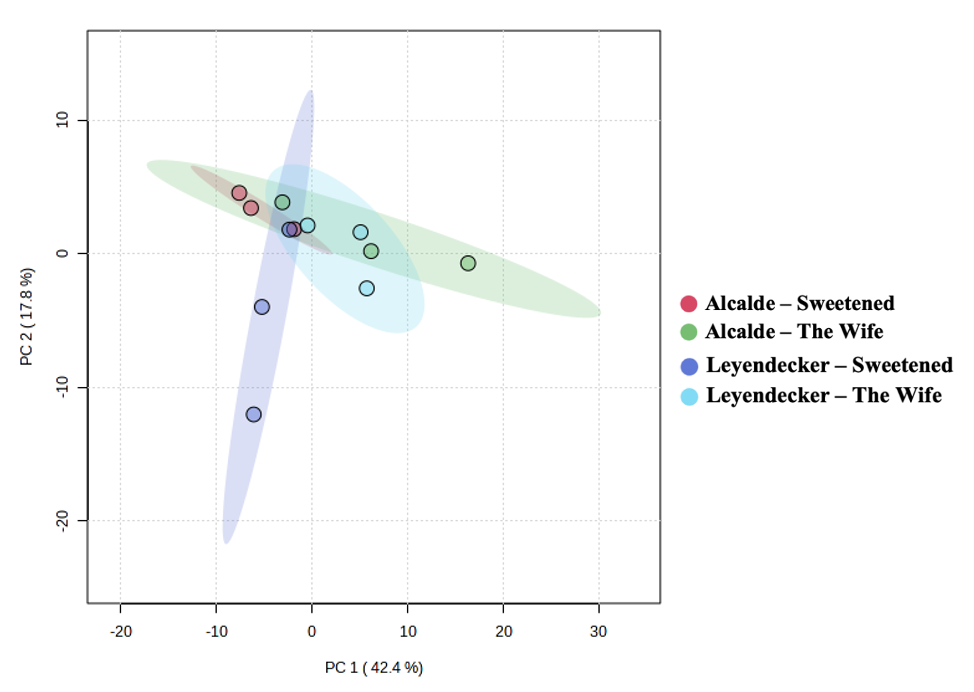
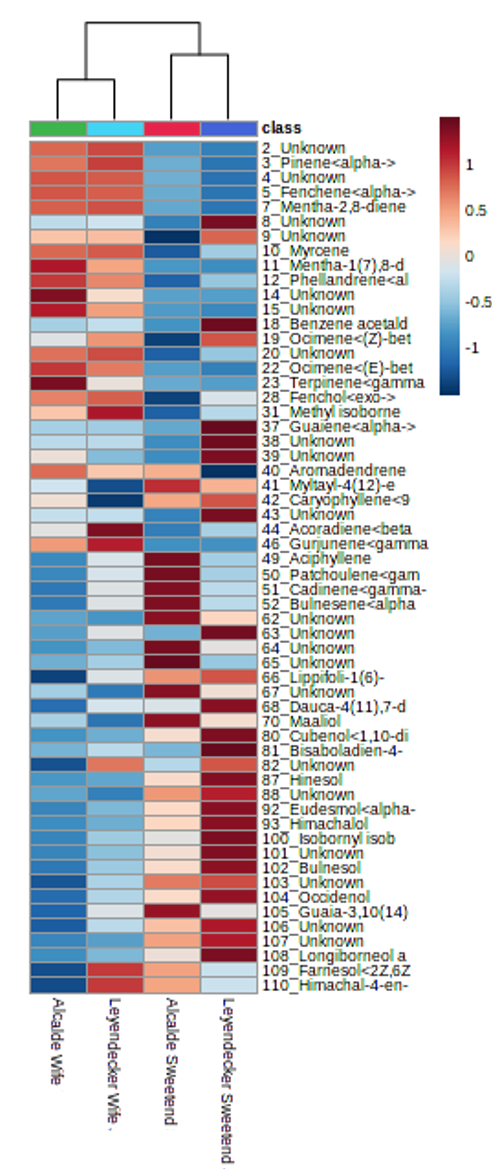
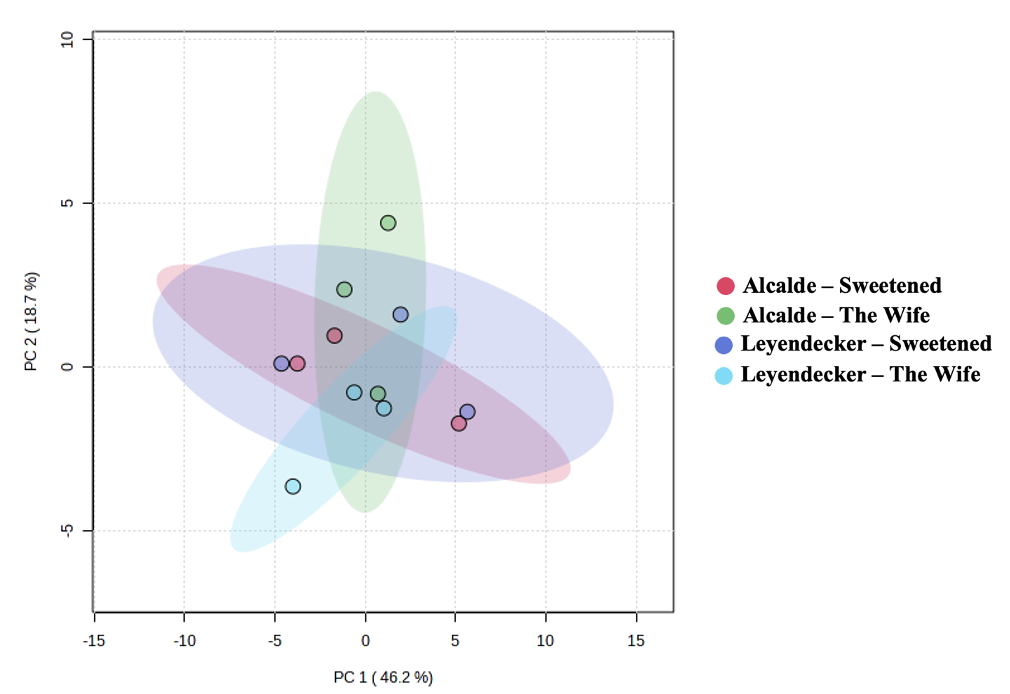
A plot of the principal component analysis (PCA) scores for steam distillation extracts is shown as Figure 3. The overlapping region between groups illustrate the similarities between sample groups. The heatmap of the 50 most abundant compounds has notable clustering by variety despite the lack of statistically-significance differences among samples (Figure 4). Although the EO yield from steam distillation was significantly influenced by both variety and location, individual compounds in the EO profiles from both steam distillation and SFE samples did not exhibit significant variation across samples from variety or location influences (including interaction effects). However, heatmapping the abundance of the major compounds in the steam-distilled samples shows a clear clustering by variety (Figure 4-3). These results support the idea of different EO profiles between varieties, although the importance of the degree of differences is not yet clear since the differences could be an artifact of the limited power of the experiments due to the number of replicates used for data collection.
The average yield of extracts from supercritical fluid extraction (SFE) (Table 7) ranged from 8-13%. The yield was not significant for the variety x location model under common management (p = 0.44). Similarly, the yield was not significant for the variety x treatment model for organic management at Alcalde (p = 0.289) or for water-stress at Leyendecker (p = 0.108).
Table 7. Supercritical Fluid Extract Yields
|
Variety |
Location |
Treatment |
Total Extract Collected (%, w/w) (avg i ± SD ii) |
|
Sweetened |
Leyendecker |
Standard |
13.08 ± 6.72 |
|
Water-stress |
11.36 ± 1.43 |
||
|
Alcalde |
Standard |
12.76 ± 1.77 |
|
|
Organic |
10.70 ± 0.84 |
||
|
The Wife |
Leyendecker |
Standard |
8.16 ± 2.19 |
|
Water-stress |
13.41 ± 6.33 |
||
|
Alcalde |
Standard |
12.52 ± 0.45 |
|
|
Organic |
10.27 ± 1.44 |
i n=3
ii SD: standard deviation
A total of 24 unique compounds were detected in the volatile fraction of SFE from plants grown under standard conditions using GC-MS; 16 of these were identified through library matching (Table 8). The profile was dominated by CBD (76-80%). Other minor cannabinoids detected included Δ9-THC and CBN (accounting for 0.8-1.7% and 0.05-0.15% of the volatile profile, respectively). Major EO components present in all ScCO2 SFE samples (each averaging at least 1% of the volatile profile across samples) were Unknown E, a-Longipinene, g-Gurjunene, Zonarene, β-Elemene, 9-epi-(E)-Caryophyllene, and trans-Dauca-4(11),7-diene; accounting for 13.9-15.5 % of the overall profile (roughly 70% of the EO, non-cannabinoid fraction). Two of the compounds, a-Longipinene and β-Elemene, were not identified in the steam distillation samples. They could be one of the unknown compounds, the result of a misidentification being present at an abundance below the set threshold. Unknown E co-eluted with CBD.
Table 8. Unique compounds detected in supercritical fluid extracts from hemp grown under standard conditions at two locations, in order of elution
|
Sample |
Location |
Leyendecker |
Alcalde |
||||||||||
|
Hemp Variety |
The Wife |
Sweetened |
The Wife |
Sweetened |
|||||||||
|
Cannabinoid Content (%)* |
77.3 |
80.4 |
81.0 |
80.0 |
|||||||||
|
Compound |
% (normalized based on total ion chromatogram) |
||||||||||||
|
Santolina triene |
0.34 |
± |
0.28 |
0.20 |
± |
0.13 |
1.41 |
± |
0.51 |
0.45 |
± |
0.47 |
|
|
a-Longipinene |
3.44 |
± |
2.83 |
2.16 |
± |
2.03 |
2.48 |
± |
0.39 |
2.56 |
± |
1.30 |
|
|
β-Elemene |
2.35 |
± |
2.00 |
1.33 |
± |
1.24 |
1.49 |
± |
0.31 |
1.55 |
± |
0.77 |
|
|
β-Duprezianene |
0.57 |
± |
0.45 |
0.33 |
± |
0.28 |
0.41 |
± |
0.09 |
0.50 |
± |
0.26 |
|
|
allo-Aromadendrene |
0.57 |
± |
0.51 |
0.56 |
± |
0.54 |
0.41 |
± |
0.06 |
0.81 |
± |
0.46 |
|
|
9-epi-(E)-Caryophyllene |
0.59 |
± |
0.37 |
2.09 |
± |
1.63 |
1.59 |
± |
1.13 |
1.55 |
± |
0.99 |
|
|
g-Gurjunene |
0.62 |
± |
0.44 |
2.72 |
± |
2.11 |
2.10 |
± |
1.63 |
2.31 |
± |
1.58 |
|
|
Zonarene |
2.72 |
± |
1.78 |
1.98 |
± |
1.09 |
0.90 |
± |
0.72 |
1.72 |
± |
1.07 |
|
|
trans-Dauca-4(11),7-diene |
1.48 |
± |
0.89 |
1.13 |
± |
0.57 |
0.57 |
± |
0.40 |
1.02 |
± |
0.58 |
|
|
Rosifoliol |
1.61 |
± |
0.95 |
1.00 |
± |
0.51 |
0.41 |
± |
0.31 |
0.77 |
± |
0.41 |
|
|
Viridiflorol |
1.25 |
± |
0.80 |
0.80 |
± |
0.40 |
0.33 |
± |
0.22 |
0.63 |
± |
0.37 |
|
|
5-epi-7-epi-a-Eudesmol |
0.80 |
± |
0.66 |
0.54 |
± |
0.40 |
0.41 |
± |
0.24 |
0.89 |
± |
0.38 |
|
|
UnknownA |
0.82 |
± |
0.03 |
0.80 |
± |
0.26 |
1.12 |
± |
0.66 |
0.45 |
± |
0.24 |
|
|
UnknownB |
0.13 |
± |
0.03 |
0.32 |
± |
0.20 |
0.24 |
± |
0.02 |
0.25 |
± |
0.07 |
|
|
UnknownC |
0.05 |
± |
0.01 |
0.20 |
± |
0.21 |
0.12 |
± |
0.01 |
0.12 |
± |
0.04 |
|
|
UnknownD |
0.31 |
± |
0.01 |
0.29 |
± |
0.12 |
0.24 |
± |
0.04 |
0.25 |
± |
0.15 |
|
|
Cannabidiol (CBD) |
76.41 |
± |
10.42 |
78.59 |
± |
9.80 |
79.93 |
± |
3.34 |
78.65 |
± |
7.25 |
|
|
UnknownE |
4.30 |
± |
0.21 |
2.43 |
± |
1.17 |
4.04 |
± |
0.32 |
3.19 |
± |
1.13 |
|
|
UnknownF |
0.21 |
± |
0.02 |
0.29 |
± |
0.14 |
0.22 |
± |
0.04 |
0.29 |
± |
0.12 |
|
|
Δ-9-tetrahydrocannabinol (THC) |
0.84 |
± |
0.11 |
1.66 |
± |
1.20 |
1.01 |
± |
0.21 |
1.27 |
± |
0.62 |
|
|
UnknownG |
0.05 |
± |
0.03 |
0.11 |
± |
0.10 |
0.04 |
± |
0.05 |
0.06 |
± |
0.07 |
|
|
Cannabinol (CBN) |
0.07 |
± |
0.02 |
0.15 |
± |
0.17 |
0.05 |
± |
0.01 |
0.07 |
± |
0.06 |
|
|
UnknownH |
0.23 |
± |
0.04 |
0.16 |
± |
0.11 |
0.22 |
± |
0.01 |
0.27 |
± |
0.19 |
|
|
Hexacosane |
0.24 |
± |
0.02 |
0.18 |
± |
0.15 |
0.24 |
± |
0.12 |
0.36 |
± |
0.32 |
|
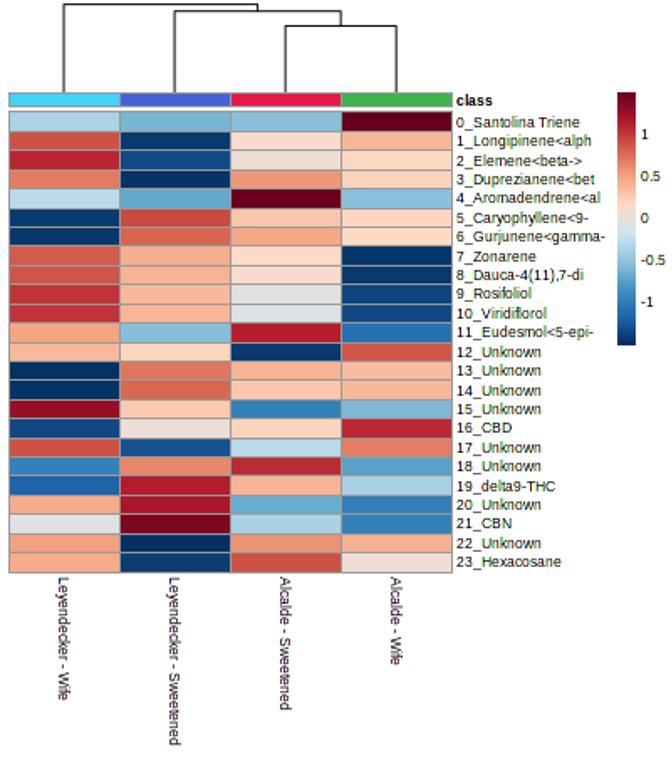
A plot of the PCA scores for the supercritical fluid extracts is shown as Figure 5 and confirmed the similarity of the groups. The high degree of overlap was expected given the lack of statistically-significant differences between individual compounds in the samples. The overlap in PCA scores was more evident in SFE extracts than steam distillation extracts. Heatmapping of the SFE extract compounds did not reveal as distinct of variety/chemovar clustering as the clustering observed for the steam distillation extracts (Figure 6).
The lack of significant differences in EO profiles from SFE was expected because ScCO2 extraction conditions target cannabinoids and were not designed for fractionation of EO. Solvent rinsing and subsequent rotary evaporation of the extracts may further impact the utility of the method for observing representative EO profiles in SFE extracts. Future work should compare EO profiles of SFE crude extracts without any solvent addition for recovery from the extraction vessel or post-processing.
Research outcomes
The knowledge gap for best management of hemp at low latitudes, given drought and temperature stresses, has slowed the adoption of the crop by regional farmers (Sunoj et al., 2023). Based on the photoperiod response of the industrial varieties evaluated, southern NM is unlikely to establish a major hemp grain or fiber industry at this time; development of infrastructure in the northern part of the state is more feasible. The survival rate of high-CBD hemp plants was strongly influenced by the integrity of the plants at transplanting. Many root-bound transplants did not exhibit recovery or regular growth, and were more susceptible to damage by pests, disease, and abiotic pressures (Thiessen et al., 2020). The abiotic and biotic stresses of outdoor production hinder the viability of small-scale production for high-CBD crops. Further research on high-CBD hemp production in New Mexico should focus on controlled-environment settings, and field trial focus should center around identification of regionally adapted industrial varieties.
As the utilization of all chemovars of C. sativa expands, evaluation of the impacts of extraction method on the chemical profiles of compounds obtained from the flowers is vital to understanding what type/levels of pharmacological activity might be expected from a particular extract. This knowledge gap is compounded with the need to develop standardization for complete chemical profiling of cannabinoid and terpenoid content in sample matrices from different environmental sources. For commercial laboratories that provide services for identifying major cannabinoid and terpene constituents, employing a simultaneous analysis may be more efficient and economical. For researchers interested in the impacts of natural EO profiles and potential synergistic effects, differentiated GC oven conditions by target molecule class may be needed. This is particularly important for efforts toward metabolite discovery. The primary difficulty encountered with GC-MS peak identification was due to the differences between the ion-trap GC used in this study and the quadrupole-based GC used for development of the compound library. Raising the minimum abundance for compound identification to 40,000 allowed for the more accurate identification of major peaks by eliminating the underlying presence of co-eluting compounds with minor abundances. The high minimum abundance, however, limited the ability to probe potential influences of minor compounds with strong synergistic effects.
In addition to the proposed objectives, the establishment of these hemp fields allowed for other university researcher’s to collect data on different subjects. One project that arose from this field study was monitoring the presence of beet leaf hoppers in hemp plots. At all sites, insects were trapped at field perimeters with yellow sticky traps that were collected every two weeks. This was to investigate the pressure of beet leaf hopper in New Mexico hemp fields. Another project that arose involves characterizing the waste fibers from the plant to identify value-added uses for bio-based products. After flower/leaf material was collected for yield, the remaining stalks and stems were milled to < 2mm particle size. The milled fiber was subject to characterization to obtain a mass balance through determination of moisture, ash, lignin, structural carbohydrates, extractives, protein, and starch contents.
Education and Outreach
Participation summary:
There were two primary educational objectives at the onset of this project: 1) to establish recommendations for area hemp products, and 2) to aid in development of courses for hemp education at New Mexico State University. Efforts were made to use multiple forms of outreach in order to reach these objectives. Activities such as tours, conference presentations (from the local to national level), peer reviewed journal articles, and course development were undertaken. Descriptions of these activities are described below and appropriate links/files are provided in the Information Products section of the report.
Journal Articles (1)
- Creamer, R., Simpson, A., Rheay, H.T., Brewer, C.E. (2023). Beet leafhopper, vector of beet curly top, and its interactions with hemp. Environmental Entomology. https://doi.org/10.1093/ee/nvad069
Tours (1)
- The Los Lunas Agricultural Science Center (ASC) hosted a field tour and educational program for the Western Agricultural Economics Association on June 28, 2022. The group of 30 was composed of primarily agricultural economists and Extension Specialists who work closely with farmers and ranchers in the Western and Midwestern US. Several NMSU faculty participated in the annual meeting held in Santa Fe.
Webinars/talks/presentations (8)
- Rheay, H.T. (October 2023). Co-Products and Applications of Industrial Hemp for New Mexico Agriculture. NMSU CHME Department Seminar. [Las Cruces, NM].
- Rheay, H.T. & Brewer, C.E. (August 2023). Structural sugar profile of fiber residues from high-cannabinoid type hemp and potential for value-added fermentation. Association for the Advancement of Industrial Crops, Annual Meeting. [Corvallis, Oregon].
- Rheay, H.T., Creamer, R., & Brewer, C.E. (August 2023). Lessons learned from initial field trials of hemp in New Mexico. American Society for Horticultural Science, Annual Conference. [Orlando, Florida].
- Rheay, H.T. & Brewer, C.E. (July 2023). Characterization and pretreatment of milled hemp (Cannabis sativa) fibers from high-cannabinoid type crops for biochemical conversion. American Society of Agricultural and Biological Engineers, Annual International Meeting. [Omaha, Nebraska].
- Rheay, H.T., Lombard, K., Creamer, R., & Brewer, C.E. (June 2023). Preliminary Results and Lessons Learned Initiating Hemp Research at NMSU. Specialty Crop Workshop – NMSU Cooperative Extension. [Las Cruces, NM].
- Rheay, H.T. (November 2022). Uses of NM-grown Hemp (Cannabis sativa):
Phytoremediation and Bio-Based Chemicals. NMSU CHME Department Seminar. [Las Cruces, NM].s - Rheay, H.T. (July 2022). Properties of Hemp Stalk Residues and Potential for Value-Added Applications; American Society for Agricultural and Biological Engineers. [Houston, TX].
- Rheay, H.T. & Brewer, C.E. (August 2022). Hemp production in New Mexico – Ongoing trials and future outlooks. American Society for Horticultural Science Annual Conference. [Chicago, Illinois].
Other educational activity (1)
- Southwest Cannabis Conference: Cultivation Panel, Tips & Tricks
- Participated on a panel with four other individuals, addressing audience questions regarding hemp/Cannabis production practices
Curricula/factsheets/educational tools (1)
- CHME491: Special Topics – Hemp Processes and Products
- Developed an 8-week, online (asynchronous) interdisciplinary elective course for 22 students (graduate and undergraduate). Provided relevant educational material and assignments to enable students to complete a course project on the development of a hemp biorefinery concept proposal
- Catalog Description: Interdisciplinary course on hemp (Cannabis sativa L.) as an industrial crop, major products made from hemp, and the processes used to make those products. Most of the content focuses on the physical and chemical mechanisms of the processing technologies as they relate to the major hemp types: flower, grain, and fiber. Discussions also include hemp’s history, genetics, and current legal status.
Thesis
Rheay, H. (2023). Co-products and Applications of Industrial Hemp (Cannabis sativa L.) for New Mexico Agriculture. Ph.D. Engineering-Chemical Engineering. New Mexico State University. [Pending Release by ProQuest].
One way engagement was measured during various outreach activities was through the use of a voluntary survey. Attendees during events were asked to scan a QR code to provide information regarding their thoughts on hemp education and research priorities at NMSU, as well as basic demographic information. A summary of the survey results are provided in a separate file here.