Final report for GW21-228
Project Information
Nitrogen is a critical nutrient for fertilizing our crops that can be acquired non-synthetically via symbiotic nitrogen fixing bacteria associating with legumes. Legumes are widely used in crop rotations, and there is growing interest in using them in intercropping systems. Effective nitrogen fixation and nitrogen cycling depends on the microbial community, so it is important to understand how our agricultural practices impact these microbial communities. This project will determine how a mixed cropping system of pea and canola impacts microbial communities in the soil, rhizosphere, and roots in this system. Analysis of the diversity of the microbial communities will be done to determine the abundance of nitrogen fixing bacteria, how well they are performing, and how they are contributing to the growth and nitrogen content of pea and canola crops. Results from this study will be available to farmers and stakeholders via talks and posters at producer-focused workshops, conferences, field days, and more. The expected outcomes from this project are (1) to have a clearer understanding on how the way we grow our crops is impacting microbial communities, (2) to have suggestions for the farming community in Eastern Washington to improve the performance and abundance of nitrogen fixing bacteria in order for them to produce their crops more sustainably and efficiently, and (3) to help guide further research on nitrogen fixing bacteria as a means for nitrogen fertilization and to obtain a more sustainable and productive method of farming, while improving and maintaining soil health.
Our research objectives are:
- To determine if the peaola intercropping system that we are studying is producing similar results for yield and land equivalent ratio (LER) as other studies have found.
- To determine the biodiversity and abundance of the nitrogen fixing bacteria of the microbial populations present in soil, rhizosphere, and root samples collected from pea and canola in monoculture and intercropped, and with varying levels of nitrogen fertilizer application.
- To determine if there is a difference in the community structure and importance of nitrogen fixing bacteria in the microbial communities present in the different cropping systems, including the symbiotic ability of the pea-associated nitrogen-fixing bacteria.
- To determine the nitrogen content of the crops grown in monoculture and in the peaola intercropping system to determine whether symbiotic nitrogen fixation by pea can meet the nitrogen needs of intercropped canola.
Our primary education/outreach objective is:
To improve sustainability and productivity of the agricultural system across the inland Pacific Northwest by quantifying crop yield, changes to the soil and plant microbiome, and economic benefit when peaola is adopted as a rotational crop in a dryland wheat-based system.
Our education/outreach sub objectives are:
- To guide agricultural practices in the inland Pacific Northwest through sharing the results of this study with producers and agricultural stakeholders.
- To increase the awareness of the general public in the inland Pacific Northwest about the benefits of intercropping and peaola.
- To guide future research on intercropping and peaola in the inland Pacific Northwest.
For us to accomplish the various experiments and events we describe in this proposal, we will follow the below timeline. It should be noted that some of the steps for this project will happen and have happened before the start of this grant’s funding.
WSARE Grant Proposal Application: February 9th
First sample collection at Mark Greene’s farm: April-May 2021
First crop yield analysis: April-May 2021
First sample nitrogen tests: April-May 2021
First DNA extractions: May-June 2021
Initial sequencing and qPCR: June-July 2021
Data analysis of first samples: July-December 2021 (Could need an even longer of period to perform the data analysis due to the presented difficulty of data normalization)
Preparation of outreach materials based on first set of results: December 2021-April 2022
Second planting and growth of strip plots at Mark Greene's farm: September 2021-April 2022
Potential submission of an initial manuscript: December 2021-April 2022
Second sample collection at Mark Greene’s farm: April-May 2022
Second crop yield analysis: April-May 2022
Second nitrogen tests: April-May 2022
Second DNA extractions: May-June 2022
Second qPCR: June 2022-July 2022
Data analysis of the second samples: July-December 2022 (Same conditions as first round)
Tri-societies meeting: November 6th-9th, 2022
Regional soil health meeting: Winter 2022
Analysis of combined data: December 2022-January 2023 (May happen earlier depending on ease of data analysis)
Prepare final outreach materials: January 2023
Work on submitting more comprehensive manuscript: February 2023-August 2023
Attended and contribute to outreach events and platforms discussed in our education plan: February 2023-August 2023
With No-Cost Extension
Aug-Nov 2023: DNA extraction and 16S sequencing of roots + nifH SmartChip runs
Nov-Dec 2023: Tri-societies meeting and data analysis
Dec 2023-Jan 2024: Prepare final outreach materials
Winter 2024: Regional soil health meeting
Jan-August 2024: Manuscript preparation and submission + outreach activities
Cooperators
- (Researcher)
- - Producer
- (Researcher)
- (Researcher)
Research
The objectives of our project were:
- To determine if the peaola intercropping system that we are studied was producing similar results for yield and land equivalent ratio (LER) as other studies have found.
- To determine the biodiversity and abundance of the nitrogen fixing bacteria of the microbial populations present in soil, rhizosphere, and root samples collected from pea and canola in monoculture and intercropped, and with varying levels of nitrogen fertilizer application.
- To determine if there was a difference in the community structure and importance of nitrogen fixing bacteria in the microbial communities present in the different cropping systems, including the symbiotic ability of the pea-associated nitrogen-fixing bacteria.
- To determine the nitrogen content of the crops grown in monoculture and in the peaola intercropping system to determine whether symbiotic nitrogen fixation by pea can meet the nitrogen needs of intercropped canola.
Land Equivalent Ratio and Yield Analysis
For our first objective, peaola plot trials were planted across three different years (2020, 2021, and 2022). Peaola planted in 2020 was located at a farm near Colfax, WA where the plots were 11 m by 61 m. These plots were planted and sampled prior to the project start date, but were included due to their relevance to the overall project and final datasets. In 2021 and 2022 peaola was planted at a WSU research farm near Davenport, WA where the plots were 1.7 m by 9 m and at Mark Greene's farm where the plots were 12 m by 152 m. At the WSU research farm, the 2021 and 2022 plots were seeded into no-till winter wheat chemical fallow using a Fabro double disk no-till drill. The winter pea variety Goldenwood (ProGene Plant Research, LLC) and the canola variety Plurax (Rubisco Seeds) were used in both the monoculture and intercrop as both varieties have been successfully grown in the Palouse. In the intercrop, peas and canola were planted in the same row at the same time resulting in a mixed intercropping system. Planting occurred in late August as a compromise between the pea and canola ideal planting periods. The whole plot yield was sampled, using a M-2B clipper mill from A. T. Ferrell & Company Bluffton, Indiana which could separate the peas and canola. The plots near Colfax, WA were planted on April 9th, 2020, into stubble from the previous year's winter wheat crop using a no-till Cross Slot drill. Again, the winter pea variety used was Goldenwood (ProGene Plant Research, LLC) and a Clearfield spring-canola variety (DynaGro 200 CL) was used. Strips were harvested on September 14th, 2020 and weighed using a weigh wagon. A 1 kg subsample was collected from the grain stream which then had peas and canola separated using an M-2B clipper mill from A.T. Ferrell & Company Bluffton, Indiana. Peas and canola were weighed separately and used to calculate the relative pea and canola yield. At the Greene Farm in 2021 and 2022, 12 m by 152 m large strip trials were seeded into chemical fallow winter wheat stubble on April 20th, 2021, and May 17th, 2022. Banner variety spring pea purchased from ProGene Plant Research, LLC and canola NCC101s (Photosyntech) were used. A horsch hoe style winged opener was used to seed the plots, with the peas being sent down the dry fertilizer shoot in the mid-row and canola being placed an inch deep by the winged openers.
Land equivalence ratio (LER) was calculated using Equation 1, where ICp and ICc represent the yields of intercropped pea and canola, respectively, and Mp and Mc represent the yields of monoculture pea and canola, respectively. Mp and Mc were calculated through the mean of all four replicates for peas and canola, respectively. The LER for each individual peaola plot was calculated using the same Mp and Mc for the corresponding year.
Equation 1: LER = (ICp/Mp) + (ICc/MCc)
Microbial Community Analysis
To accomplish our second objective, we collected samples from small strip plots (1.7 x 9 m) at a WSU research farm near Davenport, WA and large strip trials on Mark Greene’s farm (12 x 152 m) near Cloverland, WA and at a farm located near Colfax, WA (11 x 61 m). The large strip trials at the Greene farm consisted of 1 peaola plot in 2021 and 2 peaola plots in 2022 to accommodate for the needs of the producer. Large strip trials located near Colfax, WA consisted of 4 replicates of peaola (51 kg N ha-1), 4 replicates of pea (0 kg N ha-1), and 4 replicates of canola (101 kg N ha-1). The small plot trials near Davenport, WA in 2021 were comprised of peaola at three N rates (4 replicates at 0 kg N ha-1, 3 replicates at 33 kg N ha-1, and 2 replicates at 67 kg N ha-1), 3 replicates of pea (0 kg N ha-1), and 4 replicates of canola (67 kg N ha-1). Variation in the number of replicates was a result of an error in the field regarding phosphorus fertilizer application, thus resulting in the exclusion of some plots. In 2022 the small plot trials near Davenport, WA consisted of 36 replicates of peaola, 4 replicates of pea, and 4 replicates of canola. Seeding rates were varied amongst peaola (Table 1). N application rates were originally given as percentages in the proposal due to uncertainty in the needed application rate at the time the proposal was written. Therefore, the values 0%, 50%, and 100% N refer to 0, 33, and 67 kg N ha-1 respectively as the percentages represented steps in the application rate. The number of replicates varies from what was indicated in the proposal due to changes in the needs of the producer, Mark Greene, and the agronomist, Dr. Isaac Madsen. These changes were needed by Mark Greene due to limited availability of space for growing crops. Dr. Isaac Madsen needed to change the experimental design at the Davenport, WA location due to the results of prior experiments which showed a need to investigate the impacts of seeding rates in 2022. For each plot, we collected soil and root samples at 3 different points. Soil was stored at -20C. Rhizosphere was collected from all root samples into rhizosphere buffer and both samples were stored at -80C.
Table 1. Peaola seeding rates for the 2022 trials at the Davenport, WA location.
| Peaola Seeding Treatment | Canola Seeding Rates (kg/ha) | Pea Seeding Rates (kg/ha) | Pea:Canola (w/w) |
| 1 | 1.33 | 89.68 | 67.43 |
| 2 | 1.33 | 112.10 | 84.29 |
| 3 | 1.33 | 134.52 | 101.14 |
| 4 | 2.67 | 89.68 | 33.59 |
| 5 | 2.67 | 112.10 | 41.99 |
| 6 | 2.67 | 134.52 | 50.38 |
| 7 | 4.00 | 89.68 | 22.42 |
| 8 | 4.00 | 112.10 | 28.03 |
| 9 | 4.00 | 134.52 | 33.63 |
| 10 | 0 | 112.10 | NA |
| 11 | 2.67 | 0 | NA |
DNA extractions were performed on the collected soil and rhizosphere samples using a Kingfisher DNA extraction machine following the Earth Microbiome Project’s protocol for the QIAGEN® MagAttract® PowerSoil® DNA KF Kit. Roots were freeze dried and crushed to a powder before performing DNA extracting using CTAB (a cationic detergent that can extract and purify DNA from bacteria). Extracted DNA was sent to Michigan State University’s Research Technology Support Facility for Illumina Amplicon Sequencing of the 16S V4 region on the MiSeq v2 Standard platform, resulting in 250 bp paired end reads. Instead of performing qPCR for the nifH gene, we decided to use PICRUSt2 (v. 2.5.2) to produce functional predictions for our datasets. This gave us information on any genes that were predicted to be present in the microbial community that may have been involved in nitrogen cycling processes. We focused on the PICRUSt2 output of Kyoto Encyclopedia of Genes and Genomes Orthology metagenome predictions (KOMPs) which genes and proteins that have been experimentally characterized to determine their molecular functions. This allowed us to determine if there were overall changes in the functional diversity of the microbial communities which allowed for a more thorough evaluation of the microbial community.
Sequences were analyzed using QIIME2 version 2023.7 on WSU’s Kamiak High Performance Computing Cluster, although version 2021.8 was used to analyze samples collected in 2020. Alpha-rarefaction plots showed that our sampling depth was sufficient for analysis of the microbial community. Bacteria were classified using “qiime feature-classifier classify-sklearn” with the Silva 138 99% OTUs from 515F/806R classifier found on the QIIME2 data resources page. After removing sequences representing chloroplasts and mitochondria, the bacterial core microbiome was found using “qiime feature-table core-features”. Differential abundance analysis was performed on all of the datasets for both bacterial communities and KOMPs using ALDEx2 version 1.28.1.
Network Analysis
We performed network analysis on the microbial count data used in objective 2 from Illumina amplicon sequencing of 16S rDNA for our third objective using SPIEC-EASI version 1.1.0 in R version 4.1.0 on WSU’s Kamiak High Performance Computing Cluster. SPIEC-EASI was chosen due to it being acknowledged as an appropriate method to produce a co-occurrence network from microbial abundance data. We used Cytoscape version 3.9.1 to analyze the networks, where bacterial RSVs are represented by individual nodes. Networks were produced for peaola, pea, and canola individually to allow for comparisons of the network structure across the three cropping systems. This analysis was only done on the samples collected in 2020 as network analysis did shown to not reveal any new information that we did not already receive from our other community analyses.
Stable Isotope Analysis
To accomplish our fourth objective, we were able to determine how the microbial communities impacted the levels of nitrogen present in the plant samples through performing stable isotope analysis, which related to our fourth objective. To do this, plant shoots were collected at each sampling point across the different trials except for in 2021 due to a communication error. Shoot samples were dried, leaf tissue was collected, and crushed to a fine powder. Stable isotope analysis was then performed at the WSU Stable Isotope Core providing us with C and N percentages for each sample. Analysis of the data was done using the emmeans package version 1.8.9 with Šidák correction.
Results
Land Equivalent Ratio and Yield Analysis
For our first objective, we found that the cropping system had a significant impact on the yield of pea and canola, and on the LER. Across the trials grown at the WSU research farm in 2021 and the trials grown near Colfax, WA in 2020, it was found that the average LER was 1.63 for peaola compared to the normalized value of 1 for the monocultures. The application of N fertilizers had no significant impact on the yield of peas and canola, or the LER for both of these locations. For the strip trials grown in Colfax, WA, the LER for peaola, at 1.37, was not significantly different from the monocultures. It was found that the yield of canola was not significantly different from when it was grown in monoculture, but the yield of pea was significantly reduced compared to when it was grown in monoculture at the Colfax, WA location. At the WSU research farm there was a significant increase in the LER of peaola from monoculture. However, there was a significant reduction in pea and canola yields from monoculture. At the Greene farm in 2021, no yield data was collected due to poor performance of the peas, so it was considered a loss. LERs were not calculated for the crops planted in 2022 at the WSU research farm and at the Greene farm as crops at the WSU research farm location were damaged significantly by deer and yield data was not collected at the Greene farm due to Dr. Isaac Madsen's move to Africa. The LERs that were recorded do match the range that has been recorded for peaola in the literature at low N application rates (Dowling et al., 2021).
Microbial Community Analysis
To accomplish our second, third, and fourth objectives, we collected 264 soil samples, 459 root and rhizosphere samples, and 333 plant shoots across 3 different locations from 2020 to 2022. Sequencing was done on all of soil, rhizosphere, and root samples collected in 2020, 2021, and 2022. Network analysis was successfully done on the sequences for our 2020 samples. Stable isotope analysis for C and N percentages was performed on the leaf tissue of the shoot samples collected in 2020 and 2022. Analysis of these results has been completed for both years. All results can be found bellow. Comparisons were not able to be performed on samples collected from Mark Greene's plots as a result of him only planting peaola as a result of spatial constraints.
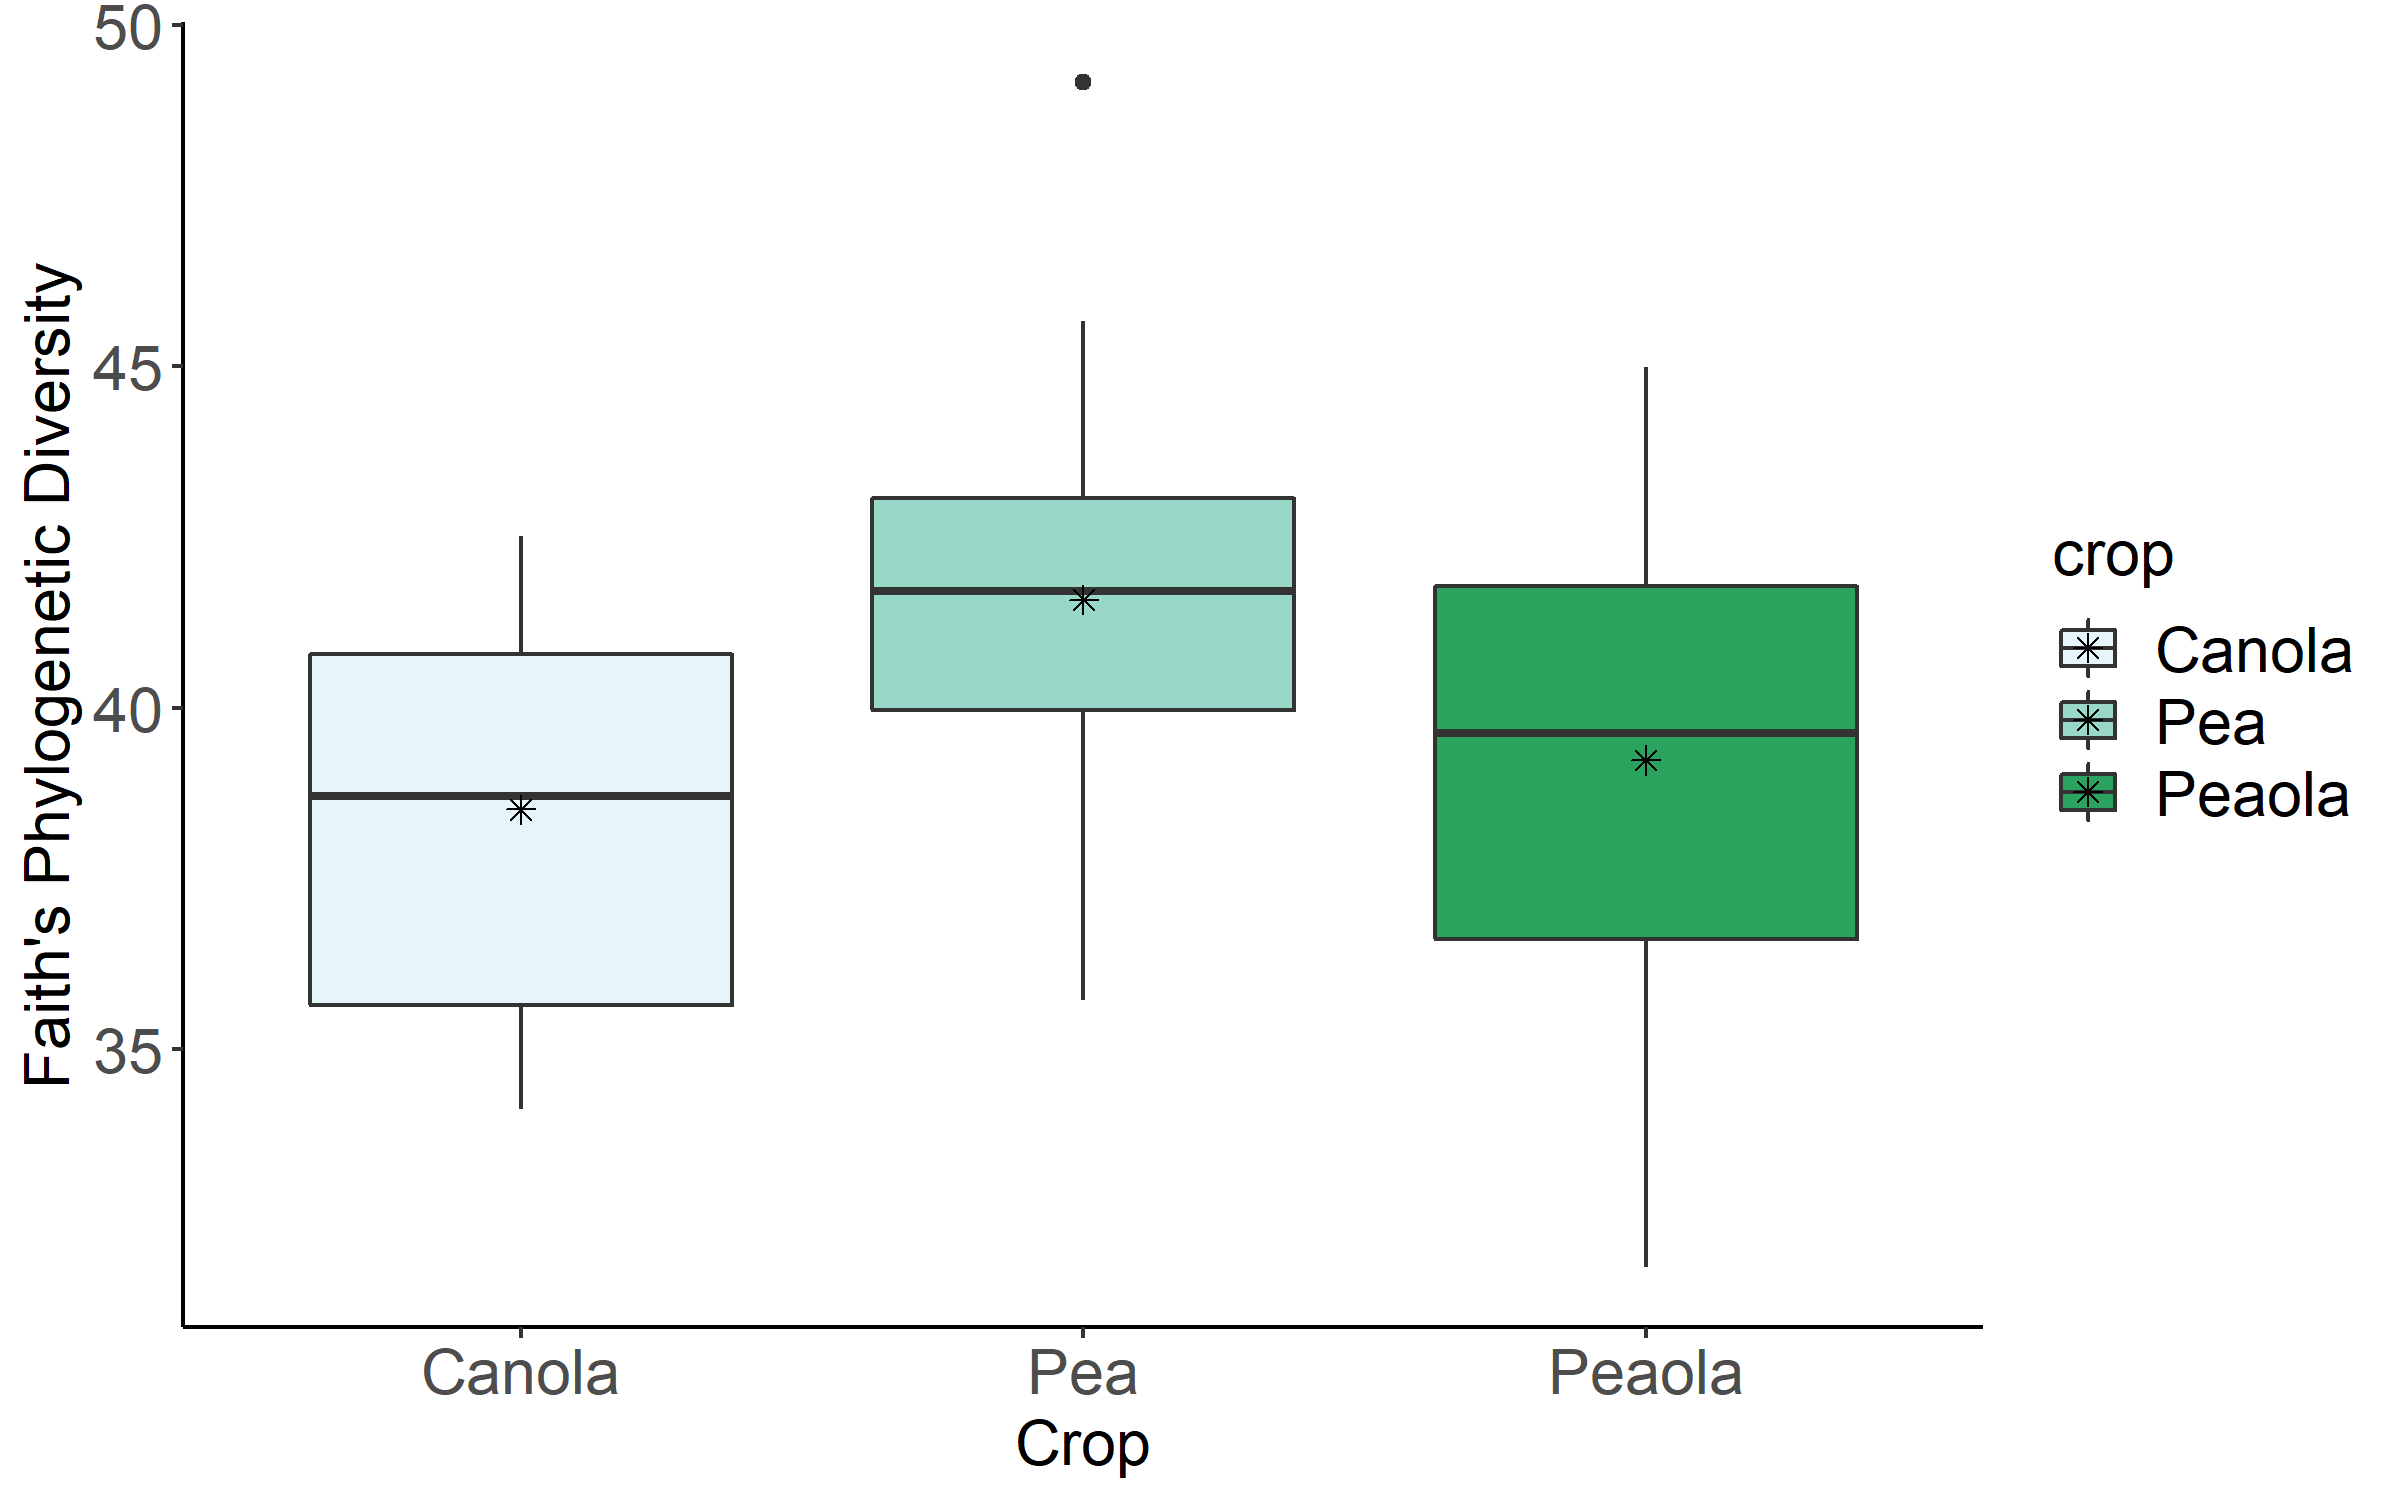

Data analysis was done for the 2020, 2021, and 2022 soil and rhizosphere sequences. Through the inclusion of a microbial community standard, we determined we were able to detect bacteria at the appropriate abundance down to a relative abundance of 0.089%. When analyzing the 2020 soil using Shannon diversity index, Observed Features, and Evenness (measures of α-diversity) we did not find any significant differences (P < 0.05) or trends (0.05 ≤ P ≤ 0.1) between pea monoculture, canola monoculture, and peaola. We did find a trend towards the monoculture pea soil being richer than the monoculture canola soil using Faith's Phylogenetic Diversity index (Kruskal–Wallis Test, n1 = 12, n2 = 12, H = 5.60, p = 0.0537) (Figure 1). No other significant differences or trends were found using Faith's Phylogenetic Diversity index. For the 2020 rhizosphere, we found that the bacterial community in pea is significantly more even than canola (P < 0.05) and that there was a trend towards it being more even than intercropped canola (0.05 ≤ P ≤ 0.1) (Figure 2).
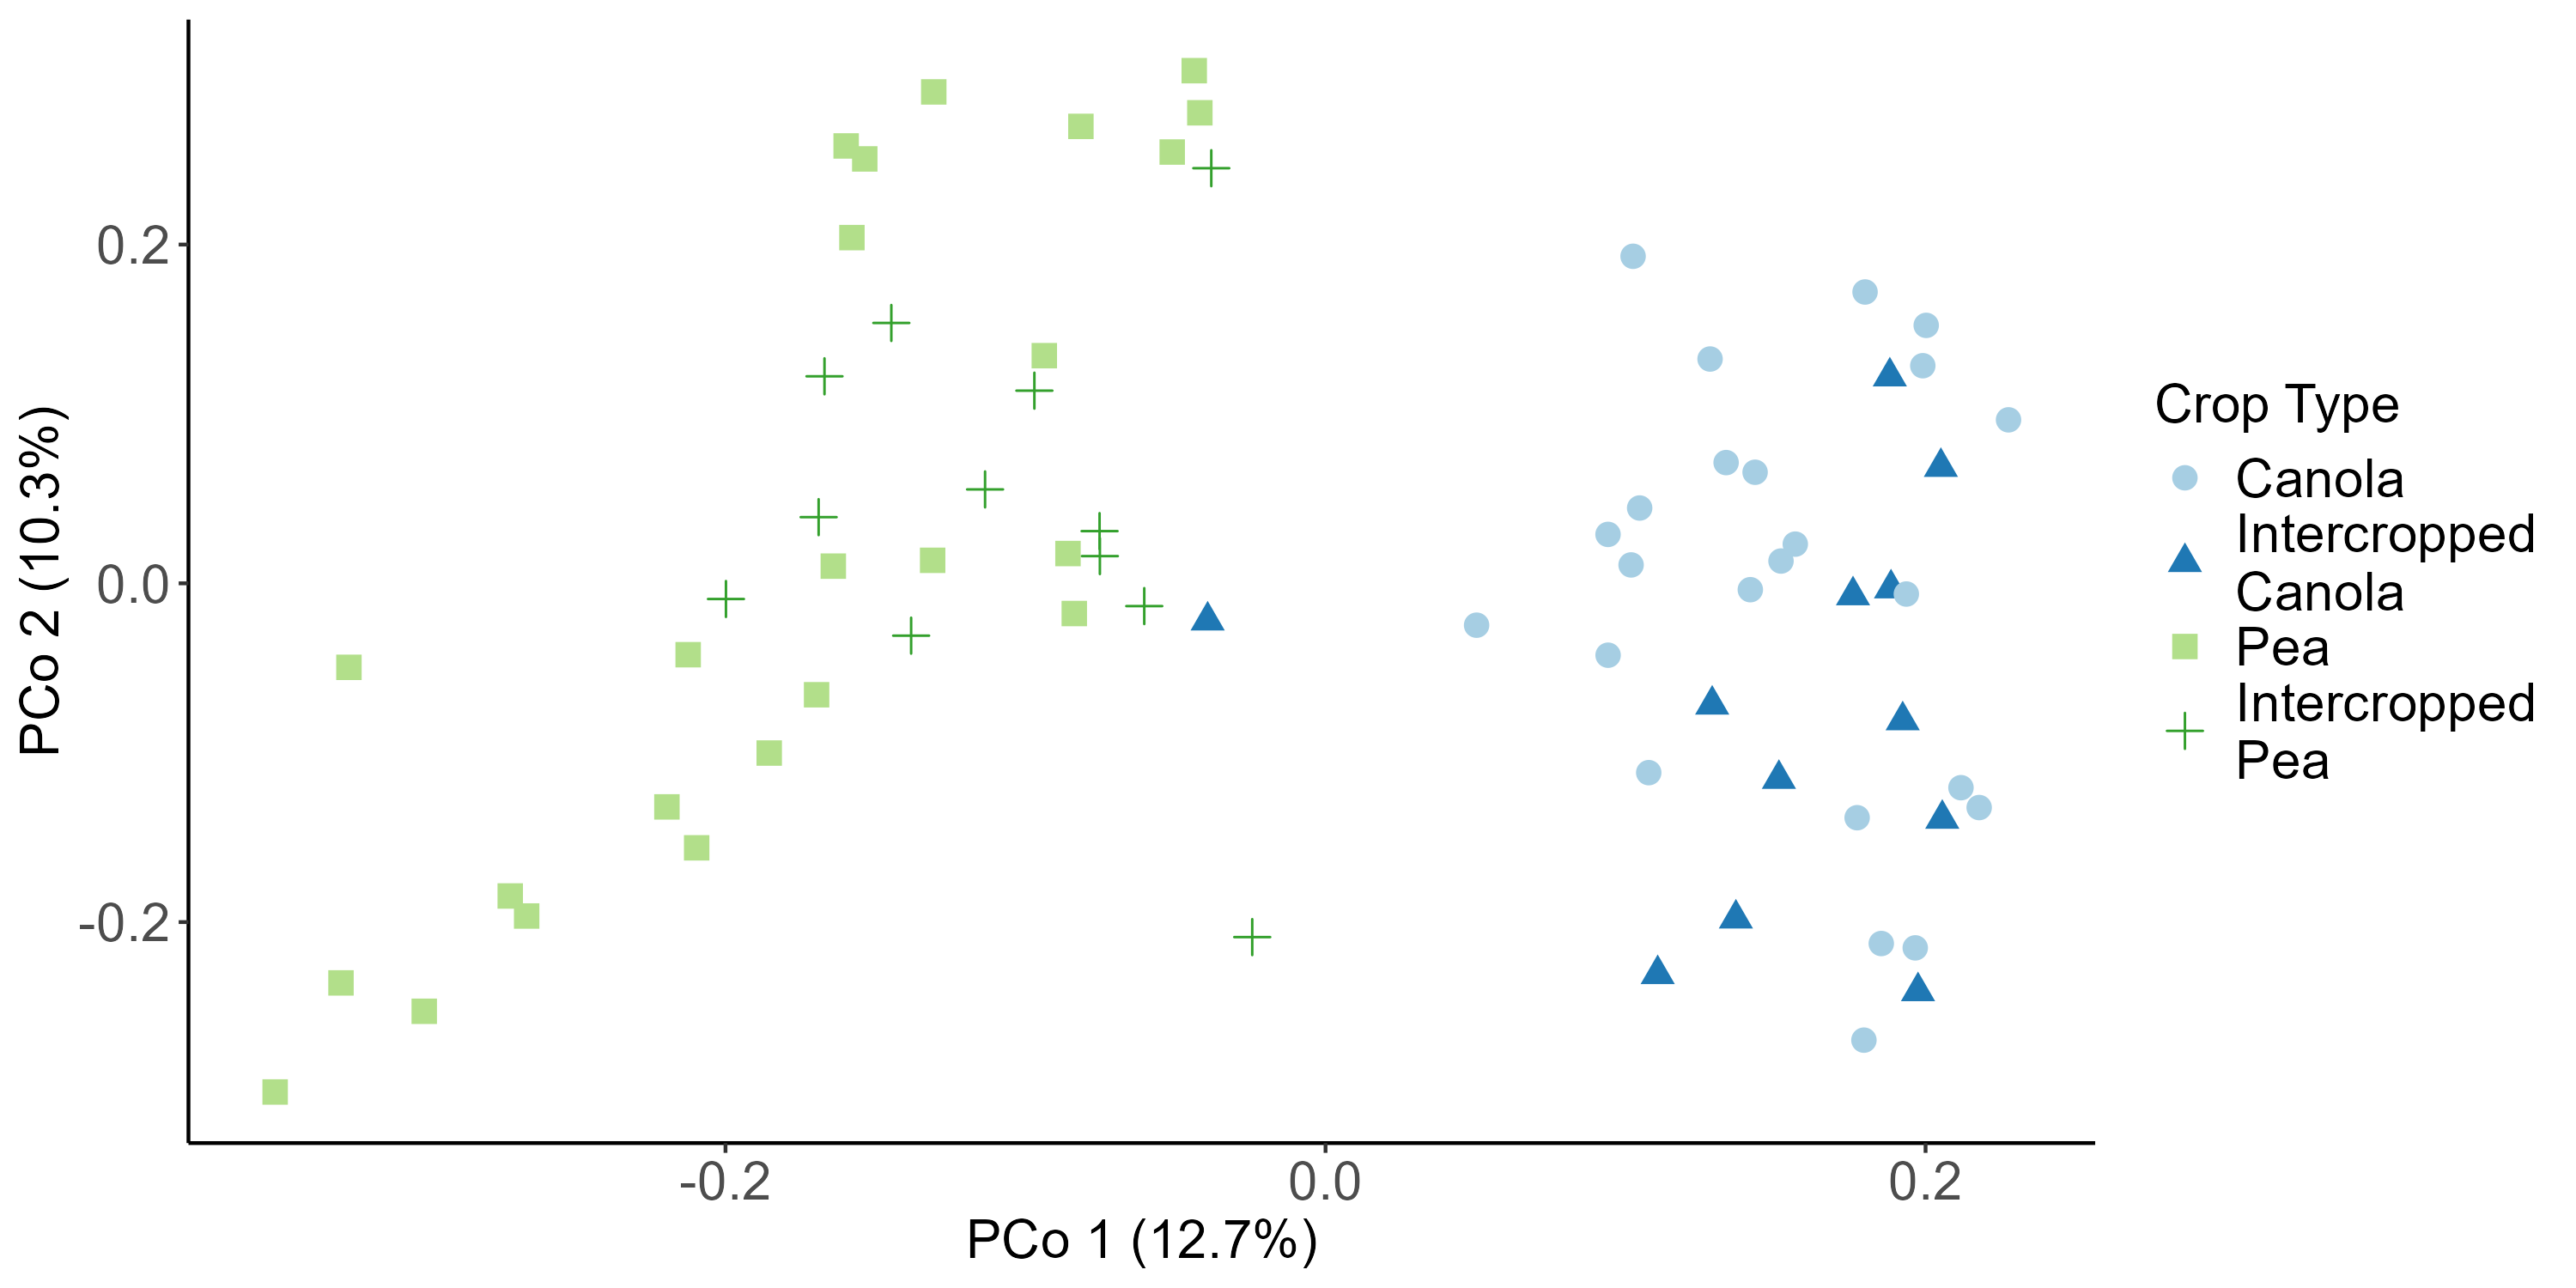
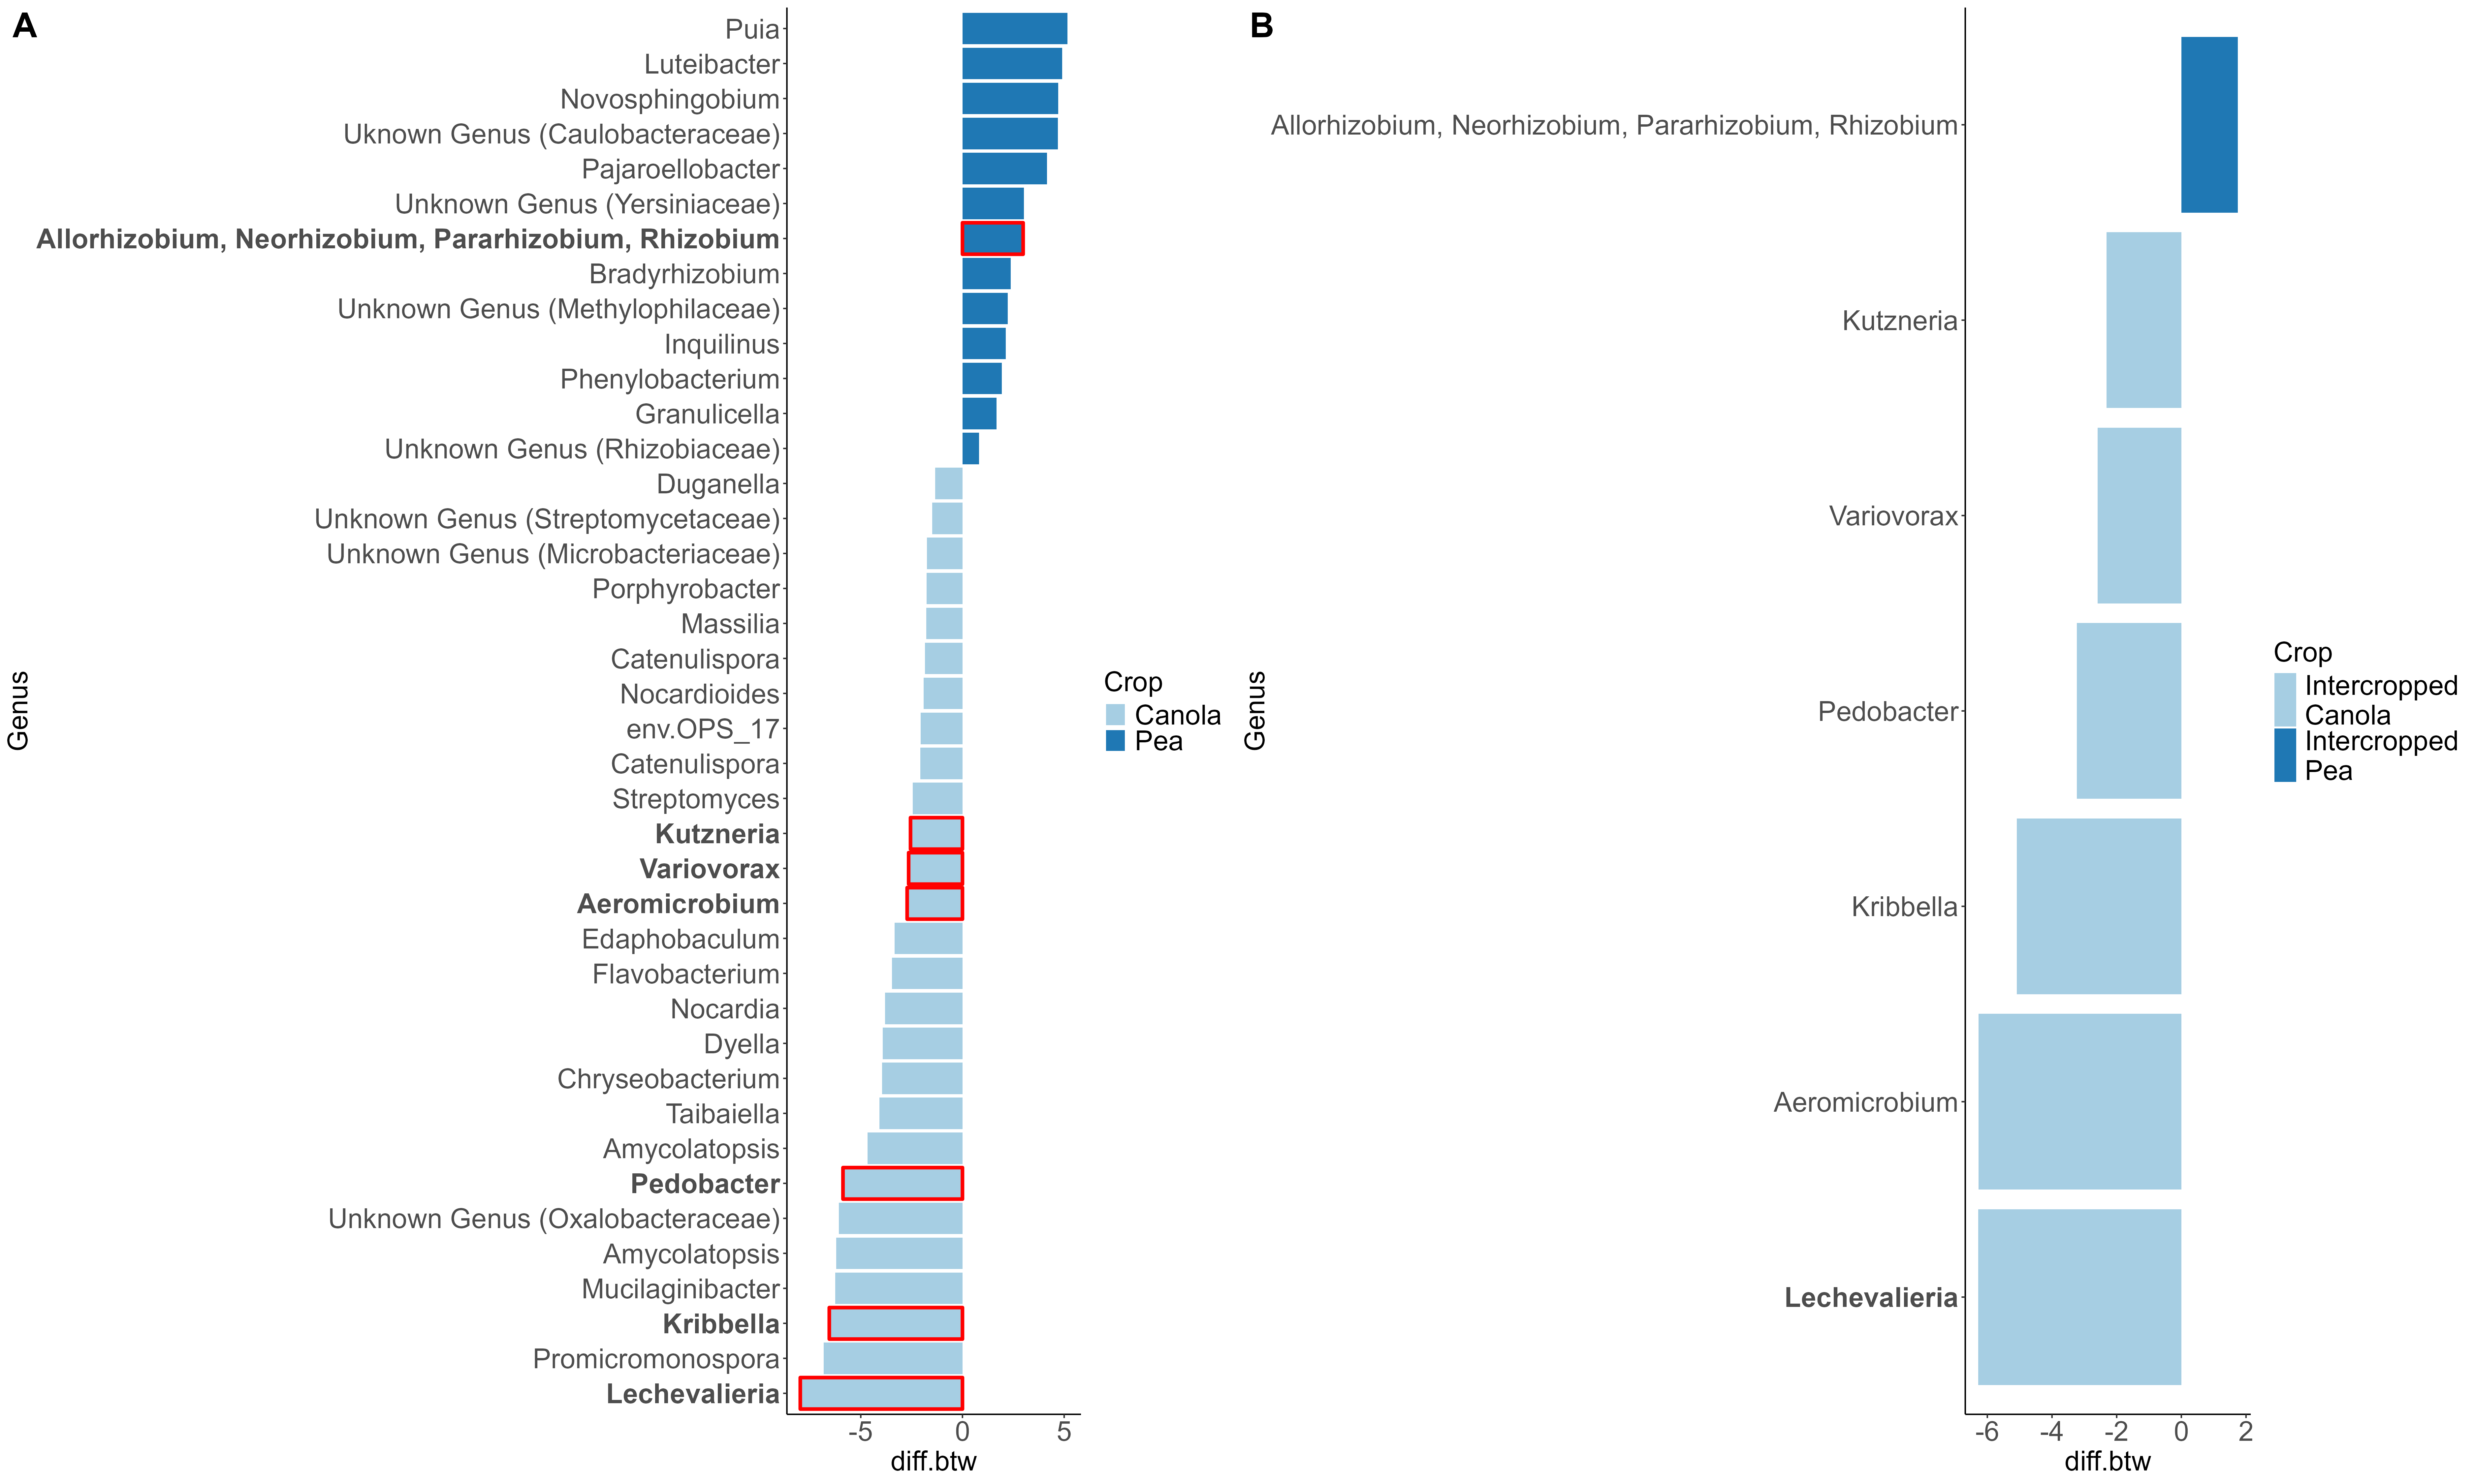
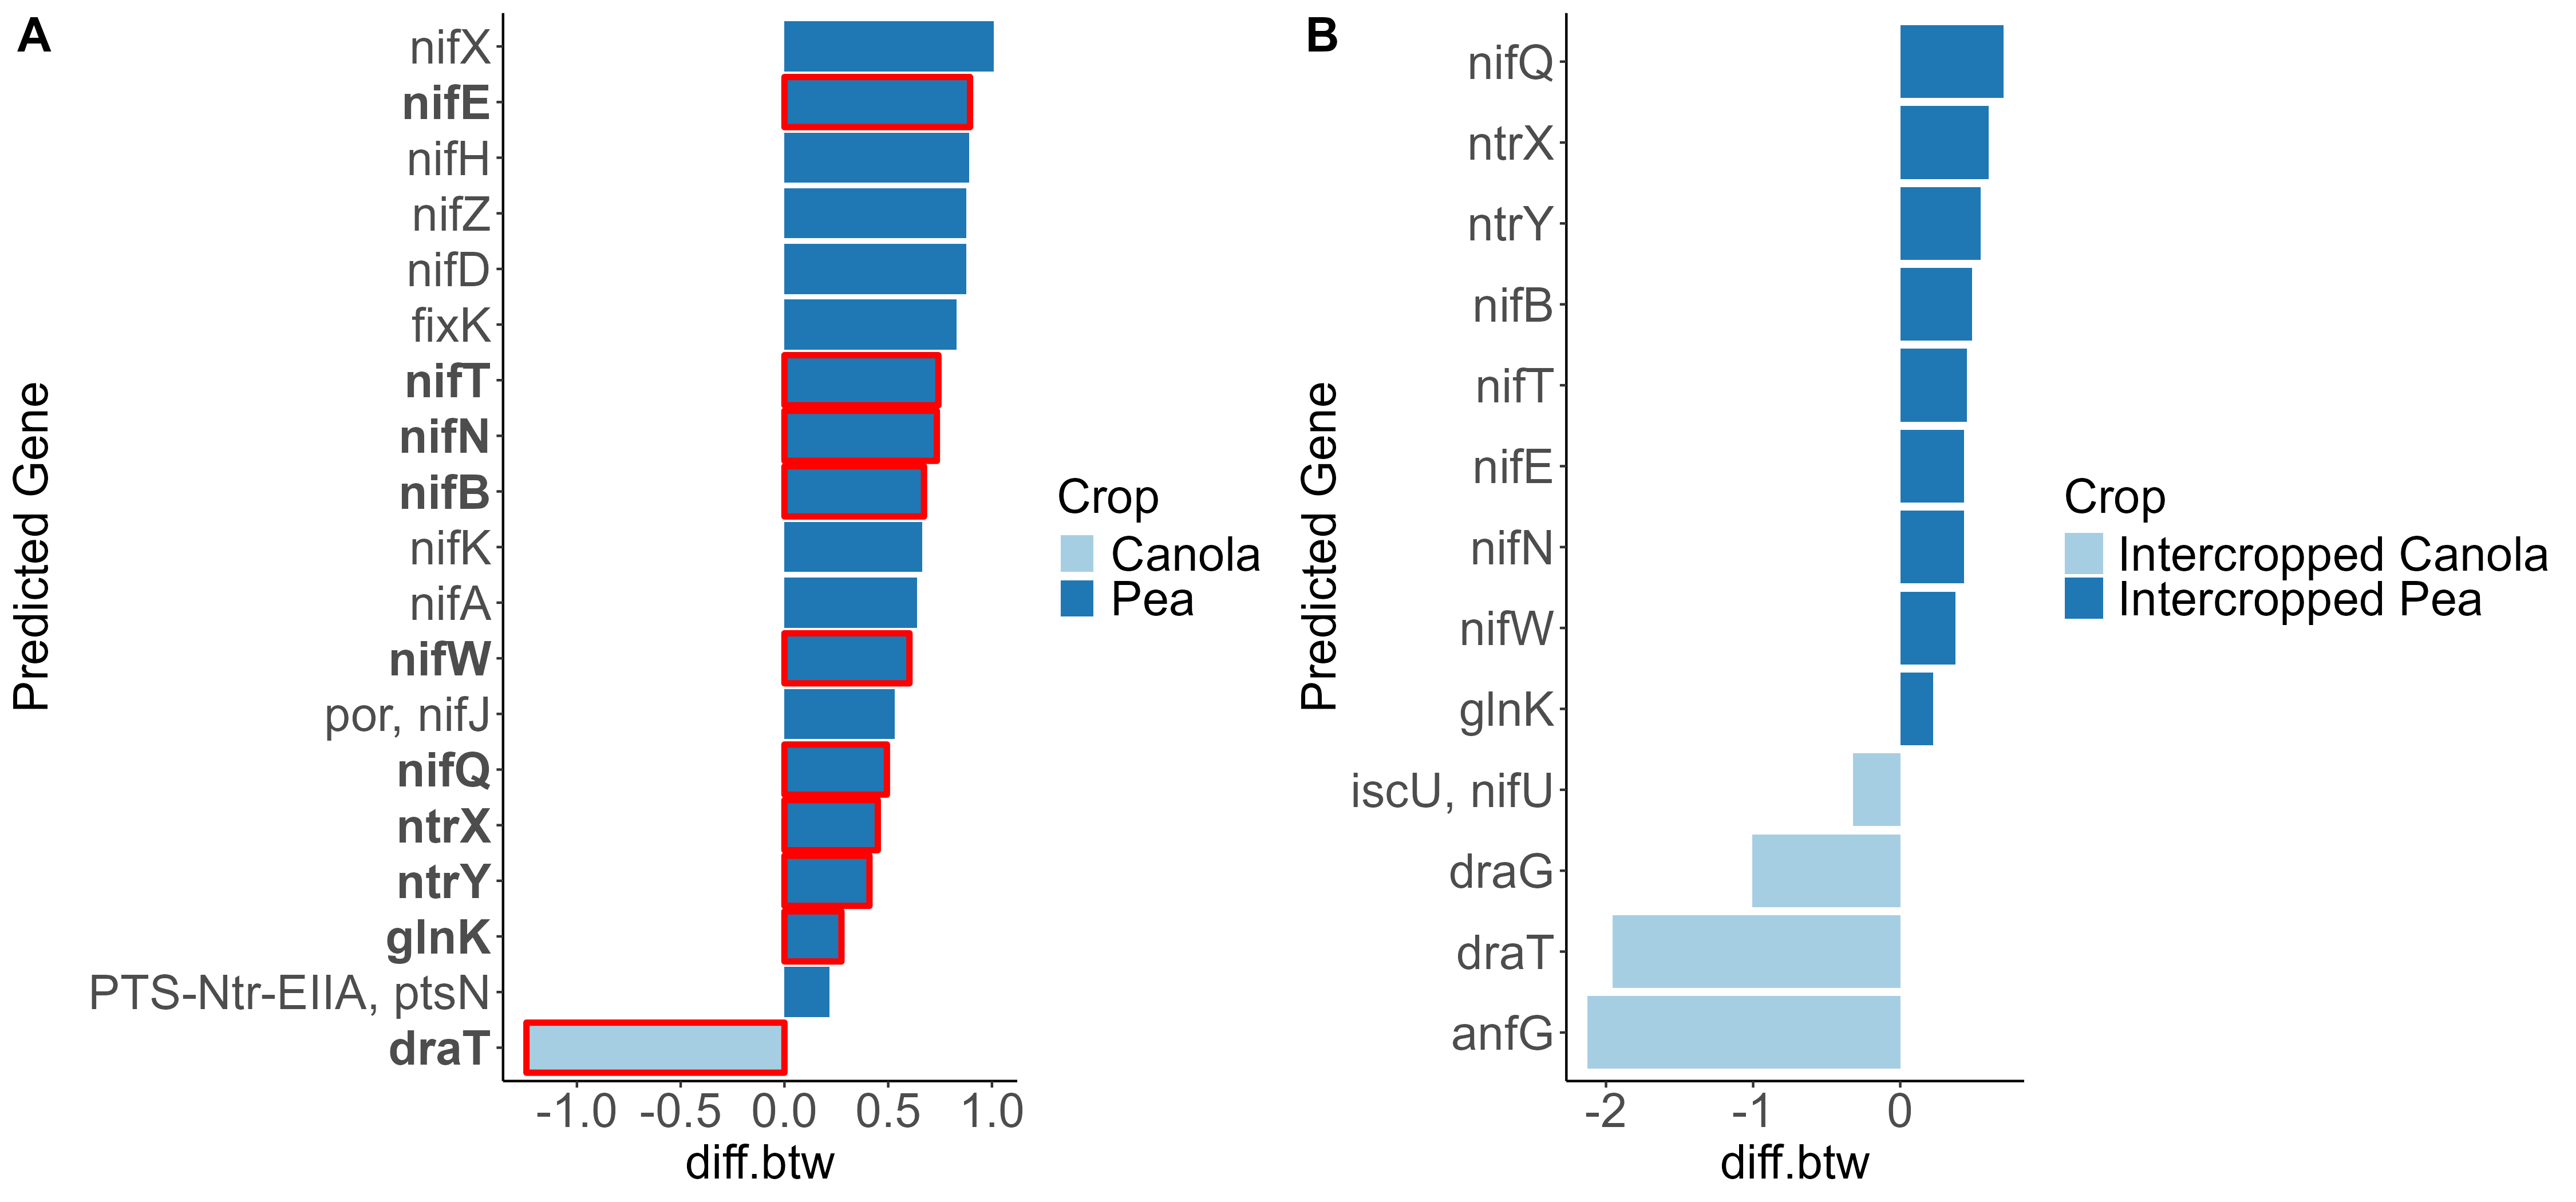
When looking at the β-diversity of the 2020 soil using Jaccard distance, Bray-Curtis distance, and unweighted UniFrac distance, we did not find any significant differences (P < 0.05) or trends (0.05 ≤ P ≤ 0.1) between pea monoculture, canola monoculture, and peaola. Under weighted UniFrac distance, we found that between pea and canola monoculture soils, and between peaola and canola monoculture soils, there was a trend toward there being a difference in the community composition (PERMANOVA, F = 2.06, P = 0.0705; PERMANOVA, F = 1.72, P = 0.0705) (Figure 3). This was not observed between pea monoculture and peaola soils. When looking at the 2020 rhizosphere, we found a significant difference in the β-diversity between canola and pea rhizosphere regardless of cropping system (PERMANOVA, P<0.05), and trends between like intercropped and monoculture crops (PERMANOVA, 0.05≤P≤0.1) based on Bray-Curtis distance (Figure 3). Similar observations were found using other measurements of β-diversity. Crop type was found to be the number one contributor to variance in the data accounting for 13%, while block accounted for 7% and cropping system accounted for 2%. Fewer differentially abundant amplicon sequencing variants (ASV) were seen in the rhizosphere between intercropped canola and intercropped pea than between monoculture canola and pea (Figure 4). The same held true for differentially abundant predicted KOMPs in the rhizosphere involved in nitrogen cycling processes (Figure 5).
Analysis of the 2021 soil samples showed no significant differences across all measures of α-diversity and β-diversity between the different cropping systems. Nitrogen fertilizer treatment did increase the diversity of the soil microbial community alone both at 33 and 67 kg N ha-1, however, compared to no fertilizer. In the rhizosphere, the intercropped pea microbial community was found to be more diverse than monoculture pea (Kruskal-Wallis, H = 4.57, P = 0.039), but not when considering the combined effects of cropping system and fertilizer treatment (Figure 6A, B). Significant differences remained between the microbial community compositions of canola and pea regardless of cropping system and fertilizer treatment (Figure 7A). This makes sense considering that 15% of the variance was explained by crop type, while block accounted for 8%, N treatment 3%, and cropping system 2%. Significant differences were seen in the community compositions of intercropped canola with no fertilizer and 67 kg N ha-1 (PERMANOVA, F = 1.83, P = 0.018; Figure 7B). Again, ASVs were found to be differentially abundant between pea and canola, but no ASVs were found to be differentially abundant between intercropped canola and intercropped pea with nitrogen fertilizer addition. This pattern was also true for predicted KOMPs with no differentially abundant predicted KOMPs involved in nitrogen cycling found between intercropped canola and intercropped pea at 67 kg N ha-1 and few at 33 kg N ha-1.
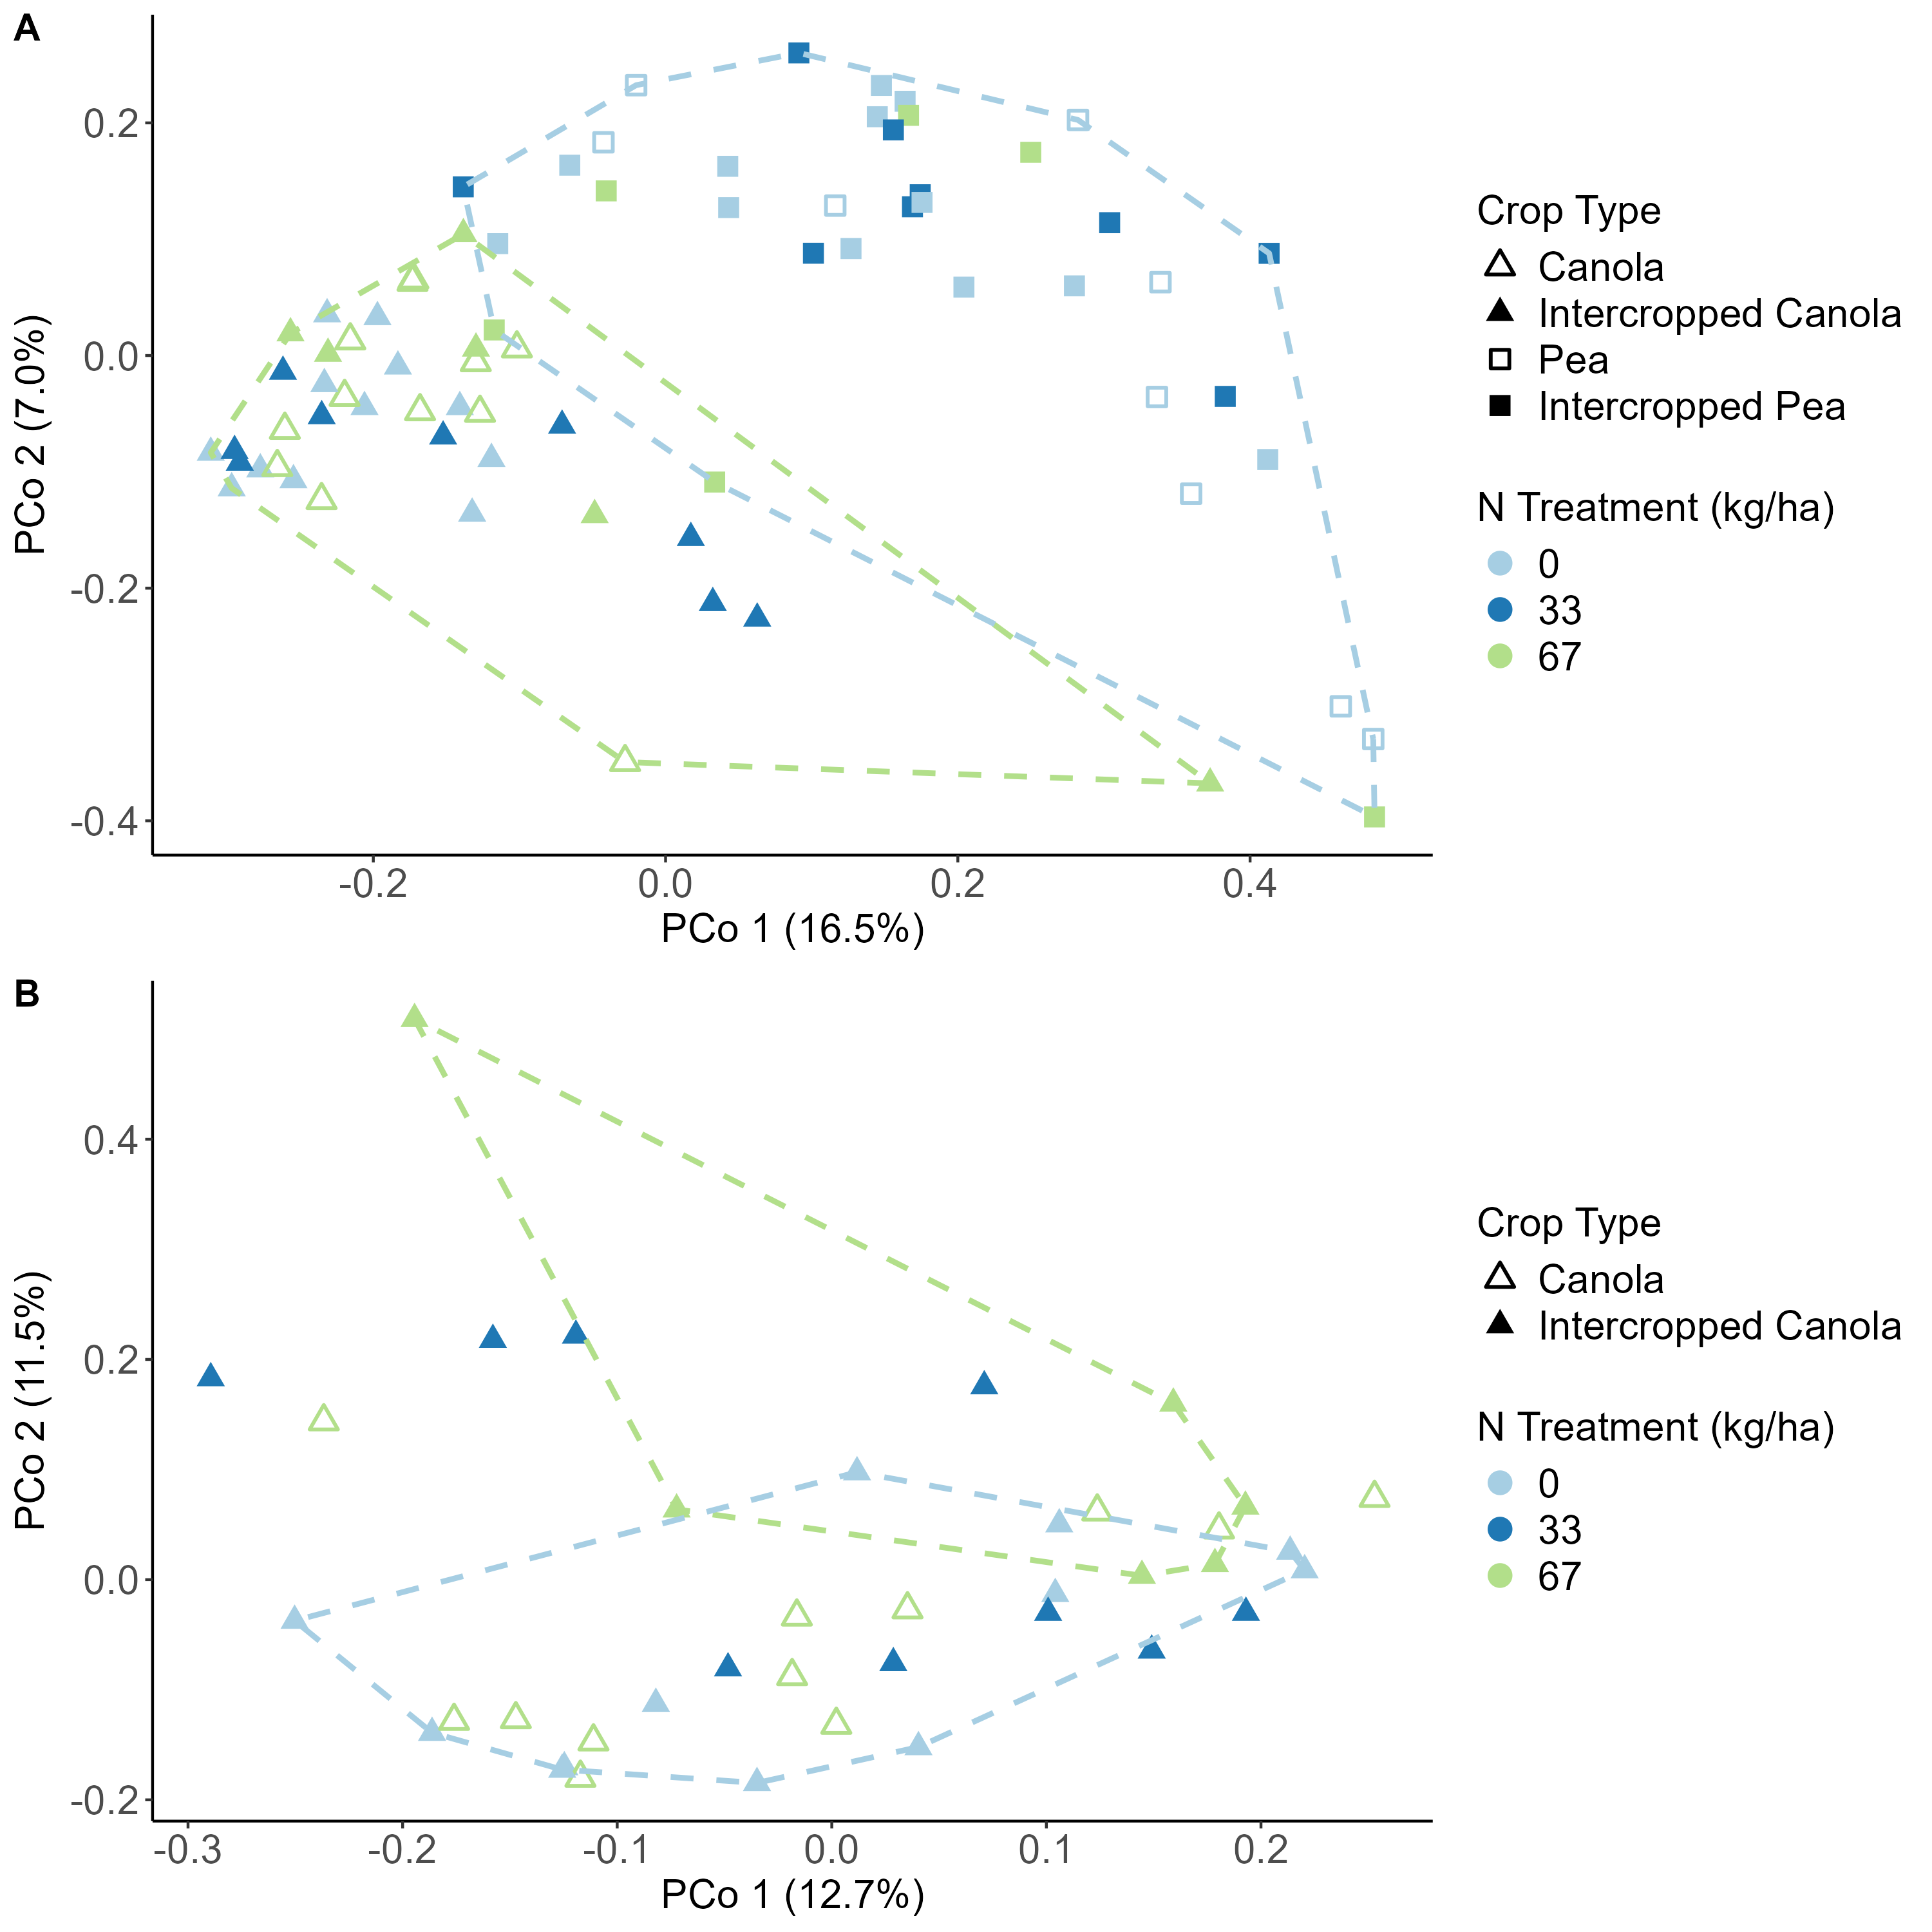
communities across crop types and fertilizer treatments. Panel B shows data associated with only canola and intercropped canola.
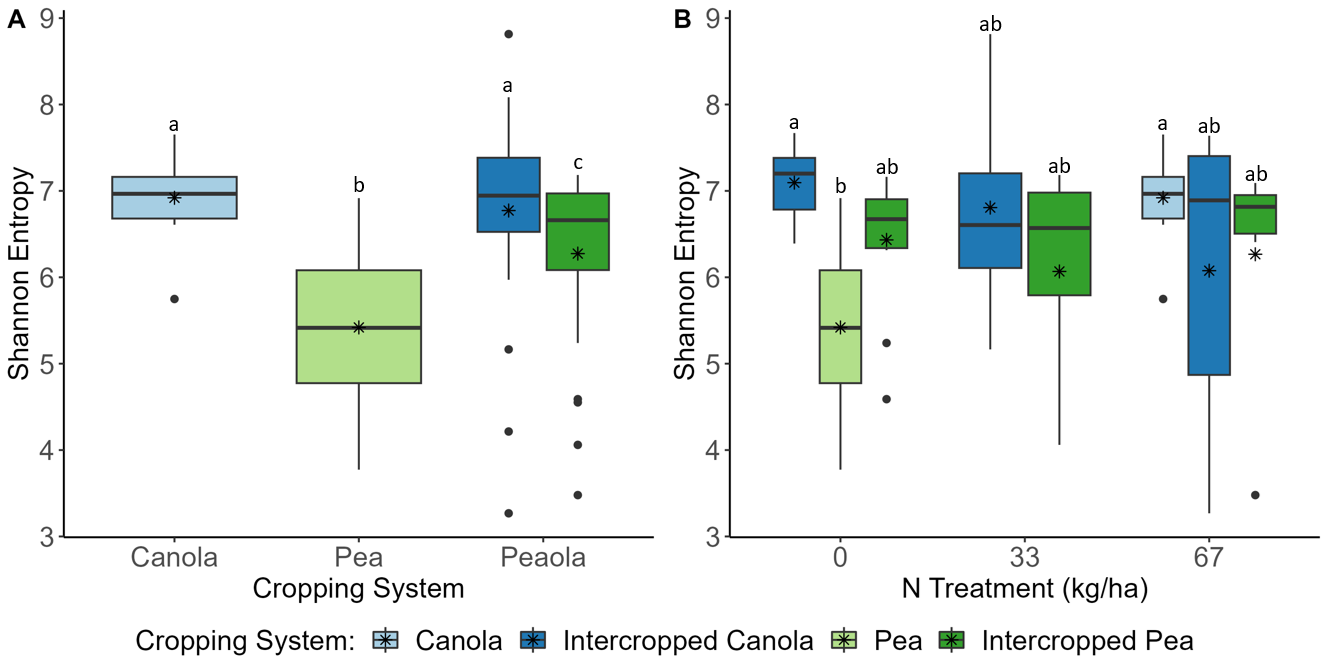
communities across A) crop types and B) with the combined effects of crop type and fertilizer
treatments. Different letters indicate significant differences.
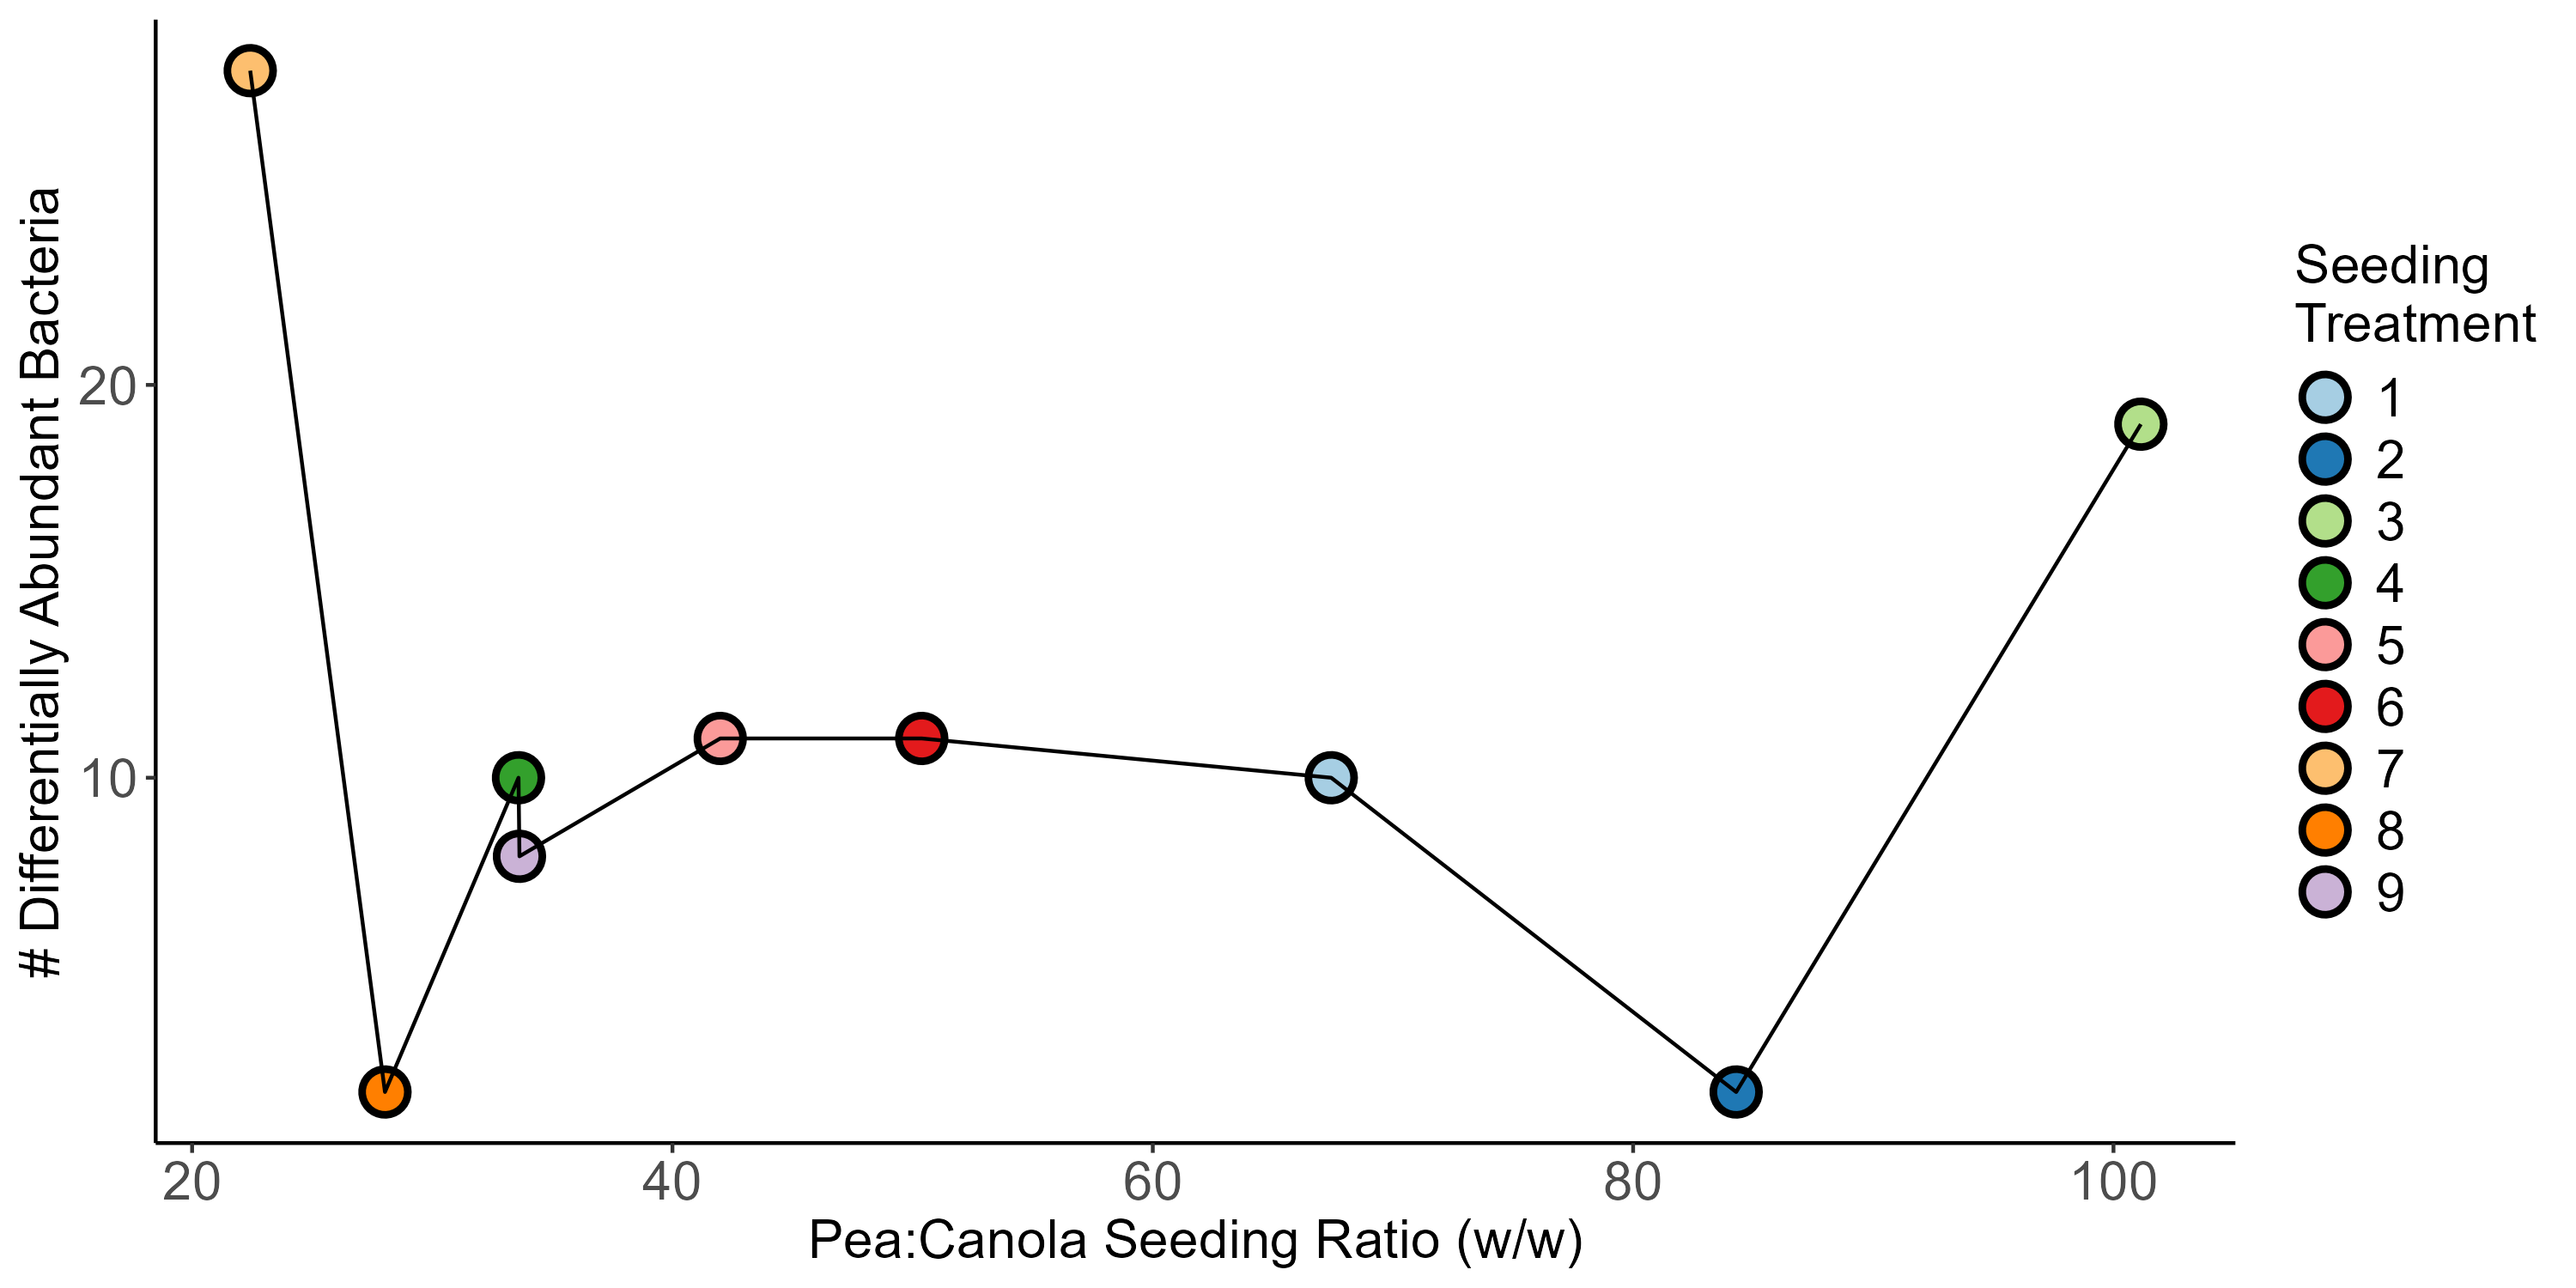
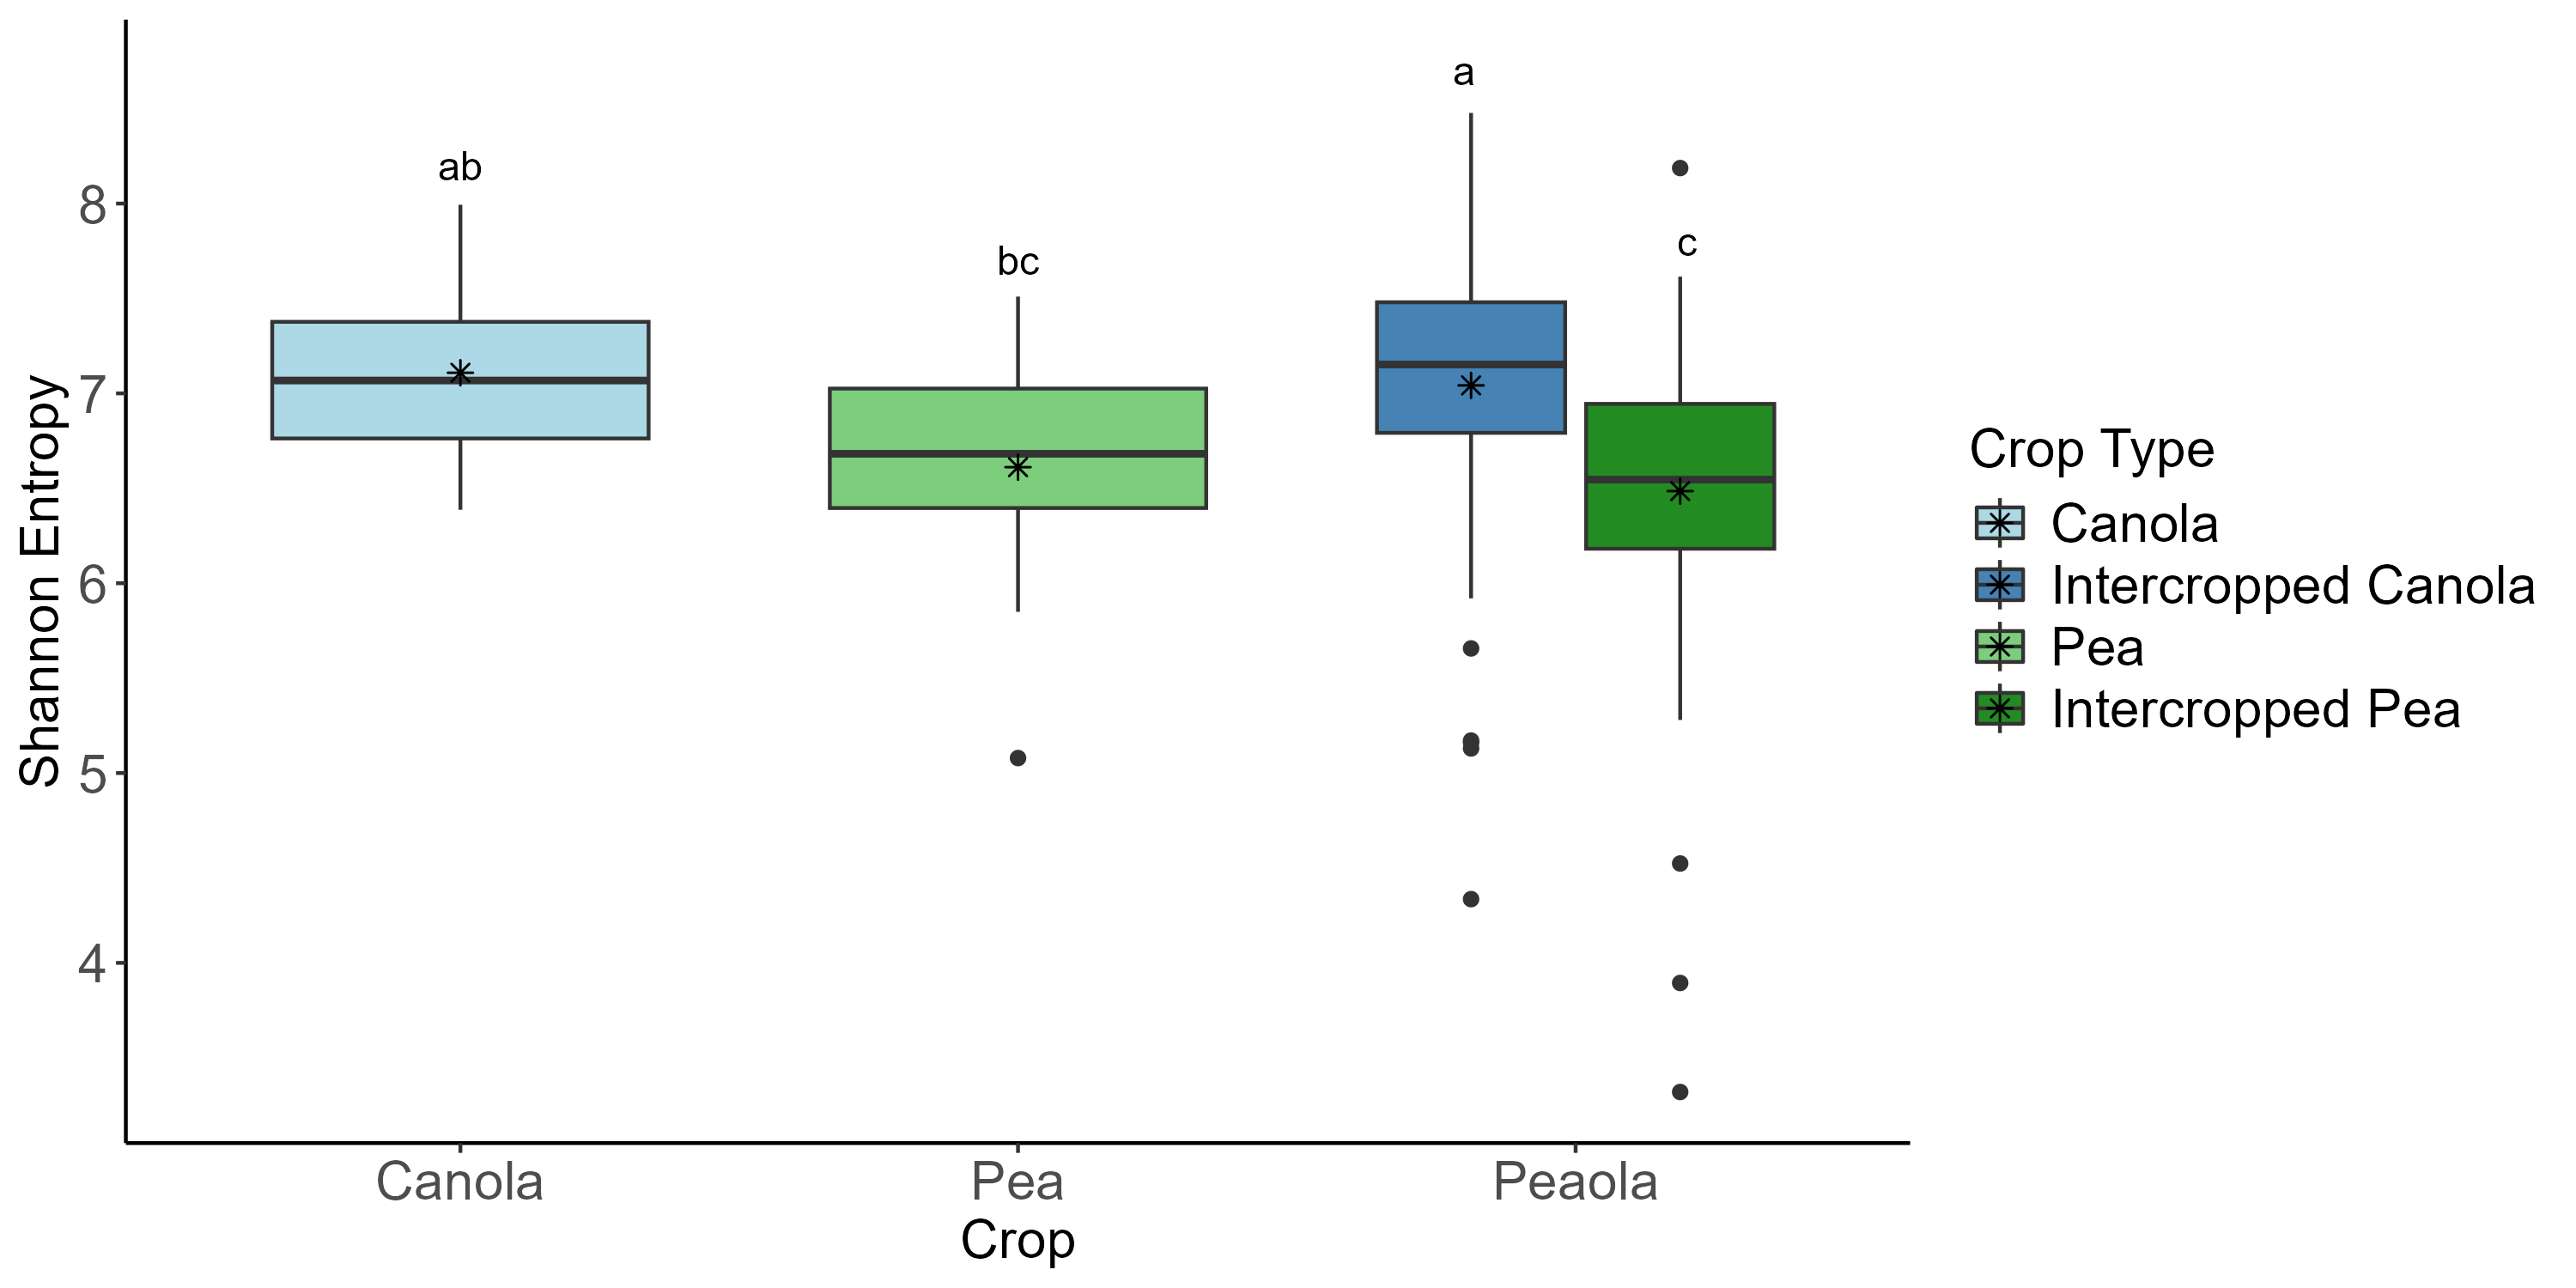
The 2022 soil samples showed similar patterns to what we had observed in our other datasets, as no significant differences were found across all of the analyses we performed. Rhizosphere samples showed similar patterns to what we had observed in our other two datasets. We did see that the intercropped canola microbial community was more diverse than the intercropped pea microbial community (Kruskal-Wallis, H = 39.76, P < 0.0001) and
monoculture pea (Kruskal-Wallis, H = 6.02, P = 0.028). , however (Figure 8). Again, crop type was found to be the largest contributor to variance in the data, accounting for 16%. Block and seeding treatment accounted for 4% each, and cropping system accounted for less than 1%. Few patterns were observed to be associated with pea and canola seeding rates, although we did see differentially abundant ASVs did seem to be impacted by seeding rate. More specifically, we found that there were more differentially abundant ASVs at the largest and smallest pea:canola seeding ratios (Figure 9). The second largest and second smallest pea:canola seeding ratios had the fewest differentially abundant ASVs (Figure 9). Differentially abundant predicted KOMPs associated with nitrogen cycling processes did not show any clear pattern associated with pea:canola seeding ratios.
For roots, we saw similar patterns to what we saw in our rhizosphere samples, but differences were even more pronounced. Consistently across studies canola roots were found to be more diverse than pea roots (P < 0.05). The only exception was observed in our 2022 samples where there was only a significant differences between intercropped canola and intercropped pea (Kruskal-Wallis, H = 11.87, P = 0.0034), with intercropped canola having greater diversity. Consistently, canola and pea roots had significantly different community compositions regardless of crop type and treatment. The only cases where differences were observed between roots from like crops (i.e. canola versus intercropped canola) were seen in our 2021 samples with intercropped canola at 67 kg N ha-1 having a different community composition than monoculture canola (PERMANOVA, F = 1.63, P = 0.036) and intercropped canola with no nitrogen fertilizer (PERMANOVA, F = 1.88, P = 0.013). Like with our rhizosphere samples, crop type accounted for the majority of the variance observed within our samples accounting for 49%, 46%, and 18% for the 2020, 2021, and 2022 datasets respectively. Differentially abundant taxa were observed between pea and canola across cropping systems and treatments for all three studies. Unlike for our rhizosphere samples in 2021, we saw an increase in the number of differentially abundant bacteria between canola and pea with increasing nitrogen fertilizer application, although no differentially abundant bacteria were seen at 67 kg N ha-1. Variation in the number of differentially abundant bacteria was observed across different seeding treatments in our 2022 samples, but more work needs to be done to determine if there is a pattern associated with this variation and pea:canola seeding ratio. Additionally, differences were observed in the number of differentially abundant predicted KOMPs involved in nitrogen cycling processes between canola and pea across cropping systems and treatments. More work needs to be done to determine if there are patterns associated with these results and the associated treatments.
We analyzed the strict bacterial core microbiome in our study, consisting of bacteria found in 100% of our samples. Across all of our soil and rhizosphere sampling, we found that there was variation in the composition of the core microbiomes based on crop type, cropping system, and treatment (i.e. nitrogen fertilization rate or seeding treatment). In some cases, unique ASVs were found to be present in the core microbiomes of peaola, although some ASVs were always shared between all the core microbiomes analyzed. Both unique and share members were consistently found to identified as bacteria known to have plant growth promoting traits, or to be involved in nutrient cycling processes. For root samples, variation was still observed across cropping systems and treatment groups. Root core microbiomes shared fewer core members, with only one core ASV found to be shared across all core microbiomes in 2020 and none found to be shared across all the root core microbiomes in 2021 and 2022. Instead, root core microbiomes tended to be more heavily unique to a single sample set or crop type (i.e. canola and intercropped canola). Further work needs to be done to determine the roles of the ASVs identified in the root core microbiomes.
Network Analysis
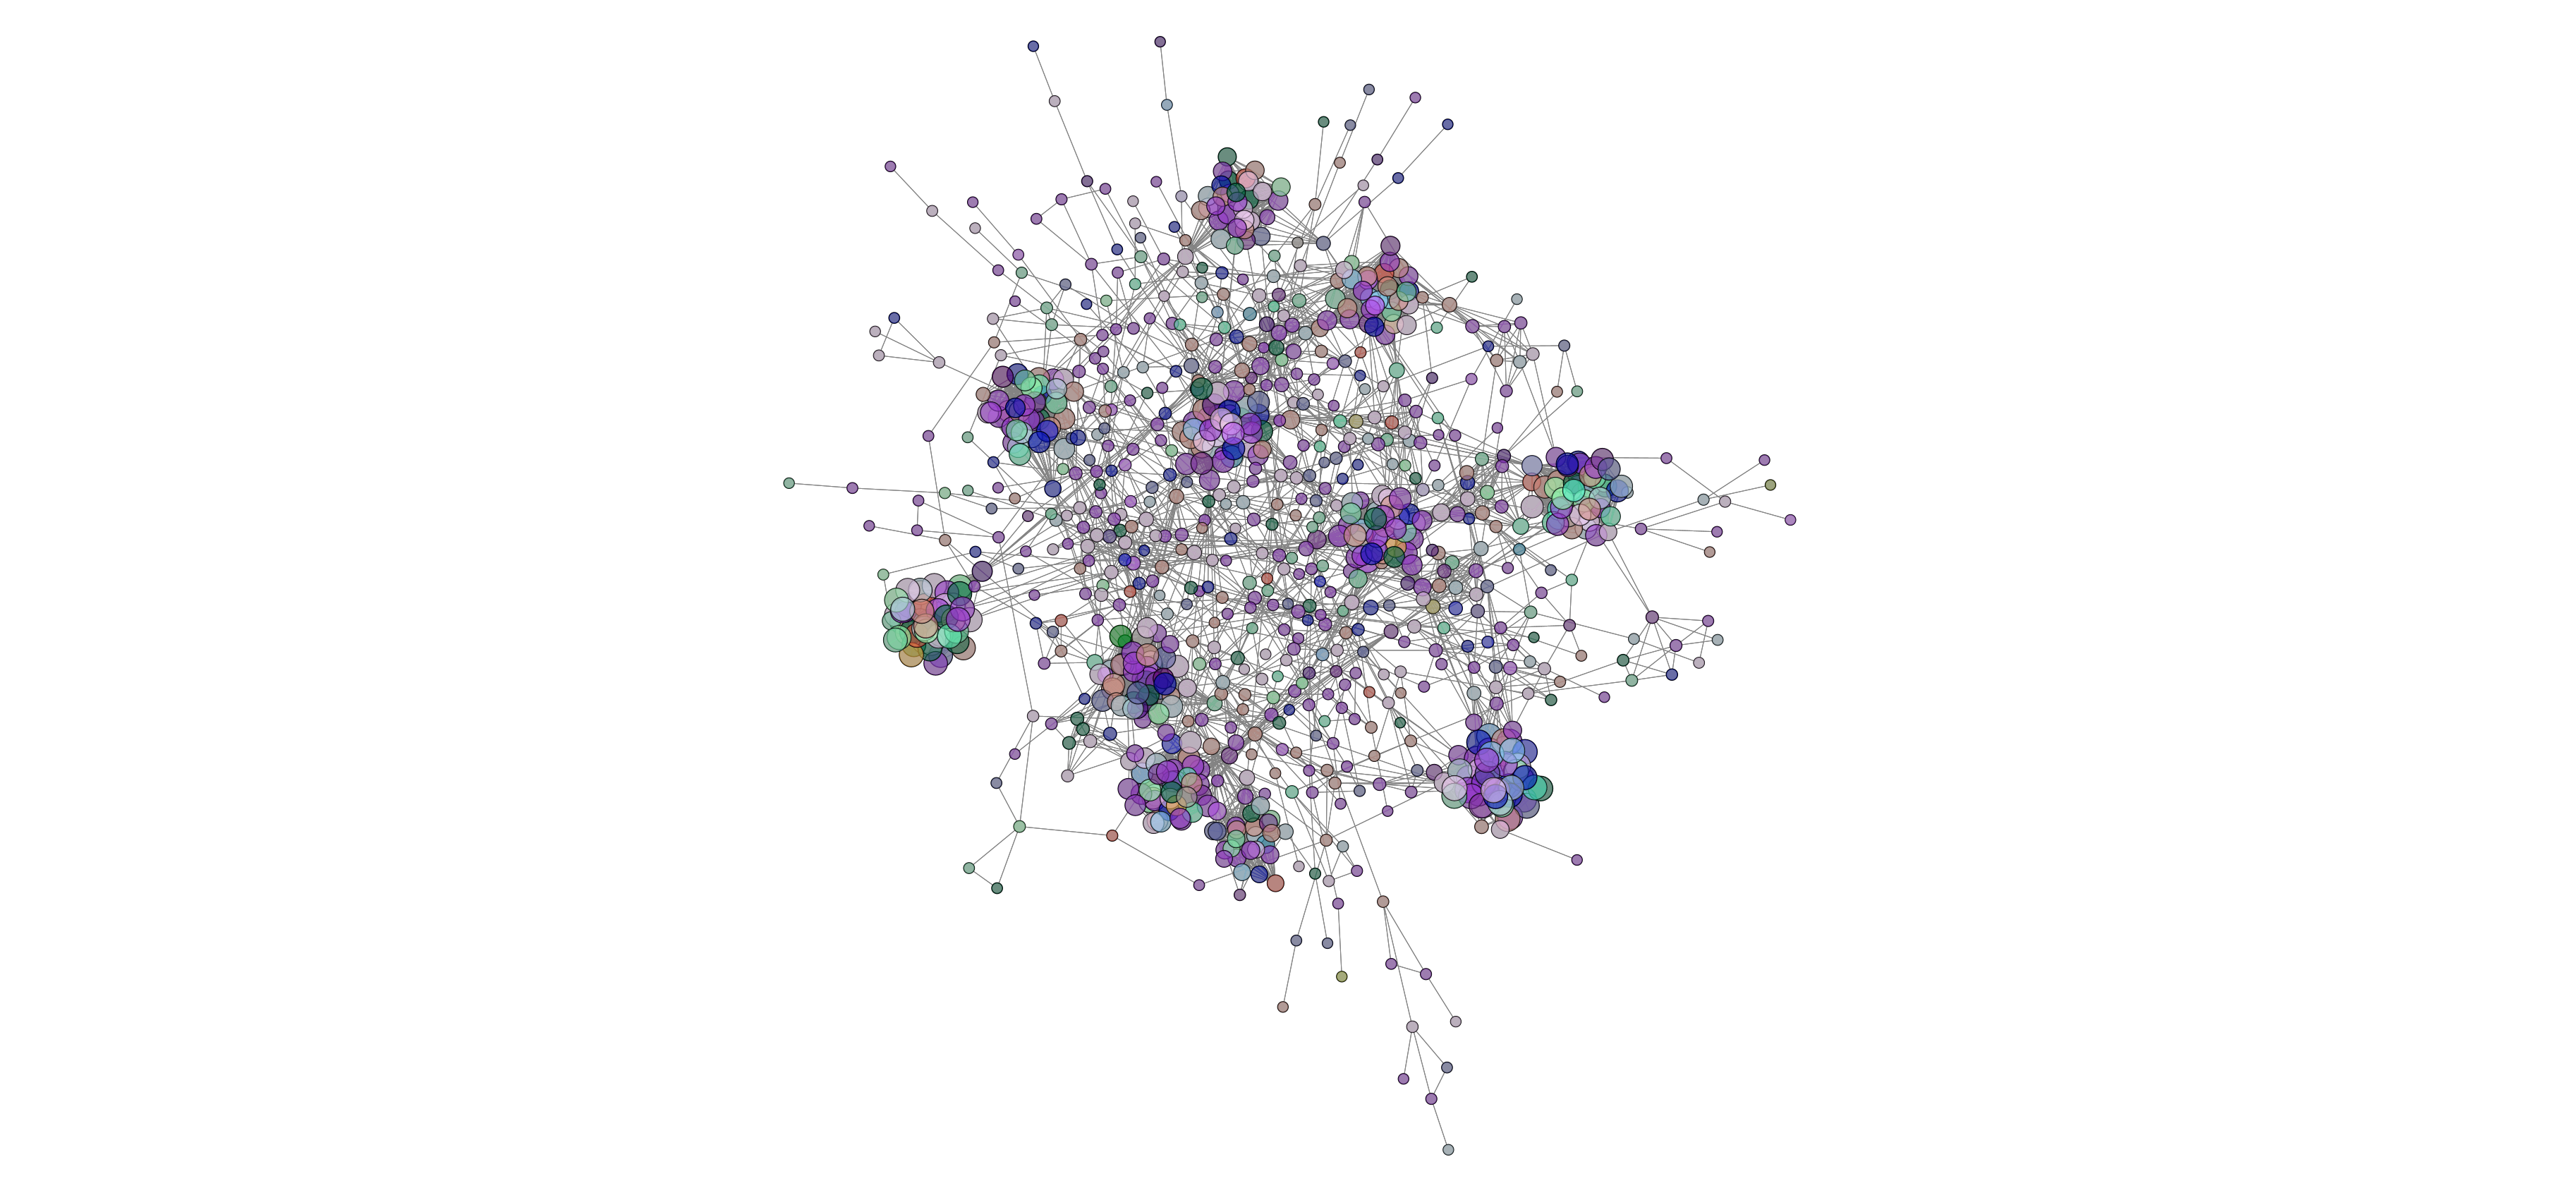
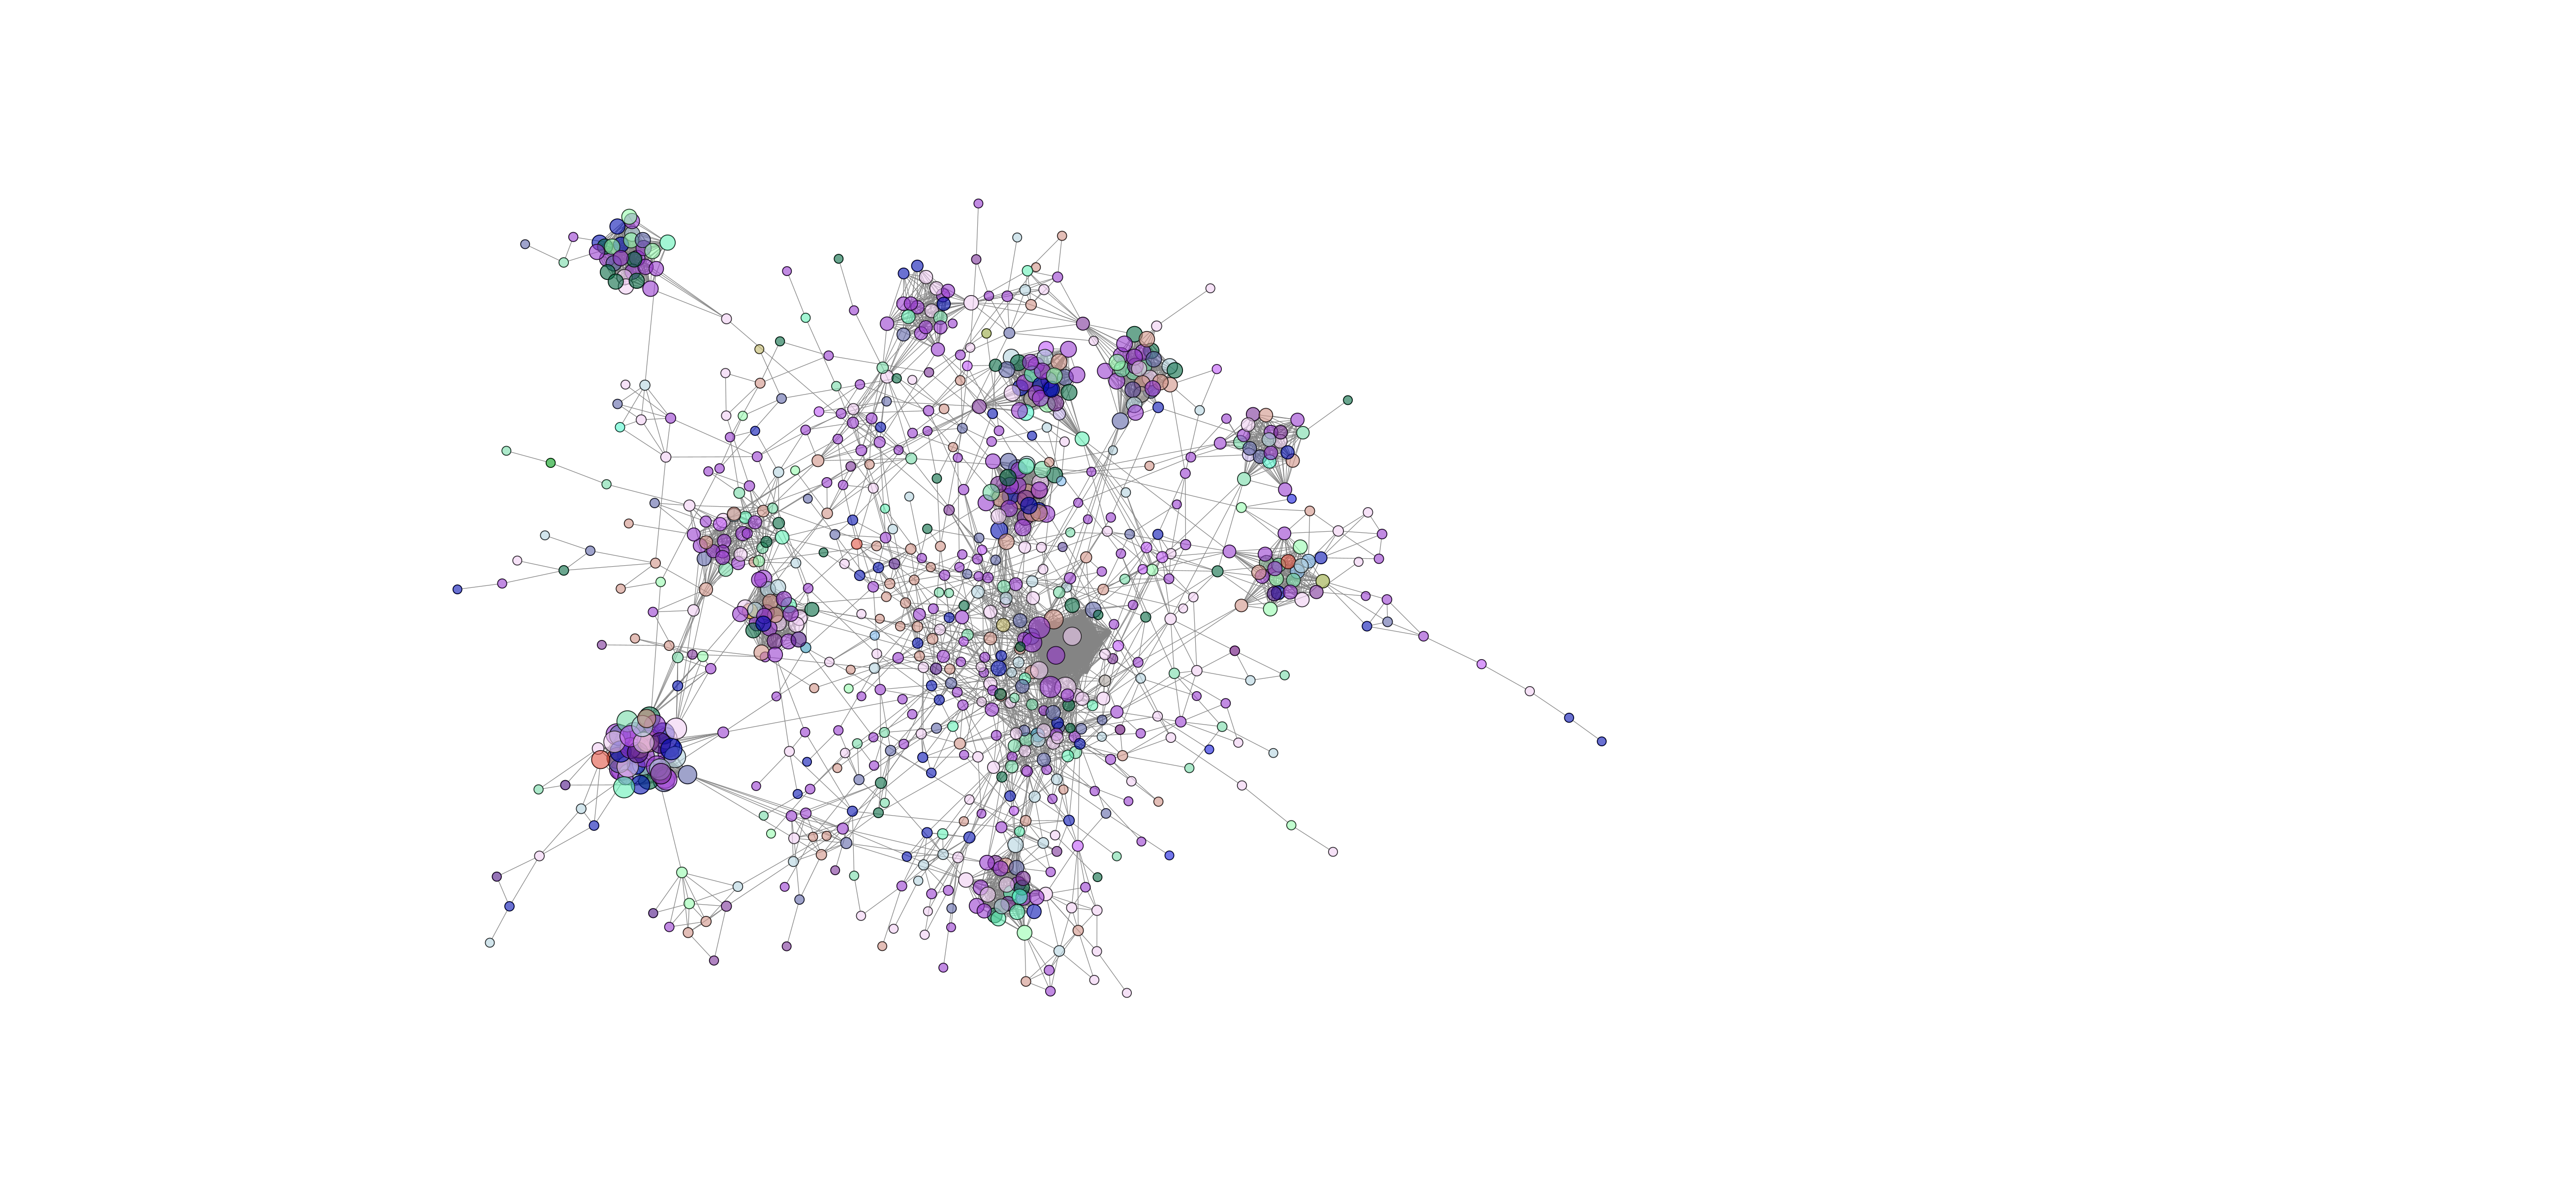
Network analysis using SPIEC-EASI was performed successfully at the genus level on the 2020 soil samples. The peaola co-occurence network consists of 1016 nodes and 10,058 edges (Figure 10). The canola monoculture network consists of 965 nodes and 8330 edges and the pea monoculture network consisted of 984 nodes and 8674 edges (Figures 11 and 12).
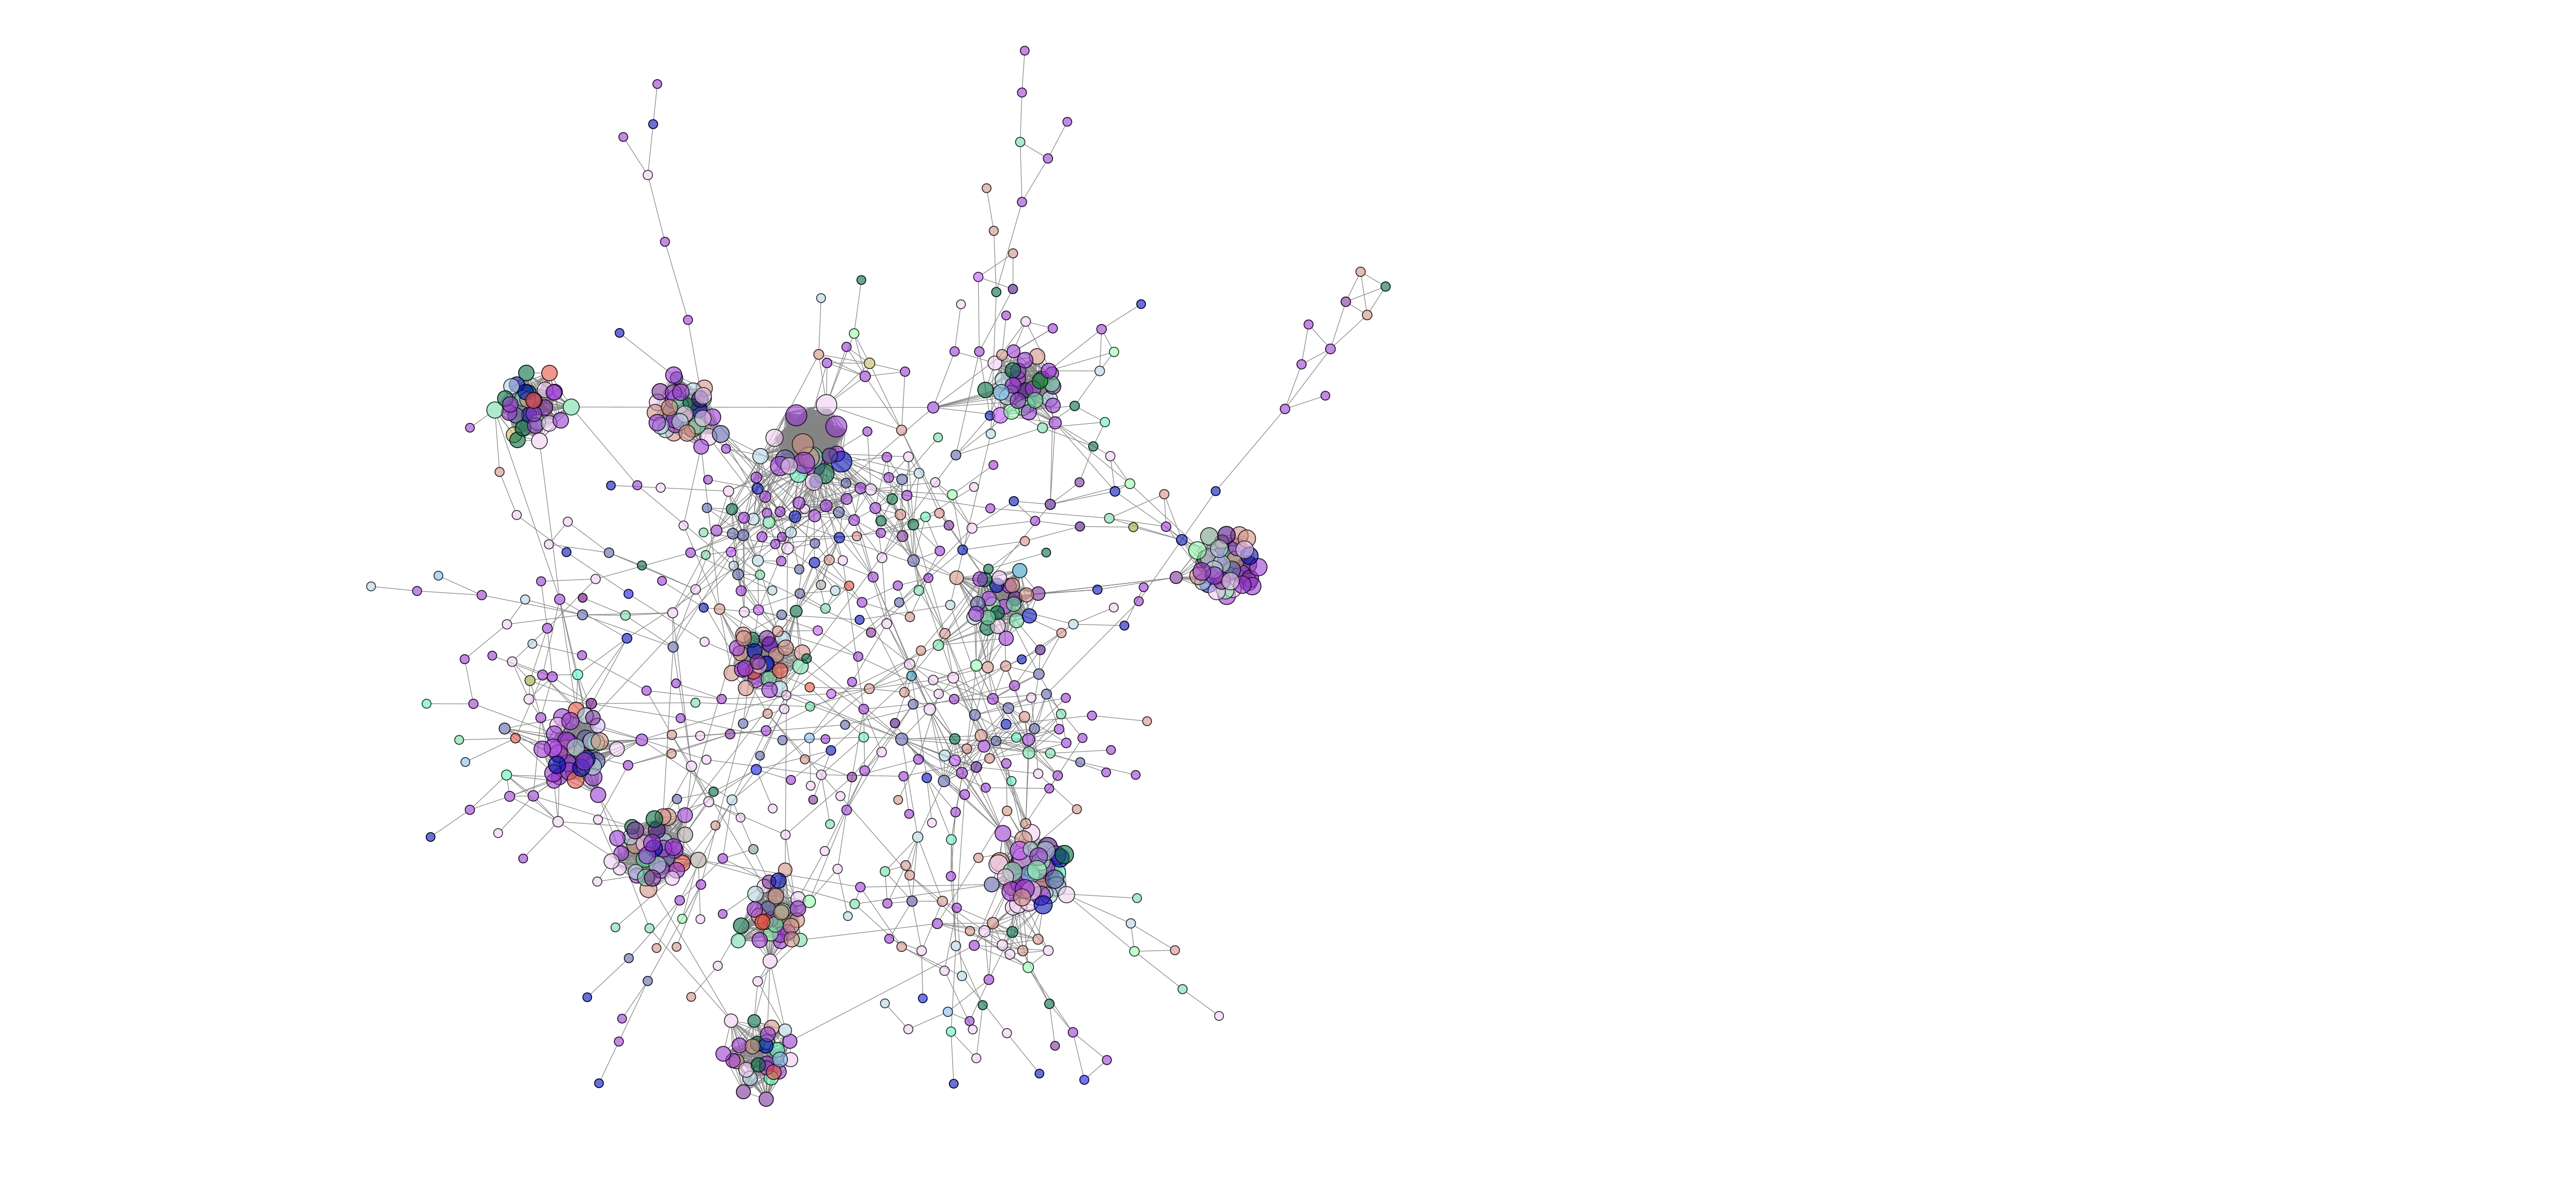
This shows that there is a change in the structure of the microbial community from monoculture pea and canola to peaola, which can also be seen visually (Figures 10, 11, 12). Although there are nodes that are more highly connected than others, there does not appear to be any one node that is more highly connected than the others. Instead, there are clusters of highly connected nodes found throughout all 3 networks. These results affirmed that there are changes occurring in the composition and structure of the microbial communities from monoculture to peaola, which was shown by our microbial community analyses.
Stable Isotope Analysis
In 2020, we saw no significant differences in the leaf nitrogen content across all three crop types. In 2022, we saw that intercropped canola had significantly more nitrogen in its leaf tissue than monoculture canola (t(228) = -2.88, P = 0.026; Figure 13). No pattern was seen in association with differences in seeding treatment and leaf nitrogen content. Comparisons were not able to be performed on samples collected from Mark Greene's plots as a result of him only planting peaola as a result of spatial constraints.

Discussion
Land Equivalent Ratio and Yield Analysis
It is not surprising that the peaola system did not appear to benefit from increasing the rates of synthetic N fertilizer, as previous work done on legume-oilseed intercropping has found similar results (Porter et al., 2020). Despite these results, more work needs to be done to determine if the peaola cropping system can be grown independently of N fertilizer application. Largely, this is due to there being a potential that N was not a limiting factor in the crops grown in this study. Therefore, future research should address if N is being transferred from peas to canola via plant-plant-microbe interactions. This research will help us determine if these interactions are responsible for the increased LER with decreased synthetic N inputs of peaola. The relative yield of peas to canola, calculated based on monoculture pea and canola, showed that winter peaola did not strongly favor either pea or canola. Although some studies have found that pea is favored over canola in overyielding peaola, our data align with the majority of studies on peaola with an overall LER of 1.63 with neither pea nor canola being strongly favored (Fletcher et al., 2016). The crop grown in 2021 at the Greene farm likely experienced failure of its pea crop due to extreme weather conditions around the time of flowering. This is because heat is known to decrease yield in both pea and canola, especially around flowering (Mohapatra et al., 2020). Yield data was unable to be collected for 2022 as a result of herbivory damage from deer.
Microbial Community Analysis
Through our analyses of the α-diversity and β-diversity of the microbial communities in the soil and rhizosphere, we did not find that intercropping pea and canola had a large impact on the diversity of the microbial community alone. Changes do seem to be occurring more on an individual level (i.e. to specific ASVs) within the community as demonstrated by our differential abundance analysis. Additionally, there does seem to be changes in predicted KOMPs associated with nitrogen cycling processes. Further work should be performed to confirm the presence of these KOMPs and if they are differentially abundant within the comparisons we performed for 2020, 2021, and 2022. The results from the sample taken in 2021 and 2022 do show that crop management practices do have a significant impact on microbial communities, although these impacts are likely mediated by plant responses to changes in abiotic and biotic factors resulting from these management practices. Overall, it appears that nitrogen fertilizer application is causing a homogenization of the rhizosphere microbial communities. In root communities, the opposite seems to be occurring with there being an increase in differentially abundant bacteria up until 67 kg N ha-1. Differences in pea:canola seeding ratios do not appear to have predictable impacts on the microbial community of peaola, although there does appear to be some sort of pattern when looking at differentially abundant ASVs across pea:canola seeding ratios. Further work should be done to analyze this pattern. Additionally, a yield study should be conducted on peaola at different pea:canola seeding ratios in order to determine the impact this has on peaola LER in order for us to make any determinations on which method is the most productive.
Network Analysis
Based on the changes in the number of nodes and edges found in the networks from pea and canola to peaola, it is clear that there is a change in the structure of the microbial community. There is also the potential that this is demonstrating the combining of the pea and canola microbial communities in peaola as we saw through our microbial community analysis. As this analysis did not show us new information about changes occurring in the microbial community from our community analysis, we did not perform this analysis on any other samples.
Stable Isotope Analysis
Generally, not significant differences were observed in the nitrogen content of leaves despite changes in cropping system and management practices. This could be as a result of plants receiving all of the nitrogen they need in order to successfully reproduce and set seed. We did see in our 2022 study that intercropped canola had significantly greater leaf nitrogen content than monoculture canola, which does provide support to our hypothesis that nitrogen is more available to canola in the peaola intercropping system. As we did not observe this result in our other two studies, it is possible that variation in abiotic and biotic factors may impact whether or not this is true. Further studies should be conducted to answer this question and determine the conditions under which canola is observed to have great leaf nitrogen content than monoculture canola.
Sources
Dowling A, Victor SO, Penny R, Ashlea D, Yi Z, Matthew DD. Legume-oilseed intercropping in mechanised broadacre agriculture – a review. Field Crops Research. (2021) 260:107980. doi: https://doi.org/10.1016/j.fcr.2020.107980
Fletcher AL, Kirkegaard JA, Peoples MB, Robertson MJ, Whish J, Swan AD. Prospects to utilise intercrops and crop variety mixtures in mechanised, rain-fed, temperate cropping systems. In: Crop and Pasture Science, Vol. 67. CSIRO (2016). p. 1252–67. doi: 10.1071/CP16211
Mohapatra C, Chand R, Tiwari JK, Singh AK. Effect of heat stress during flowering and pod formation in pea (Pisum sativum physiology L). Mol Biol Plants. (2020) 26:1119–25. doi: 10.1007/s12298-020-00803-4
Porter MJ, Pan WL, Schillinger WF, Madsen IJ, Sowers KE, Tao H. Winter canola response to soil and fertilizer nitrogen in semiarid mediterranean conditions. Agron J. (2020) 112:801–14. doi: 10.1002/agj2.20119
Research outcomes
The results of our study show that crop type is the number one driver of microbial community structure and function. This is not too surprising, as plants are known to alter their microbial communities based on their needs. Our results are suggestive that alterations to nutrient availability whether due to fertilizer application or plant-plant interactions may have indirect effects on the composition and function of the microbial community based on how plants respond to these alterations. Considerations should be made as to how plants will be interacting in an intercropping system in order to develop productive and sustainable systems. Additionally, if growers intend to alter microbial communities for the purposes of improving crop yield through nutrient availability, our results suggest accomplishing these results through manipulation of the crops involved rather than manipulating the microbiome itself. Further research should be conducted to investigate if the differentially predicted KOMPs we observed are actually present in each microbial community and if they are differentially abundant. This is an important next step that in helping us determine what recommendations, if any, should be made to growers regarding crop management practices and intercropping.
Education and Outreach
Participation summary:
A journal article was published on June 30th in Frontiers in Soil Science that detailed the findings of the microbial community analyses along with data collected by Dr. Isaac Madsen on crop yield, land equivalent ratio, and N response. This article can be found at the link and has the DOI: 10.3389/fsoil.2022.818862. It has also been included as a product associated with this grant. Two separate conferences were also attended. One was WA SoilCon, where a recorded lightning talk was given on the findings for the microbial community analysis
. The slide deck associated with this talk is included as a product. The second conference was the 2022 Soil Ecology Society Conference held at the Pacific Northwest National Laboratory in Richland, WA where a poster presentation was given on the findings from the microbial community analysis with a quick introduction given on the co-occurrence networks which is included as a product. A brief overview of the work done on this project was presented at the 2022 ARCS site visit that was on February 10th, 2022. The Western SARE survey was distributed retrospectively to conference attendees of WA SoilCon and the Soil Ecology Society Conference.In the Fall of 2022, a virtual talk was given at the WSU Farmer’s Network Soil Health Coffee Hour presenting the results that we had at the time of the talk included as a product. The Western SARE survey was distributed to attendees, but none were returned. In 2023, a poster presentation was given at the WSU Plant Science Retreat in Pullman, WA that showed results for our analysis of the core microbiome which is included as a product. This poster also included data from greenhouse experiments done to determine if N is being transferred from pea to canola. A review article covering the role of plant-microbe interactions on legume non-legume intercropping success was published in Plant and Soil, and is included as a product associated with this grant. In this review the manuscript published in Frontiers in Soil Science DOI: 10.3389/fsoil.2022.818862 in 2022 was cited. This grant was cited in that review as a source of funding. An article was wrote about Janice Parks by her undergraduate institution where some of the findings from this project, along with her recent publication, were discussed (Alumna Janice Parks '20 Builds On Pacific Research Foundation | Pacific University). This article was sent to all subscribers of Pacific University's magazine/newsletter and was shared via Pacific University's LinkedIn page.
Janice presented at four different events in 2024 with two being specifically geared towards growers and producers. These events were the WSU Farmer's Network Soil Health Coffee Hour, Molecular Plant Sciences seminar, the Pacific Northwest Canola Association Annual Meeting, and the WSU Plant Science Retreat. These presentation materials are included as products associated with this project. WSARE surveys were distributed to participants of these events upon event conclusion. In addition, Janice presented work produced from this grant during her dissertation defense on October 25th. This presentation is also included as a product. Her dissertation will be available to the public after a one year embargo period. She will be presenting on the results of her soil and rhizosphere analysis for the 2021 samples during a Poster Flash Talk at the International Phytobiomes conference on November 19th, 2024. At least four more papers are expected to be produced as a result of funding from this project. We intend to submit these papers to the Oikos, Phytobiomes, and Plant and Soil journals.
Our education and outreach events did reach producers and professionals. Based on the results of our surveys, it appears that those who did fill them out took something away from the talks and posters we presented. For producers, it appears that the biggest impact our work had on them was that they would use the information they gained to increase their networking with other producers (5 responses indicating this) followed by the adoption of new practices (3 responses) and increasing the diversity of their operation(s) (2 responses). The top response we received from professionals is that they would be using the information we provided to make resources for producers (5 responses indicating this). Four of the responses we received from professional indicated that they will be using the information we provided to improve the advice/counsel they give to producers, followed by use of the information in an educational program (3 responses) and use of the information as a professional development tool (2 responses). We also received the following five responses how professionals plan to use the information we provided for educational purposes:
"I will make the provided three scientific documents available to growers I work with and offer discussion of subject."
"Field Trials and Grower Interpretation of the Value of Intercropping"
"Very likely, encouraging intercropping practices is important for soil health but the logistics of planting, harvesting/cleaning, and marketing are difficult."