Progress report for GW24-003
Project Information
(Notes for report: none of this has changed except for coffee hour)
Our project aims to assess the effect of cover crops on the hydrology and health of Willamette Valley hazelnut orchards. This research and educational study responds to preliminary results revealing concerns about cover crop adoption, which emphasized the need for detailed field-level research in regard to water availability. The main goal of this study is to collect and assess region and crop-specific data on orchard hydrology and plant-water interactions to help form informed decisions regarding cover crop use. More specifically, we want to determine how different ground cover management practices affect field hydrology and orchard health. To achieve this we will 1) utilize multiple weather stations, along with open-source satellite data, to obtain ET, 2) analyze the effects of cover crops on soil moisture and infiltration using soil moisture probes, 3) use remote sensing techniques to facilitate a comprehensive assessment of orchard-scale plant health through NDVI, 4) assess relationships between all parameters. This analysis will offer a nuanced understanding of how different cover crop management practices impact orchard health. The project will be conducted in collaboration with hazelnut producers who have already expressed interest in the research topic and will integrate growers' concerns with scientific inquiry, to optimize agricultural productivity and sustainability of hazelnut orchards. The findings will be presented at industry meetings, field days, and a monthly coffee hour in addition to journal publications. This project will provide a cover crop assessment framework that can be used for other crops along with science-backed data to aid with grower decision-making.
(Note for report: objectives are the same)
Research
Objectives:
- Objective 1 (RO1): Quantify the water requirements of hazelnut orchards with and without cover crops.
Evaluate and compare hazelnut evapotranspiration (ETc) estimates calculated using different methods including in-situ weather stations, nearby Agrimet weather stations, and satellite data, in order to understand the effect of cover crop management on water requirements of hazelnut operations in the Willamette Valley, OR.
- Objective 2 (RO2): Determine the effects of cover crops on soil moisture availability in1 hazelnut orchards.
Evaluate and compare soil moisture at two depths in hazelnut orchards with and without cover crops in the Willamette Valley, OR.
- Objective 3 (RO3): Assess crop health through advanced imaging technologies.
Assess hazelnut water stress and overall health by comparing data such as the Normalized Difference Vegetation Index (NDVI) and thermal imaging data within and between hazelnut orchards with and without cover crops.
- Objective 4 (RO4): Explore the interconnected dynamics of environmental factors.
Investigate how the implementation of cover crops in hazelnut orchards affect the relationships between ETc, soil moisture, and crop water stress.
Educational
Objectives:
- Objective 1 (EO1): Develop a centralized online resource for hazelnut orchard management.
Create a website to serve as a centralized resource and information hub on methods for irrigation practices, ETc estimation, and monitoring crop water status in hazelnut orchards.
- Objective 2 (EO2): Address grower concerns through field research demonstrations and facilitating effective knowledge transfer.
Investigate and disseminate research findings regarding the potential water and nutrient competition of cover crops in hazelnut orchards in the Willamette Valley. Effectively disseminate project information to growers and the supporting research and Extension community.
(Note for report: no change so far, may need no cost extension)
Cooperators
- - Producer
- (Researcher)
- - Producer
- - Producer
- - Producer
- - Producer
- - Producer
- - Producer
- (Researcher)
Research
Research objectives:
The project has four specific research objectives (ROs):
- Objective 1 (RO1): Quantify the water requirements of hazelnut orchards with and without cover crops - Evaluate and compare hazelnut evapotranspiration (ETc) estimates calculated using different methods including in-situ weather stations, nearby Agrimet weather stations, and satellite data, in order to understand the effect of cover crop management on water requirements of hazelnut operations in the Willamette Valley, OR.
- Objective 2 (RO2): Determine the effects of cover crops on soil moisture availability in hazelnut orchards - Evaluate and compare soil moisture at two depths in hazelnut orchards with and without cover crops in the Willamette Valley, OR.
- Objective 3 (RO3): Assess crop health through advanced imaging technologies - Assess hazelnut water stress and overall health by comparing data such as the Normalized Difference Vegetation Index (NDVI) and thermal imaging data within and between hazelnut orchards with and without cover crops.
- Objective 4 (RO4): Explore the interconnected dynamics of environmental factors. - Investigate how the implementation of cover crops in hazelnut orchards affects the relationships between ETc, soil moisture, and crop water stress.
Research plan:
Location selection:
The research is taking place at 16 plots across the Willamette Valley where each location has been selected as a representative site for one of three treatments. Some plots are located within the same farm where producers have areas with different ground cover. Initially, the selected treatments were grass, volunteer plant species, clover mix, and bare ground but we combined the grass and volunteer plant species treatments, to represent grass as the mixed fields were mostly composed of grasses. Each treatment is represented by at least 3 Willamette Valley orchards. To reduce variability, the sites were selected to have Missoula flood-influenced soil types. Table 1 below outlines the number of fields we have per treatment.
Table 1. Orchard plots per treatment
| Treatment | Number of Orchard Plots |
| Bare Ground | 7 |
| Clover | 4 |
| Grass | 5 |
Figure 1 below shows the locations of each plot and all AgriMet stations in the orchard vicinity.
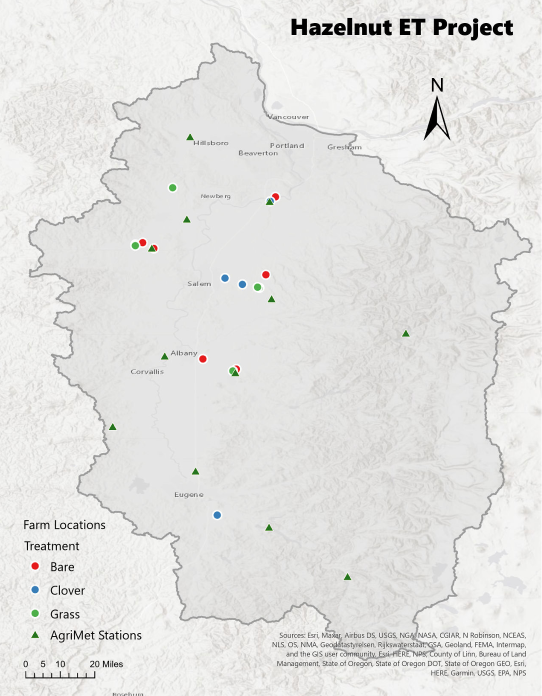
Figure 1. Willamette Valley study sites and AgriMet reference stations for the hazelnut evapotranspiration project, separated by ground-cover treatment (bare, clover, grass).
Data and Instrumentation:
Evapotranspiration - Below is a summary of the different methods for estimating ETc and for monitoring crop water use (RO1 and RO4). We choose the most appropriate method for estimating ETc based on each farm’s specific circumstance. More specifically, we have assessed whether the orchard is already equipped with an in-situ station, its proximity to an Agrimet location, and if there is other open-source weather data available nearby. Data collection across methods is performed during two crop-growing seasons.
- Satellite open-source ET data– Continuous research and development of remote sensing technologies has allowed ET to be estimated at the scale of individual fields. With an easy interface and continuous improvements, this method for obtaining field-specific ET has the potential to help hazelnut growers monitor crop water use and observe the dynamics of tree responses to a changing environment. We are downloading OpenET data for all 12 sites and are conducting an initial comparison with ETcvalues calculated with Kc from the ETo from the closest AgriMet station.
- Local meteorological/eddy covariance stations– Three of the orchards sampled for this study had stations collecting meteorological data, with two of those hosting an AgriMet station.
- Eddy-Covariance Towers - In July 2024 we deployed a pair of 6 m (20 ft) eddy-covariance (EC) towers to monitor two side-by-side hazelnut plot, one with grass cover crop and the other kept with bare ground. Each tower is equipped with all sensors necessary for energy balance calculation:
- Turbulent fluxes: IRGASON integrated 3-D sonic anemometer + open-path CO₂/H₂O analyzer (Campbell Scientific).
- Radiation: NR01 four-component net radiometer (Hukseflux).
- Micro-meteorology: HygroVue 10 air-temperature / RH probe, TE525 tipping-bucket rain gauge (Campbell Scientific / Texas Electronics).
- Ground heat storage: three HFP01-L soil-heat-flux plates (Hukseflux) and TCAV-L averaging thermocouples at 0–0.08 m depth.
Data is logged at 20 Hz on a CR1000X, averaged to 30-min files, and transmitted daily through a cellular module. Each station is powered by a 12-V battery charged by two 300 W photovoltaic panels, ensuring year-round operation. The mirrored instrumentation allows independent energy-balance‐closure checks for the grass and bare treatments, giving high-confidence evapotranspiration benchmarks for all subsequent remote-sensing and soil-water analyses. All hardware was acquired from completed Oregon State University projects and redeployed exclusively for this study.
- LiCOR 710 sensors - Additionally, we paired each eddy covariance tower with a LiCOR LI-710 evapotranspiration sensor to evaluate the performance of a new low-cost, grower-oriented alternative to full eddy covariance setup. The LI-710 reports fully processed 30-min ET by combining 10 Hz measurements of vertical wind speed with high-precision water-vapor density from an on-board RH sensor, and communicates the result over SDI-12 (LI-710 | Introduction to the LI-710, n.d.). Because it records only the vertical component of turbulence, the instrument cannot resolve horizontal momentum exchange; therefore, unlike a full EC system it cannot compute an explicit flux-footprint map and the exact up-wind source area remains implicit. Each LI-710 is connected to the same CR1000X logger as its co-located tower and records data on the identical 30-min schedule, enabling direct, time-synchronous comparisons of magnitude, diurnal pattern, and energy-balance behavior. The side-by-side deployment will provide producers with an objective assessment of whether this budget-friendly sensor can deliver field-ready ET data that are consistent with an established EC reference.
- Surface renewal station – a third location within the Willamette Valley, in close proximity to the plots with eddy-covariance towers, is equipped with a surface renewal station also paired with a LiCOR 710. Surface-renewal stations estimate crop or canopy ET by tracking fast temperature fluctuations in the air just above the surface. By pairing a fast-response thermocouple with a standard weather station, they translate the small turbulence-driven temperature spikes into sensible-heat flux, then derive water loss rates with a simple energy-balance calculation. Surface renewal stations are the lower-cost alternative to full eddy-covariance towers that still delivers field-scale actual ET. This station, along with a second one at the North Willamette Research and Extension Center are managed by Dr. Nik Wiman and provided through an independent and already funded project.
- AgriMet Weather Data – AgriMet is an open-source and no-cost network of agricultural weather stations (AgriMet General Information | Bureau of Reclamation, 2016) that provides daily environmental data for different regions throughout the Pacific Northwest. One of the estimated variables is reference ET (ETo) based on alfalfa and grass. Farmers can use this information along with crop-specific Kc values to calculate ETc for their specific crop water use needs. In this study, AgriMet data from the nearest station will be used to estimate ETc for each research site. Additionally, two of the plots in this study are collocated with an AgriMet station.
Soil Moisture and Temperature - To better evaluate crop water use and periods of water stress (RO2) and to better characterize the effect of the treatments on final variables (RO4), we are collecting continuous soil moisture data from the root zone of the trees in each ground cover treatment. Soil moisture sensors (SMS) were installed at three depths, 6 and 18 and 36 inches.
- Meter Group Teros 10/12 – For the purpose of this study, we used an already existing supply of Teros 10/12 sensors, provided by both Co-PIs which include Zentra Boxes for remote data access through the Meter Group Zentra Cloud service. This compact and long-lasting instrument measures the volumetric water content, temperature, and electric conductivity of soil. It connects to a data logger which uploads all data to a cloud-based system allowing for remote data access (TEROS 12, 2021).
Satellite Remote Sensing Data- In order to assess plant health and water status, we are using a combination of open-source satellite imagery to obtain multispectral, high-resolution data for NDVI calculation (RO3 and RO4). To achieve this, we will use the following resources.
- Landsat 8/9 – These instruments are a collaboration between the USGS and NASA and were launched to space in 2013 and 2021 respectively. The multispectral data provided by the satellites has 30-meter spatial resolution and 16 day revisit time. However, the pair is synchronous which results in an 8 day revisit time. All data is open source, it is easily accessible by the public and can be visualized by multiple platforms across the web (Landsat 8 | U.S. Geological Survey, n.d.)
- Sentinel-1/2 – Launched as a pair of satellites by the European Space Commission, Sentinel-1/2 provides multispectral data with a 10-meter resolution and a 5-day revisit time. The data is also open-source and easily accessible similar to the data from Landsat 8/9 (Sentinel-2 - Missions - Sentinel Online, n.d.).
- Private Satellite Companies – Depending on cloud cover and data availability, we will also utilize private satellite data such as the multispectral datasets from Planet Labs. This company provides free access to researchers which allows us to creates near daily image collection for each plot. Additionally, the data has higher resolution than Landsat and Sentinel with pixel size of 3 m (Planet | Homepage, n.d.).
Complimentary data - All of the data collected for this project will be complimented by the data collected by our collaborators. Table 2 below includes ongoing data collection efforts which started in the summer of 2023 (RO4).
Table 2. Field data collected for this project and provided by collaborators.

Methodology:
The soil moisture probes, and EC tower installation took place over the summer of 2024 , starting in the beginning of May 2024. Immediately after installation, we began soil moisture and ET data collection at all 16 sites, which will continue for the entire 2 years of the study (RO1 and RO2). The soil moisture data is recorded in units of volumetric water content while the ET is either directly obtained from AgriMet or OpenET, or is calculated using the Penman-Monteith equation with local weather data.
We are continuously downloading multispectral data throughout the growing seasons of both years and will utilize software (ArcGIS) to calculate time series data of the NDVI of each field (RO3). The data is collected from open-source satellite repositories as mentioned above. Additionally, the Planet Labs datasets offer higher resolution multispectral data which allows us to create extensive NDVI time series for each plot. While this platform is not open-source, the data allows us to validate the NDVI values obtained through open-source platforms such as Landsat and Sentinel. We will further ground-truth our water stress assessment by obtaining observed crop stress data from the participating producers on a weekly/biweekly basis.
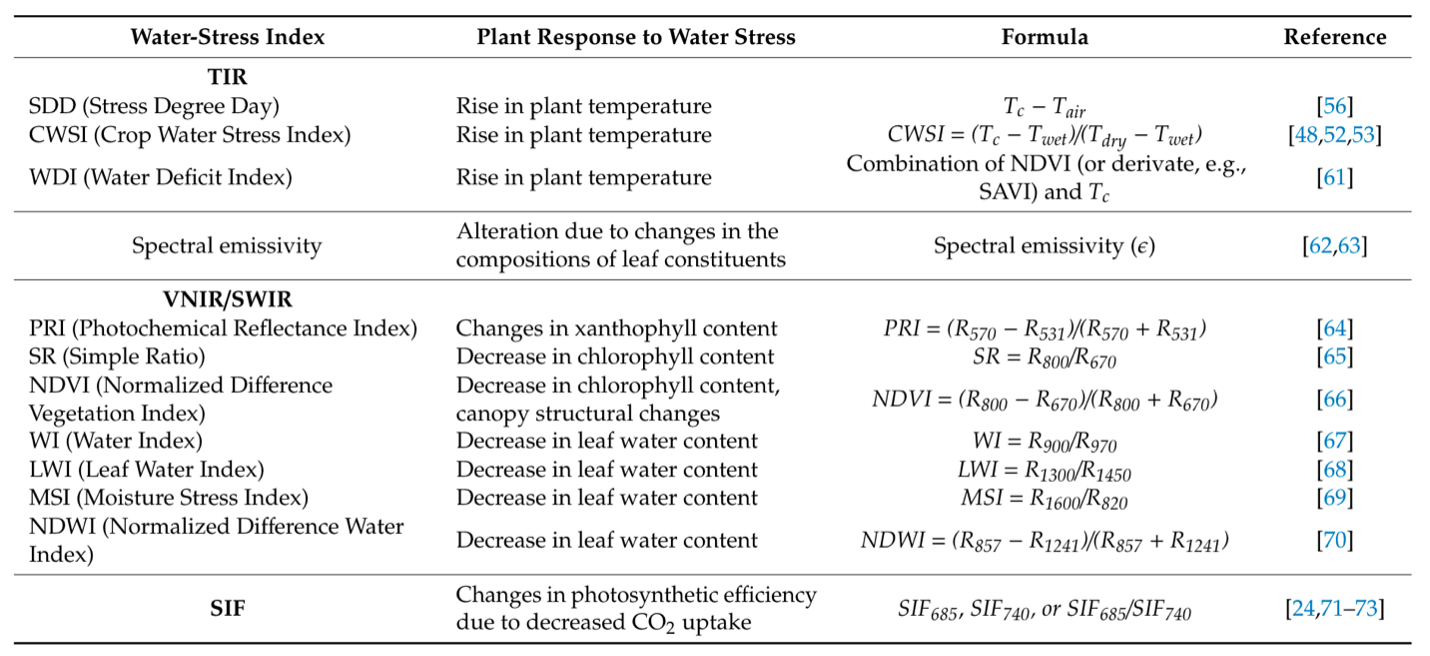
Table 3 below, adapted from Gerhards et al., 2019, represents different methods for calculating water stress related indices. During our project, we will collect and multispectral data, which will allow us to easily calculate most water stress indices.
Table 3. Common indices and approaches for crop water stress detection with remote sensing techniques (Gerhards et al., 2019).
The comprehensive data collection in this project, supplemented by collaborative data gathering, enables a detailed analysis of parameter relationships. This includes meteorological data, soil moisture, and remote sensing information, essential for evaluating crop water stress. It's crucial to consider the prolonged impact of drought conditions on orchard health. Current research efforts are focused on collecting data on yield, nut quality, and plant tissue, facilitating an in-depth assessment of each orchard, including its specific ground cover (RO4). This analysis aims to understand the implications of ground cover on field hydrology and plant stress mechanisms, which will provide a thorough understanding of the effects of ground cover on both field hydrology and plant stress.
Statistical analysis:
We are collecting data from 16 orchard sites throughout the Willamette Valley. The data will assess effects of orchard floor management treatments – bare ground, grass, and clover mix – on ET, soil moisture, and plant health.
Currently, we are summarizing collected data using visualization and descriptive statistics, uncovering the main characteristics within the data. These summaries are crucial for comparing features under each management treatment. Based on these characterizations, at the end of the field data collection, we will select appropriate statistical tests (e.g. ANOVA, linear regression) to identify significant results and develop methods to quantify observed differences. They will also estimate effects across different methods and sites. Additionally, we will use the data to develop statistical models that capture underlying trends and patterns, considering correlation and uncertainty in measurements.
For our analysis, we are utilizing Python, Google Earth Engine and ArcGIS. The ET data is collected and processed in LoggerNet (Campbell Scientific) with EasyFlux DL (Campbell Scientific).
Initial Results:
RO1: Quantify the water requirements of hazelnut orchards with and without cover crops
Grass vs Bare Ground Comparison – EC Towers: The first step in our evapotranspiration (ET) assessment was to screen data from the paired eddy-covariance (EC) towers that were fully deployed on August 1st, 2024. One tower is located at a hazelnut plot maintained with a resident grass cover crop (Tower 1) while the other samples an adjacent, vegetation-free plot (Tower 2).
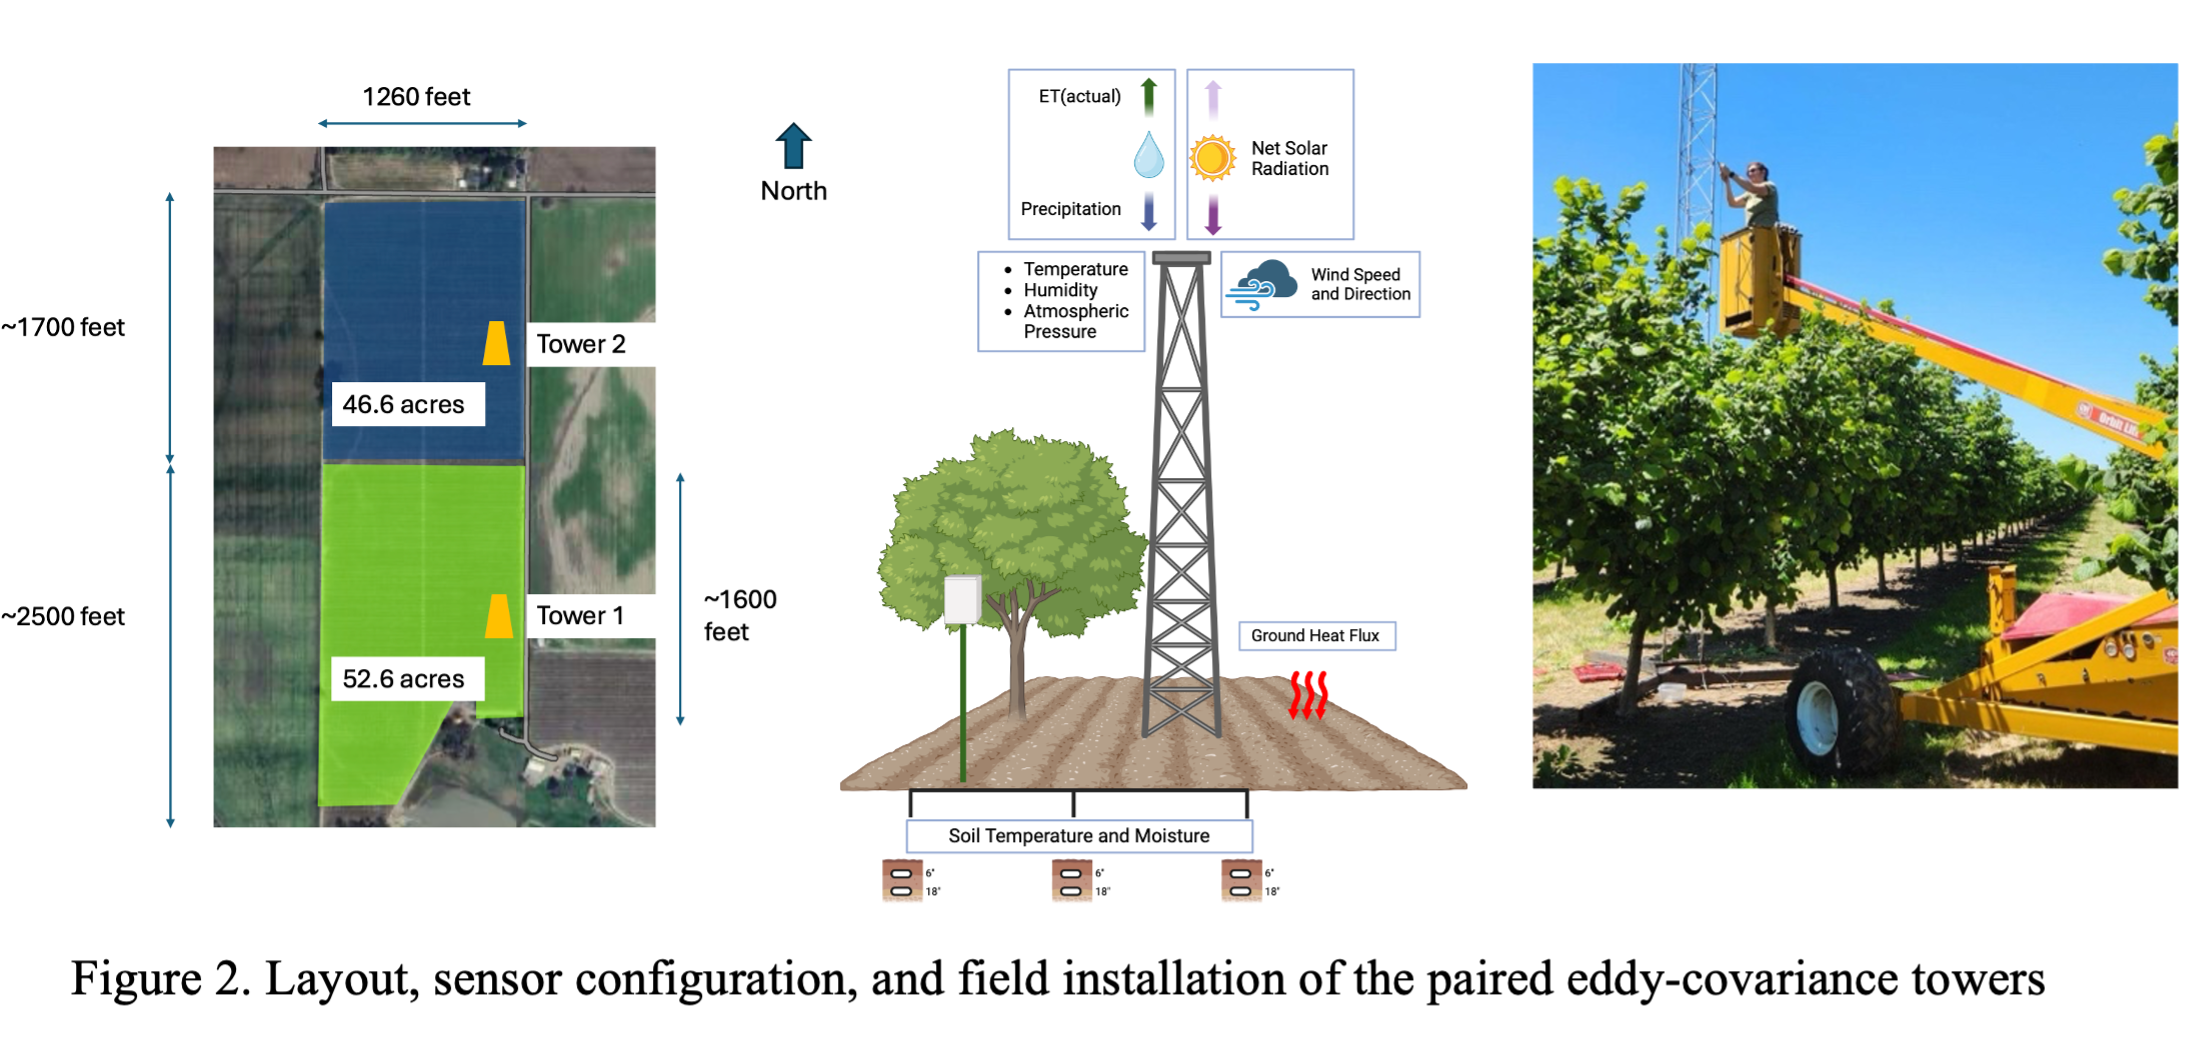
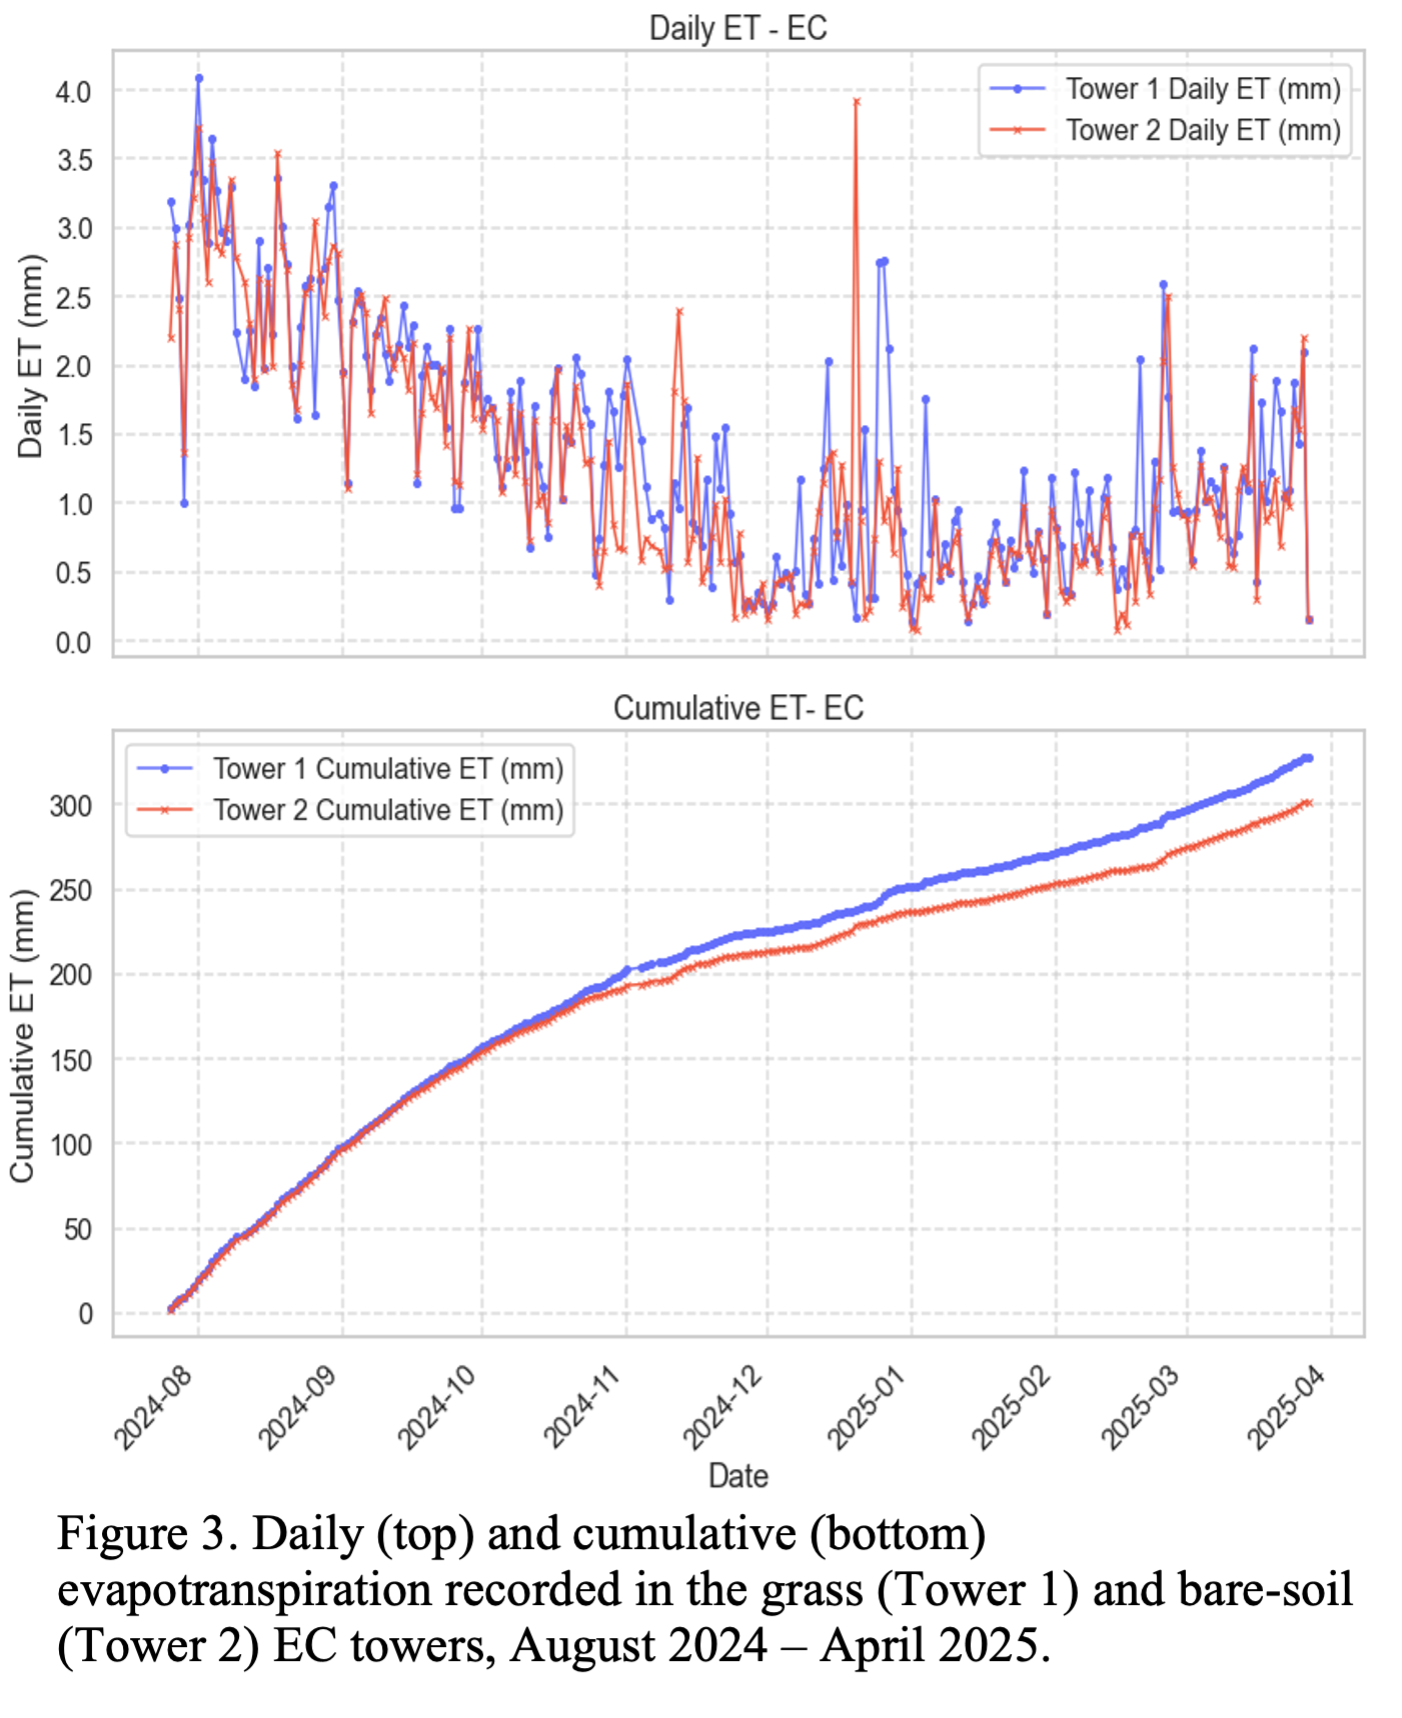
Figure 2 above shows the tower locations within the orchard, it documents the tower installation and sensor layout. The initial results are summarized in Figure 3 (below) where:
- Top plot– daily ET: From August through early October the two sites tracked one another closely, reflecting the minimal grass activity during dormancy. In mid-October, when fall precipitation inititated grass growth beneath Tower 1, daily ET spikes became more frequent and slightly larger than those at Tower 2.
- Bottom plot – cumulative ET: Cumulative totals diverged by ~25 mm between 15 October and 1 April, implying that the regenerated cover crop consumed more of the winter precipitation than the orchard with a bare ground floor management.
The extensive tower setup allows us to monitor daily energy-balance closure (EBC) to ensure measurement accuracy and precision and confidence in the flux data. Full-season measurements will continue through fall 2025 to capture peak-canopy conditions and inter-annual variability.
Path forward: Our paired 20 ft flux towers are now delivering a full suite of half-hourly variables (LE, H, Rn, G, meteorology) with preliminary graphs confirming that the system is capturing biologically meaningful differences once the cover crop re-greens. Over the next season we will focus on turning the flux data into a publication-ready dataset by:
- Adopting a robust outlier flagging scheme and introducing frequent zero–span checks on both IRGAs.
- Improving energy balance closure with corrections to make the towers a stronger reference for comparisons with other sensors and remote-sensing products.
- Ensuring a continuous 2024-25 record with established algorithms for gap-filling and uncertainty quantification (e.g. REddyProc)
Preliminary conclusion: Under drip irrigation, senesced grass does not appear to compete with hazelnut trees for water in midsummer, but cover-crop re-growth in autumn can add a measurable ET load. Verification with the 2025 dataset and formal statistics is still required.
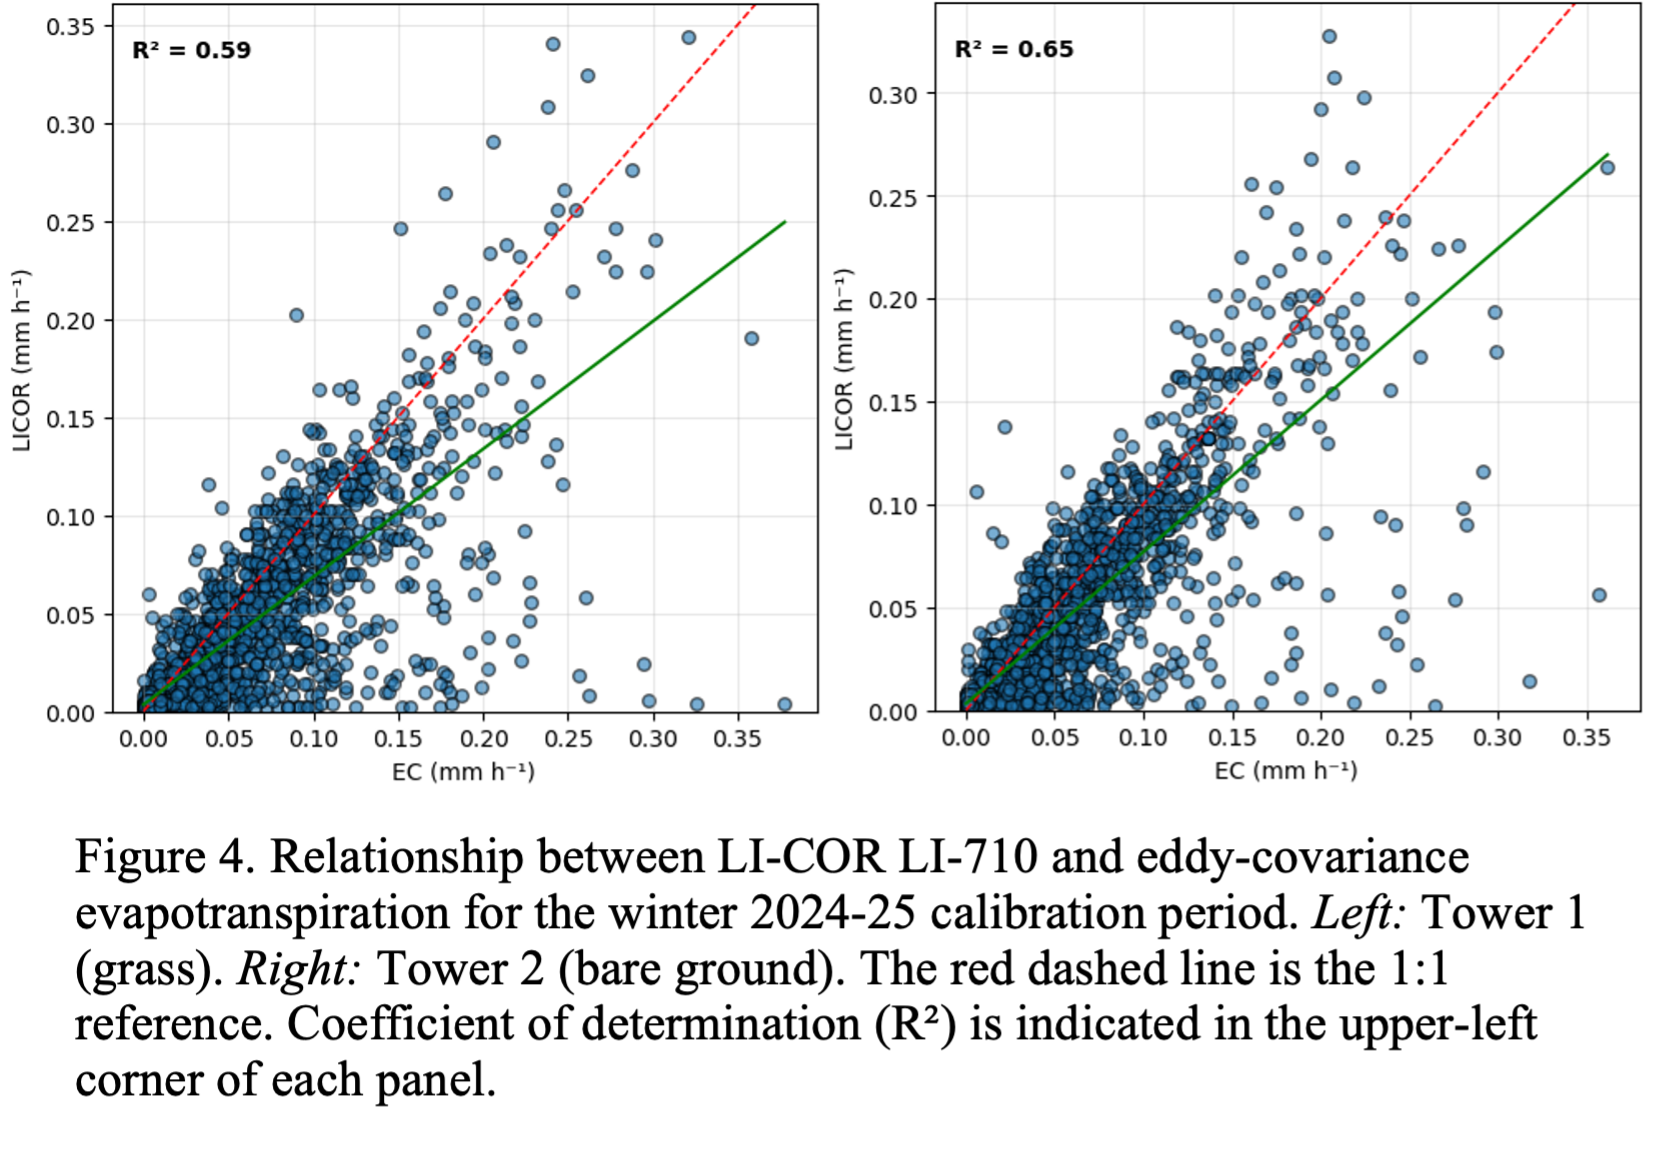
EC Towers paired with LiCOR 710: In mid-October 2024, we deployed a pair of LI-COR LI-710 evapotranspiration sensors beside the two eddy-covariance (EC) towers to explore whether the low-cost, low-maintenance instruments could act as stand-ins for full EC systems. Figure 4 (below) compares half-hourly ET rates from each LI-710 with the co-located EC tower during the 2024-25 winter period. The coefficient of determination is R² = 0.59 for the grass site and R² = 0.65 for the bare-ground site, indicating a moderate but far from 1:1 agreement. Below are some of the reasons why a winter mismatch is expected:
- Automatic pump shut-off below 5 °C. The LI-710 relies on a miniature flow pump; according to the manufacturer, “flow, required for ET and RH, turns off ≤ 5 °C unless the unit is insulated or heated” (LI-710 | Introduction to the LI-710, n.d.).
- Low atmospheric demand. Winter latent-heat fluxes in the Willamette Valley are typically low and possibly close to the LI-710’s stated precision. Thus, random noise occupies a larger fraction of the signal.
- Frequent Oregon rain events, especially in the fall and winter months, introduce more error: water on sonic-anemometer heads and splashing through open-path IRGAs degrade latent-heat measurements, commonly leading to under-estimated ET during rainfall or shortly afterwards. Because the LI-710 shuts down at low temperatures and the EC towers can under-register fluxes when wet, we expect the relationship between the two sensors to be worse in the winter months.
Path forward during the 2025 growing season:
- We will repeat the comparison from bud-break through leaf fall in 2025, when ET regularly exceeds 0.15 mm h⁻¹. Higher fluxes and warmer temperatures should suppress pump shut-downs and improve signal-to-noise ratio.
- We plan to flag and remove LI-710 data logged at ambient ≤6 °C (5 °C threshold + 1 °C safety margin) before calculating seasonal Kc curves.
Preliminary conclusion: The LI-710 shows promise as a scouting-level ET sensor, but winter data are unreliable. Performance during the 2025 growing season will determine whether the instruments can be recommended for year-round irrigation scheduling in Willamette Valley hazelnuts.
Utilizing Agrimet ETr for Hazelnut Water Management: Currently, no peer-reviewed crop-coefficient (Kc) curve exists for hazelnut orchards in Oregon’s Willamette Valley, so AgriMet reference-ET (ETo) data cannot yet be translated into orchard evapotranspiration (ETc). Although Oregon State University researchers are actively working on the problem, no values have been released as of spring 2025 (McCauley et al., 2024; Oregon’s Hazelnut Success Rooted in OSU Research, Extension | The Statewides: Our Impact, 2025). To close this gap we will used the paired eddy-covariance towers in adjacent orchards—one with grass cover crop and one kept vegetation-free. The towers measure latent-heat flux continuously through the 2025 growing season, allowing us to calculate ETc directly and derive a provisional, Willamette-specific Kc (or stage-specific Kc curve). While additional seasons will be needed to capture year-to-year variability, the first-year dataset will already provide a much more accurate coefficient for growers than the generic estimates currently in use.
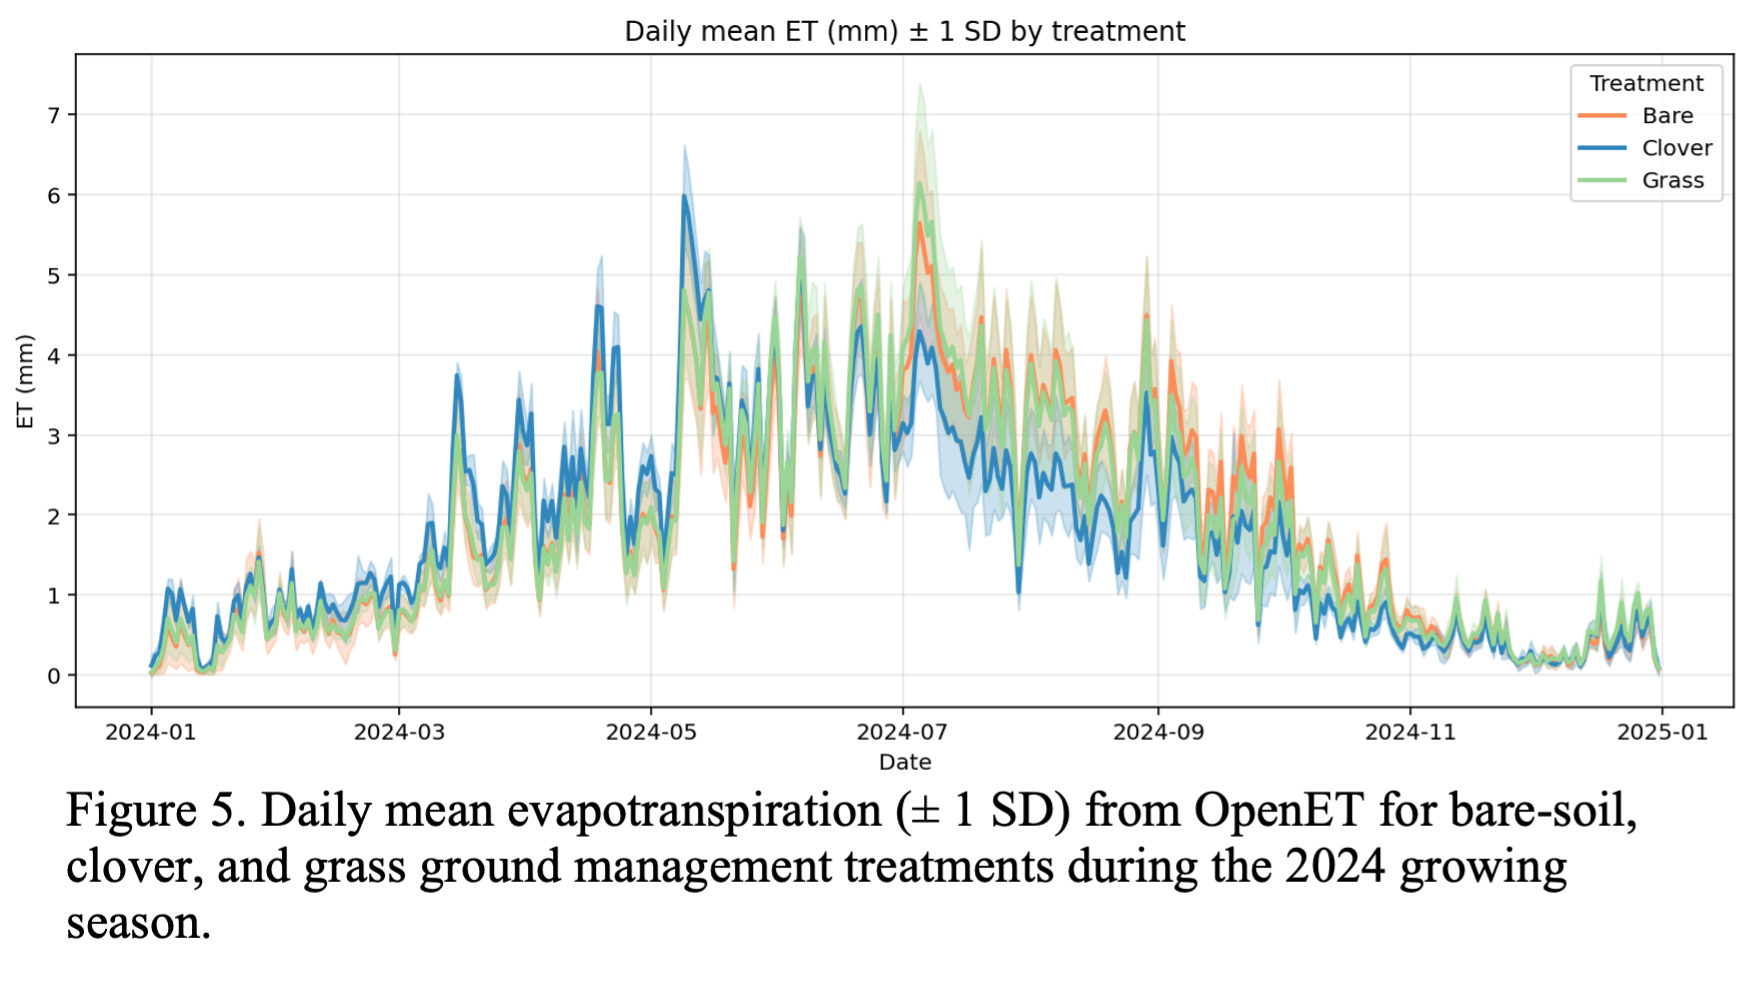
OpenET Data Evaluation and Cross-Comparison – 2024 Season: We downloaded the 30 m OpenET ensemble product for every orchard plot in the trial for the period Jan 1st – Dec 31st 2024. OpenET blends six satellite energy-balance models and returns a single “ensemble‐MAD” value for each Landsat pixel (Methodologies – OpenET, n.d.) . Daily ET was aggregated to the plot level, then grouped by ground-cover treatment (Bare, Clover, Grass).
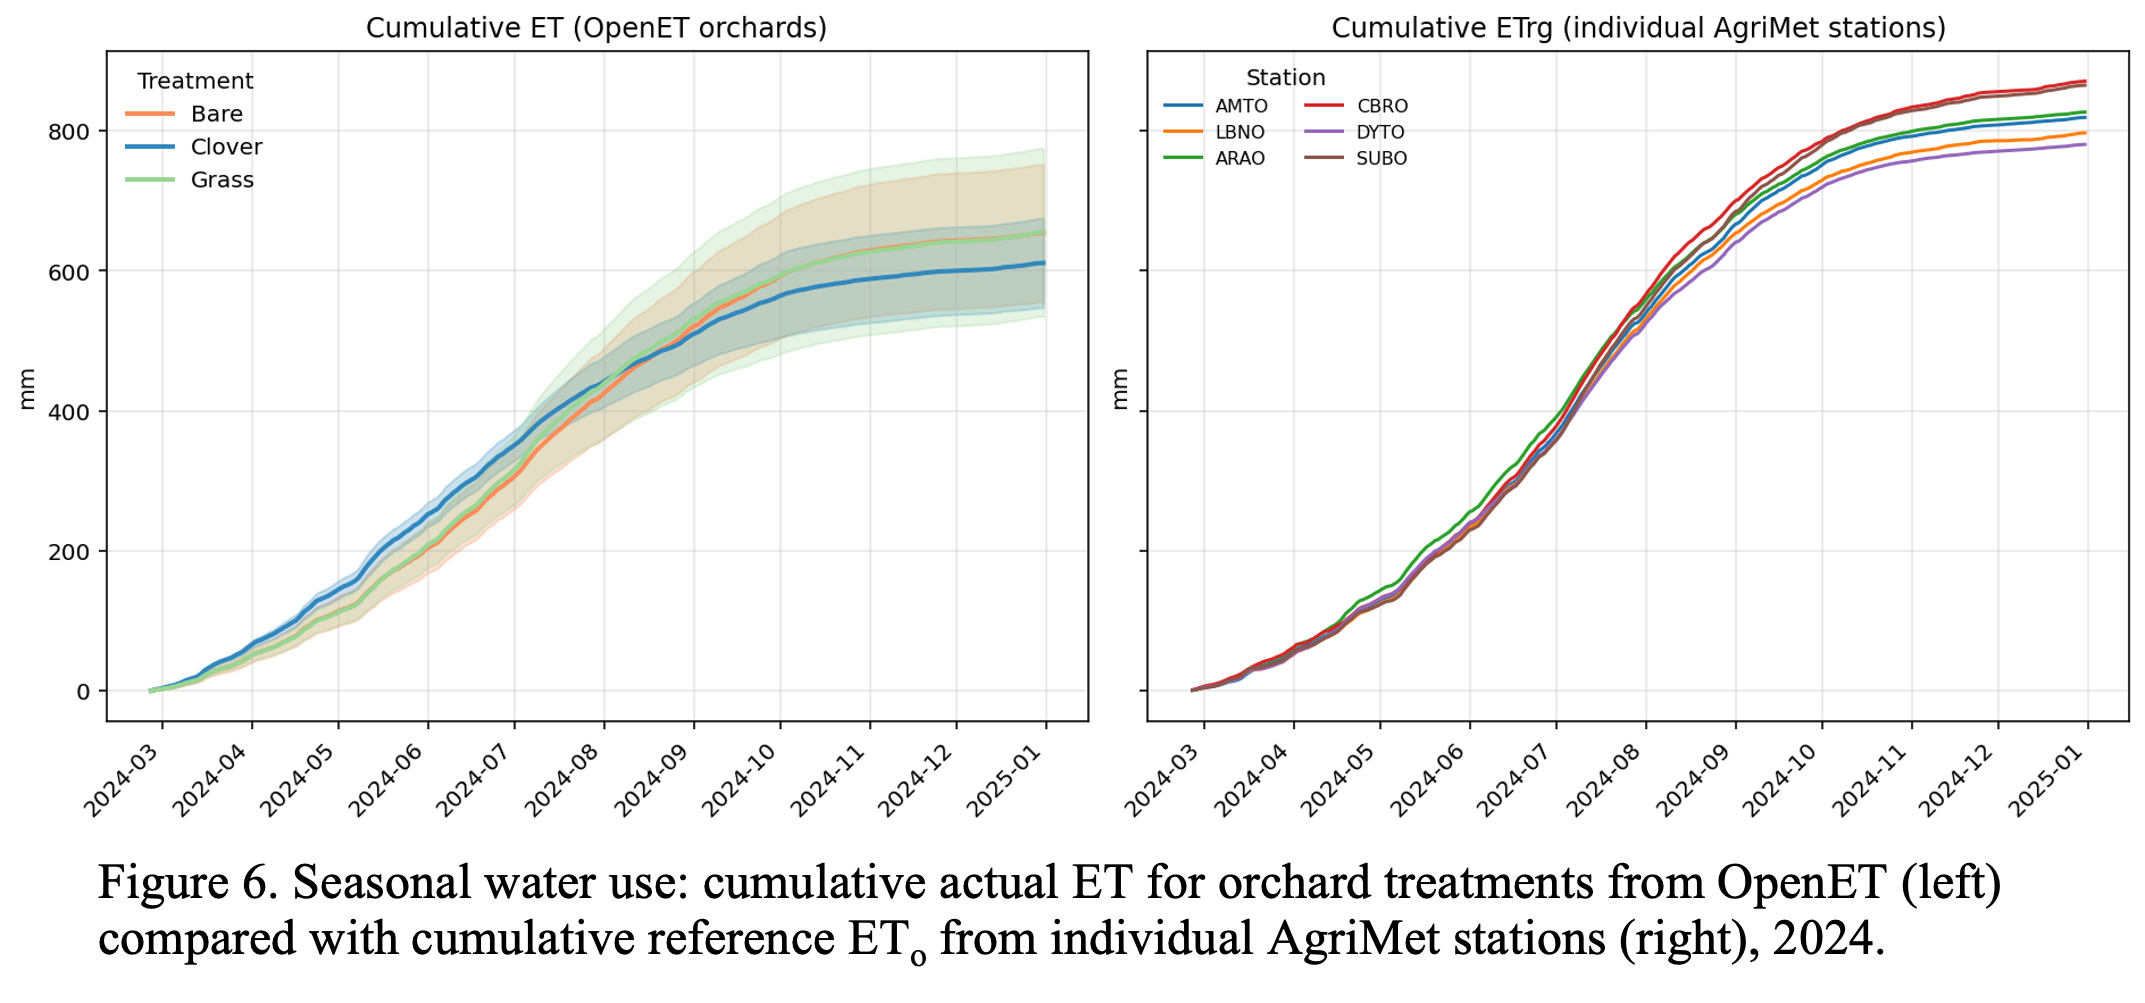
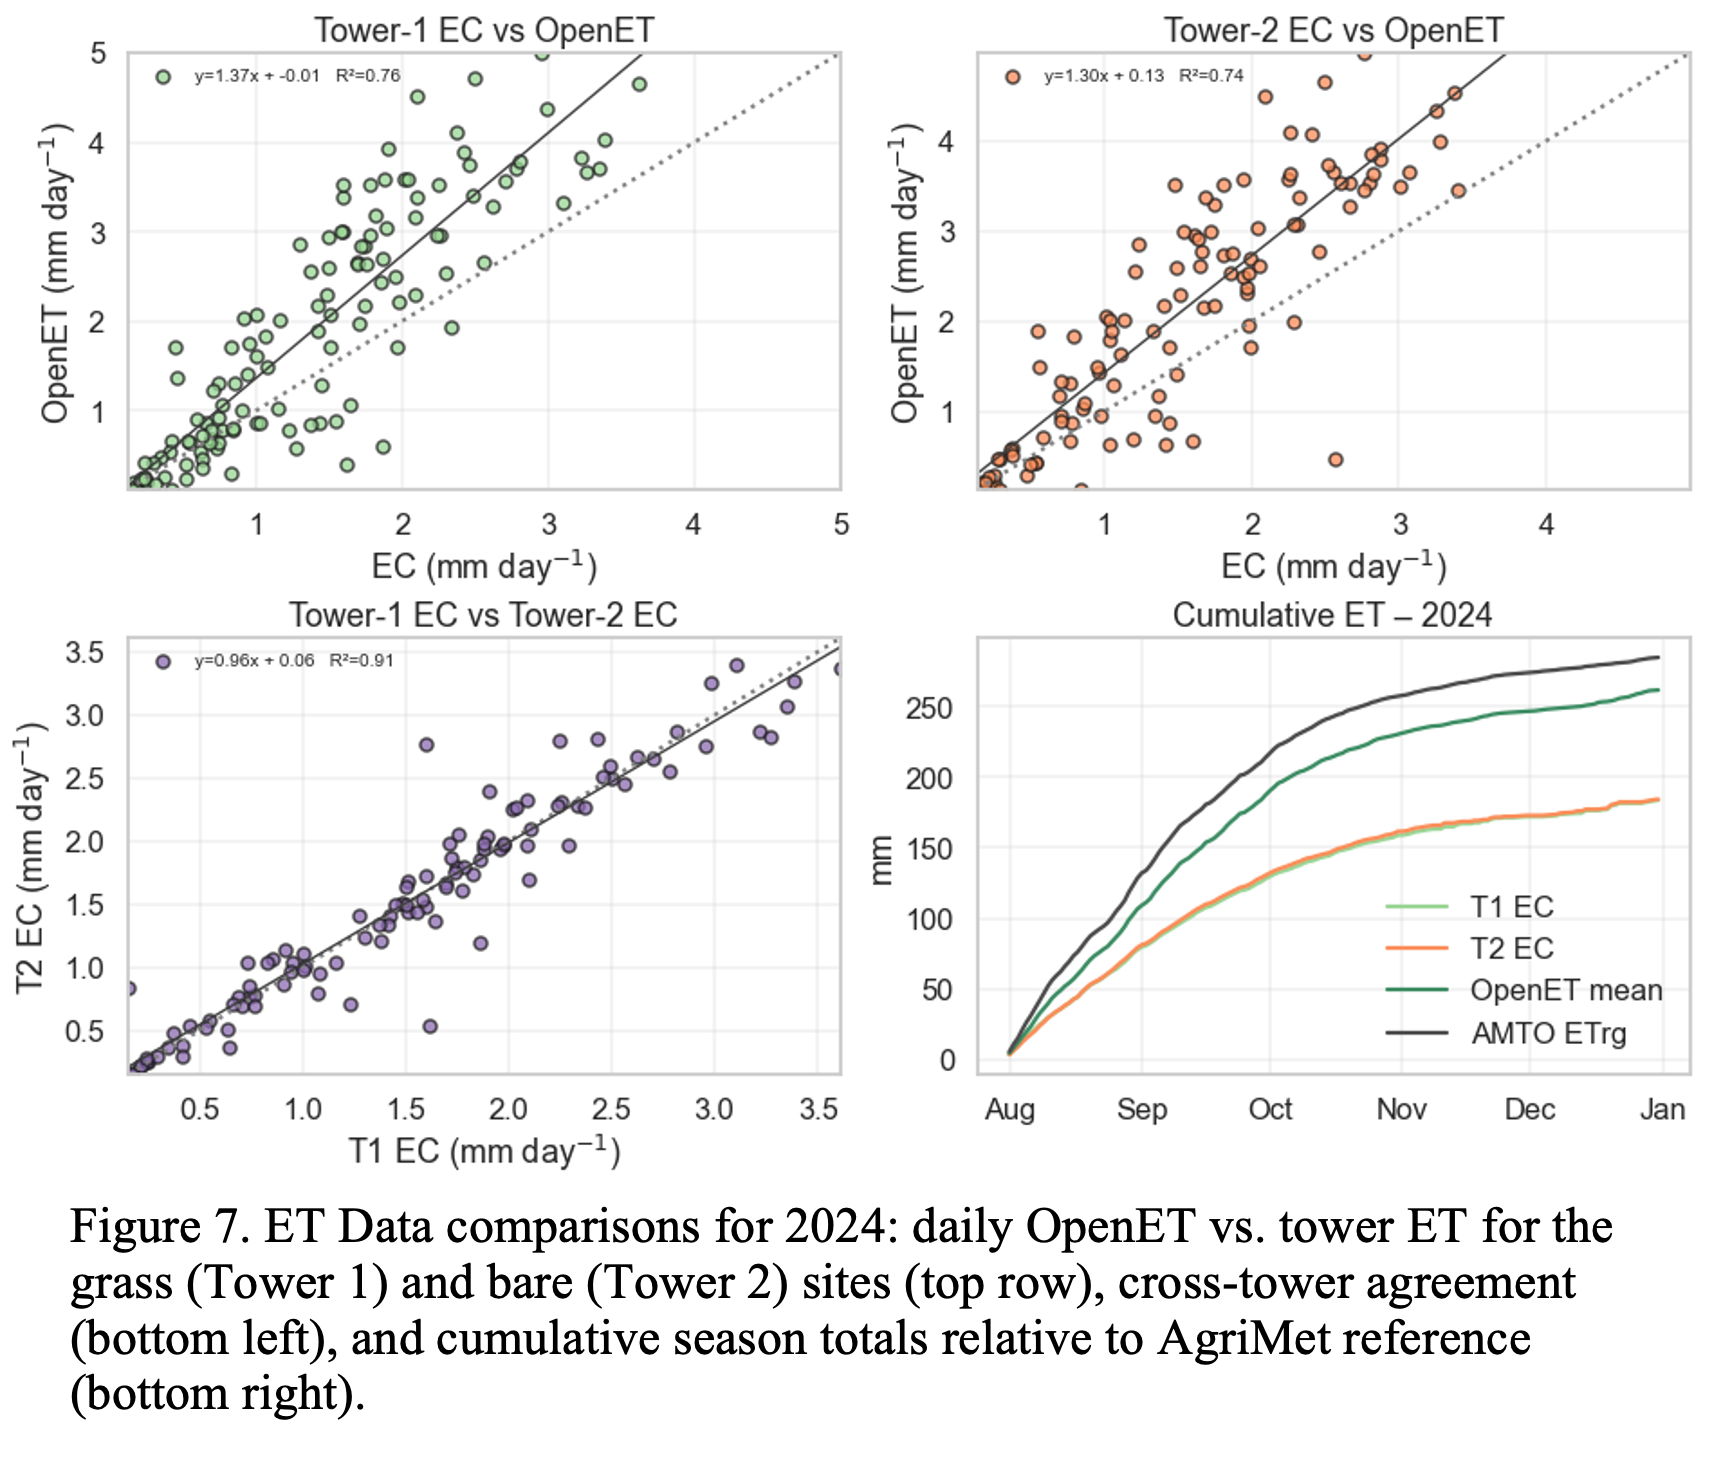
Our initial observations below show that ET rises sharply with canopy expansion in May–June, peaks near 6-7 mm day⁻¹ in July, and declines after leaf-senescence in October. Visual inspection suggests that clover plots dip below bare and grass plots during late-summer water-stress periods (August–early September). The daily means plot, Figure 5, shows a dampening of the plot-to-plot noise but there is still an overlap between the three treatments for most of the season. There is an apparent reduction in ET for the clover treatment after the beginning of August but the values are within one standard deviation of bare/grass means, indicating that formal statistical analysis is needed before concluding a treatment effect. Lower ET values for the clover treatment are further observed in the cumulative plot below, Figure 6, which shows about 660 mm yr⁻¹ ET for the bare/grass treatments and about 630 mm yr⁻¹ ET for the clover treatment which warrants the further hypothesis testing. To verify whether the OpenET values fall in the ballpark of acceptable values, we compared the cumulative to those of ArgiMet ETo values (Figure 6). AgriMet’s ETr represents a well-watered 0.5 m grass crop, which should exceed the actual orchard ET. All five local stations accumulate 810–850 mm yr⁻¹, ~25 % more than OpenET’s orchard totals, which shows the hierarchy we expect (ETr > ET_orchard). Our validation against the flux towers is shown in Figure 7 below. The daily OpenET vs. EC plots give slopes of 1.30–1.37 (R² ≈ 0.75) for both towers. Based on this initial comparison OpenET values appear ~30 % higher than the in-situ latent-heat flux. Additionally, the two EC towers agree closely (slope 0.96, R² 0.91), so the bias does not seem to be a tower artefact. The cumulative graph shows that OpenET exceeds Tower 1 by about 40 mm and Tower 2 by about 80 mm. The bias we observe is consistent with the 15–20 % mean absolute error reported for croplands in a recent independent accuracy assessment of OpenET against 152 flux towers across the CONUS (Volk et al., 2024). However, it is important to note that the EC tower data has not been gap filled and gone through corrections yet, which may improve the ~30% observed in the initial results. Thus, this comparison can be valuable to producers for region-based data use and water management considerations.
Path forward: To refine our remote-sensing validation and strengthen treatment-level conclusions, the next phase of the project will target two complementary upgrades:
- Tower-footprint OpenET extraction - we will generate half-hourly flux-footprint maps for each EC tower (using the FFP/Kljun model) and query the OpenET API only for Landsat pixels falling inside the 50 – 90 % contribution contours. Weighting daily OpenET values by the fractional source area will hopefully give us a better apples-to-apples comparison with the tower LE data.
- Multi-year OpenET analysis - we can expand the dataset to include at least two additional growing seasons (2023 and 2025). A longer record will capture inter-annual variability in weather and irrigation regimes, improve the power of statistical tests for ground-cover effects, and allow us to examine whether the OpenET bias identified in 2024 is season-specific.
- Comparison with EC tower ET values after gap filling and uncertainty validation may improve the ~30 % difference in values between the two sources.
Preliminary conclusion: Based on OpenET data, clover shows a late season reduction in ET but the variability across treatments is large. This necessitates further statistical analysis to confirm significance. Expectedly, OpenET values are lower than ArgiMet ETr, but OpenET overestimates ET by 20-30% when compared to in-situ EC towers. This observation is consistent with recently published continental-scale evaluations but the preliminary data used for our study is not corrected and gap filled which may change the difference in ET observed so far. Despite the observed bias, OpenET captures day-to-day patterns (R² ≈ 0.75) and provides spatial context unattainable with two towers alone.
RO2: Determine the effects of cover crops on soil moisture availability in hazelnut orchards.
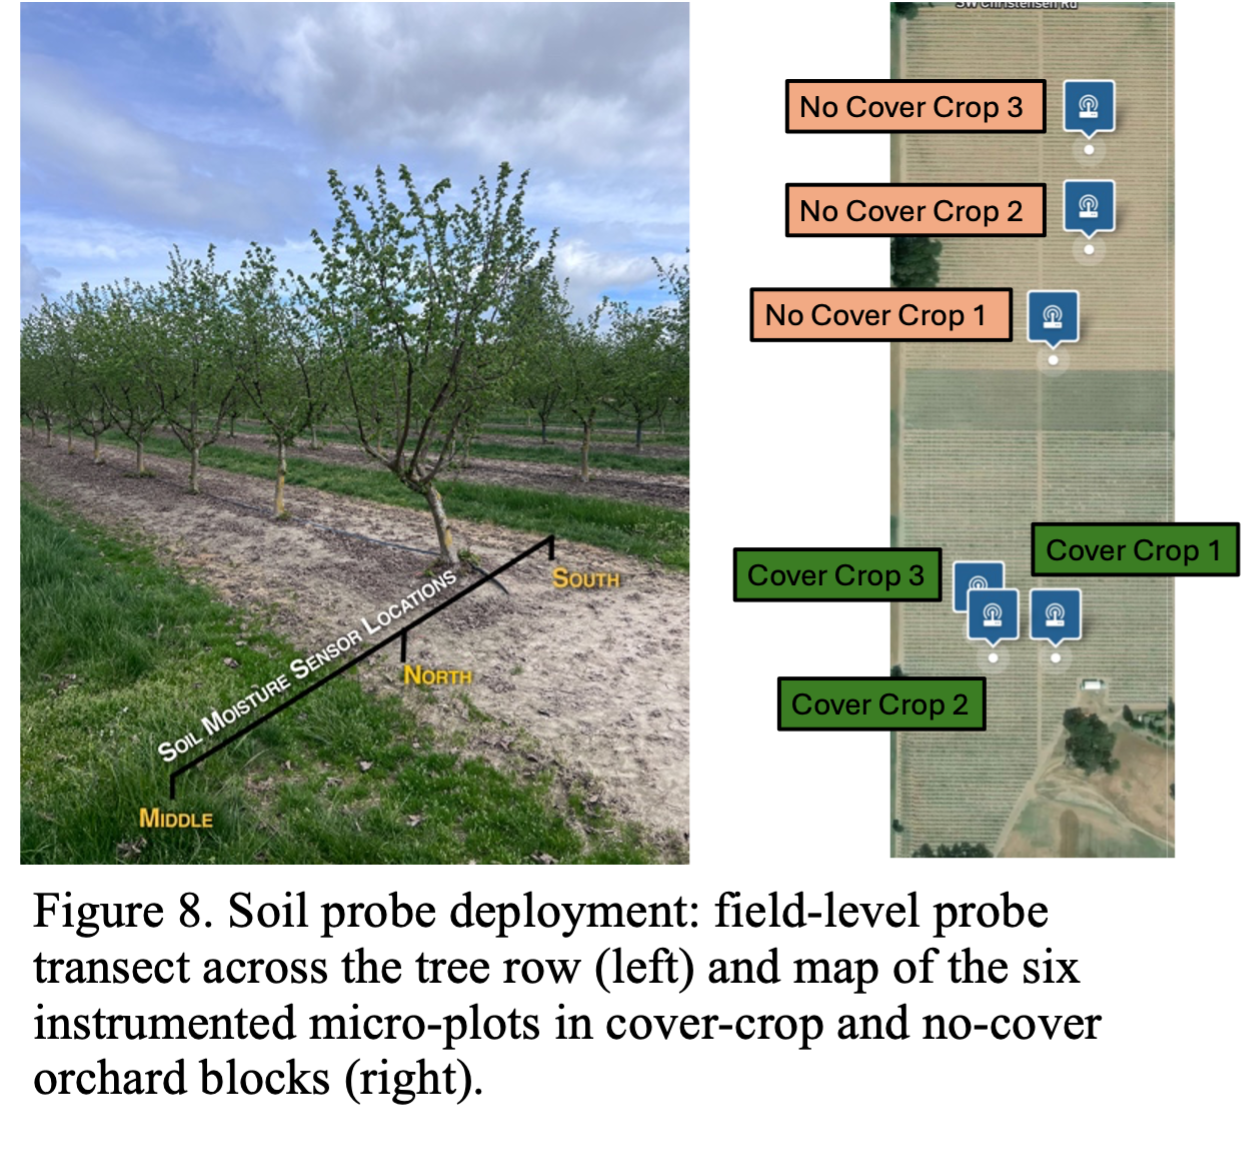
Over the summer of 2024 we installed a total of 60 soil moisture sensors (Teros 12) across four hazelnut orchards to capture small scale soil water dynamics. Each sensor logs volumetric water content and temperature every 30 minutes. We deployed 36 probes in the two orchards that host the eddy-covariance towers: within each tower block we identified three areas of uniform Woodburn silt-loam, then positioned sensors on the south side of a representative tree, the north side, and the center of the alleyway to separate the tree-root zone from the cover-crop zone. We paired the probes installing them at 6 in and 18 in depth to capture surface depletion, sub-root storage, and infiltration rates. To quantify deep percolation beyond the active root zone, we added six additional probes at 36 in in February 2025. The remaining 24 probes are installed in a similar manner as the 36 deployed in 2024. The two additional orchards are a clover site with 3 areas in Woodburn silt-loam and a no cover site with one area in Woodburn silt-loam. Figure 8 below shows a single soil transect with the soil moisture probes installed during 2024 and the 6 locations across the two adjacent plots.
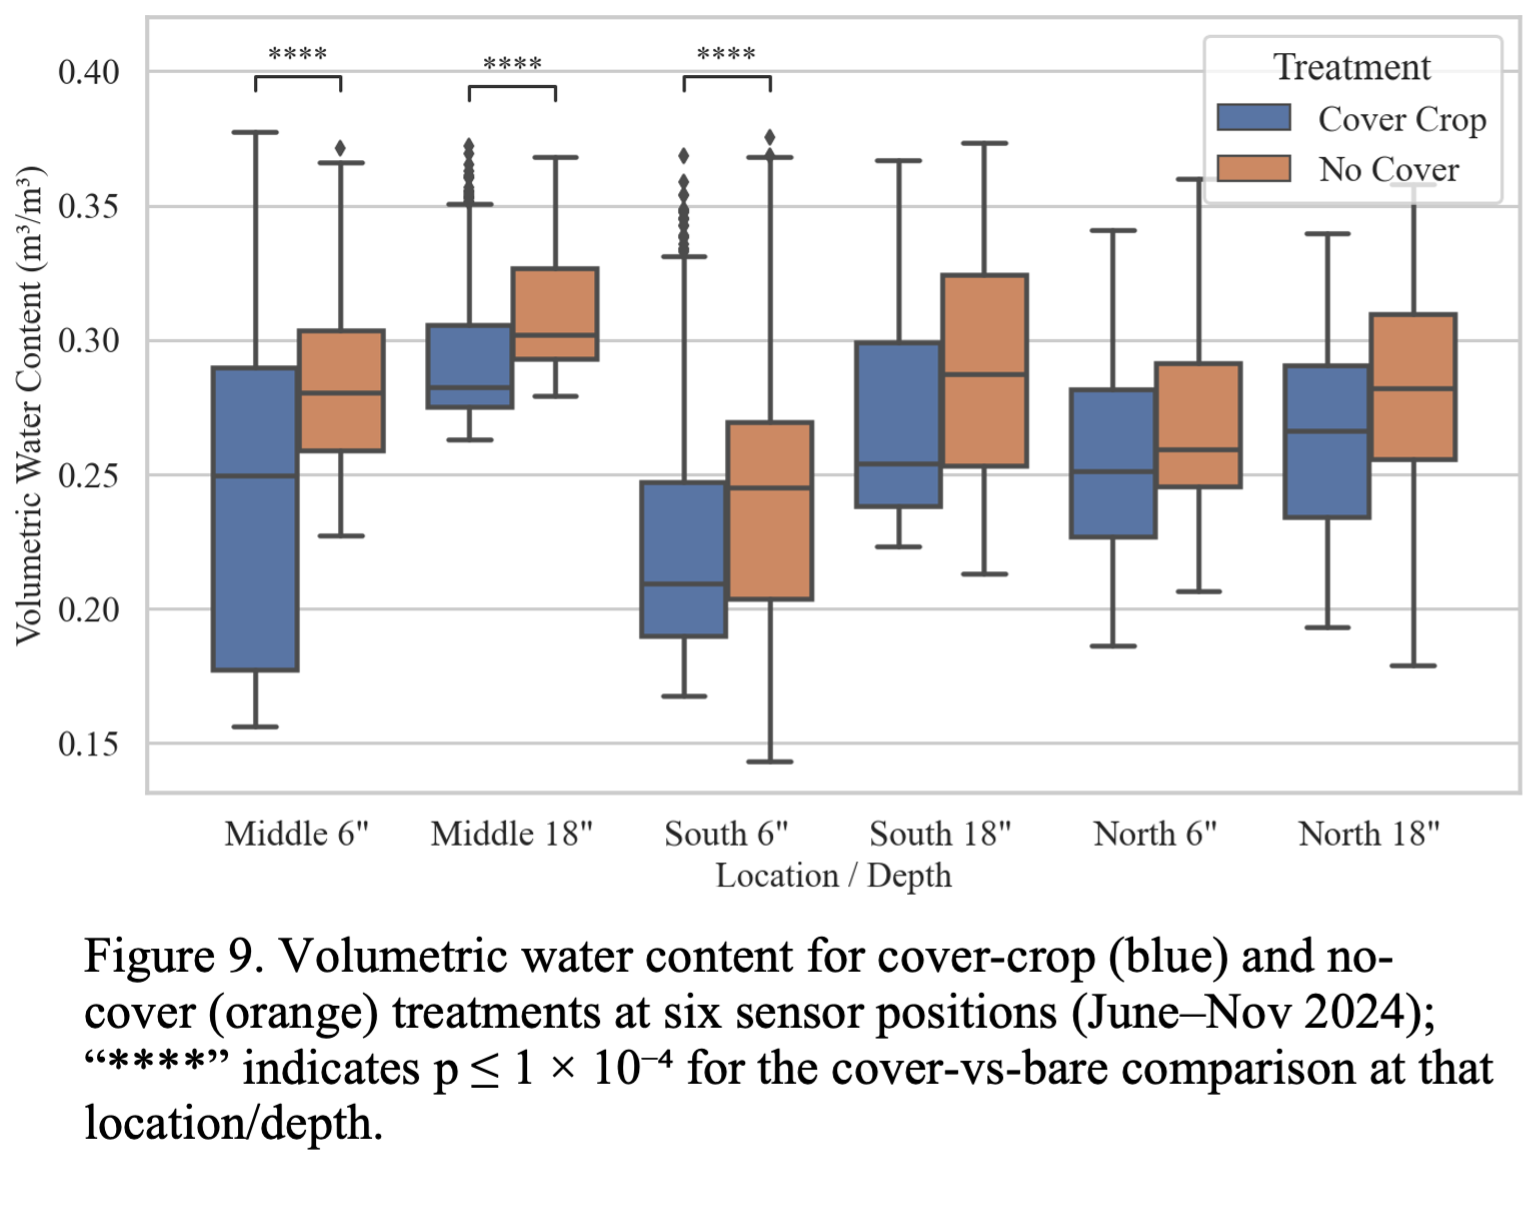
Our initial data analysis evaluates the soil moisture and temperature in pared grass/no cover plots. Figure 9 and Figure 10 show the first six months of soil‐sensor data into two graphics that compare grass cover-crop alleyways with adjacent vegetation-free alleyways.
The box-and-whisker plots (Figure 9) summarize daily VWC (June-Nov 2024) at three lateral positions—middle of the alleyway, south side of a hazelnut tree, north side of the tree - and at two depths (6 in and 18 in). A significant moisture depletion under the grass occurs in the alleyway at both depths and on the sun-facing (south) side at 15 cm (p ≤ 1 × 10⁻⁴). All other positions/depths show no statistical difference, implying that the tree-root zone buffers itself from the cover-crop’s water use.
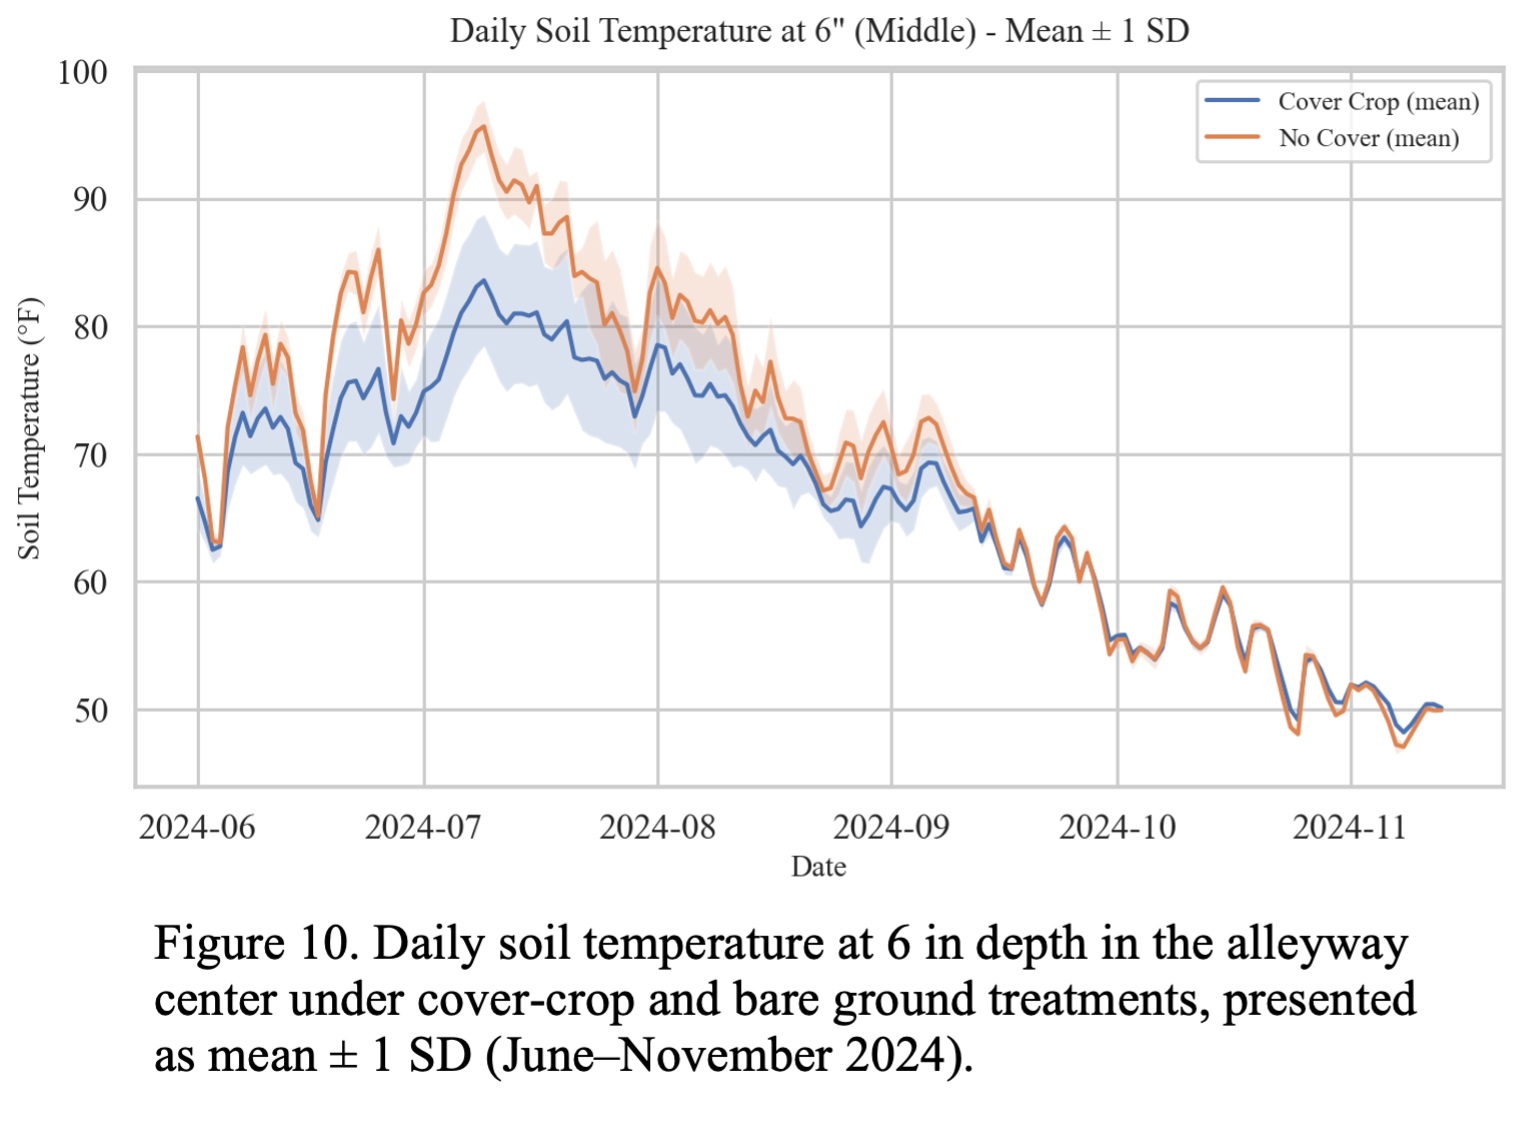
The mean daily temperatures plot from 6 in depth in the middle of the alleyway (Figure 10) shows that through the July heat wave the cover crop kept the soil 3-4 °F cooler than bare ground - an effect that faded with the onset of cooler autumn weather. The result is consistent with evaporative cooling from the grass and its reduced absorption of short-wave radiation.
Path forward: Forthcoming work will extend the analysis across the full 2024-25 record and will include data from the hazelnut orchard interplanted with clover.
Preliminary conclusion: Taken together, these preliminary data suggest that a living grass cover crop primarily alters the inter-row environment - both drying and cooling the shallow soil. while exerting little influence in the deeper, tree rooting zone.
RO3: Assess crop health through advanced imaging technologies
To optimize student time for EC tower upkeep and flux-data processing, which is the primary reference for all evapotranspiration estimates, we suspended the planned drone flights. Canopy monitoring is now performed with PlanetScope surface-reflectance imagery (3 m spatial resolution, near-daily revisit). Plot-scale NDVI and related spectral indices will be computed for every clear-sky acquisition at daily resolution.
The satellite data will be temporally aligned with the EC latent-heat flux to evaluate water stress and to compare crop water status in the two grass/bare ground plots.
RO4: Explore the interconnected dynamics of environmental factors
At the conclusion of the 2024-25 field data collection season, we will conduct an integrated analysis that links the field level water dynamics to plant-level physiology. Daily ET derived from the EC towers will be compared to plot-scale soil-moisture trends to quantify how root-zone water depletion relates to atmospheric water flux over different periods of the growing season.
Research outcomes
Preliminary research outcomes (August 2024 – April 2025)
Whole Orchard Water Use (Eddy-Covariance Towers Observations)
Both EC towers reported similar ET values after the senescence of the grass cover crop. After the onset of precipitation in October, the cumulative ET in the plot with grass exceeded that of the bare ground plot. This observations suggests that this specific grass cover crop (Poa annua) does not appear to compete for water during the hot summer months due to dormancy. However, it does appear the grass may increase ET from the cover cropped field with the onset of Fall precipitation.
Lower - Cost Sensor Comparisons
The LI-710 sensor tracks the EC tower ET patterns reasonably well (R2 ~ 0.6 - 0.7) considering the comparison period is during the fall and winter months. Additional testing will take place over the next growing season and we hope the performance of the LI-710 will improve in the milder weather months.
OpenET vs. EC tower Comparison
OpenET captures day-to-day dynamics (R² ≈ 0.75) yet over-estimates tower ET by ~30 %. However, the EC tower data needs to undergo a QA/QC protocol which may close the gap in ET between the two sources.
Soil-moisture and soil temperature dynamics
At both 6 in and a8 in depths, the alleyway center under grass is significantly drier (p ≤ 10⁻⁴) than bare soil. However, differences near the trunk are negligible. Meanwhile, the grass cover keeps midday summer soil temperature 3–4 °F cooler at the 6 in depth during the hot summer months.
Education and Outreach
Participation summary:
EO1: Develop a centralized online resource for hazelnut orchard management
PI Zamora Re created a website with a focus on agricultural water management in the State of Oregon. The website will host the findings of this research effort and any studies that build upon this project.
EO2: Address grower concerns through field research demonstrations and facilitating effective knowledge transfer.
Research outcomes on cover-crop water interactions in Willamette Valley hazelnut orchards are being communicated through a structured outreach programme that includes: (i) formal presentations at the region’s annual hazelnut-grower meetings; (ii) an on-site field day showcasing the flux towers, soil-sensor network, and preliminary results; and (iii) invited talks at community forums and informal producer round-tables. These venues ensure that findings reach both industry decision-makers and day-to-day orchard managers.
To date, our outreach efforts have included the following activities:
Presentations:
- Oral presentation for the Ecology Tap Talk Series (Mary's River Watershed Council) - December 2024 - 30 participants
- Poster presentation at the Nut Grower Society Winter Meeting - January 2025 - over 1000 attendees
In preparation:
- Field tour at research site in collaboration with Polk & Yamhill Soil & Water Conservation Districts - Scheduled for August 2025 - expecting 100-200 hazelnut producers
- Recording of Field tour talks will be uploaded to the agricultural water management website.
- Presentation at the Winter Nut Grower Society Meeting - Jan 2026 - over 1000 attendees
- Extension document with complete findings