Progress report for GW24-010
Project Information
With rising concerns regarding the effects of red meat production on human and environmental health, a growing number of producers are exploring ways to improve livestock production methods. Studies highlight ecosystem benefits of bison's rotational grazing, but the nutritional impact on meat remains unclear. As the adoption of more sustainable ranching practices is ultimately dependent on consumers' interest in healthy products, having information on the impact of different finishing practices is crucial.
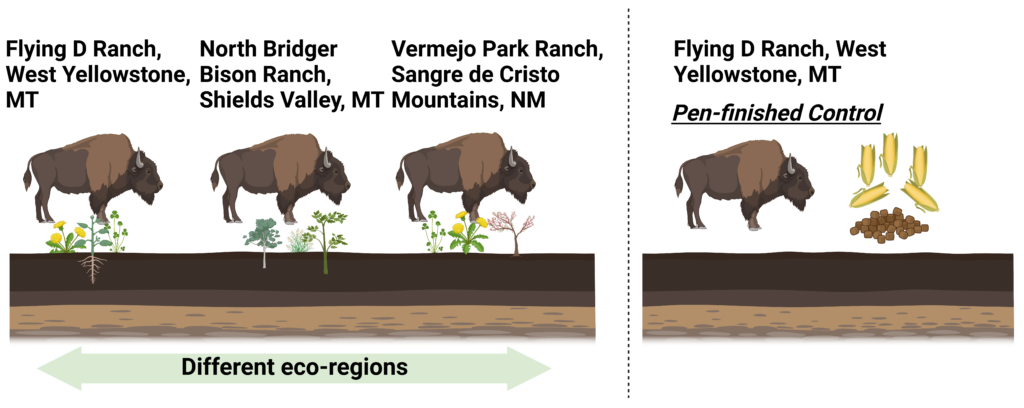
The goal of this project is to study the impact of finishing practices (grass and grain) and “terroir” (geographical location) on the nutritional composition of bison meat. We will collect forage/feed and meat samples from three Western bison ranches (two in MT and one in NM) that are using rotational grazing practices. Meat samples will be profiled for nutritional composition using metabolomics approaches and compared to grain-finished bison from an MT ranch as a control. Our focus is on grass-finishing of bison on polyculture pastures, a method that promises multiple ecosystem benefits but is currently underutilized in the industry. We hypothesize that rotationally grazing and finishing bison on polyculture pastures in Western Rangelands will improve the nutritional composition of bison meat, including fatty acid, vitamin/minerals, and phytochemical profile.
With the bison industry's revenue surpassing $340 million and having expected continued yearly growth, the project's goal is timely. We will disseminate our research through national association meetings and field demonstrations to bison farmers, aiming to convert scientific research into practical, actionable, and sustainable farming practices.
Fig.1. Graphical abstract of the proposed study.
To achieve the project goal, outlined above in the summary, we will pursue the following specific objectives:
Objective 1: Assess the differences in metabolomic profiles of forage, including the range and concentration of phytochemicals, vitamins, fatty acids and minerals, consumed by bison in pasture-finished systems compared to those in a standard grain based pen-finished system.
Hypothesis: The forage consumed by pasture-finished bison will display a more complex metabolomic profile with higher levels of phytochemicals, vitamins, omega-3 fatty acids and minerals than the forage from a grain-based pen-finished system.
Objective 2: Quantitatively assess the concentrations of phytochemicals, vitamins, fatty acids and minerals in meat from grass-fed bison across four regional systems, in comparison to those in meat from a pen-finished bison system, utilizing advanced analytical techniques.
Hypothesis: Dietary variation will result in grass-fed bison having superior mineral, vitamin, fatty acid and phytochemical profiles compared to pen-finished bison
Objective 3: Investigate the impact of ecoregion-specific factors ('terroir') on the nutritional composition and phytochemical diversity in pasture-finished bison meat from distinct ranch locations, including Vermejo Park Ranch, Sangre de Cristo Mountains, NM; Flying D Ranch, West Yellowstone, MT; and North Bridger Bison Ranch, Shields Valley, MT.
Hypothesis: Bison meat from different ecoregions will display distinct nutritional and phytochemical profiles, influenced by the unique terroir of each ranch location.
The primary expected outcome of this research project is that the phytochemical, vitamin, mineral, and fatty acid profile of bison meat is significantly influenced by the finishing system and the geographic location of finishing. Simultaneously, this knowledge will pave the way for the development of strategic marketing approaches tailored to bison meat products, particularly those that have undergone grass finishing. Although this project is centered in Western states, its applicability extends far beyond geographical boundaries and holds the potential for scalability throughout the entire North Central Region/Mid-West Region where bison ranching is common. Our work will provide an initial critical—and as of yet unstudied—link between finishing practices and location (“terroir” ) on the nutrient density of bison meat. Without knowledge on how grazing practices impacts the healthfulness of bison meat(1), incentives that promote good land stewardship will not reach full potential, as efforts towards making livestock production more sustainable is ultimately dependent on consumer demand for a healthful product. Similarly, we anticipate that gaining more knowledge on how different ecoregions (“terroir”) impact the nutritional quality of bison meat, will help local producers with marketing their products to consumers.
Educational objectives:
- Publish research findings in academic journals detailing the comparative phytochemical richness of bison meat from grass-finished and grain-finished groups.
- Develop an updated and more comprehensive nutritional profile of bison meat influenced by finishing systems, which will be shared with producers through the National Bison Assocation and Turner Ranches Summer Meeting.
- Organize field days with the participating ranchers to facilitate peer-to-peer knowledge to enable ranchers to select finishing systems that yield the most optimally nutrient-dense bison meat products for human consumption.
- Equip ranchers with newfound knowledge to market bison meat based on its nutrient density and the chosen finishing system, thereby meeting the evolving demands of consumers seeking high-quality, health-conscious food choices
Reference
- Teague R, Kreuter U (2020) Managing Grazing to Restore Soil Health, Ecosystem Function, and Ecosystem
Services. Frontiers in Sustainable Food Systems 4.
Cooperators
- - Producer
- - Producer
- - Producer
Research
Abstract
Background: The fatty acid and mineral composition of bison meat may vary based on geographical location, a concept known as terroir. Understanding these variations is essential for optimizing meat quality and informing consumers about nutritional differences.
Objective: This study aimed to investigate the influence of terroir on fatty acid profiles and mineral content of bison meat sourced from four different farms across the United States: two in Montana, one in Kansas, and one on the Nebraska–South Dakota border.
Methods: Meat samples were collected from four farms that all finish their bison on pasture. Fatty acid profiles were analyzed using gas chromatography following fatty acid methyl ester (FAME) preparation. Mineral content was determined using atomic absorption spectrophotometry (AAS) and inductively coupled plasma atomic emission spectrometry (ICP-AES). Results are expressed as percentages of total fatty acids and mg/100 g wet weight. Statistical significance was assessed using ANOVA with Tukey’s post-hoc test.
Results: Significant differences in fatty acid composition were observed among the farms. The Montana samples had the highest oleic acid (C18:1n9) concentration (33.79 ± 2.96%), while Kansas samples had the lowest (28.09 ± 2.55%). The omega-6 to omega-3 fatty acid ratio was more favorable (lower) in Montana samples (2.2 ± 0.2) compared to Kansas samples (2.8 ± 0.1). Mineral concentrations also varied significantly, with notable differences in potassium, phosphorus, sulfur, and sodium levels across farms.
Conclusion: Geographical location and farming practices substantially influence the nutritional composition of bison meat with improved fatty acid profiles observed in Montana samples, which is attributed to the plant diversity of mountain pastures. These findings highlight the role of terroir in shaping fatty acid profiles and mineral content, offering valuable insights for meat producers, consumers, and researchers interested in optimizing meat quality.
Introduction
The local plant ecosystem across various regions of the United States can exert a significant influence on the fatty acid composition of the resulting meat1. This study investigated the variations in fatty acid profiles among bison from four different farms with two located in Montana, one in Kansas, and one on the Nebraska-South Dakota birder. Terroir, a concept traditionally linked to wine production, encompasses the environmental factors that influence a crop's phenotype, including the local climate, soil composition, forage availability, and specific farming practices2.
In the context of bison farming, terroir may play a pivotal role in shaping the nutritional composition of meat. The geographical location of each farm influences environmental conditions and available forage, which directly impacts the bison's diet and, consequently, the fatty acid and mineral profile of the meat. For instance, bison raised in Kansas may experience different climatic and vegetation conditions than those raised in Montana, which is characterized by diverse mountain ranges, potentially leading to distinct fatty acid patterns. Similarly, farms located along the Nebraska–South Dakota border may use different management practices that reflect their unique ecological contexts.
The inclusion of two farms in Montana also provides an opportunity to evaluate how management differences within a similar geographic setting may affect meat composition. This intra-regional comparison helps to isolate the influence of specific farming practices from broader environmental variables. By examining these regional differences, this study sought to elucidate the influence of terroir on bison meat quality. These findings are intended to support producers in tailoring practices to optimize nutritional value, assist consumers in making informed dietary choices, and contribute to ongoing research on the relationship between geography, farming systems, and food quality.
Methods
Site Selection
We adjusted our sampling plan to draw bison meat from three ranches—Kansas, Montana, and Nebraska—instead of the original lineup. This change was driven by logistics (steady carcass availability and shipping windows) and by the opportunity to broaden geographic coverage across the Great Plains. With herds now spanning central (KS), northern (MT), and mid‑northern (NE) regions, the study captures a wider gradient of climate, soil, and forage conditions, strengthening our terroir comparisons while keeping methods, sample size, and budget intact.
Fatty Acid Analysis
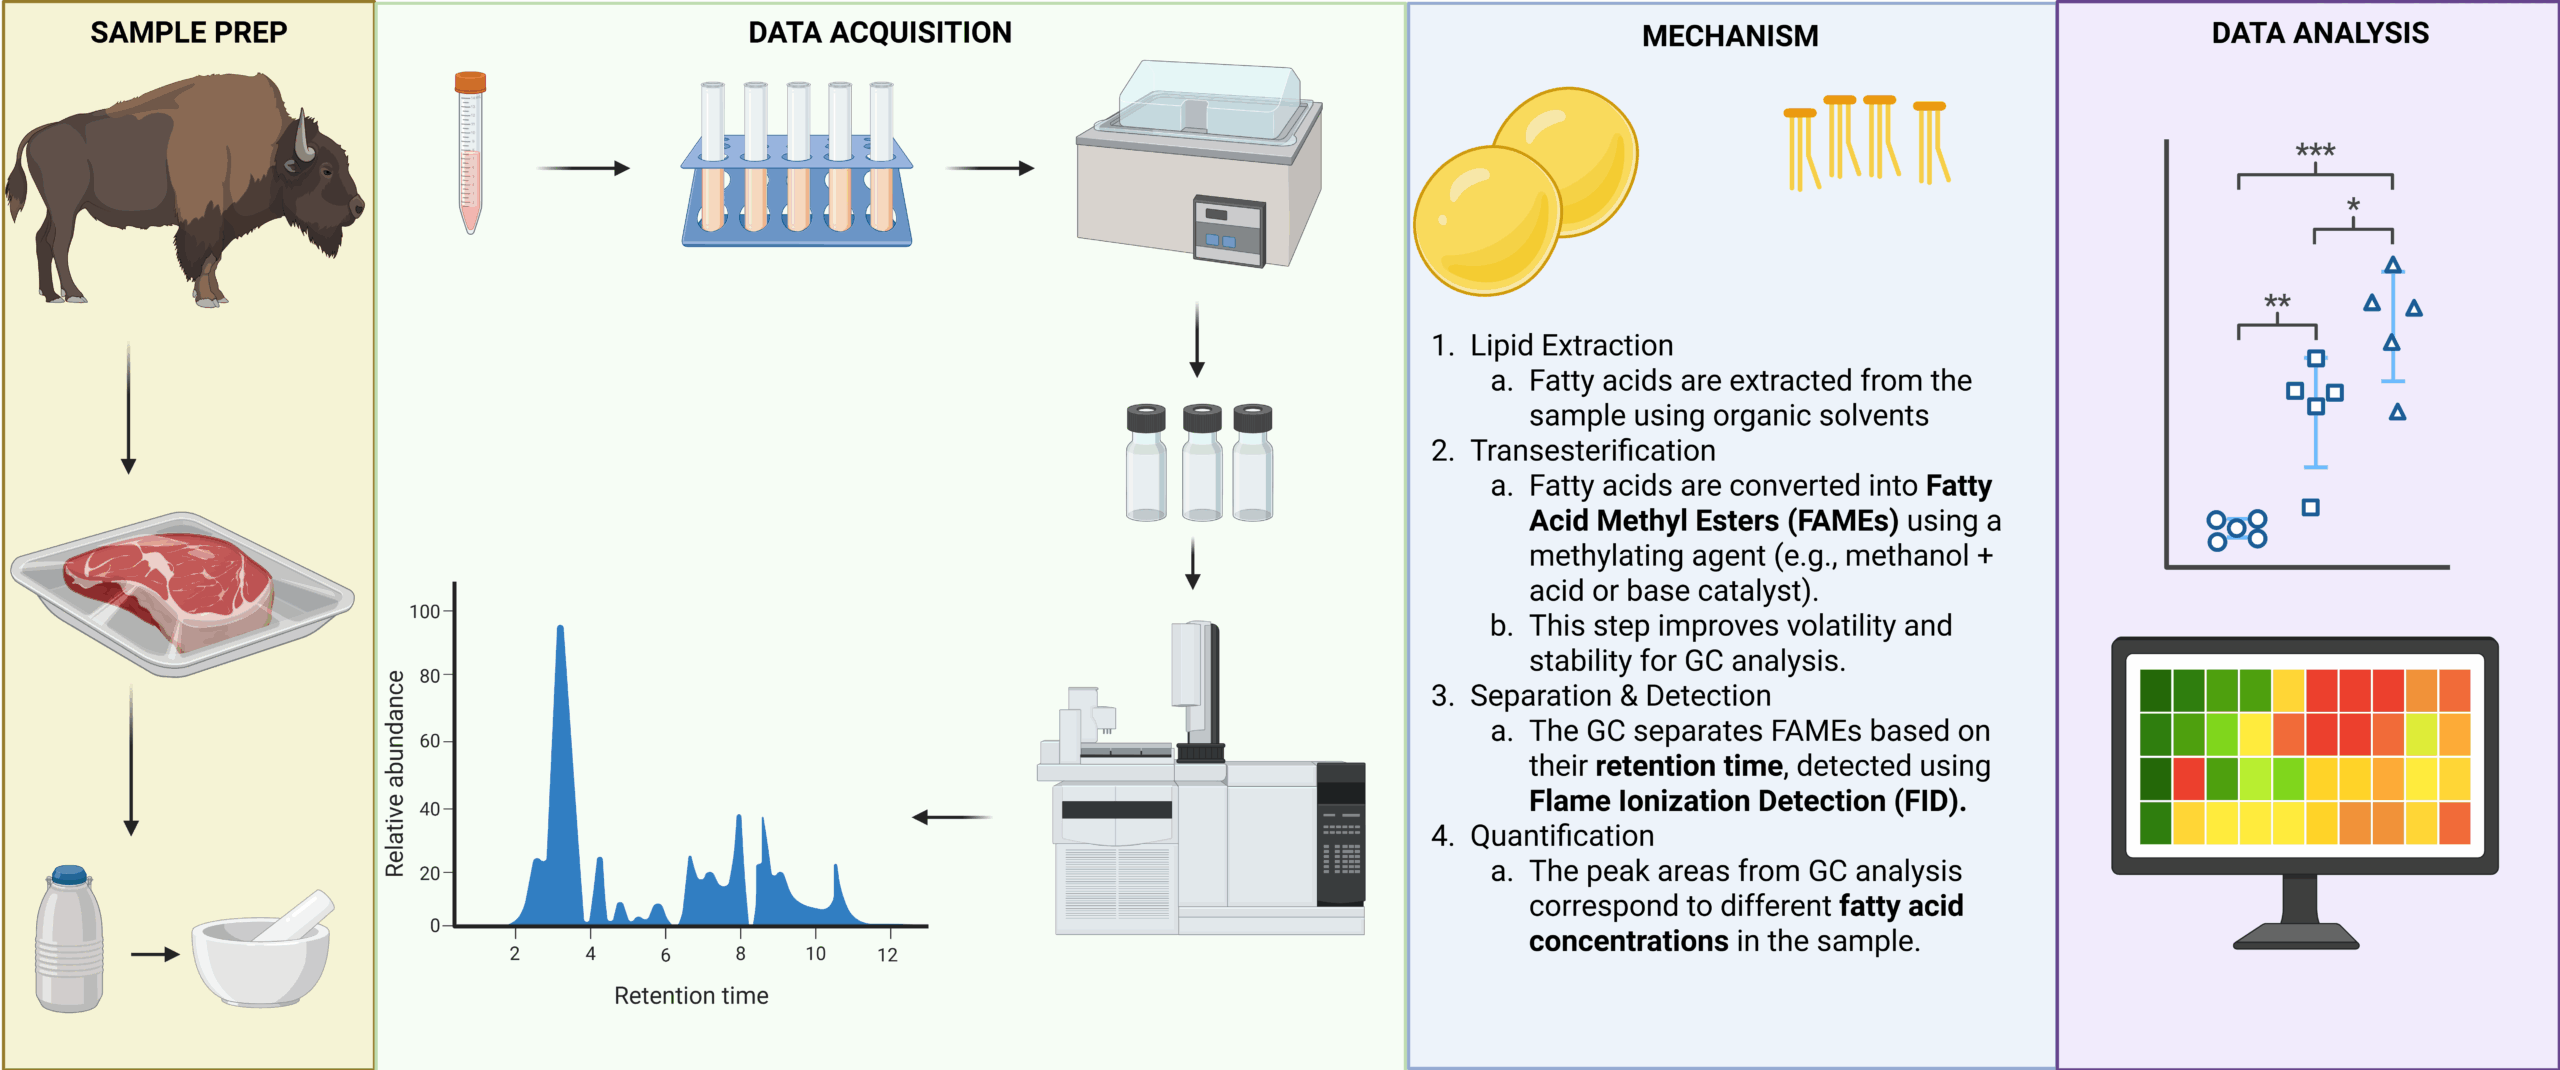
Fatty acid methyl ester (FAME) analysis was conducted according to established protocols, with minor modifications. Briefly, 100 mg of wet-weight cooked meat samples was weighed into screw-cap glass vials. An internal standard of tridecanoic acid (100 μL of 0.5 mg/mL in methanol; Nu-Chek Prep, Inc., Elysian, MN, USA), 70 μL of 10 mol/L potassium hydroxide (KOH) in water, and 530 μL of methanol were added sequentially. The vials were sealed with polypropylene-lined caps (Thermo Fisher Scientific, Waltham, MA, USA) and incubated in a shaking water bath at 55 °C for 1.5 hours. After cooling on ice, samples received 580 μL of 24 mol/L sulfuric acid (H₂SO₄), were vortexed at high speed for 1 minute, and incubated again at 55 °C for an additional 1.5 hours.
Fatty acid methyl esters were extracted using 1 mL hexane and analyzed by gas chromatography (Shimadzu GC-2010, Shimadzu Corporation, Kyoto, Japan) equipped with an HP-88 capillary column (100 m × 0.25 mm i.d., 0.20 μm film thickness; Agilent Technologies, Palo Alto, CA, USA) and a flame ionization detector (FID). Hydrogen was used as the carrier gas. The operating conditions included a column head pressure of 195.6 kPa and total flow rate of 129.1 mL/min (column flow: 2.47 mL/min, purge flow: 3.0 mL/min). The injection volume was 1 μL with a split ratio of 50:1. Injector and detector temperatures were maintained at 250 °C. The oven temperature program was as follows: 35 °C for 2 min, ramped to 170 °C at 4 °C/min (held for 4 min), and then increased to 240 °C at 3.5 °C/min (held for 7 min). Fatty acids were identified based on their retention times compared to authentic GC standards. Concentrations were expressed as percentages relative to the initial raw wet sample weight.
Figure 1: Overview of the fatty acid profiling of meat samples
Mineral Analysis
The mineral content of the meat samples was analyzed using a modified nitric acid/hydrogen peroxide wet-ashing method at Utah State University Analytical Laboratories (USUAL). Precisely weighed samples (500.0 ± 0.5 mg) were transferred into 20 mL digestion tubes. Each tube was wetted, and 6.0 mL nitric acid was added, and digestion was initiated at room temperature for 10 min. The tubes were heated at 80 °C for 10 min. Afterward, 2.0 mL of 30% hydrogen peroxide (H₂O₂) was added, and digestion was continued at 130 °C for one hour until the sample volume was reduced to ~2.0–3.0 mL. Following cooling, the digests were diluted with deionized water, filtered, or centrifuged to remove particulates, and quantitatively transferred to 25 mL volumetric flasks. The mineral concentrations were quantified using Atomic Absorption Spectrophotometry (AAS) and Inductively Coupled Plasma Atomic Emission Spectrometry (ICP-AES; Thermo Electron iCAP 6300, FL, USA). The results are reported as mg/100 g of wet weight.
Results:
|
Fatty Acid |
Ranch 1 (Kansas) |
Ranch 2 (Nebraska-South Dakota border) |
Ranch 3 (Montana) |
Ranch 4 (Montana) |
|
C10:0 |
0.27 ± 0.06 |
0.22 ± 0.07 |
0.20 ± 0.07 |
0.23 ± 0.10 |
|
C11:0 |
0.01 ± 0.01 |
0.01 ± 0.01 |
0.01 ± 0.01 |
0.01 ± 0.00 |
|
C12:0 |
0.02 ± 0.01 |
0.02 ± 0.01 |
0.01 ± 0.00 |
0.02 ± 0.00 |
|
C14:0 |
0.91 ± 0.27 |
0.98 ± 0.26 |
1.08 ± 0.16 |
1.00 ± 0.23 |
|
C15:0 |
0.29 ± 0.06 |
0.22 ± 0.05 |
0.25 ± 0.05 |
0.23 ± 0.04 |
|
C16:0 |
16.65 ± 1.03 |
16.46 ± 1.22 |
16.99 ± 1.00 |
16.96 ± 1.10 |
|
C17:0 |
0.93 ± 0.08 |
1.34 ± 0.20 |
1.19 ± 0.11 |
1.24 ± 0.17 |
|
C18:0 |
18.48 ± 1.85 |
18.87 ± 2.34 |
19.08 ± 0.87 |
19.16 ± 2.39 |
|
C20:0 |
0.26 ± 0.03 |
0.26 ± 0.03 |
0.27 ± 0.03 |
0.27 ± 0.04 |
|
C22:0 |
0.03 ± 0.02 |
0.04 ± 0.03 |
0.03 ± 0.02 |
0.03 ± 0.01 |
|
C14:1n5 |
0.77 ± 0.15 |
0.66 ± 0.07 |
0.71 ± 0.07 |
0.69 ± 0.10 |
|
C16:1n7t |
1.13 ± 0.15 |
1.35 ± 0.24 |
1.24 ± 0.22 |
1.14 ± 0.21 |
|
C16:1n7c |
2.32 ± 0.31 |
2.61 ± 0.24 |
2.66 ± 0.23 |
2.38 ± 0.23 |
|
C18:1n9 |
28.09 ± 2.55 |
31.55 ± 3.91 |
33.79 ± 2.96 |
30.47 ± 3.25 |
|
C18:2n6 |
10.34 ± 1.87 |
8.10 ± 2.29 |
7.10 ± 1.79 |
8.49 ± 2.02 |
|
C18:3n6 |
0.08 ± 0.02 |
0.08 ± 0.02 |
0.08 ± 0.02 |
0.08 ± 0.02 |
|
C20:3n6 |
4.32 ± 0.91 |
3.76 ± 1.15 |
3.00 ± 0.74 |
3.85 ± 0.78 |
|
C20:4n6 |
1.14 ± 0.26 |
1.20 ± 0.37 |
1.22 ± 0.30 |
1.58 ± 0.38 |
|
C18:3n3 |
2.86 ± 0.51 |
2.76 ± 0.69 |
2.76 ± 0.58 |
3.28 ± 0.68 |
|
C20:5n3 |
0.35 ± 0.07 |
0.25 ± 0.07 |
0.19 ± 0.04 |
0.21 ± 0.05 |
|
C22:5n3 |
2.20 ± 0.51 |
1.92 ± 0.58 |
1.81 ± 0.45 |
2.26 ± 0.11 |
|
C22:6n3 |
0.30 ± 0.08 |
0.42 ± 0.13 |
0.40 ± 0.11 |
0.52 ± 0.11 |
|
Omega-6:3 |
2.8 ± 0.1 |
2.4 ± 0.2 |
2.2 ± 0.2 |
2.2 ± 0.2 |
Table1: Fatty acid composition of the meat samples. Data are presented as the percentage of total fat.
|
Minerals |
Ranch 1 (Kansas) |
SD |
N |
Ranch 2 (Nebraska-South Dakota border) |
SD |
N |
Ranch 3 (Montana) |
SD |
N |
Ranch 4 (Montana) |
SD |
N |
P value |
|
Al |
0.13 |
0.08 |
16.00 |
0.07 |
0.06 |
16.00 |
0.07 |
0.08 |
16.00 |
0.03 |
0.04 |
16.00 |
0 |
|
As |
0.01 |
0.01 |
16.00 |
0.01 |
0.02 |
16.00 |
0.03 |
0.02 |
16.00 |
0.02 |
0.02 |
16.00 |
0 |
|
B |
0.05 |
0.01 |
16.00 |
0.05 |
0.03 |
16.00 |
0.11 |
0.02 |
16.00 |
0.11 |
0.01 |
16.00 |
0 |
|
Ba |
0.00 |
0.00 |
16.00 |
0.00 |
0.00 |
16.00 |
0.00 |
0.00 |
16.00 |
0.00 |
0.00 |
16.00 |
NA |
|
Ca |
5.87 |
2.49 |
16.00 |
3.57 |
1.04 |
16.00 |
4.03 |
2.64 |
16.00 |
2.06 |
0.98 |
16.00 |
0 |
|
Cd |
0.00 |
0.00 |
16.00 |
0.00 |
0.00 |
16.00 |
0.00 |
0.00 |
16.00 |
0.00 |
0.00 |
16.00 |
NA |
|
Co |
0.00 |
0.00 |
16.00 |
0.00 |
0.00 |
16.00 |
0.00 |
0.00 |
16.00 |
0.00 |
0.00 |
16.00 |
NA |
|
Cr |
0.03 |
0.01 |
16.00 |
0.02 |
0.01 |
16.00 |
0.01 |
0.01 |
16.00 |
0.01 |
0.01 |
16.00 |
0 |
|
Cu |
0.05 |
0.01 |
16.00 |
0.06 |
0.03 |
16.00 |
0.04 |
0.02 |
16.00 |
0.03 |
0.01 |
16.00 |
0 |
|
Fe |
2.13 |
0.20 |
16.00 |
2.40 |
0.23 |
16.00 |
2.42 |
0.21 |
16.00 |
2.14 |
0.21 |
16.00 |
0 |
|
K |
485.45 |
27.33 |
16.00 |
466.24 |
24.18 |
16.00 |
436.31 |
31.90 |
16.00 |
419.84 |
25.35 |
16.00 |
0 |
|
Mg |
29.54 |
1.88 |
16.00 |
28.97 |
1.54 |
16.00 |
28.46 |
1.84 |
16.00 |
27.33 |
1.39 |
16.00 |
0.11 |
|
Mn |
0.01 |
0.01 |
16.00 |
0.00 |
0.00 |
16.00 |
0.00 |
0.00 |
16.00 |
0.00 |
0.00 |
16.00 |
0 |
|
Mo |
0.01 |
0.01 |
16.00 |
0.00 |
0.00 |
16.00 |
0.02 |
0.01 |
16.00 |
0.02 |
0.01 |
16.00 |
0 |
|
Na |
53.35 |
4.17 |
16.00 |
45.58 |
3.48 |
16.00 |
48.93 |
4.39 |
16.00 |
43.69 |
3.90 |
16.00 |
0 |
|
Ni |
0.00 |
0.00 |
16.00 |
0.01 |
0.01 |
16.00 |
0.00 |
0.00 |
16.00 |
0.00 |
0.00 |
16.00 |
0 |
|
P |
243.78 |
13.35 |
16.00 |
241.20 |
9.70 |
16.00 |
233.14 |
13.39 |
16.00 |
229.26 |
11.01 |
16.00 |
0 |
|
Pb |
0.00 |
0.00 |
16.00 |
0.00 |
0.00 |
16.00 |
0.00 |
0.00 |
16.00 |
0.00 |
0.00 |
16.00 |
NA |
|
S |
227.26 |
12.68 |
16.00 |
216.92 |
9.35 |
16.00 |
216.19 |
12.53 |
16.00 |
205.60 |
9.04 |
16.00 |
0 |
|
Se |
0.00 |
0.00 |
16.00 |
0.00 |
0.00 |
16.00 |
0.00 |
0.00 |
16.00 |
0.00 |
0.00 |
16.00 |
0 |
|
Si |
5.83 |
1.15 |
16.00 |
5.36 |
1.73 |
16.00 |
2.74 |
1.68 |
16.00 |
1.72 |
1.47 |
16.00 |
0 |
|
Sr |
0.00 |
0.00 |
16.00 |
0.00 |
0.01 |
16.00 |
0.00 |
0.00 |
16.00 |
0.00 |
0.00 |
16.00 |
NA |
|
Zn |
3.29 |
0.29 |
16.00 |
3.11 |
0.35 |
16.00 |
3.21 |
0.25 |
16.00 |
2.94 |
0.26 |
16.00 |
0.02 |
Table2: Mineral concentrations (mg/100 g wet weight) in bison meat samples from four geographic regions in the United States (Kansas), the Nebraska–South Dakota border, and two locations in Montana, and corresponding p-values for differences among regions. Data are presented as the mean ± standard deviation (SD) based on n = 16 samples per location. Statistical differences among groups were assessed using one-way analysis of variance (ANOVA). P-values indicate whether mineral concentrations differed significantly among the groups. “NA” indicates no variance detected across locations, precluding statistical testing.
 Figure 2. Variation in mineral composition of bison meat by geographic origin.
Bar graphs represent the mean ± SEM concentrations (mg/100 g) of calcium (Ca), iron (Fe), and zinc (Zn) in bison meat samples collected from four ranches: Kansas (Ranch-1), Nebraska, and South Dakota (Ranch-2), and two locations in Montana (Ranch-3 and Ranch-4). Significant differences in calcium levels were observed among the ranches, with Ranch-1 (Kansas) showing the highest calcium concentration (p < 0.0001). No statistically significant differences were detected in iron or zinc levels among the ranches. Statistical significance was determined by one-way analysis of variance (ANOVA) followed by Tukey’s post-hoc test. **p < 0.01, **p < 0.0001.
Figure 3. Effect of geographic origin on omega-6 to omega-3 ratio and individual polyunsaturated fatty acid (PUFA) content in bison meat.
Bar plots depict mean ± SEM for key fatty acids expressed as percentage of total fat across four different ranches located in Kansas (Ranch-1), Nebraska, South Dakota border (Ranch-2), and Montana (Ranch-3 and Ranch-4). (A) Omega-6 to omega-3 ratio; (B) linoleic acid (LA, C18:2n6); (C) alpha-linolenic acid (ALA, C18:3n3); (D) eicosapentaenoic acid (EPA, C20:5n3); (E) docosapentaenoic acid (DPA, C22:5n3); and (F) docosahexaenoic acid (DHA, C22:6n3). Distinct letters above bars indicate significant differences (p < 0.05) between ranches, as determined by one-way ANOVA followed by Tukey’s HSD post-hoc test.
Fatty Acid Composition
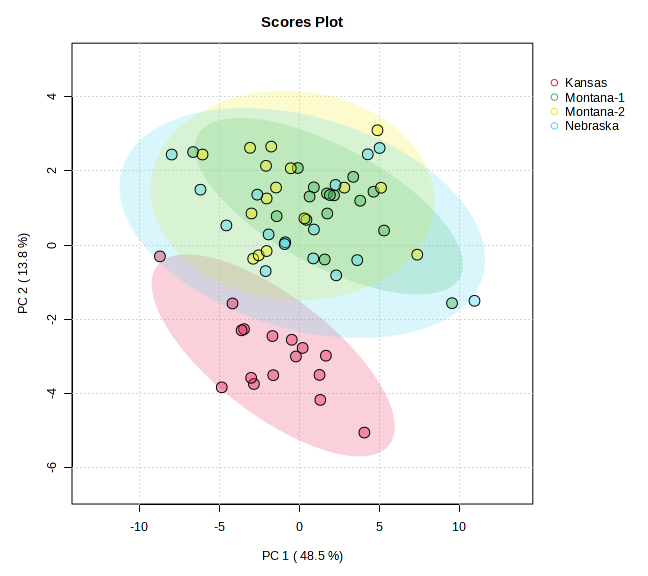
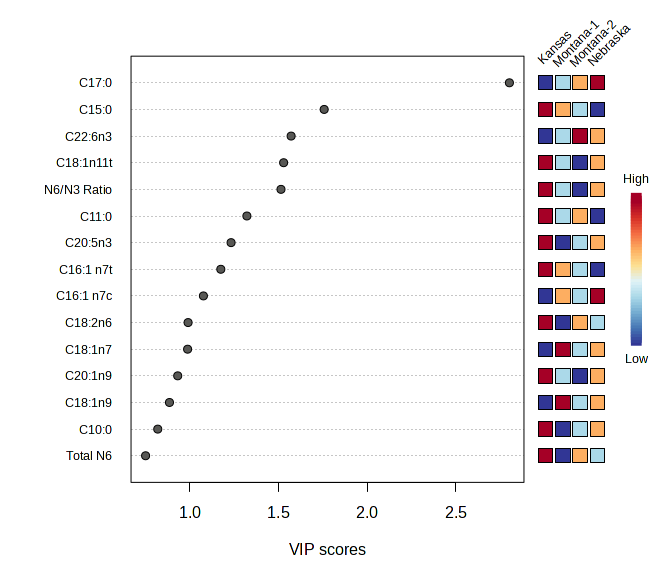
Figure 4 : PCA and VIP Scores for Meat Fatty Acid Data
Principal component analysis of meat lipid profiles (Figure 4) captured 62.3 % of the total variance (PC 1 = 48.5 %, PC 2 = 13.8 %) and revealed a strong geographic signal. Kansas samples formed a discrete cluster on the negative side of PC 1, indicating a fatty‑acid pattern distinct from all other sites. The two Montana ranches separated primarily along PC 2, underscoring ranch‑level nuances within the same state, while Nebraska grouped on the positive axis of PC 1 with limited overlap with Montana‑2. Variable‑importance‑in‑projection (VIP) analysis identified C17:0 and C15:0—odd‑chain saturated fatty acids—and an elevated n‑6 : n‑3 ratio as key discriminators of Kansas meat, suggesting a more saturated and pro‑inflammatory lipid profile. In contrast, the Montana ranches were characterised by higher levels of long‑chain omega‑3 PUFA (EPA and DHA), reflecting the influence of diverse, pasture‑based forage on lipid deposition. Nebraska exhibited comparatively greater monounsaturated fats and a lower n‑6 : n‑3 ratio, positioning its nutritional profile between Kansas and Montana3.
Mineral Composition
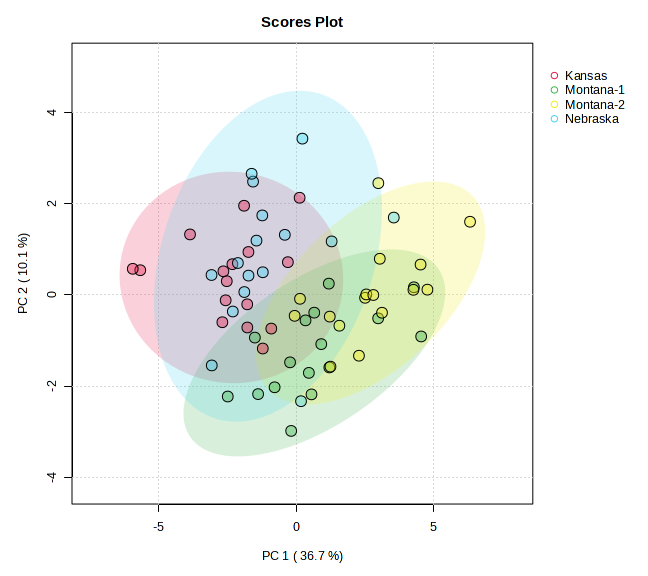
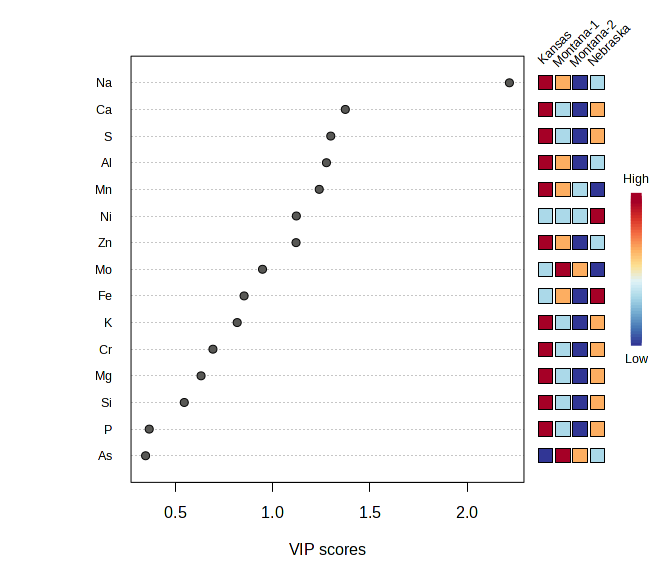
Figure 5 : PCA and VIP Scores for Meat Mineral Data
Multivariate analysis of elemental data (Figure 5) explained 46.8 % of the variation (PC 1 = 36.7 %, PC 2 = 10.1 %) and likewise demonstrated terroir‑driven differences. Kansas samples clustered exclusively on the negative side of PC 1 and were distinguished by markedly higher sodium levels (VIP > 2.0), consistent with local salt supplementation practices or saline soils. Nebraska loaded positively on both axes, while the two Montana ranches occupied intermediate yet distinct regions, highlighting intra‑state heterogeneity. Calcium and sulphur, together with trace elements such as aluminum, manganese, nickel and zinc, were principal drivers of separation among the Montana ranches and between Montana and Nebraska, mirroring subtle differences in soil geochemistry and botanical composition of the pastures. These mineral fingerprints reinforce the soil–plant–animal continuum and demonstrate that local environmental conditions and ranch management leave a measurable imprint on the nutrient quality of bison meat.
Discussion:
This study provides compelling evidence that terroir—the interaction between environmental conditions and farm management practices—significantly influences the nutritional profile of bison meat, particularly in terms of fatty acid composition and mineral content4˒5, with future analysis focused on phytochemicals. These findings support a growing body of literature recognizing that meat is not nutritionally uniform, and that nutritional composition is shaped by regional ecosystems and plant diversity6. Multivariate analysis using Principal Component Analysis (PCA) further confirmed this terroir effect. Fatty acid profiles of bison meat samples showed clear regional clustering, with Kansas samples separating distinctly from Montana and Nebraska along PC1 (48.5%) and PC2 (13.8%), indicating pronounced differences in lipid composition. Variable Importance in Projection (VIP) scores identified C17:0, C15:0, and the omega-6 to omega-3 (n6/n3) ratio as the top contributors to this separation. Notably, bison meat sourced from Montana exhibited higher concentrations of oleic acid (C18:1n9), a monounsaturated fatty acid associated with improved palatability and potential cardiovascular benefits such as reduced LDL cholesterol7˒8. Conversely, Kansas samples had the lowest oleic acid levels, likely reflecting differences in forage quality. The n6/n3 ratio, an important marker of dietary inflammation, was also more favorable in Montana samples (2.2 ± 0.2) than in those from Kansas (2.8 ± 0.1), reinforcing the notion that geographical location, and the plants therewithin, impact the nutritional composition of bison. Mineral composition analysis revealed similar terroir-associated patterns. PCA of mineral profiles showed moderate regional clustering, with Montana samples forming a distinct group, and Kansas and Nebraska showing some overlap. VIP analysis highlighted sodium (Na), iron (Fe), and nickel (Ni) as the primary variables contributing to inter-regional variation. These data align with the observed elevation of potassium and phosphorus in Kansas samples, which may be attributed to differences in soil mineral content or supplemental feeding practices10. Additionally, variable levels of trace elements such as aluminum (Al), arsenic (As), and silicon (Si) suggest potential environmental or geological differences across the ranches, with implications for both nutritional quality and environmental monitoring. These findings have direct relevance to sustainable agricultural production in the Western U.S. They emphasize that region-specific land-use practices, forage diversity, and soil health management are critical factors influencing the nutrient density of animal-sourced foods¹⁰. Encouraging regenerative grazing systems and site-adapted herd management could enhance the nutritional quality of meat while preserving ecosystem function and biodiversity12. This intersection of food quality and agroecology offers producers, particularly in the West, an opportunity to differentiate their products as mountain pastures are known to be amongst the most diverse and phytochemically-rich13. The strength of this study lies in the integration of standardized fatty acid and mineral profiling methods with multivariate statistical analysis and adequate biological replication. Future research should include landscape-scale ecological metrics (e.g., plant species composition, grazing rotation, and soil health indices), alongside animal performance and tissue nutrient outputs. The addition of physiological biomarkers (e.g., plasma and liver fatty acid levels) would provide further insight into how management practices impact meat quality and animal health.
Conclusion
This study underscores the role of terroir in shaping the nutritional composition of bison meat and offers actionable insights for sustainable agriculture in the western U.S.. Our findings suggest that regionally adaptive pasture-based bison production can improve the nutrient density of meat, particularly in terms of healthier fatty acid profiles and essential minerals, while aligning with the principles of regenerative land stewardship.
Future directions
Analysis in year 2 of the project will include phytochemicals of the meat from the different farms. Phytochemicals are known to be heavily impacted by ecoregion and plant type (terroir). In turn, phytochemicals are known to impact the flavor of the meat, which ties in with terroir. Additionally, the student and PI will aim to present the data in person at National Bison Association Annual meeting, which is attended by large number of ranchers within the bison industry. Additionally, the student will present data at the American Society for Nutrition 2025, which is highest attended conference in the nutrition field and is attended by scientists, dietitians, and other food industry stakeholders, which provides the opportunity to reach a broad audience and present on the nutritional profiles of bison meat. We will also present data on a field day at one of the Turner Ranches in 2026.
References
(1) Galbraith, J.; Rodas-González, A.; López-Campos, Ó.; Juárez, M.; Aalhus, J. Bison Meat: Characteristics, Challenges, and Opportunities. Animal Frontiers 2014, 4 (4), 68–73. https://doi.org/10.2527/af.2014-0036.
(2) Clingeleffer, P. Terroir: The Application of an Old Concept in Modern Viticulture. In Encyclopedia of Agriculture and Food Systems; Van Alfen, N. K., Ed.; Academic Press: Oxford, 2014; pp 277–288. https://doi.org/10.1016/B978-0-444-52512-3.00157-1.
(3) Evans, N.; Cloward, J.; Ward, R. E.; van Wietmarschen, H. A.; van Eekeren, N.; Kronberg, S. L.; Provenza, F. D.; van Vliet, S. Pasture-Finishing of Cattle in Western U.S. Rangelands Improves Markers of Animal Metabolic Health and Nutritional Compounds in Beef. Sci Rep 2024, 14 (1), 20240. https://doi.org/10.1038/s41598-024-71073-3.
(4) Daley, C. A.; Abbott, A.; Doyle, P. S.; Nader, G. A.; Larson, S. A Review of Fatty Acid Profiles and Antioxidant Content in Grass-Fed and Grain-Fed Beef. Nutrition Journal 2010, 9 (1), 10. https://doi.org/10.1186/1475-2891-9-10.
(5) van Vliet, S.; Kronberg, S. L.; Provenza, F. D. Plant-Based Meats, Human Health, and Climate Change. Front. Sustain. Food Syst. 2020, 4. https://doi.org/10.3389/fsufs.2020.00128.
(6) Provenza, F. D.; Kronberg, S. L.; Gregorini, P. Is Grassfed Meat and Dairy Better for Human and Environmental Health? Front. Nutr. 2019, 6. https://doi.org/10.3389/fnut.2019.00026.
(7) Marchello, M.; Driskell, J. Nutrient Composition of Grass- and Grain-Finished Bison. 2001.
(8) Turner, T.; Pilfold, J. L.; Jensen, J.; Prema, D.; Donkor, K.; Hamme, J. V.; Cinel, B.; Galbraith, J.; Church, J. Fatty Acid Profiles of Western Canadian Bison (Bison Bison) Meat. Journal of Field Robotics 2014, 3, 146–155. https://doi.org/10.5539/JFR.V3N6P146.
(9) Janssen, J.; Cammack, K.; Legako, J.; Cox, R.; Grubbs, J.; Underwood, K.; Hansen, J.; Kruse, C. G.; Blair, A. Influence of Grain- and Grass-Finishing Systems on Carcass Characteristics, Meat Quality, Nutritional Composition, and Consumer Sensory Attributes of Bison. Foods 2021, 10. https://doi.org/10.3390/foods10051060.
(10) Marchello, M.; Slanger, W.; Milne, D.; Fischer, A.; Berg, P. Nutrient Composition of Raw and Cooked Bison Bison. Journal of Food Composition and Analysis 1989, 2, 177–185. https://doi.org/10.1016/0889-1575(89)90079-3.
(11) Marchello, M.; Slanger, W.; Hadley, M.; Milne, D.; Driskell, J. Nutrient Composition of Bison Fed Concentrate Diets. Journal of Food Composition and Analysis 1998, 11, 231–239. https://doi.org/10.1006/JFCA.1998.0583.
(12) Thompson, L.; Rowntree, J.; Windisch, W.; Waters, S. M.; Shalloo, L.; Manzano, P. Ecosystem Management Using Livestock: Embracing Diversity and Respecting Ecological Principles. Anim Front 2023, 13 (2), 28–34. https://doi.org/10.1093/af/vfac094.
(13) van Vliet, S.; Provenza, F. D.; Kronberg, S. L. Health-Promoting Phytonutrients Are Higher in Grass-Fed Meat and Milk. Front. Sustain. Food Syst. 2021, 4. https://doi.org/10.3389/fsufs.2020.555426.
Research outcomes
Recommendations based on this research include the following.
- Region-specific grazing practices that enhance forage diversity and maintain soil mineral balance should be adopted and promoted, thereby improving the nutritional quality of meat.
- Support policies and market incentives for meat producers in the Western U.S. implement regenerative or low-input production systems that contribute to both human health and environmental resilience.
- Encouraging transparent labeling that reflects the region of origin and production method enables consumers to make informed decisions based on nutritional and ecological attributes.
- Develop integrated research frameworks that assess animal, plant, soil, and climate interactions to inform best practices for sustainable meat production.
- Incorporate metabolomic and stable isotope techniques in future studies to authenticate sourcing and identify biochemical signatures associated with specific production systems and regions.
By bridging the gap between ecological management and nutritional outcomes, this study contributes to a deeper understanding of how animal production in the Western U.S. can simultaneously support human health and agricultural sustainability. Continued interdisciplinary research is essential to refine these strategies and provide scalable solutions for sustainable food systems.
Education and Outreach
Participation summary:
Stephan van Vliet presented findings to bison procedures as part of the Turner Summer Meeting on April 22nd, 2025. Additionally, Dr. van Vliet provided education to bison producers at the International Bison Health Symposium in South Dakota in 2024. In both cases, bison producers were in the audience and Dr. van Vliet presented on the relationship between plant diversity and bison meat composition. The presentations are attached here: Bison_Health_Symposium_2024 Turner_Summer_2025.
Joseph Varre presented his research on “Influence of Diverse Finishing Methods on the Fatty Acid Composition of Bison Meat” at the Cultivating Agricultural Partnerships for Sustainability (CAPS) Summit in Salt Lake City, UT! On October 1st 2024, Link to the conference: https://site.pheedloop.com/event/CAPS/about
Stephan van Vliet presented findings to bison procedures as part of the Turner Summer Meeting on April 22nd, which was attended by about 30 producers and 20-30 stakeholders. Additionally, Dr. van Vliet provided education to bison producers at the International Bison Symposium in 2024, which was attended by about 70 producers and another 50-100 stakeholders and scientists. In both cases, initial findings from the current project were presented with multiple farmers expressing enthusiasm and willingness to improve diversity of pastures through strategic grazing and/or potential planting of species to improve biodiversity, which appeared as a strong predictor of nutritional quality.
