Final report for LNC15-373
Project Information
North Dakota’s growers face unique obstacles to successfully meeting the increased demand for fresh, local produce. While growing vegetables and fruit for farmers markets, direct farm sales and CSAs is challenging everywhere, North Dakota’s small-scale growers must deal with a colder climate and shorter growing season, sparser population, and a less established support network of fresh market vegetable growers than in other states.
ECH client farmers have consistently reported that a challenge they face in establishing their CSA farms and farmers market businesses is a lack of access to data. Market and production data can help the farmers plan for the next growing season and their farms’ future. While planning tools and data are available for other crops and other regions, no data and few tools are available for farmers market and direct sales growers in North Dakota.
Small-scale vegetable and fruit growers in North Dakota need farm planning data tailored to the region’s extreme climate and sparse population. The Entrepreneurial Center for Horticulture, an advisory board of farmers and industry professionals, and a team of partner farmers identified data types most relevant to farm planning in the region and collected that data over a three year period, creating data sets and data collection tools for Northern Plains sustainable vegetable and fruit growers to use in farm business planning.
Over a three-year period data was collected monthly and aggregated data shared online twice a year. By the project's end, a Northern Plains Specialty Crop Data Toolkit was published online as www.ndsmallfarms.com including all aggregated data collected. The Data Toolkit will be a resource Northern Plains specialty crop growers will use in farm business planning for increased social, environmental, and economic sustainability.
At the end of project year one, the data sets were not complete enough to give a usable picture of sales or production. Due to the vast differences in the producer/farmers locations, market channels, production methods, and infrastructure, it was difficult to appropriately compare them one to another. At this time the advisory board felt that case studies of each producer/farmer would be helpful for both new or expanding producers but also for resource professionals assisting with business planning. Case studies of the farmer/producers in the program who were willing to share their information in such a public way were developed. These case studies can be used by new farmers as examples of similar business models and guide decision making for future growth. Case studies can be reviewed at: ndsmallfarms - resources for educators.
At projects' end, the data collected indicated all farmer producers saw an incremental increase in net revenue per acre with a likelihood of $20,000 per acre in revenue from production. While some farmers had high tunnels and could possibly have had early season sales, a lack of market channels kept farmers from pushing production into early season unless they served CSA clients. Early planting dates did lead to early harvests, but without open and active farmers markets product could not be sold. Most farmers markets in North Dakota do not begin sales until July. Sales prices for product correlate to net revenue and overall participating producer/farm ers seem to be charging according to production cost sufficiently to make a profit. dcb_sare_specialty_crop_sales_data-2016_2018
You can also view the spreadsheet at www.ndsmallfarms.com
The data sets are being used by the ECH as they work with new and beginning producer/farmers in business and production planning. New farmers are using the information to plan income, planting dates, cash flow, and yields.
1. Selection of at least five data types which farmers will collect
2. Selection of the best collection and reporting tools for those five data types
3. Monthly data collection reports from 10 partner farmers submitted to ECH staff
4. Two data reports per year posted to the ECH website, showing aggregated farmer data on at least five types of data.
5. Collection of all data over a three year period.
6. Publish the data sets and case studies online and summary reports and media releases regarding the availability of the data in print for use by producer/farmers and resource professionals while planning for starting or expanding vegetable production operations in North Dakota.
Cooperators
Research
North Dakota’s growers face unique obstacles to successfully meeting the increased demand for fresh, local produce. While growing vegetables and fruit for farmers markets, direct farm sales and CSAs is challenging everywhere, North Dakota’s small-scale growers must deal with a colder climate and shorter growing season, sparser population, and a less established support network of fresh market vegetable growers than in other states.
ECH client farmers have consistently reported that a challenge they face in establishing their CSA farms and farmers market businesses is a lack of access to data. For example a farmer establishing a new vegetable enterprise might wonder how many pounds of carrots they can expect to produce per foot as they are laying out rows. Farmers setting up a new CSA might wonder how many tomato plants they need to grow to meet the expectations of their customers. A grower with a newly erected high tunnel may know their planting and harvest dates outdoors, but wonder when to begin planting in the high tunnel and how long to expect their harvest to be extended. A grower selling at the farmers market for the first time might wonder what prices customers are willing to pay.
Market and production data can help the farmers plan for the next growing season and their farms’ future. While planning tools and data are available for other crops and other regions, no data and few tools are available for farmers market and direct sales growers in North Dakota.
This data collection project has been designed with thought toward addressing constraints. The partner farmers are all very busy running their farms and even the most central meeting locations still require at least two hours of travel for some farmers. Funds were used to conduct advisory board and producer meetings via telephone and online and a travel stipend was provided to reduce the travel burden for face to face meetings.
Research shows that opportunities are ripe to expand small-scale, direct market produce businesses. In order to sustainably grow farm enterprises, farmers need access to data for farm business planning. This project met the need for direct market vegetable and fruit production and market data by engaging farmers in identifying what is most needed and collecting the data on their farms. In meeting this need, the data collection project will help to increase the social, environmental and economic sustainability of Northern Plains direct market farms.
This project was rooted in involvement and input from partner farmers and agriculture professionals. Farmers know best what data and tools will help them further develop their farm enterprises and their input was vital to the project’s success. A project advisory board of five farmers and three agriculture professionals was identified and all members agreed to participate and submitted letters of support The advisory board consisted of experienced partner farmers and agriculture professionals, all of whom operate or have operated their own farm as well as providing assistance to other farmers. Several of the advisory board members have extensive experience in collecting data and using data in farm business management on farms. The advisory board provided direction and oversight to the project.
Using the results of a farmer survey and based on their own experience the advisory board determined which types of data (at least five different types) small-scale vegetable growers need most. Ten partner farmers participating in data collection attended a training workshop in data collection methods. The farmers collected data over the course of the three-year project period, reporting their data monthly to ECH staff who aggregated and analyzed the data and published data sets on the ECH website, www.ndsmallfarms.com twice per year. A final Northern Plains Specialty Crop Data Toolkit, www.ndsmallfarms.com published on the final data sets at the project’s conclusion. The Data Toolkit includes all of the data sets collected.
Based on the questions the ECH staff have received from the farmers they assist, they determined farmers may want to know average first planting dates according to which part of the state a farm is in. Other data types include first harvest dates and final harvest dates for various vegetable crops, yield data such as the number of pounds of a crop that can be harvested per foot of row planted. Farmers Market vendors might want pricing data to help them determine how to price their vegetables. Pricing data was also collected.
Prior to the advisory board’s first meeting, ECH staff conducted an online survey of small-scale vegetable growers in North Dakota. This survey included over thirty growers who received technical assistance from the ECH and over 120 farmers market and direct sales growers across the state. The survey asked farmers questions about the types of data that could help them in planning for their farm businesses and what types of data they wish they’d had access to when they first started. It also asked about farmers’ proficiency with online tools and software and included questions about farmers’ engagement in farm business planning.
In the first advisory board meeting, the board discussed the results of the survey as well as their own data needs on their farms or the needs of farmers they serve. Based on this discussion the advisory board selected the five types of data identified by farmers as most necessary. In addition to choosing the types of data collected, the advisory board also weighed in on the tools used both to collect and record data. Depending on data collected, the ECH provided partner farmers with thermometers, scales or other equipment to ensure they have the tools they needed and were using uniform collection methods. The advisory board also discussed what tools to provide farmers for recording data. Some farmers prefer to simply use a pencil and notepad, others keep records using digital technology. The advisory board discussed what collection tools and data recording tools to use prior to the training session so that the ECH could provide those tools to farmers.
A data collection training session was held for partner farmers and advisory board members after the types of data were chosen. At this session ECH staff and farmers decided which farmers would collect which types of data. Farmers were provided with the tools to collect and record their specific information sets. A monthly data reporting system was set up and farmers were trained on using the data collection equipment and reporting tools and monthly data reporting system.
The ten partner farmers who collected data have been carefully selected with an eye toward creating a diverse pool of growers collecting data. These farmers are located across the state in regions with varying climates, and populations. Farmers in the northern part of the state are in zone 3b with an average low temperature of -35 to -30 degrees F, while farmers in the southern part of the state are in zone 4a with an average low temp of -30 to -25 degrees F. Four Seasons Farm is in Bottineau County which has areas that fall in zone 3a, with average low temps of -40 to -35 degrees F and farms in LaMoure County and Sioux County (Sue Isbell) are near warmer pockets and small patches of zone 4b with average low temps of -25 to -20 degrees F.
Additionally, the farmers vary in their expertise and access to tools and resources. Some, but not all, of the partner farmers have high tunnels, which allow them to plant earlier and harvest later. Some farmers already collect data for their own use in farm planning. Because of this diversity the farmers did not all collect the same information. Farmers were assigned different data collection projects based on their resources and expertise. For example, North Star Farms excels at tracking the weight of the produce they grow and making comparisons from one year to the next, thus it was logical to assign that data type to North Star Farms.
Data was collected throughout the three-year grant project period. Because the project period began in October 2015 and ended in September 2018 the third year’s growing season was not quite finished when the initial project period ended. The ECH requested a project extension, allowing for the full growing seasons information to be added to the final report.
As farmers reported their monthly data, ECH staff aggregated and analyzed the data that was reported. Aggregated data sets were uploaded to the ECH website, ndsmallfarms.com twice a year. The first farmer data reports began coming in to the ECH staff between April and June of 2016 and the first reports were posted to the ECH website in September 2016, reporting on what was tracked in April - August 2016 and the second in January 2017, reporting the full 2016 growing season.
Each farm collecting data received at least one on-farm visit from ECH staff during the course of the project. ECH staff monitored the data collection and provided guidance as needed.
In April 2018 a second survey was sent to vegetable and fruit growers across the state. The survey asked questions to determine if farmers are aware of the new data sets, if they are using the newly available data, and if their farm business planning had increased. Unfortunately, even though all efforts to market the survey were pursued, not enough survey participants were collected to make the final survey statistically valid.
By the end of the project period (September 30, 2018) farmers recorded data for three full growing seasons. At least five data sets covering three growing seasons have been published to www.ndsmallfarms.com with each set having data from at least two and up to ten farmers. Each data set is one type of data, for example, yield of a vegetable crop by planted size, recorded by several different farms.
Impacts
dcb_sare_specialty_crop_production_data2016_2018
dcb_sare_specialty_crop_sales_data2016_2018
The following key points were identified through this data collection process:
o Plant and Harvest Dates
- Farmers chose their plant and harvest dates based on personal needs first; then on market and weather permissibility. Those farmers that rely on farmers market sales see no advantage to early planting which leads to early harvest if the farmers markets do not begin sales until July. There was no significant difference in planting dates between those with high tunnels and those using field plantings. Most do not adjust their planting dates to capture market demand or to affect overall profitability or marketability. Collecting plant and harvest dates was easiest for farmers who used a google doc form to input the data straight from the field. However, many of the participating farmers do not use their smart phones as farm management tools.
Early planting in warm spring years did result in more successive planting dates by producer/farmers, leading to increased yields in some crops.
o Harvest Yields
- 10 specific crops were identified at the beginning of the growing season. Seven of the ten producers were tasked to collect their harvest yields on these crops. This was also the most difficult information for farmers to collect. Busy harvest time meant producer/farmers were focused on collection and sales of produce and not record keeping. Record keeping versus time seems to be an obstacle for most producers. Making record keeping a priority and incorporating it into their routine assist farmers in keeping accurate records. Once a producer has several years of records to compare, they seem to see the value of record keeping to their operation.
- Data was so explicit to each farm, that it is impossible to accumulate it into a whole data set. There are too many variables that affect harvest yield from farm to farm for the data be considered useful as an aggregate. Individual farmers would likely benefit from monitoring this data for themselves, comparing their production from year to year; but there is no simple collection system at this time that fits all or most farmers’ management systems. The case studies collected will allow start up farms to compare themselves to others and judge the similarities in operations for basing possible production methods and sales channels.
- Data yields of various crops may be useful to potential start-ups and service providers (mainly lenders) by showing the yield time pattern of harvest yields throughout the growing season. For instance, farmers may be able to determine that they expect to harvest 10 pounds of tomatoes per plant throughout a growing season. But, it would be beneficial to also realize that most of those ten pounds are harvested during a peak production week (or few) with lesser pounds being harvested before and after the peak. We do not currently have data in North Dakota (or by region) showing when those peak production weeks are for various crops, so that farmers can plan their marketing or develop markets for specialty crops accordingly, however by the final year of the project some speculations may be drawn from the data.
- All participating farmers did not grow enough of each chosen crop to warrant collecting harvest yield off of them. Further, most did not want to collect harvest yield for all ten crops. Considering we cannot accurately combine the information from farm to farm, each farmer was asked to only collect yield data on one or two crops that they grow the most of, so that the data is functional and useful for the end user.
o Revenue and Expenses
- The farmers collecting this data varied in the level of information they opted to share. One farmer uses Quicken and was easily able to share their monthly data. Another uses an excel worksheet, by which they monitor their financial activity; this works well for their management and the grant’s data collection process as well. Two farmers submitted very basic information that does not reflect a full picture of their operation. All of the 2016 financial information is skewed, due to the timing of the producer training meeting. Data from 2017 and 2018 seasons was more complete. Financial data was collected from January through December. The most valuable information we collected through this category would be the case studies (highlighting how much product by sales could be sold off of a given acreage which proved to be $20,000 net revenue per acre) and a few projections of potential cash flows scenarios for various marketing strategies. It may also be useful to see how large capital expenses affect farmer’s cash flow. For instance, if they did not borrow or already have money for capital expenses, producer/farmers expected the farm operation to pay for its operating and capital expenses each year, thus showing larger expenses in some years and also larger expense months in late or off-season months while capital expenses were being purchased. This is the case with Farmer 1 in the data. This producer has made larger purchases over the last three years. The purchases were planned and the producer made sure that she sold enough during the season so as to hold her net revenue steady. Some of the expenses included tillers and a small greenhouse.
- One participating farmer had high sales in the off season as they used lower quality produce to create value added products which were then sold outside of the growing season. This value added use of unsold produce assisted in increasing net revenue and off season sales. Other producer/farmer data shows high levels of revenue early in the year. This corresponds to CSA customer payments.
Farmer three stopped doing business in the final year of the project and returned to college out of state.
o High Tunnel Soil Tests
- Farmers had no trouble collecting their high tunnel soil data. Many were glad that they did. Soil data from 2016 was compared to subsequent year’s soil data to try and identify a trend. Again, one cannot oversimplify the data collected, as each farmer manages their high tunnel differently. Most producers add organic material (manure compost, or others) each year, whether they need the nutrients or not. This practice skews the data regarding the crop needs and use of nutrients. Perhaps due to the arbitrary inclusion of compost type products, there is an obvious reading of high potassium in many of our tested tunnels. A publication describing best high tunnel soil management practices, from year to year over a longer time frame, would be useful. After a discussion with NRCS soil specialist at the local foods conference, participating producer/farmers are considering changing their practices and are going to try to get a new soil tests and information for future planning.
o Market Channels (as a % of sales revenue)
- This data is reported based on sales revenue. During 2016 and 2017 this was only collected from the few farmers who were reporting their expenses and revenue. Beginning farmers and service providers may find it useful to become familiar with the various marketing mixes experienced specialty crop farmers use to sell their products as none of the participating farms relied on a single market channel for all sales. This mix of market channels seems to offset any highs or lows that are experience by selling via a single market channel. As shown in the data, producer/farmer revenue remained relatively stable even as fluctuations in CSA versus farmers market sales were noted. Market channel also affected planting schedules as early planting was only used by producers who cater to CSA customers while farmers market vendors planted later to meet harvest dates for opening of their market.
Grant Results
Through the activities of this SARE grant, we have established a baseline for a few data sets that may be useful to small farm stakeholders in the Northern Plains. We also have established a database of case studies for our farmer participants. The Advisory Board reviewed all data at the project end and discussed best practices for dissemination of information.
Obstacles
- 5 data types were identified as potentially useful information for: service providers, start-up farmers, and current farmers. They were: Plant and Harvest Dates, Harvest Yields, Revenue and Expenses, High Tunnel Soil Tests, Market Channels (as a % of sales revenue) instead of 10.
- Each participant was responsible to collect two or three of the 5 data sets.
- Data collection did not begin until April/May 2016.
- About ½ of the participating farmers got their data collected and turned in monthly with ease. Others had farming difficulties and were not able to collect and disseminate their data easily.
- One farmer quit farming after the 2016 growing season and was replaced with a new cooperating farmer. An additional farmer quit in 2017. The Farm Manager position at DCB was vacant in 2017 and thus no data exists for the 2017 growing season for this location.
In conclusion, Northern Great Plains vegetable producers have the potential to produce revenue from productio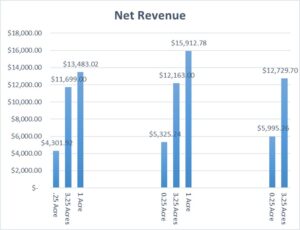 n sufficient to sustain operations and generate profit. Careful consideration of market channels and production to meet the specific channel is necessary along with accurate and complete record keeping assists in altering planting dates and amounts to meet fluctuations in markets. Potential for revenue can be as great as $20,000 per acre with proper management.
Education
Producer/farmers in North Dakota were surveyed to determine the types of data they currently collected and the types of data they would seek out if it was available. Thirty-six percent of survey respondents indicated business data, such as revenue, expense, and sales by market channel information, was data they would research in preparation for expanding or beginning their business. In addition to business data, yield by crop and planting schedules were identified by approximately 30% of respondents. Armed with this information, ECH staff and the advisory board worked together to determine methods of data collection in these areas.
Survey participants were also asked to rate their preference for receiving educational materials on a scale of 1 to 5 where 1 = would not use and 5 = definitely would use. The top ranking methods for use of educational materials were checklists, web-based handouts, fact sheets, and online materials. These responses guided the ECH staff and advisory board in development of the online toolkit and information hosted at www.ndsmallfarms.com
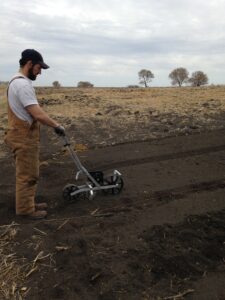
In the first few months of the project, participating producer/farmers were trained in data collection methods and tools. This training was accomplished in a face to face training session. Producer/farmers were given tools for collection such as soil test kits, thermometers, scales, charts and excel spreadsheets for recording. Each participating producer/farmer also received at least one on farm visit from ECH staff to answer questions about data collection methods and use of tools.
Beneficiaries of this project can access information collected, summaries, and case studies via the online toolkit www.ndsmallfarms.com. The information presented will be used by agricultural professionals providing assistance to beginning and expanding vegetable producers in the Norther Great Plains. It will also be used by producers and farmers as they begin or expand their operations.
Educational & Outreach Activities
Participation summary:
The online toolkit, www.ndsmallfarms.com has received 1,114 visits from 528 unique visitors who viewed more than 2 pages since its inception in 2017. The specific page on the site that hosts the SARE grant information has received 39 unique visitors, an increase in 49% since the final project information was posted.
ECH staff plan on presenting the summary information at an educational session to be held in February 2019 at the North Dakota Local Foods Conference. Exact date and location to be determined.
Learning Outcomes
- Record keeping
- Specialty crop production techniques
- Small farm management - cash flow
- Product Pricing for direct sale of vegetables
Project Outcomes
"Received a grant, purchased new supplies and changed garden planting schedule."
"Information has helped get an idea of what people want and what to grow"
"Built a high tunnel"
"I am going to see if I can get people interested in CSA and selling wholesale"
"Bought equipment for my FM booth and applying for Farm Mgmt. Program"
"Provided all farmers market members with info regarding the ECH & NDFMGA and their resources""Not sure CSA would be for me after talking with your staff, more interested in local grocer or institutions for produce sales"
One cooperating producer/farmer within the project works with a Native American population. The data was 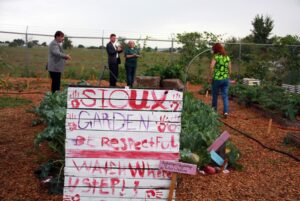 collected from gardens on Native American reservation land and were a part of a community gardening project. The producer/farmer reports, "We now have some of our enrolled members actively involved in the day to day projects. The community engagement has grown over the years and several community members now have family gardens. We are freeze drying produce and have used it with soups at community feeds. Our long term goal is to develop a freeze dried soup mix that can be distributed to the Elders."
A producer/farmer in the central part of the state who accessed the information via ndsmallfarms.com had this to say, "Wow, the sales spread sheet... Very interesting. I think BOTH of these sheets are very very helpful and more data on expenses versus sales and venues would be super cool. Also the difference in regions because of population and/or market differences. As far as those case studies, its about time folks started sharing their expertise in this state… good information, I am pleased and would like to see more."
Another producer/farmer commented, "I found the production data very useful. This year will be my first year producing in a high tunnel. I will be using the data to decide my plant dates in the high tunnel. It is beneficial having guidelines for the plant dates and expected harvest dates as I plan my market season. What I found most interesting about the sales data is how much revenue could be generated by using very little acreage. The case studies were very interesting. Reading them made me realize that some of my problems are not unique. Personal life does interfere with gardening life. It is good to have verification that other farmers have at times had to choose between what to crops to save-keep in production and having to let some go. That my market is not the only one that may have individual differences between members. It also reinforced that at the end of every year you need to take stock of what was successful and what was not and where do you want to take your business in the future."
A producer/farmer in central North Dakota had this to say, "I found the sales and production data that was collected as part of the SARE grant very informative. Reading the case studies, I was made aware that all producers have their own unique struggles with plants, weeds, weather, and pests. These problems are a fact of life, not a personal failure. As a producer it was clear there is much more than just soil and fertilizer to think about when you decide what to plant. Many variables influence how well and how fast a plant grows and produce. The production data would be very useful to beginner gardeners, giving them a timeline for possible planting dates. In North Dakota there are so many variables to take into consideration before putting seeds into the soil. Like the saying “the more you know, the better you grow” I’ll take this information and adapt it to my own personal circumstances, adjusting my methods with each year’s experiences. Part of the farmer’s market experiences is providing a good fresh locally grown product to our friends and neighbors."
Future work specifically on high tunnel soils would be beneficial to producer/farmers. This work should be over a longer timeframe to record and work on solutions to soil changes over time.
Future work on data collection in these areas should first set parameters for units of measurement. Production data should be kept in a uniform unit such as row feet and all yield data should be standardized into pounds or ounces instead 'by the bunch'. All participants should grow the same varieties for better comparison, although this would be difficult to accomplish with producer/farmer cooperators as their profitability relies on growing varieties their customers desire and varieties they are familiar with.