Final report for LNC17-395
Project Information
Deep Winter Greenhouses (DWG) are a new production system available to farmers in the North Central Region. The DWG utilizes a steeply sloped glazing angle to capture solar heat that is stored in a heavily insulated foundation filled with crushed rock. That heat is available to the growing area at night when internal temperatures cool. DWGs require very little external delivered heat and are functional with minimal electricity except that which is required to operate fans and room lights. The system, however, is currently small scale and has high startup costs. This project looks to identify opportunities to maximize production of cold hardy and low light crops, identify enterprise performance of existing producers, and make information about DWGs available to a broad public.
Outcomes will give farmers the ability to make sound business decisions when incorporating Deep Winter Greenhouses into their enterprises.
Learning outcomes include:
Horticultural learning outcomes
- Know the best winter crop varieties
- Understand optimal seeding densities
- Understand optimal horticultural substrate for winter production
Enterprise learning outcomes
- Understand how to increase return on investment
- Know how to maximize space
- Identify optimal marketing channels
Action outcomes
- Project research results shared broadly through producer networks and social media
- DWG producers increase yields by adopting research recommendations
- Producers make informed decisions to adopt DWG technology
University of Minnesota Extension’s Regional Sustainable Development Partnerships (RSDP) will partner with farmers and researchers to advance deep winter food production in Minnesota using Deep Winter Greenhouses (DWG). The DWG uses passive solar technology to store heat in a thermal mass of crushed rock to create an environment where low-light and cold-tolerant crops can grow throughout the winter with minimal use of fossil fuel heat. If widely adopted, this technology would allow small- and medium-scale farmers in the North Central Region to grow and market locally grown produce throughout the entire year. In the Deep Winter Food Production in the North Central Region project, researchers will conduct an enterprise analysis of existing DWGs to evaluate business performance and identify best practices; conduct horticultural trials to maximize production in this unique system; and host Extension outreach events to increase awareness of DWGs and share research results. This project will provide farmers looking to adopt DWG technology with the knowledge and skills needed to manage a successful DWG enterprise for deep winter food production.
Cooperators
- (Researcher)
- (Educator and Researcher)
- (Educator)
- (Researcher)
- (Researcher)
- (Educator and Researcher)
- (Researcher)
- (Researcher)
- (Researcher)
- (Researcher)
- (Researcher)
- (Educator)
- (Educator and Researcher)
Research
- Researchers will be able to identify optimal soil mixes, seeding densities, and crop varieties to grow in DWG systems
- DWGs can be a profitable enterprise for small- and medium-sized farms
Production Trials
(Learning outcomes: Select crop cultivars, understand seeding densities, choose substrate mixes)
Horticultural Production Trials Objectives and Methods
Objectives:
- Evaluate new crop cultivars suitability for DWG production based on yield, days to maturity (DTM), and quality
- Optimize seeding densities for maximum production in commonly grown DWG crops
- Identify optimal substrate mixes for winter production based on crop yield and substrate quality price, and availability
Methodology:
In early 2018, the first winter for research, the cultivar and substrate selection trials, led by UMN Horticulture faculty Dr. Mary Rogers and Researcher Claire Flavin Hodge, were conducted at 2 out of the 5 DWG 2.0 prototype project partners' sites: Organic Consumers Association, Finland; Alternative Roots Farm, Madelia; and Carol Ford’s DWG 1.0, Garden Goddess, Milan. The seeding density trial was only conducted in a greenhouse at the University of Minnesota’s Plant Growth Facilities, St. Paul.
In the late 2018-early 2019 season, two more DWG 2.0 prototype sites were involved in this research: Bemidji Community Food Shelf and Lake City Catholic Worker Farm. Grampa G’s Farm, Pillager plans to join in 2019.
- Select crop cultivars
- Researchers will identify new cultivars for DWG trials based on appropriate traits for the unique DWG microclimate, and their demonstrated performance, days to maturity, and yield.
Trials were performed at the UMN plant growth facilities in climate-controlled plant growth chambers and at DWG grower sites. This experiment was repeated twice at Finland and Milan, referred to as ‘plantings’, but only once in Madelia given the farmer’s preference for personal transplant production in the space. Planting dates were in early 2018 were: Jan-15 in Madelia, Jan-19 and Mar-12 in Finland, and Jan-16 and Mar-27 in Milan.
Experimental design. We followed current DWG growing methods, and utilized standard gutters as our planters. Typically, these gutters are either hung in slings from the building rafters, or set on wood shelves, in vertical tiers to maximize sunlight on each gutter. We employed a 3-tier metal shelving unit with shelves 18” apart in order to optimize space and efficiency, and hopefully limit shading. Six gutters were placed on each shelf and blocked as replicates in a randomized complete block design, i.e. the top shelf was Rep 1, middle shelf was Rep 2, and bottom shelf was Rep 3. In order to maximize the number of cultivars trialed in the limited space, gutters were divided in half and each cultivar was seeded into respective half-gutters. Gutters were rotated or flipped in place within each shelf periodically to decrease the effects of shading on plants further from the glazing wall.
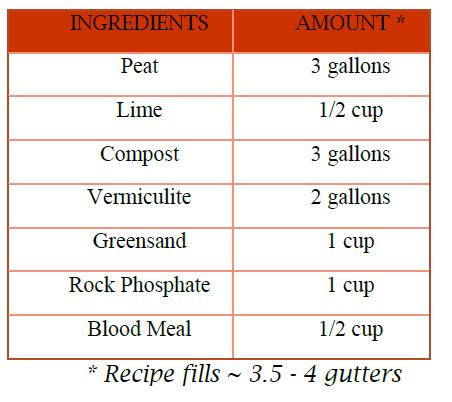
Growing methods. Twelve cultivars of salad greens were trialed in this study (Table 1), chosen based on grower preferences, previous research in winter greenhouses, and seed company descriptors of traits such as “germination at low temperatures”, “slow to bolt”, and/or “fast-growth” that would be beneficial in the unique DWG system. Greens were seeded at rates, ranging from 0.37 to 0.56 seeds in-2 depending on seed size, based on seed company recommendations. Seeds were then covered lightly with vermiculite and pressed down to ensure good seed-substrate contact. Gutters were watered as needed according to grower practices. Greens were grown in a custom grower mix, consisting of peat, vermiculite, Purple Cow compost (0.7-0.3-0.3), lime, blood meal, greensand, and rock phosphate.
Table 1. Twelve cultivars of leafy salad greens that were grown in Deep Winter Greenhouse trial in Minnesota during the winter months of 2018.
|
Cultivar |
Crop Type |
Crop Species |
Company |
|
Esmee |
Arugula |
Eruca sativa |
Johnny's Selected Seeds |
|
Vitamin Green |
Asian green |
Brassica rapa |
High Mowing Organic Seeds |
|
Spigariello Liscia |
Leaf broccoli |
Brassica oleracea |
Johnny's Selected Seeds |
|
Frisee |
Endive |
Cichorium endiva |
High Mowing Organic Seeds |
|
Gemstone Blend |
Asian green and mustard mix |
Brassica oleracea + juncea |
High Mowing Organic Seeds |
|
Madeley |
Kale |
Brassica oleracea |
Adaptive Seeds |
|
Florence |
Lettuce |
Lactuca sativa |
Adaptive Seeds |
|
Salanova Foundation Collection |
Lettuce |
Lactuca sativa |
Johnny's Selected Seeds |
|
Mizspoona |
Asian green |
Brassica juncea |
Adaptive Seeds |
|
Red Veined Sorrel |
Sorrel |
Rumex sanguineus |
Johnny's Selected Seeds |
|
Regiment |
Spinach |
Spinacia oleracea |
High Mowing Organic Seeds |
|
Shelby |
Spinach |
Spinacia oleracea |
High Mowing Organic Seeds |
Data collection. Greens were harvested at maturity (~4”), recording days to maturity (DTM), and fresh weight yield. Up to three harvests were taken on each cultivar depending on the growth rate and quality. Yields are expressed based on quantities from the half-gutter. Qualitative notes were also taken by the farmers.
- Understand optimal seeding densities
- DWG seeding is done by hand broadcasting, which can lead to inefficient and inconsistent seeding densities. Current DWG growers have expressed a need for science-based recommendations on optimizing seeding densities for maximum production. Researchers tested three different seeding rates with three different crops in a greenhouse at the U of M St. Paul campus.
Experimental design.
- 3 crops: ‘Astro’ arugula, ‘Tokyo Bekana’, and ‘DMR Lettuce Blend’
- 3 seeding density treatments:
- Recommended rate for each crop based on seed company label
- Grower standard rate (calculated at 4x recommended rate)
- Middle rate (2x recommended rate; ½ grower rate)
- Randomized complete block design with 4 replicates.
Growing methods. Greens were grown in gutters filled with a custom soil-less substrate mix consisting
of peat, vermiculite, Purple Cow compost (0.7-0.3-0.3), lime, blood meal, greensand, and rock
phosphate. Seeds were then covered lightly with vermiculite and pressed down to ensure good
seed-substrate contact. Gutters were watered as needed.
Data collection. Greens were harvested at maturity (~4”), recording days to maturity (DTM), and fresh weight yield. Up to two harvests were taken from each gutter depending on the growth rate and quality, where the arugula crop only yielded one harvest before bolting, while the other two crops were able to yield two harvests. Yields are expressed based on quantities from the gutter. Qualitative notes were also taken.
- Understand optimal soil-less substrate
- Researchers will identify optimal substrate mixes for winter production based on yield, quality, price, and availability.
Experimental design. Experiments were replicated at the 3 DWG locations during the production season, using three different crops depending on the planting. Treatments will be replicated sequentially, for a total of three replicate experiments across three locations and three crop types (see below).
- Jan 1- Jan 30: ‘Astro’ arugula
- Feb 1- Feb 28: ‘Tokyo Bekana’
- Mar 1- Mar 30: ‘DMR Salad Blend’ lettuce
Greens were seeded at recommended seeding rates into gutters. Media treatments included the grower standard mix, consisting of peat, vermiculite, Purple Cow Compost (0.7-0.3-0.3), rock phosphate, greensand, bloodmeal, and lime; JavaCycle (4-4-4) mixed with Purple Cow Potting Mix (0.5-0.2-0.4), and Dick’s Super Soil (Ottertail, MN).
Data collection. Greens were harvested at maturity (~4”), recording days to maturity (DTM), and fresh weight yield. Up to two harvests were taken from each gutter depending on the growth rate and quality. Substrate was sampled for micronutrients (Ca, Fe, K, NO3), electrical conductivity (EC), and pH. Foliar analysis will measure (NO3, Ca, Fe, K and Na) at harvest times (3 treatments x 3 crops x 3 replicates x 3 locations =81 samples per year each for media and foliar analysis). Fresh weight yield, as well as dry biomass, was also measured.
In year two, three different crops were grown according to sub-season; ‘Astro’ arugula in the Diminishment season, ‘Red Giant’ mustard green during the Solstice season, and ‘Five-Star Lettuce Mix’ during Expansion. Crop yield was evaluated in four different substrate mixes: 1) standard Grower Mix containing Mississippi Topsoils compost, 2) Grower Mix without the bloodmeal, 3) Grower Mix with Purple Cow compost instead of Mississippi Topsoils, and 4) Mississippi Topsoils’ Potting Soil. This trial took place at four DWGs throughout the winter of 2018-2019 across four reps. These alterations of the Grower Mix recipe were made based on grower concerns for potential excess nitrate in the mix.
Enterprise Analysis Methods
Objectives:
- Understand how to increase return on investment
- Know how to maximize space
- Identify optimal marketing channels
Methodology:
Detailed information was collected about start-up and operating costs, greenhouse dimensions, and labor inputs from eight winter greenhouse operators in the Upper Midwest. The scope of the study was limited to operations selling food produced in the greenhouse and using the Garden Goddess deep winter greenhouse design as outlined in The Northlands Winter Greenhouse Manual (polycarbonate-covered greenhouse of stick construction with a subterranean heat sink and heavy insulation). Since its publication in 2009, The Northlands Manual has inspired many people to build winter greenhouses. A total of 21 operating in the Upper Midwest (North and South Dakota, Minnesota, and Wisconsin) were identified after investigation both online and through interviews with winter greenhouse operators, but only fourteen were deemed commercial in nature (others were at educational institutions or for personal use only). Of the fourteen, eight elected to participate in this study. Half were relatively new winter greenhouse operators, whereas half had built and started operating their greenhouses between five and 20 years ago.
Data collection procedure
During winter 2017-2018, participants were recruited through phone calls, email, and a mailing. Participants received data collection spreadsheets to fill out regarding start-up and annual variable costs, as well as labor inputs. Individual financial records were used to complete the spreadsheets, and while many respondents had very accurate and precise records, participants estimated figures at times based on past production experience. Consequently, these assumptions may affect the precision of study findings.
Calculations and Comparisons
Since the primary questions about deep winter greenhouse operations are about financial returns and payback, analysis is focused on annual return to operations and labor but with a special emphasis on return on investment and payback time. The operational costs and returns vary significantly, and only one greenhouse did not experience a positive net revenue.
Production trials
- Select crop cultivars
Lettuces such as ‘Florence’ and ‘Salanova’ and Asian greens/brassicas such as ‘Gemstone Blend’ and ‘Vitamin Green’ are generally performing well (Figure 1). The spinach cultivars ‘Regiment’ and ‘Shelby’, in addition to the ‘Red Veined’ sorrel would not be recommended for DWG production at this point. It should be noted, however, that growers are typically mixing multiple crops for a salad mix. So depending on the preferred look and taste of the mix, a grower might only need a little of something different to make the mix “pop,” in the words of Carol Ford, and the bulk could be lettuce or Asian greens.
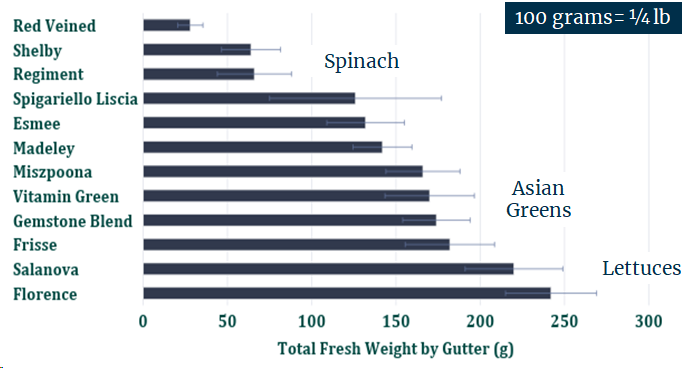
Figure 1. Total fresh weight (g/gutter) for leafy green crops grown in three Deep Winter Greenhouses in Milan, Madelia, and Finland, MN during the winter and early spring months of 2018.
Error bars indicate standard deviations for each cultivar averaged across locations and harvests.
The results for days to maturity of each cultivar showed an inverse relationship to yield, whereby the cultivars that matured quicker also typically yielded higher than those that matured more slowly, e.g. ‘Red Veined’ sorrel and the spinach cultivars had the longest days to maturity on average (Figure 2). We would recommend that growers plant cultivars with shorter DTM to maximize production in terms of time and apparent yield. Further, all cultivars obtained highest yields in the first harvest, compared to the 2nd or 3rd. Growers should consider this fact along with the expected DTM for each harvest in their production regime.
When we compared locations, DTM across cultivars was almost twice as long at Milan compared to the DWG 2.0s (Figure 2). This could be related to the temperature difference between the sites where the 2.0s were ~10°F warmer over the season than the 1.0 in Milan. This shows an important improvement in the design of the new prototypes that is translating to better plant growth.
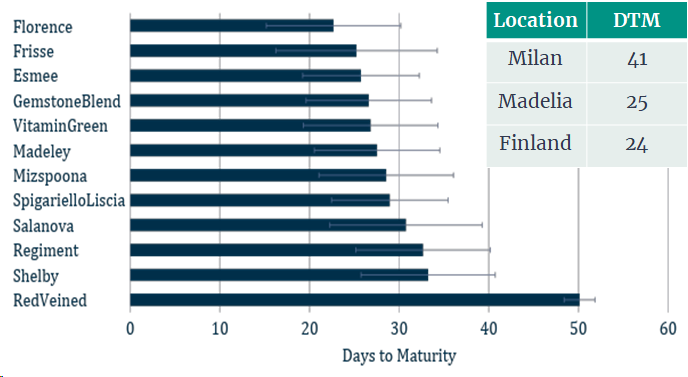
Figure 2. Days to maturity (DTM) by cultivar averaged across locations and harvests for leafy green crops grown in three Deep Winter Greenhouses in Milan, Madelia, and Finland, MN during the winter and early spring months of 2018. Error bars indicate standard deviations for each cultivar averaged across locations and harvests. Also shown is DTM averaged across cultivars by location.
This year, the 2018-19 season, we have updated the cultivars with grower input. We are trialing 6 cultivars in each sub-season (Diminishment, Solstice, Expansion) for a total of 18 cultivars. Half of these cultivars are standard grower cultivars that have done well in the past and half are new cultivars, so that we can compare performance. While typically growers have focused on certain crops in certain sub-seasons, we’re actually identifying cultivars that perform well throughout the winter which makes planning and growing these crops easier in the end.
2. Understand optimal seeding densities
We were able to get two harvests from the lettuce and Tokyo Bekana, but only one from the arugula before it bolted, so yields appear low for arugula in Figure 3. When averaged across crops, seeding rate does not significantly affect yield. Therefore, adjusting seeding densities may be crop dependent. Our research shows no additional yield gain from increasing seeding rate in arugula, so growers could seed just the recommended rate. Tokyo Bekana and the DMR Lettuce Mix did respond to increased seeding rates; yields were highest at the Grower rate for lettuce, and similarly high for the Grower and Middle rates compared to the Recommended rate for Tokyo Bekana. As noted in Figure 3, however, the 2nd harvest of the lettuce yielded the highest at the Recommended rate. Again, taking into account the whole production scheme will be important for growers to make these decisions.
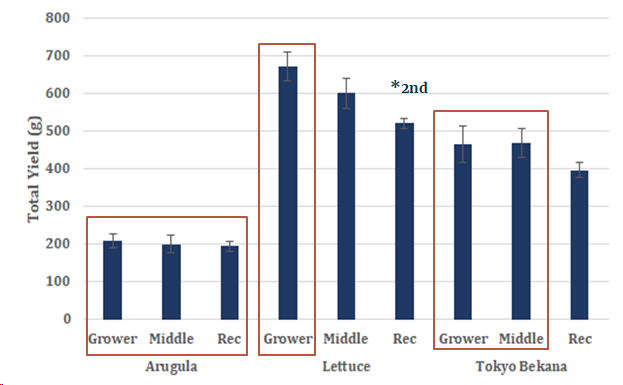
Figure 3. Days to maturity (DTM) by cultivar averaged across locations and harvests for leafy green crops grown in three Deep Winter Greenhouses in Milan, Madelia, and Finland, MN during the winter and early spring months of 2018. Error bars indicate standard deviations for each cultivar averaged across locations and harvests. Also shown is DTM averaged across cultivars by location.
3. Understand optimal soil-less substrate
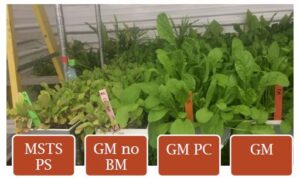
All crops trialed responded similarly to the substrate treatments, where plants yielded the highest in the Grower Mix (custom soil-less substrate mix consisting of peat, vermiculite, Purple Cow compost (0.7-0.3-0.3), lime, blood meal, greensand, and rock phosphate), as evident in Figure 4 with arugula. Plants in the Super Soil treatment yielded next highest, but the soil seemed to retain too much moisture and not enough nutrients for continued plant growth. Plants did not respond well to the JavaCycle + Purple Cow mix, showing poor germination (Figure 4) and potential salt toxicity. Soil and plant analyses data are pending.
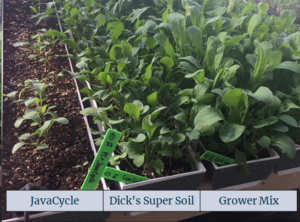
Figure 4. Arugula crop grown in different soil-less substrate treatments at Madelia, MN.
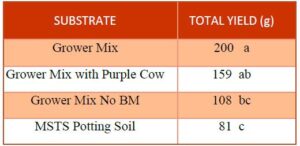
In year two we updated the substrates that we trialed given the poor performance of JavaCycle and the fact that Super Soil, as we later found out, is merely topsoil and deemed unsustainable. We tested alterations to the Grower Mix, included different composts and eliminating bloodmeal, as well as an ‘off the shelf’ product. The year two substrate mixes included: the standard Grower Mix containing Mississippi Topsoils compost; Grower Mix without the bloodmeal; Grower Mix with Purple Cow compost instead of Mississippi Topsoils; and Mississippi Topsoils’ Potting Soil.
Across both year one and year two seasons, all cultivars grew best in the standard Grower Mix with Mississippi Topsoils compost, though the Grower Mix with the Puprle Cow compost was close behind. An almost 100 g yield loss was observed when removing the bloodmeal from the substrate mix, indicating the plants are responding to this addition. Yields were low in the Potting Soil and showed signs of nutrient deficiency.
Enterprise Analysis
The deep winter greenhouse operators who participated in this study varied significantly in their annual operating costs and returns, as well as start-up costs.
About Deep Winter Greenhouse Structures and Operations
The operators that participated in this study built a range of deep winter greenhouse structures. Although based on the same original design outlined in The Northlands Winter Greenhouse Manual (http://www.gardengoddessenterprises.com/), sizes ranged from 288 square feet (12 x 24 feet) to 3,264 square feet (34 x 96 feet) and included the following design features:
- One greenhouse incorporated thermal solar panels and in-ground floor heat, in addition to a rock heat sink.
- Three greenhouses used heat generated by wood boilers.
- Four greenhouses were free-standing structures while the other four were attached to pre-existing buildings.
- One greenhouse was built from a greenhouse kit with a double-layer of plastic, although still had a heat sink and heavy insulation elements like other deep winter greenhouses. All others were used stick construction and polycarbonate panels.
All of these design features affect construction cost, and potentially, the performance of the structures themselves (there is no specific data, however, to discern how individual design features have influenced heating costs or production, especially as each greenhouse faces distinct climatological conditions).
All deep winter greenhouse operations in this study were relatively new. The oldest facility was built in 1998 and the newest built in December 2017. Each greenhouse had a single person who handled nearly all of the daily chores of planting, watering, and harvesting with assistance from a spouse or other family member. All greenhouses were commercial in nature.
In terms of production, all greenhouse operators raised winter greens such as arugula, lettuces, and Asian greens and select roots crops like turnips and radishes. For greens production, operators took multiple cuttings of each planting. No study participants used chemical herbicides or pesticides, and all generally used only organic inputs for soil mix, such as blood and bone meal (although a few sourced exclusively organic seed).
One challenge in this study is finding an apples-to-apples comparison between the greenhouses because the sales related to the greenhouse are diverse. All greenhouse operators used their structures for ancillary revenue-generating activities such as growing transplants, food for home use, value-added products, and tours. The revenue sources were also mixed with products grown outside the greenhouse. For example, attributing the total revenue from a winter CSA that combined winter greens with storage crops would overestimate the value of production from the greenhouse operations. On the other hand, a winter CSA would not have been possible were it not for the greens grown in the winter greenhouse. To best represent these complexities, this analysis only used the value of the products grown within the greenhouses during a consistent winter season, generally November through February.
Start-up costs
An investment in a deep winter greenhouse is significant. The average start-up cost among participants was $18,583. Two of the eight cost less than $6,000, whereas four cost more than $20,000.
Start-up costs include building the greenhouse and preparing it for its first season. Individual expenses include lumber, polycarbonate sheets, and hardware, as well as excavation and foundation work. Additional costs include ground inputs for a heat sink (e.g., rock and sand); heating improvements (including a backup heat source or upgrades to heating systems); construction labor; and initial growing supplies (for example, seeding equipment, trays, and lumber to build raised beds). For those greenhouse operators who built their greenhouses themselves, the value of their labor was not included. Construction labor only included cash expenses.
A helpful way to consider start-up costs is on a square foot basis. For this study, the total square footage of each greenhouse and growing space (total amount of space in hangers plus area planted on the ground) was collected.
The average cost per square foot of greenhouse space was $61, ranging from $20 per square foot to $133 per square foot. As a point of comparison, a 14 x 24 foot twin-wall polycarbonate greenhouse kit (not installed and without the passive solar heat sink) from Farmtek costs $14,705, or $44 per square foot.
Table 1: Start-up costs per greenhouse and per square foot of space and growing space
|
|
Grnhse1 |
Grnhse2 |
Grnhse3 |
Grnhse4 |
Grnhse5 |
Grnhse6 |
Grnhse7 |
Grnhse8 |
Average |
|
Start-up cost |
$17,850 |
$5,797 |
$38,370 |
$24,042 |
$12,000 |
$20,578 |
$24,226 |
$5,800 |
$18,583 |
|
Cost per sq. ft. |
$34
|
$20 |
$83 |
$47 |
$28 |
$27 |
$7 |
$17 |
$33
|
|
Cost per sq. ft. of growing space |
$38 |
$40 |
$111 |
$94 |
$56 |
$74 |
$8 |
$141 |
$70
|
Looking solely at growing space, there was an average cost of $33 per square foot of greenhouse to build the structures (which includes the growing area and all ancillary packing space as part of the greenhouse) and $70 per square foot of growing space. The difference between these two measurements gives a sense of space utilization where those with a small difference are using their space quite intensively and those with large differences are not. Growing space returned nearly an average of $3 per square foot of operating revenue annually, calculated as gross sales minus variable expense (see Table 3).
Product marketing
All deep winter greenhouses grew and marketed similar products, primarily winter greens and lettuces that do well in a cool environment, although one greenhouse grew only herbs. Most also grew cole crops, Swiss chard, and root crops, such as radishes and turnips.
Gross revenue, or sales, for the greenhouses ranged from $207 to $8,786. Removing variable costs necessary to grow a crop (seed, soil mix, and fuel), it was found that all greenhouses had positive operating revenue (gross revenue minus variable costs), but quite a variation due to greenhouse size and intensity of production. Converting revenue per greenhouse to operating revenue per square foot of space, participants took in an average of nearly $3 per square foot, ranging from $0.24 to $6.94 (see Table 3).
A common way of presenting operating revenue is through a measure of gross margin. Calculated as operating revenue divided by gross revenue, gross margin is a percentage of gross sales an operator retains after taking out direct expenses to produce a crop. For example, one greenhouse kept 76 cents of every dollar it sold and therefore had a gross margin of 76%. Study participants ranged from a gross margin of 54% to 83% with average gross margins of 69 percent (see Table 3).
Table 2: Gross Revenue and Operating Revenue*
|
|
Grnhse1 |
Grnhse2 |
Grnhse3 |
Grnhse4 |
Grnhse5 |
Grnhse6 |
Grnhse7 |
Grnhse8 |
Average |
|
|
|
|
|
|
|
|
|
|
|
|
Gross Revenue |
$3,150 |
$2,500 |
$4,800 |
$2,900 |
$207 |
$349 |
$8,786 |
$480 |
$2,897 |
|
Operating Revenue |
$1,817 |
$2,000 |
$3,118 |
$1,608 |
$172 |
$187 |
$6,638 |
$382 |
$1,990 |
|
Operating Revenue per Sq Ft of Growing Space |
$3.44 |
$6.94 |
$6.78 |
$3.14 |
$0.40 |
$0.24 |
$2.03 |
$1.14 |
$3.01 |
|
Gross Margin |
58% |
80% |
65% |
55% |
83% |
54% |
76% |
80% |
69% |
Operating Costs and Returns
All greenhouse operated experienced positive operating revenue (defined as gross revenue minus variable expenses, such as fuel, soil mix, and seeds). Setting aside the capital costs associated with building a greenhouse, these operations have realized an average gross margin of 69%, meaning operators kept 69 cents of profit for each dollar of revenue. Gross margins ranged from 54% to 83% this variation is explained primarily through the difference in revenue, as variable costs were fairly consistent for most of the greenhouses (approximately $1,000) with an average annual variable cost of $892. Those operating winter CSAs had three of the four highest gross margins, ranging between 54% and 81% (see Table 3). This difference in how product is marketed also translated to significant differences in profitability (see Financial Performance section).
Table 3: Operating expenses*
|
Grnhse1 |
Grnhse2 |
Grnhse3 |
Grnhse4 |
Grnhse5 |
Grnhse6 |
Grnhse7 |
Grnhse8 |
Average |
|
|
Annual variable expenses* |
$1,333 |
$500 |
$1,682 |
$1,292 |
$35 |
$162 |
$2,148 |
$98 |
$906
|
|
Seeds |
$250 |
$75 |
$145 |
$235 |
$10 |
$12 |
$192 |
$29 |
$119 |
|
Propane |
$525 |
$317 |
$32 |
$586 |
$183 |
||||
|
Soil Mix |
$350 |
$220 |
$554 |
$285 |
$43 |
$32 |
$49 |
$219 |
|
|
Marketing costs |
$88 |
$25 |
$91 |
$173 |
$65 |
$74 |
|||
|
Utilities |
$120 |
$150 |
$100 |
$10 |
$601 |
$20 |
$143 |
||
|
Other |
$30 |
$350 |
$182 |
$25 |
$737 |
$221 |
*Average for all the winter seasons in operation
The largest variable expense is other (mainly due to greenhouse 7 with a high supply expense), followed by soil mix, propane, utilities, and seed costs. Marketing costs – costs incurred once a crop is raised – involves delivery expenses and packaging costs as some growers elect to present products in containers such as clamshells and use waxed boxes for packing finished products. Another marketing cost is mileage for operators who deliver their product to buyers. Considering the greenhouses generally operate October through March, fuel costs were relatively low; the average fuel cost was $199 annually. Three operations reported no propane costs during the 2017-18 season, using heat exclusively from wood boilers, electric, or home heat.
Financial Performance
The primary measure of financial performance for any enterprise is net revenue, calculated as gross revenue minus both capital and operating (variable) expenses. In this instance, the annual depreciation expense (capital costs) and annual operating expenses were subtracted, such as seed and propane (operating costs) from gross (see Table 5). Extension calculated depreciation using straight line depreciation over twenty years minus a salvage value of $1,500. Greenhouse five does not have a depreciation cost since it is 20 years old.
Greenhouse seven had the highest net revenue by far. This is explained by the size of the greenhouse which is fully utilized to garner almost $9,000 in gross sales. Its capital costs and operating costs are the highest, but at over 3,000 square feet, even modest sales per square foot would provide significant sales.
Table 4: Net Revenue, capital costs (depreciation expense), and operating costs (variable expenses)
|
|
Grnhse1 |
Grnhse2 |
Grnhse3 |
Grnhse4 |
Grnhse5 |
Grnhse6 |
Grnhse7 |
Grnhse8 |
Average |
Median |
|
Net Revenue |
$976 |
$1,785 |
$1,275 |
$468 |
$172 |
$(767) |
$5,502 |
$167 |
$722 |
$1,197 |
|
Capital costs (depreciation) |
$841 |
$215 |
$1,844 |
$1,140 |
$- |
$954 |
$1,136 |
$215 |
$898 |
$793 |
|
Operating costs |
$1,333 |
$500 |
$1,682 |
$1,292 |
$35 |
$162 |
$2,148 |
$98 |
$896 |
$906 |
Payback and Return on Investment
One of the most common questions of prospective winter greenhouse operators is the return on investment or payback time.
Calculated as net revenue divided by start-up costs, return on investment (ROI) ranges from 30.8% down to -3.7% with an overall ROI for all eight greenhouses of 7.3% (see Table 6). Instead of an average, an overall ROI was calculated by dividing total net revenue by total start-up costs for all greenhouses.
In comparison, payback time does not account for capital costs or depreciation, but instead is calculated as start-up costs divided by operating revenue. Calculated this way, payback time ranges from as few as three years to as many as 110 years, with an overall payback time 8.6 years (calculated as total start-up costs divided by total revenue minus total variable costs for all greenhouses).
Table 6: Return on Investment and Payback Time
|
|
Grnhse1 |
Grnhse2 |
Grnhse3 |
Grnhse4 |
Grnhse5 |
Grnhse6 |
Grnhse7 |
Grnhse8 |
Overall Average |
|
ROI |
5.5% |
30.8% |
3.3% |
1.9% |
1.4% |
-3.7% |
22.7% |
2.9% |
7.3% |
|
Payback time (in years) |
9.8 |
2.9 |
12.3 |
15.0 |
69.8 |
110.0 |
3.6 |
15.2 |
8.6 |
Labor inputs and returns
Each greenhouse operator was asked how much time they spent planting, watering, harvesting, and marketing crops for the foods they sold throughout the winter. Each study participant estimated their time for each month of the year and tracked one month with a daily chore log to inform their estimates.
All of the study participants operated the greenhouse on a part-time basis with assistance, at times, from a spouse or other family member. The greenhouse operator who spent the most time invested a total of 394 hours during the winter season. On average, growers spent 139 hours to produce, market, and deliver their winter crops, which breaks down to five hours per week on average or less than an hour a day. Hours spent on growing summer transplants in the greenhouse or other ancillary revenue-generators were not included. Presented as an hourly wage, operators made between $4.61 to $54.08 when calculated as operating revenue divided by total time spent working in the greenhouse (see Table 7).
Table 6: Labor invested for winter production and time expressed as hourly wage (operating revenue/total hours worked)
|
|
Grnhse1 |
Grnhse2 |
Grnhse3 |
Grnhse4 |
Grnhse5 |
Grnhse6 |
Grnhse7 |
Grnhse8 |
Ave. |
Median |
|
Total hours worked |
394 |
84 |
308 |
141 |
5.9 |
33 |
123 |
27 |
103 |
139 |
|
Hours per week |
14 |
3.5 |
11 |
5.9 |
0.4 |
1.7 |
5.1 |
1.7 |
5.4 |
4.3 |
|
Hourly wage |
$4.61 |
$23.86 |
$10.12 |
$11.40 |
$29.40 |
$5.67 |
$54.08 |
$14.15 |
$12.77 |
$19.16 |
Other Benefits of Deep Winter Greenhouse Production
All survey participants experienced other benefits—some economic, some not—that are difficult to incorporate into a standard financial analysis such as this study, but they are no less important to many of the participants.
The ability to grow crops for family consumption emerged as a primary motivator for many greenhouse operators. One participant estimated his family consumed the equivalent of four to five bags of salad mix per week, or a value of $400 throughout five winter months ($20/week for 20 weeks). Other participants shared similar estimates and stories.
Likewise, all study participants shared how they used their winter greenhouse to start summer transplants or for value-added products like dried herbs or sun-dried tomatoes. One participant estimated saving nearly $600 in annual heating costs, because he no longer needed to use his old hoop-style greenhouse, which had been in operation more than a decade.
Space Utilization affects profitability
Previous research on the profitability of deep winter greenhouses (DWGs) found that the most profitable also maximized the use of space. Considering DWGs are relatively expensive, judicious use of space is an important recommendation to operate profitability. The Northlands Winter Greenhouse Manual written by Carol Ford and Chuck Waibel suggested a configuration of hanging planters in equally-spaced rows for ease of harvest. Early adopters used the original ‘equal spacing’ set-up. In time, however, growers compressed spacing between rows and planters to maximize space. Extension shared about these configurations at workshops targeting existing and prospective DWG operators.
Bank Configuration
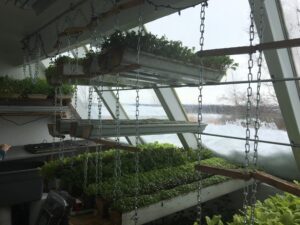
Some growers created ‘banks’ where three to six rows of hanging planters were placed together with little space between the rows. Growers left between one and three inches between the rows to allow for greens to spill over the planters to some degree. In between the banks was an alleyway that allowed operators to water planters from either side:
Tiered Configuration
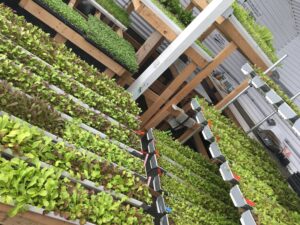
Taking the idea of a bank further, Extension documented that some growers have adopted a tiered system which abandoned the hanging set-up altogether for a one where planters sat on racks. Like in the bank configuration, planters had minimal space between one another (1 to 3 inches). Instead of being spaced equally horizontally, however, the planters were arranged in tiers where the lowest row sat nearest the south-facing glazing wall and the highest row sat furthest away with the tiers overlapping one another, but not completely.
The tiered configuration allowed for more growing space in the same greenhouse area and growers did not report significant loss in quality or yield due to the tight spacing. One grower who moved from the original hanging planters system to a tiered system more than doubled the number of planters using the same space from 68 to 138 trays.
While most Deep Winter Greenhouses are very small in scale, to maximize profitability for farmers operating in this system a few important factors should be considered. First of all, it should be noted that microclimates (solar access, humidity, heat retention, etc…) in each individual DWG will vary, operators should watch the performance of their crops closely, keep very good records, and change their practices according to their experiences. As DWG production is a relatively new practice, further experimentation with crop varieties, soil mixes, planting schedules, and other considerations will produce results that are adapted to each individual grower. The results from this and previous studies should be considered a base upon which to operate and experiment further.
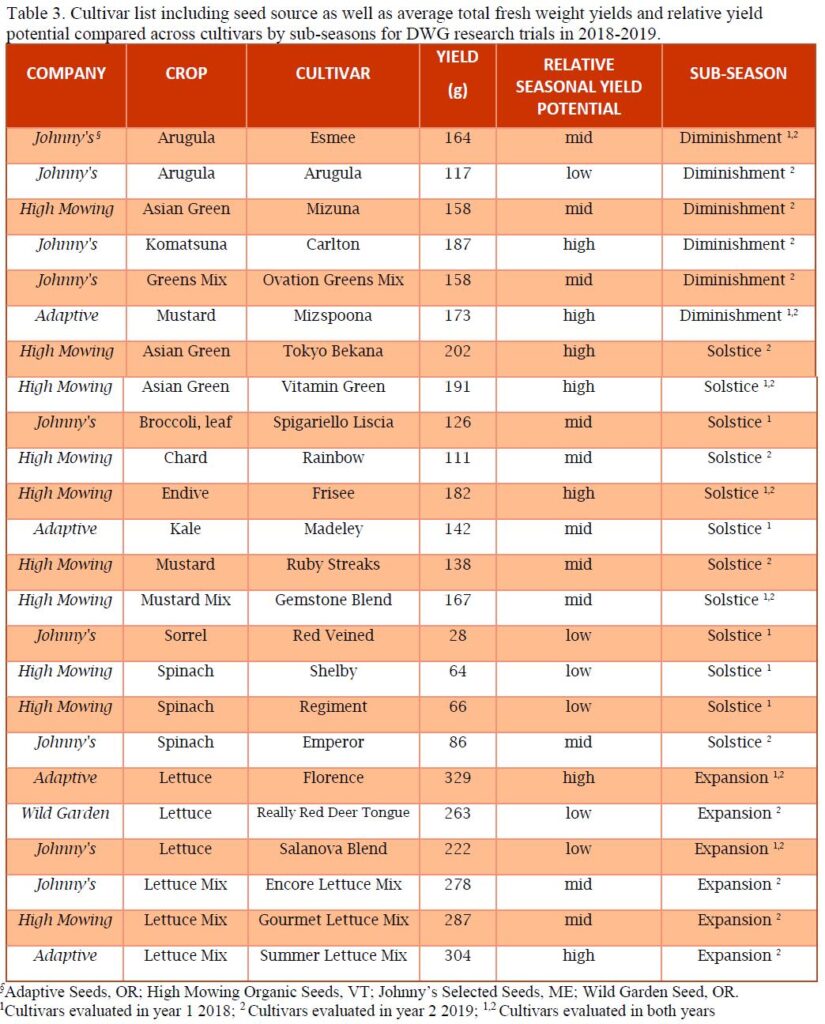
We would recommend that farmers begin with utilizing the soil mixes, seeding densities, and variety choices that we identified to be productive and experiment further once a comfort level with DWG production has been achieved. It is important to note that winter production involves mini-seasons where sunlight is diminishing daily (diminishment), when sunlight is relatively constant from day to day (solstice), and when sunlight increases every day (expansion). While most plants do not perform as well in the early winter, we suggest that growers focus on growing crops that have been identified to grow well relative to others (as seen on Table 3 below) in addition to suggestions published from experienced DWG producers in the DWG Production Manual available for free download from this link: https://umn.qualtrics.com/jfe/form/SV_8hS5BaCDArQXHU1
For those attempting to incorporate a DWG system into their operation, focusing on reducing construction and startup costs is important to achieve profitability. Operating revenues will be higher when producers focus on developing a production system that maximizes use of space in the smaller DWGs by utilizing three dimensional planters in a tiered configuration while being careful either to not shade out planters on lower levels, or by regularly rotating planters so that each receives adequate sunlight.
Currently DWGs, at the scale at which most are adopting, are not likely an extremely profitable venture on their own, but rather are a key component in a successful whole farm operation that allows for a winter 'bridge production season' that provides additional revenue. As such, DWGs can help increase small farm viability both by providing direct revenue, but also by providing additional non-revenue generating services that would otherwise add costs (e.g. onion starts, early starts for hoophouse crops, summer food dehydration, etc.). As DWG systems become more common, growers will find additional uses, production techniques, and find new crops that thrive in winter production. Those adopting DWG systems on their farm should consider connecting with others on social media and attending conferences to learn about the most recent designs and production practices in order to keep current and maximize their success.
Education
The educational component of this project involves providing farmers with an introduction to the Deep Winter Greenhouse (DWG) system as well discussing the results of research projects conducted during the project period. As the DWG system is still new to the Upper Midwest, producers needs for education about the system varies dramatically depending on the individual breadth of understanding about DWG and their position as a key piece of a small or medium sized vegetable production operation. The project team conducted presentations at conference sessions at various locations in Minnesota and North Dakota and was able to tailor each presentation to the audience at each conference depending on the expected participant's understanding of DWG.
The project team presented at the following classes and workshops:
Hungry Turtle Farm Table Foundation: Amery, Wiscconsin
Minnesota Organic Conference, St. Cloud, MN
Minnesota Fruit and Vegetable Growers Association Conference, St. Cloud, MN
Northern Plains Sustainable Agriculture Society, Fargo, ND
Sustainable Farming of Minnesota Association, St. Josepth, MN
Topics in Organic Horticulture (Hort 3480) Course at the University of Minnesota
The team presented poster presentations at the following conferences:
Midwest Organic and Sustainable Education Service conference, La Crosse, WI
Organicology Conference, Portland, OR
Future educational events include DWG field days where the project team will present information on DWG design, present on research findings, and conduct hands-on DWG production workshops to teach participants how to mix soil, seed, and harvest DWG crops.
Field Days were conducted at:
Cold Spring, MN at Green Winter Gardens, April 4, 2019
Bemidji, MN at the Bemidji Community Food Shelf Farm, May 28, 2019
Finland, MN at the Organic Consumers Association’s Agroecology Center, June 8, 2019
Lake City, MN at the Lake City Catholic Worker Farm, April 27, 2019
Pillager, MN at Grampa G’s Farm, May 4, 2019.
Project Activities
Educational & Outreach Activities
Participation summary:
Consultations: The project team assisted many individuals on social median on an ongoing basis throughout the course of this project. Over time more and more individuals participated in social media (i.e. facebook) and sought consultation with the project team and other participants. We estimate that we consulted with 52 unique individuals that built or produced inside of a DWG in addition to dozens others that expressed interest in the technology but were not yet DWG producers. We have found that social media is a powerful tool to crowdsource information and share experiences and to spread the word about Deep Winter Greenhouses.
Curricula, Fact Sheets, Educational Materials: We published the following:
Pesch, R. (2019). Winter Greenhouse Enterprise Analysis. University of Minnesota Extension. Available online at: https://extension.umn.edu/community-research/winter-greenhouse-enterprise-analysis
Winter Greenhouses Enterprise Analysis
Hodge, C. & Schweser, G. (2019). Research results from Deep Winter Greenhouse horticultural trials: A University of Minnesota RSDP, Horticulture Department, and DWG grower collaboration. Available online soon at: https://extension.umn.edu/growing-systems/deep-winter-greenhouses
Research results from Deep Winter Greenhouse horticulture trials
Pesch, R. (2019). Space use in Deep Winter Greenhouses. University of Minnesota Extension. Available online soon at: https://extension.umn.edu/growing-systems/deep-winter-greenhouses
Space Use in Deep Winter Greenhouses
Journal Articles:
Hodge, C.F., Rogers, M., Handeen, D., & Schweser, G. (2019). Yield of leafy greens and microclimate in Deep Winter Greenhouse production in Minnesota. Sustainability 11 (28).
Online Training:
Local Foods College 2018: Deep Winter Greenhouses. Available online at: https://www.youtube.com/watch?v=y1w2z16Qzvs&list=PL65ykS7ZAIm6ncyGTokIG8LCs5XjxD-y1&index=4&t=5s
Published press articles/newsletters: The following published press article links that pertain to the project's Deep Winter Greenhouse work:
The miracle of Finland: What a tiny northern Minnesota town can teach America. City Pages. http://www.citypages.com/news/the-miracle-of-finland-what-a-tiny-northern-minnesota-town-can-teach-america/482108751
University partners with local farmers on greenhouses for winter production. MOSES Organic Broadcaster. https://mosesorganic.org/broadcaster-dwg/
Deep Winter Greenhouse allows Grampa G's Farm to grow vegetables year round. Morrison County Record. https://www.hometownsource.com/morrison_county_record/deep-winter-greenhouse-allows-grampa-g-s-farm-to-grow/article_88c2300c-7b0d-11e9-b901-8fec2bf0f78d.html
Deep Winter Greenhouse open house set. Brainerd Dispatch. https://www.brainerddispatch.com/news/4524899-deep-winter-greenhouse-open-house-set
Winter greenhouses still produce in the heat of summer. Rochester Post Bulletin. https://www.postbulletin.com/news/local/winter-greenhouses-still-produce-in-heat-of-summer/article_3347eac8-8143-11e8-8341-53a4fc74ad70.html
Garden pests come in all shapes and sizes. Idaho Statesman. https://www.idahostatesman.com/living/home-garden/margaret-lauterbach/article160970694.html
Deep Winter Greenhouse Field Day. Morning Ag Clips. https://www.morningagclips.com/deep-winter-greenhouse-field/
Deep Winter Greenhouses offer low cost way to grow greens in Minnesota. Farm Progress. https://www.farmprogress.com/crops/deep-winter-greenhouses-offer-low-cost-way-grow-greens-minnesota
Deep Winter Greenhouses and year-round growing in Minnesota. KAXE/KBXE. https://www.kaxe.org/post/deep-winter-greenhouses-and-year-round-growing-minnesota#stream/0
Tours: Tours of DWGs were included in the five open house/workshops so were counted as 0 to avoid double counting.
Webinars, talks, and presentations:
Northern Plains Sustainable Agriculture Society Annual Conference, Fargo, ND, 2019
Minnesota Organic Conference, St. Cloud, MN, 2019
Minnesota Fruit and Vegetable Growers Association/ Minnesota Farmers Market Association, St. Cloud, MN, 2019
Sustainable Farming Association Annual Conference, St. Josepth, MN 2018.
North Dakota Department of Agriculture and Farmers Market and Growers Association, Local Foods Conference, Minot, ND, 2019
UMN Course HORT 3052 Organic Vegetable Production. Professor Rogers. Class Presentation
UMN Course Topics in Sustainable Agriculture. Professors Murray and Sheaffer. Class Presentation
Midwest Organic and Sustainable Education Services Annual Conference, LaCrosse, WI. 2019. Poster Presentation
Organicology Annual Conference, Portland, Oregon. 2019. Poster Presentation.
Hungry Turtle Farm to Table Foundation, Amery, WI. November 2017.
Workshops and Field Days: The project team conducted five Field day/workshops at the following locations: Winter Green Farms, Cold Spring, MN; Organic Consumers Association, Finland, MN; Bemidji Community Food Shelf Farm, Bemidji, MN; Lake City Catholic Worker Farm, Lake City, MN; Grampa G's Farm, Pillager, MN.
Learning Outcomes
- Appropriate crops for DWG
- Optimal Seeding Densities
- Optimal Soil Mix
- Maximizing profitability in DWG sytsem
Project Outcomes
Adopting DWG technology:
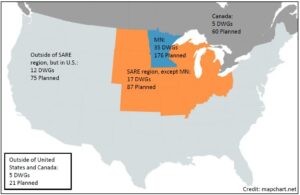
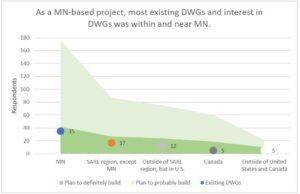
We tracked the number of people that constructed DWGs over the course of the project as well as the plans of those that definitely intend to build a DWG. Surveys were conducted with participants of DWG events and recipients of DWG materials (i.e., those who downloaded blueprints or production manual) so we contacted individuals beyond those that had association with this project's activities with the assumption that these individuals gained information gained from the entire suite of RSDP's DWG Initiative activities including this SARE project, even if they were not direct participants in outreach events.Surveys conducted during this project have identified 31 new DWG producers and 306 producers that answered 'probably yes' or 'definitely yes' to whether they would build and produce in a DWG within the next 2 years. This is a total of 419 planned DWGs located throughout the world. Broken down further, the number of people who reported definite and probable plans to build a DWG by location:
Minnesota: 176
NCR SARE region outside of Minnesota: 87
Outside of NCR SARE region, but in US: 75
Canada: 60
Outside of USA and Canada: 21
The following quotes are from individuals that participated in DWG outreach and educational events funded by this NCR-SARE project:
"The DWG materials available on your website and responsiveness of your staff have been critical in putting together my own DWG design. Valuable intersection of small scale ag and academia." -- farmer in Minnesota
"I am not a grower but a bee keeper. I hope to expand my season using a Deep Winter Greenhouse." -- Bee keeper in Minnesota
"Just want to say thanks for building one in my area and having a open house so I could check it out. ... Seeing yours made it a lot easier to design mine without paying someone to do it for me, so thank you again." -- Farmer in Minnesota
"Thank you for providing these plans. I am a part of the Urban Farm and Garden Alliance, and I think eventually we would like to build a DWG. It is really great to see what would be needed to make this a reality!" -- Urban Farmer, Minnesota.
"Just love the work you're doing to teach about them - really important in this climate!" -- Farmer in Minnesota
"I'm really looking forward to finally growing in our DWG, learning how to do it, and then experimenting with what we can grow!" -- New DWG producer in Minnesota
"I so appreciate the willingness of the pioneers with DWG's to share their experience and knowledge. We're a couple years away, but definitely plan to include a DWG on the new farm." -- Farmer in Minnesota
We are particularly interested in following the adoption of Deep Winter Greenhouses. With this project, we were able to open up newly built prototype DWGs to people around Minnesota and allow people to get a first hand account of DWGs and how they work. We also provided informative educational events to help people learn the specifics on DWG production and profitability. As this technology is very new, we want to gauge the capacity and interest of people in adopting DWG technology as an opportunity to expand their farm operations into year-round production.
First, we found that a limited number of farmers are using DWG technology throughout the United States and Canada, with the majority centered in Minnesota and the NCR-SARE region. However, we also found that larger numbers of farmers are currently planning on constructing a DWG, 176 in Minnesota, 87 in the NCR-SARE region, and 156 in the US outside the SARE region, Canada, and elsewhere in the world.
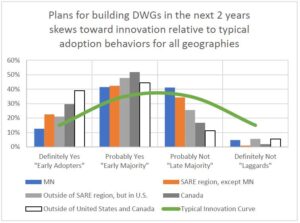
In our surveys we received responses from 628 growers that have participated in our DWG activities over the past few years stating whether or not they were planning to build a DWG. We tracked responses in the terms 'definitely yes,' 'probably yes,' 'probably not,' and 'definitely not.' On this 4-point scale, respondents' plans for building a deep winter greenhouse (DWG) in the next 2 years skews high for new technology adoption relative to a typical innovation curve.
While DWG prototypes are still in early stages of development, we view this as a very promising trend. Cost of construction is consistently noted as a barrier to entering into DWG production, yet despite high costs many farmers are still actively planning on adopting the technology. Our current DWG work is focusing on developing an updated DWG 3.0 design that reduces construction costs and increases building scale to allow this system to be more accessible to farmers in the Upper Midwest. We would like to continue to support DWG adoption and continue to track barriers to construction and production so that we can continue to help small and medium-sized farmers create more viable and rewarding enterprises.
