Final report for LNC20-437
Project Information
Cattle production accounted for $67.1 billion in cash receipts in 2018 and supported 913,000 US operations, of which 728,000 were small beef farms and ranches, commonly cow-calf operations on grass with under 50 animals (NCBA, 2020; USDA, 2020). Therefore, grasslands are a crucial part of the US agricultural sector and yet demonstrate increased degradation and thus decreasing ecological wellbeing. The difficulty of making management decisions on this degraded resource base is compounded by decreasing social and economic wellbeing for producers. However, given the cultural importance of cattle production, producers continue to engage with it, putting the resource base and their livelihoods at potentially greater risk.
Regenerative grazing has been posited as a solution to this environmental, social, and economic risk. However, although the evidence base of successful regenerative management is increasing, particularly in grazing, there is little long-term study of the environmental, social, and economic benefits following adoption, and none within the North Central region. There is also little adoption of regenerative grazing across the producer population in the US. It has been hypothesized that barriers to adoption include a lack of knowledge about wellbeing outcomes (including ecosystem services, producer quality of life, and economic profitability), producer values, and uncertainty around how to adopt.
Our research and education project, ‘Values and Adoption in Regenerative Grazing Practices and Associated Wellbeing Outcomes for Cow-Calf Producers’ will create knowledge, awareness, and skills for 15-20 cow-calf producers by training them in regenerative grazing. In order to explore suspected barriers and conduits to adoption, a long-term approach is proposed including training in self-monitoring of economic, social, and ecological wellbeing and values. A control group of non-adopters and a group of established adopters (10+ years) will also participate in wellbeing training and monitoring, creating further knowledge, awareness, and skills amongst these groups. Values are crucial as there are no studies monitoring how values change through the adoption process - a long-term project will show whether values change as producers adopt regenerative methods (i.e. becoming more open to change) or whether producers need to hold these values to consider adopting such adaptive methods.
Understanding barriers and conduits to adoption will allow us to tailor education materials, fostering increased adoption of regenerative grazing in the medium-term benefiting stakeholders such as Extension and the beef and regenerative agriculture sectors, but in the long term benefiting wider society through a more sustainable cow-calf sector.
Our objective is to understand pathways to the adoption of regenerative grazing. There are multiple outcomes for multiple audiences:
- Learning outcomes:
-
- Knowledge, awareness, and skills for cow-calf producers:
- Regenerative grazing methods
- Methods for monitoring wellbeing:
- Ecological - Ecological Outcomes Verification
- Economic - enterprise budgets and improved record keeping
- Social– values and quality of life
- Knowledge and awareness for Extension, university researchers, beef and regenerative agriculture stakeholders:
- Values and wellbeing
- Barriers and conduits to adoption
- Knowledge, awareness, and skills for cow-calf producers:
- Action outcomes:
- Regenerative grazing adoption
- Wellbeing monitoring
- Regenerative grazing network
- System outcomes:
- Extension tools to increase adoption and wellbeing
- More sustainable grazing practices.
Producers rely on grasslands – almost half of US farms have cattle, with an above-average number in the North Central region where livestock spend most of their lives on pasture. However, there are multiple challenges to the sustainability of grazing-based cow-calf operations. This project explores how different grazing management strategies influence wellbeing outcomes, to build a holistic sustainability on cow-calf operations.
Cooperators
Research
We are implementing a systems-based approach to ask two main research questions:
- What are the pathways (conduits and barriers) to adoption of regenerative grazing practices? i.e. how do values, recruitment style, and ecological, social, and economic wellbeing, and knowledge of regenerative grazing influence adoption?
- How are ecological, social, and economic wellbeing and values influenced by adoption? i.e. are producers’ values and wellbeing measures static or dynamic?
For our context, regenerative grazing is defined as practicing Holistic Planned Grazing (HPG), the grazing method within Holistic Management. HPG utilizes multiple paddocks to control livestock movements and requires the development of grazing plans of when and where to move animals with an emphasis on recovery periods for the paddocks rather than grazing periods. A crucial aspect to HPG is monitoring to adjust grazing plans given changing conditions. We will work with three cohorts, starting with 20 Michigan residents in each, anticipating some attrition to 15 – our required sample size.
C1. 15-20 new regenerative grazers, who adopt regenerative grazing through this project.
C2. 15-20 regenerative grazers with 10+ years of experience, who have previously participated in MSU-run regenerative grazing programs.
C3. 15-20 continuous (non-regenerative) grazers, our control.
Our general approach is to treat farms as social-ecological systems, which requires understanding the ecological, social, and economic components of the system, and how they are connected. To understand this, based on previous work by this team, three established wellbeing tools will be used in a longitudinal manner:
Ecological wellbeing: We will use the Ecological Outcomes Verification (EOV) Short-Term Monitoring tool, a practical and scalable soil and landscape assessment methodology that tracks annual outcomes in biodiversity, soil health, and ecosystem function (water cycle, mineral cycle, energy flow, and community dynamics) (Xu et al., 2019). Co-developed by Raven, a key principle of EOV is that it is outcomes-based – any producer can utilize it, no matter their practices. EOV measures key indicators of ecosystem function resulting in an Ecological Health Index (EHI) score, which in the aggregate indicates positive or negative trends in the overall health of a landscape. If a producer is using practices that increase the ecological wellbeing of their land, their scores will increase year-by-year. The empirical and tangible outcomes of EOV provide the producer, as a steward and manager of the land, with ongoing feedback from which to make better management decisions. By monitoring land regeneration trends, a farm or ranch is eligible for EOV verification and associated incentives if land health moves in a net positive direction, through the Land to Market Program. We will train all cohorts in EOV, so they can assess their own land’s ecological quality, and will work with them on an annual basis to monitor their land, with on-site assistance during the early years and assistance through an online platform in all years. Having gone through the EOV training, all participants will be qualified as EOV Short-Term Monitors and can then earn additional income from verifying others’ land.
Social wellbeing: Historically, wellbeing metrics originate from within economics and derive wellbeing from census data and global surveys, conflating wellbeing with socio-economic indicators such as income, assets, and social status. This approach is lacking, as a high level of income does not necessarily reduce stress or increase happiness – indeed, often the opposite is true. Therefore, to truly measure wellbeing we have created a tool to monitor what we see as the three core components of social wellbeing - psychological, subjective, and physical wellbeing. The tool combines the Satisfaction with Life Scale developed by Diener (1994) with the Scale of Psychological Wellbeing developed by Ryff (1989), incorporating both subjective and psychological aspects. Given that psychological wellbeing is based upon the idea of ‘living within your value’ we also include a validated held values survey tool, that of Schwartz (2012), and a set of grazing-specific relational values created from our previous work (Mathison and Hodbod, 2019). Finally, we also included questions about indicators of physical wellbeing - financial status, education, sense of community, anxiety, and physical health (sleep, exercise, healthy eating), that are typically found on rural mental health surveys such as the one developed by Kelly et al. (2010). The tools will be introduced to all cohorts in a training about wellbeing and values, with a post evaluation of their knowledge. We will then introduce the survey tools for annual completion, building participant’s skills in monitoring and analyzing their own wellbeing.
Economic Wellbeing: Economic wellbeing is a synonym of present and future financial security and as such, it depends on two main variables: income and wealth. However, there is a subjective aspect to it: the degree of satisfaction or fulfillment. With each cohort of farmers, we will complete a financial wellbeing analysis in years 3 and 4 that includes both objective and subjective (feelings/perceptions) measures. For the objective measures, we will help them complete their balance sheet and income statement. In addition, we will help them complete an enterprise budget to understand the profitability of their cow-calf enterprise. They will receive training in record keeping, developing coordinated financial statements (i.e. balance sheet, income statement), and financial ratios, which can be tracked over time and benchmarked against other farms. Depending on their degree of comfort with computers, they will be asked to use digital or paper spreadsheet templates, which Colella and McKendree have already developed for other studies and farm consultations. The enterprise budget will give us information on the cow-calf enterprise economic profitability, including opportunity costs (land, labor, capital). We will also track their off-farm income, health insurance coverage, perceived economic wellbeing, and their degree of comfort with their finances in general, and with those of the cow-calf enterprise in particular – i.e. economic wellbeing measures that are not included in the farm finances. Knowing their income and their satisfaction information will allow us to look for correlations between these two variables and make programming and management recommendations.
There were some delays in Y1 given the travel and research restrictions in place at Michigan State University during 2021 given the COVID19 pandemic. This project requires trust between the participating farmers and the research team to support asking about social and economic wellbeing, and trust-building requires face-to-face communication. Because this wasn’t feasible, we were delayed in recruitment which occured in the first quarter of Y2.
To use our time efficiently, we spent Y1 preparing research protocols, priming for recruitment in cohort 1 and 2 via ecological wellbeing monitoring on farms we have previously trained in EOV, and relationship building through our MSU Extension colleagues and their networks. Below is the adapted outline for our project, summarising activities in Y1 and Y2 and the anticipated structure for Y3 and Y4 (given the No Cost Extension which we applied for in Spring 2022).
Year 1 (2021):
- Winter and Spring: team building at MSU – We partnered with MSU Extension (Lake City Research Center; LCRC and Upper Peninsula Research and Extension Center; UPREC; Farm Management Unit; Beef Team), building relationships and familiarity amongst the team.
- Summer: EOV (ecological wellbeing) data collection on 17 farms by Raven and Derry. 14 have been previously introduced to EOV where their long-term monitoring was completed, so monitoring in 2021 was the short-term EHI monitoring. 3 were new participants for whom Raven and Derry oversaw long-term and short-term monitoring. All 17 are likely participants in our project, likely to be members of Cohort 1 and 2.
- Fall: Onboarding of student researchers (Jonathan Vivas Aragon and Sarah Hubbard), including their education in wellbeing theory. Deeper development of conceptual framing for the project. Literature review of wellbeing tools released since proposal was submitted. Revision of social wellbeing tools. Developing new record-keeping training modules and tools to complement established tools for economic wellbeing monitoring.
Year 2 (2022):
- Winter:
- We used our relationships with MSU Extension (Lake City Research Center; LCRC and Upper Peninsula Research and Extension Center; UPREC) to prime these organizations to be ready to distribute our recruitment materials.
- We prepared the recruitment survey: MSU_Wellbeing_Study_Recruitment
- We prepared recruitment materials – email language, social media posts, magazine articles, and flyers (i.e., https://www.canr.msu.edu/news/wellbeing-on-beef-farms-in-michigan, 2022 0323 MSU Beef Wellbeing flyer, )
- Dr. McKendree (lead of economics components) was on maternity leave.
- Spring:
- We distributed our recruitment materials and survey link widely, with assistance from stakeholders such as MSU Extension Beef Team and MI Cattleman's Association. There were 98 responses in March 2022.
- We invited 61 to participate in the project, anticipating some attrition.
- 11 declined between April and November 2022.
- 13 were removed in Summer 2022 for lack of response to outreach/scheduling solicitations.
- 37 farms remain as active participants (sometimes with multiple participants per farm, given multi-generational or partner management).
- The participants didn’t evenly fit between the three cohorts, with initial classifications as:
- 6 adapting
- 20 already adaptive
- 11 conventional
- During the recruitment process we discussed with participants what they would like to achieve through the project and integrated further components if feasible or connected them (through MSU Extension) to relevant programs or staff.
- As a first packet of information, we shared an ‘intro to wellbeing’ document with all participating producers while scheduling their intake interview for May 2022: 2022 0425 Intro to Wellbeing
- Intake interviews with 34 of the participating farms were held by zoom or phone in May 2022. The protocol is here: 2022 0513 Protocol for intake interview
- After interviews, 1 farm was moved into the ‘adapting’ group so the final cohorts were:
- 7 adapting
- 19 already adaptive
- 11 conventional
- After interviews, 1 farm was moved into the ‘adapting’ group so the final cohorts were:
- Immediately following the interview, participants completed the social wellbeing survey, either independently online after being emailed the link or on the phone with one of our team. The survey is here: 2022 MSU_Social_Wellbeing_Survey
- 38 people representing 35 of the farms completed the survey. The survey elicited information about psychological, subjective, and physical wellbeing along with values, for the latter we integrated a replacement for the New Ecological Paradigm (NEP) Scale (which we originally planned to use). The survey will be repeated annually so we can study change in wellbeing and values over time for all cohorts.
- Dr. McKendree (lead of economics components) was on maternity leave.
- Summer:
- EOV training was offered to all participants by the Ecol WB team. There were 3 Short Term Monitoring (STM) workshops taught during the summer of 2022 at Lake City Research Centre (5/25 – 5/27; 6/15 – 6/17; 7/6 -7/8; 7/27 – 7/29). These 3-day workshops taught participants to identify and score leading ecological indicators on their farm.
- A total of 31 producers participated in the three STM workshops.
- On the last day, producers scored four sites and had to be within a standard deviation of the official score of the instructors.
- Furthermore, they received additional instruction when their farm was monitored.
- The Ecol WB team conducted Ecological Monitoring on 39 farms during the 2022 growing season using the Ecological Outcomes Verification (EOV) protocol developed by the Savory Institute in conjunction with Ovis21 and Michigan State University. EOV consists of Short Term Monitoring (STM) which evaluates 15 leading ecological indicators on an annual basis and Long Term Monitoring (LTM) which measures lagging ecological indicators every five years.
- LTM and STM were conducted on 27 farms during the summer of 2022 (mostly in Cohort 1 and 3) while 12 farms were monitored only with STM as they had previously been monitored and LTM site was already established (mostly in Cohort 2).
- As part of the LTM, the 27 farms newly monitored in 2022 were offered the opportunity to have additional monitoring conducted, including soil-testing (the Cornell Comprehensive Assessment of Soil Health), done at reduced rate through MSU which will establish baseline lagging ecological indicators such as soil health beyond that which the EOV Short-Term Monitoring will collect. This would allow producers to join the Land to Market program, the world’s first verified regenerative sourcing label, if they so desire.
- The Ecol WB team offered a series of other trainings to create the intervention towards regenerative ag:
- A Holistic Management training course was offered to C1 (6/22 – 6/24), with a specific focus on Holistic Planned Grazing. This workshop provided the foundation to managing holistically and served as the pre-requisite for the remaining HM workshops.
-
- 14 producers completed the course.
- There were 13 who had already taken the Introduction course during other opportunities .
-
- A specific Holistic Planned Grazing was taught to 23 producers during the height of the growing season (7/14 – 7/15).
- Producers left the workshop with a grazing plan for the remaining portion of the 2022 growing season.
- A Holistic Land Planning course was offered and had 17 producers participating (8/16 – 8/17).
- They left with a forward-thinking plan for their farm leveraging concepts learned from the previous workshops.
- A Holistic Management training course was offered to C1 (6/22 – 6/24), with a specific focus on Holistic Planned Grazing. This workshop provided the foundation to managing holistically and served as the pre-requisite for the remaining HM workshops.
- The Social WB team analysed the 2022 survey data.
- The Econ WB conducted a literature review on financial wellbeing to begin developing a farmer-specific financial wellbeing framework that includes both objective and subjective measures of financial wellbeing.
- EOV training was offered to all participants by the Ecol WB team. There were 3 Short Term Monitoring (STM) workshops taught during the summer of 2022 at Lake City Research Centre (5/25 – 5/27; 6/15 – 6/17; 7/6 -7/8; 7/27 – 7/29). These 3-day workshops taught participants to identify and score leading ecological indicators on their farm.
- Fall:
- Producers who attended an STM workshop and at least one HM workshop were eligible to apply for a mini-grant (form here: MiniGrant_Application__JH_MMS), distributed by the Ecol WB team. There were 16 producers eligible, 15 applied for and received a $2,500 mini-grant.
- Five spent their funds on fencing, five spent it on improving water for livestock, four for hay bale unrollers, and one for seeding.
- All expenses were appropriate for moving their operations towards a more adaptive approach to grazing.
- The Social and Ecol WB research assistants led data analysis for the annual social and ecological wellbeing data, along with the creation of summary documents to share with the participants.
- Each of the 39 farms that had EOV conducted on their land received an EOV summary report specific to their farm in November 2022. Each report is approximately 15 pages long and explains the results of the monitoring as well as providing some feedback about what farmers could do to align their production goals with sustainable management practices. Here is an example: EOV_APF_2022
- The Econ WB team developed and distributed a financial record-keeping survey (Initial_Contact_Survey for IRB 11-3-22) to understand the current state of the financial records of the participants as well as their level of record-keeping knowledge. Additionally, we continued to develop the financial wellbeing framework - Framework20230406.
- Producers who attended an STM workshop and at least one HM workshop were eligible to apply for a mini-grant (form here: MiniGrant_Application__JH_MMS), distributed by the Ecol WB team. There were 16 producers eligible, 15 applied for and received a $2,500 mini-grant.
Year 3 (2023):
- Winter
- The Ecol WB team began creating an online EOV training platform and accompanying material, secured supplemental funding from SARE through the conference funding line to subsidize the Holistic Planned Grazing workshops, and began planning for Spring and Summer courses.
- The Social WB team began to prepare a methods publication with the data from 2022. We also made some edits to the survey for clarity/efficiency and worked with the Econ WB team to integrate concepts related to financial wellbeing. The revised survey protocol for 2023 is here: 2023 MSU Socio-Economic_Wellbeing_Survey
- The Econ WB team finalized the financial wellbeing framework (including having the framework reviewed by other experts from academia, Extension, and the beef sector) which influenced their survey inputs but also the objective financial wellbeing data they planned to collect as farm financial records. They also began developing the financial record-keeping educational modules.
- Spring:
- The Ecol WB team planned the 7 sessions for 2023 and ran 2 during this period:
- 9 producers took advantage of a 4-hour planning session on March 10th 2023 to develop their grazing plan for the 2023 growing season. Each participant left the workshop with a poster-size chart to help them plan and monitor their grazing system: Grazing Chart
- We held a HPG 2-day course (5/25-5/26) with 5 participants. This included 2 producers from our project cohorts and 3 non-project producers.
- The Social WB team collected social and economic wellbeing data (i.e. psychological, subjective, and physical wellbeing; values; perceptions of financial risk) in April-May 2023, to update the social wellbeing dataset with a second time point and add the first time point to the economic wellbeing dataset. Data was collected online or via a telephone-based survey, depending on the comfort of the producer. 42 surveys were completed (some farms had multiple decision makers who each did the survey).
- The Economic wellbeing team held a webinar for SARE participants on May 30th 2023, teaching the basics of farm financial management and explaining the timeline and goals of data collection. Here are the slides: Econ Data Collection Webinar and the recording is here: https://mediaspace.msu.edu/media/SARE+Financial+Wellbeing+Webinar+on+May+30%2C+2022/1_h1ea208y
- The Ecol WB team planned the 7 sessions for 2023 and ran 2 during this period:
- Summer: There was some attrition during this period, with 3 participants dropping out so our total cohort is 36.
- The Ecol WB team:
- Hosted another short-term monitoring training (July 6/7) with 5 participants – 2 of which were part of the project cohorts and 3 were non-project producers.
- Hosted a Holistic Land Planning course Aug. 5/6. We had 5 participants, 2 of which were part of our project.
- Repeated the short-term EOV monitoring on 31 farms throughout late summer. Although we planned to have the participants carry out the assessment by themselves and submit photos to an online platform, we found that the producers did not want to do the monitoring themselves. They preferred we came to their farm and did the monitoring while they walked along and asked questions. Thus, the MSU team conducted the monitoring for 31 producers, 5 did not respond to communications to schedule the monitoring or submit the results of their own monitoring.
- The Social wellbeing team:
- Analysed the 2023 survey data.
- Continued to prepare a journal article ‘Exploring the Relationship between Regenerative Grazing and Ranchers' Wellbeing’ outlining the social wellbeing framework and using the 2022 data as an example application.
- The Economic wellbeing team met with 15 participants to collect the data for and create their financial reports (including whole-farm ratios and enterprise budgets) - protocol here: Financial Data Collection Worksheet. Visits were a mix of in-person and virtual, depending on the participant’s preference. The majority of participants did not respond to the econ team’s invitation to create the financial reports. The econ team took this as feedback to consider how to make the process more appealing in future iterations.
- The Ecol WB team:
- Fall:
-
- The Ecol wellbeing team:
- Prepared 31 individual farm reports, ~10 pages, with data integrated into the report to help illustrate changes in ecosystem function over time. An example is here: EOV_APF_2023
- Hosted a Holistic Financial Planning Course (Oct. 24/25). We had 4 participants, and 3 of them were part of this project.
- Launched the online EOV training (https://www.canr.msu.edu/regenerative-agriculture/eov-training/) to which all project participants were given access. We did not have a tracking mechanism for our project participants, but we had 10 non-project participants request access in Nov/Dec of 2023.
- The Social wellbeing team:
- Prepared and then distributed reports summarising each participant’s social wellbeing data as a short report in November 2023 (an example is here: MI_08_2023 report), along with a summary report looking across the whole group (SARE 2023 general report).
- We also submitted the social wellbeing framework paper to Journal for Rural Studies in November 2023: JoRS Wellbeing Manuscript
- The Economic wellbeing team:
- Analysed the financial report data collected in Summer 2023 and re-shaped the data collection tools to improve both the analysis for the farms that did share, as well as future data collection efforts.
- Analysed the subjective financial wellbeing data from the survey.
- Were made aware of the departure of Dr. McKendree from MSU (and academia) and were planning how to move forward.
- The Ecol wellbeing team:
Year 4 (2024):
- Winter:
- The Ecological wellbeing team:
- Created and distributed an “end of project check-in" survey (protocol here:2023 1114 SARE_Exit_Survey) to understand what project participants had gained from participating in our trainings. The survey was distributed to all 31 active EOV participants and we received 27 responses. More than half of respondents reported making changes to the frequency of grazing rotations and what indicators they look for when monitoring grazing spaces.
- Contributed to the holistic wellbeing paper described below.
- The Social wellbeing team:
- Received 'minor revisions' decision on the social WB paper, made the revisions, and resubmitted it: MSU SWB Manuscript_Revised
- Led preparation of a publication outlining our project’s framework for a holistic (social-ecological-economic) wellbeing index and analysis, to be submitted to Environmental and Sustainability Indicators in Summer 2024.
- Prepared the socio-economic wellbeing survey for final distribution in Spring 2024 - protocol here: 2024 MSU Socio-Economic_Wellbeing_Survey
- The Economic WB team rebuilt after Melissa McKendree left MSU. During this time, they:
- Were still analysing the financial report data collection from Summer 2023, and polishing the data collection tools for their repeated use in 2024.
- Additionally, to respond to the poor response rate in 2023, the Econ team updated an 8-module self-paced online farm financial course, “Farm Money Matters” for SARE participants. All SARE project (n=36) participants were invited to participate in it in March 2024 (Farm Finance Invitation). They were also invited to two group check-in meetings per month that will be held until February of 2025 to ask questions and discuss course content and/or other farm business management and recordkeeping issues with the course instructors. The course covers farm strategic planning and management, financial statements, financial analysis, budgets, succession planning and recordkeeping, including guides to QuickBooks, PC Mars and accounting spreadsheets.
- The Ecological wellbeing team:
- Spring:
- The Ecological WB team:
- Updated their monitoring tools and added a digital platform to make data collection easier and more efficient.
- Hosted a two-day grazing planning course on May 22/23 that saw 14 attendees (4 from project).
- Continued to collaborate with Social team on the holistic wellbeing journal article.
- The Social WB team distributed a final iteration of the socio-economic wellbeing data collection in April-May 2024 (online).
- The Economic wellbeing team:
- Ran two check-in meetings per month to answer questions about the self-paced online farm finance course, supporting participants in developing their own financial statements.
- In addition, they developed a spreadsheet to input all financial data, analyze it and create reports as seamlessly as possible.
- They then processed financial records and other information shared from 19 farmers at the interviews using this tool.
- The Ecological WB team:
- Summer:
- The Ecological WB team carried out a final EOV assessment on 31 farms.
- The Social wellbeing team analysed the final survey dataset and prepared 35 individualised annual reports plus a project summary.
- The Economic wellbeing team ran two check-in meetings per month to answer questions about the self-paced online farm finance course, supporting participants in developing their own financial statements. In addition, they checked-in by email with 3 producers about their financial wellbeing data.
- All teams collaborated on the analysis of the annual social, economic, and ecological wellbeing data and contributed to overarching evaluation to answer research questions:
- Analyzed relationships between cohorts – how does management relate to social, ecological, and economic wellbeing?
- Analyzed within cohort temporal patterns - How are ecological, social, and economic wellbeing and values influenced by or influence adoption? i.e. are producers’ values and wellbeing measures static or dynamic?
- Synthesized the pathways (conduits and barriers) to adoption of regenerative grazing practices.
- Fall:
- The Ecological wellbeing team prepared and distributed the final annual EOV reports, which integrated data from all three years of monitoring to illustrate changes over time on each individual farm. An example is here: example EOV report 2024
- The Social wellbeing team distributed 35 individualised annual SWB reports plus the final cohort report.
- An example individual report is here: 2024_SWB_Example
- The final report is here: SARE Project Final Report
- The Econ WB team:
- Distributed 20 subjective wellbeing reports. An example is here: Example Subj FWB Report
- Checked-in by email with 19 producers about their financial wellbeing data. Each individual producer received tailored advice on specific pieces of financial data still needing to be collected or shared to allow the whole farm and cow-calf enterprise financial analysis to be made.
- Carried out two in-person meetings and two over Zoom in November-December 2024, to follow up on that email, supporting individual farmers who had questions in recording and sharing financial data.
- Farmers who participated in the online course have not received certificates of completion as budgets were not developed by them. Instead, we developed the budgets based on records that farmers provided as they went through the course.
- Hodbod + the team then facilitated two dissemination events:
- Firstly, we shared out results with representatives of 19 participating farms at an event at on 13th November 2024. As well as allowing us to answer questions from the participating farmers, this acted as a networking event where the different cohorts met in person. The slides presented are here: 2024 1113 Producer dissemination workshop slides
- The following day we held an online webinar (at the advice of our Extension colleagues) to disseminate findings to our secondary audience, i.e. Extension educators, university faculty & researchers, beef sector stakeholders including the Cattleman’s Association, consumer representatives, and policy makers, SARE. There were 30 registered participants and 18 unique viewers/participants and an interesting discussion afterwards. The slides presented are here: 2024 1113 Holistic Wellbeing on the Farm - MSU webinar slides ; the recording is here: https://www.canr.msu.edu/videos/sare-holistic-wellbeing-dissemination
We anticipated conducting five producer trainings and over 180 producer check-ins with our participants, as well as a regional online survey to understand social/economic wellbeing and views on regenerative grazing across a representative population of cow-calf producers. By the end of the project we had conducted 6 producer trainings and 82 producer check-ins.
Inputs required to achieve these outcomes were SARE grant funds; land, facilities, and equipment of two MSU Research and Extension Centers; time, labor, and expertise of the researchers, Extension personnel, and producers.
A summary of the results can be seen here: 2024 1113 Holistic Wellbeing on the Farm - MSU webinar slides
SOCIAL WB
Initial (2022) social WB results showed that producers were generally well. As observed in Table 1, in 2022 overall farmers scored higher in relational wellbeing, followed by eudaimonic wellbeing and physical wellbeing as the three highest categories. This suggests that farmers are highly satisfied with their accomplishments, social support, health, and finances. When farmers were asked in a follow-up question which domains of wellbeing were most important to them, all groups consistently ranked relationships and purpose and meaning (eudaimonic wellbeing) as the first and second most important domains.
Table 1. Wellbeing constructs and overall index
|
Wellbeing constructs |
Mean |
Sd |
Cronbach’s Alpha |
|
Life Satisfaction |
0.76 |
0.14 |
0.79 |
|
Hedonic Wellbeing |
0.71 |
0.13 |
0.82 |
|
Eudaimonic Wellbeing |
0.80 |
0.11 |
0.75 |
|
Relational Wellbeing |
0.86 |
0.14 |
0.79 |
|
Physical Wellbeing |
0.77 |
0.11 |
0.15 |
|
Social WB Index |
0.78 |
0.10 |
0.84 |
We then computed a correlation matrix to observe the strength of the relationship between constructs to assess divergent validity. In general, we observe that the strength of the correlation between the constructs is low to moderate and in the expected direction considering our theoretical expectations. Surprisingly, relational, eudaimonic, and physical wellbeing showed the lowest correlation with the social wellbeing index. Despite having similar levels of variability in their scores, life satisfaction and hedonic wellbeing had the strongest relationship with the index. In other words, farmers with a high social wellbeing index were more likely to score high in life satisfaction and hedonic measures, even though the farmers self-identify relational, eudaimonic, and physical constructs as the main contributors to their wellbeing (see table 1). Our initial thought was the effect of the support received from their interpersonal relationships was expressed as the absence of negative motions (anxiety, sadness, and anger) and the presence of positive ones (joy, contentment, and positivity) captured through Hedonic wellbeing. However, the correlation matrix does not indicate a strong relationship between the scales used to measure these domains. A more plausible explanation is that the relationship between relational wellbeing and the social wellbeing index is not fully captured by our estimation approach, in other words assigning equal weights to each category to create the index does not reflect the farmer's understanding of “relationships”. Further research with larger sample sizes and alternative reliability analyses could provide additional insights into the multidimensional nature of social wellbeing.
Table 2. Correlation matrix
|
|
Life Satisfaction |
Hedonic Wellbeing |
Eudaimonic Wellbeing |
Relational Wellbeing |
Physical Wellbeing |
Social WB Index |
|
Life Satisfaction |
1.00 |
|||||
|
Hedonic Wellbeing |
0.64 |
1.00 |
||||
|
Eudaimonic Wellbeing |
0.58 |
0.50 |
1.00 |
|||
|
Relational Wellbeing |
0.54 |
0.46 |
0.39 |
1.00 |
||
|
Physical Wellbeing |
0.60 |
0.52 |
0.50 |
0.38 |
1.00 |
|
|
Social WB Index |
0.87 |
0.81 |
0.74 |
0.73 |
0.75 |
1.00 |
Table 3 displays the scores for the five constructs and the wellbeing index in 2022, along with the results of multiple pairwise comparisons. Our objective was to determine whether any of the cohorts scored significantly different from the others for any of the wellbeing constructs, including the social wellbeing index. Considering the limitation of our sample size, we compare the differences among the three cohorts of farmers using the post-hoc non-parametric Dunn test since it is an appropriate option when the ANOVA assumptions of equal variance or normal distribution are not fulfilled (Dinno, 2015). Moreover, p-values were adjusted to control for the family-wise error rate (FWER, rejecting the null hypothesis when it is true) using Holm's correction.
Table 3. Wellbeing and farmers' groups (there is no evidence that differences in mean between groups are statistically significant.)
|
Life Satisfaction |
Hedonic Wellbeing |
Eudaimonic Wellbeing |
Relational Wellbeing |
Physical Wellbeing |
Social WB Index |
|
|
Non-adaptive |
0.82 |
0.74 |
0.83 |
0.89 |
0.83 |
0.82 |
|
Adaptive |
0.75 |
0.69 |
0.78 |
0.79 |
0.76 |
0.75 |
|
Adopting |
0.73 |
0.71 |
0.79 |
0.82 |
0.75 |
0.77 |
|
Pairwise-comparison (p-value -adjusted) |
|
|
|
|
|
|
|
Adaptive - Adopting |
0.44 |
1.00 |
0.63 |
0.79 |
0.85 |
0.44 |
|
Adaptive - Non |
0.51 |
1.00 |
0.22 |
0.14 |
0.25 |
0.11 |
|
Adopting - Non |
0.20 |
0.73 |
0.38 |
0.13 |
0.23 |
0.33 |
It can be seen from the data that non-adaptive farmers generally scored higher in all constructs compared to the adapting and adopting groups, with the largest differences observed in life satisfaction between non-adaptive and adopting (-0.09), relational wellbeing between non-adaptive and adaptive (-0.1), and overall social wellbeing index (-0.07). However, despite these differences, none of them were found to be statistically significant, except for the difference in social wellbeing index between the adaptive and non-adaptive groups was borderline significant at 90% level (p-adj = 0.11 < 0.10). Despite the no statistically significant difference, it is interesting to observe the variation in the ranges – min and max values -for each group and discuss this in the view of the theory of subjective wellbeing homeostasis. Cummins et al., (2003) and Cummins & Wooden, (2014) suggests “homeostasis” as an analogy to explain why the mean values for subjective wellbeing metrics in the western world are about 75% of the scale score, arguing that subjective wellbeing is “actively controlled and maintained” with a form of steady-state affective set-point. Thus, this implies that we would observe little variation if people's homeostatic systems are normally functioning.
Considering Cummins’ theory, we could ask what is the “set-point” around which social wellbeing variations are interesting to interpret despite their non-statistical significance. Looking at the prior cited literature, we observe that subjective wellbeing scores for farmers in Sherren, Brown and Brown studies were in a range of 70 to 80% of the scale's maximum scores used on those studies. Such values are consistent with what we observed for the adaptive and adopting groups but not for the non-adaptive ones. There could be two possible scenarios, the first one is that the non-adaptive farmers' higher scores in all constructs reflect their current homeostatic state, where they have adapted to their existing circumstances and have found a way to maintain their overall social wellbeing, despite not adopting new agricultural practices. An alternative scenario may suggest that the adaptive and adopting groups may be going through a period of adjustment due to the adoption of new practices, which may temporarily disrupt their homeostatic equilibrium. This suggests that there may be some differences in social wellbeing between the adaptive and non-adaptive groups relate to the adoption of regenerative grazing, but more data would be needed to confirm this.
In 2023, we found similar results:
- Life Satisfaction (average score 74/100): We assessed individuals' overall subjective evaluation of their lives. The average score of 74 suggests that participants report a generally positive level of contentment.
Hedonic Wellbeing (average score 69/100): Within this domain, we examined how often individuals experience both positive and negative emotions. Past studies utilizing similar methods have reported scores ranging from 62 to 70.1 In our survey, the average respondent's score of 69
indicates a typical level of positive and negative emotional experiences. - Eudaimonic Wellbeing (average score 73/100): Our respondents achieved an average score of 73 in this domain, which is within the scores reported in past studies (72 to 76).1 This indicates that producers in general demonstrate a reasonable degree of self-perceived value, a drive to achieve goals, and interest and dedication in their daily activities.
- Relational Wellbeing (average score 80/100): We assessed the quality of relationships and how it influences individuals' wellbeing. With an average score of 80, our respondents demonstrated a significant level of satisfaction with the support received (or perceived) from their social
networks. This exceeds the scores reported in other studies, which typically range from 69 to 73, indicating a relatively higher level of relational wellbeing among our respondents. - Physical Wellbeing (average score 75/100): Within this domain, participants were asked to assess their physical and mental health and financial conditions. An average score of 75 indicates that our respondents hold a positive self-perception regarding their own health, including mental health, physical fitness, and satisfaction with their financial resources to meet their needs.
Table 4. Wellbeing constructs and overall index
|
Wellbeing constructs |
2022 Mean |
2023 Mean |
|
Life Satisfaction |
0.76 |
0.74 |
|
Hedonic Wellbeing |
0.71 |
0.69 |
|
Eudaimonic Wellbeing |
0.80 |
0.73 |
|
Relational Wellbeing |
0.86 |
0.80 |
|
Physical Wellbeing |
0.77 |
0.75 |
|
Social WB Index |
0.78 |
0.74 |
|
2024 Mean |
| 0.77 |
| 0.70 |
| 0.77 |
| 0.81 |
| 0.79 |
| 0.77 |
In 2022-24, based on the scores obtained in the five domains of social wellbeing, we calculated an overall index with an average score of 78, 74, and 77 out of 100. The index score suggests that the level of wellbeing among our participants falls within the range observed in other studies, indicating, a perception that their lives, in general, are going well. On closer examination of the factors influencing the general Social Wellbeing Index, participants generally scored higher in relational wellbeing, followed by physical wellbeing and life satisfaction. This indicates a notable sense of happiness with their interpersonal relationships, as well as their physical health among producers. Confirming this, when asked about the most important domains of wellbeing, our respondents consistently ranked relationships and health as their top priorities. It is important to emphasize that there are no universally established benchmarks for defining low or good levels of wellbeing. However, our findings align with prior research where general wellbeing scores typically range from 70 to 80.3 Another perspective we can take is that the scores in the different domains and the general index all fall within a range that is commonly associated with a healthy state of wellbeing.
Table 4 shows the changes in the average score of wellbeing overtime. While there is little variation, we observed that scores decreased slightly from 2022 to 2023 and then increased in 2024. Observing this behavior has been important to raise further questions on the relationship between grazing management and producer wellbeing. As suggested in Vivas and Hodbod (2024) this temporal data can help to identify what are healthy levels of wellbeing among cow-calf producers and also justify that producers transitioning to regenerative grazing are able to maintain such level of wellbeing.
ECOLOGICAL WB
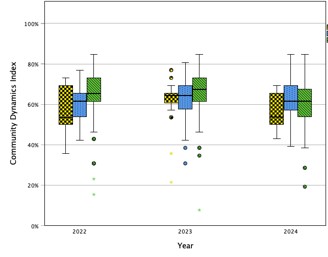
2022 EOV scores ranged from 9.1 to 61.50. 2023 EOV scores ranged from 9.5-60.30. 2024 EOV scores ranged from X-Y.
Overall, as expected, the HPG group had a higher mean than the continuous or adopting groups. In Michigan, above 60 indicates nearing eco-region potential, with a healthy ecosystem and regenerating land. Some producers in all groups reached this threshold. Means tended to be 31-60, which indicates slight departure from ecoregion potential, with ecosystem slightly impacted and land stabilising. In the adopting and continuous groups we saw more producers with 1-30 monitoring scores, indicating ecosystem is severely impacted and land is degrading. Some outliers were below 0, which indicates heavily degraded land.
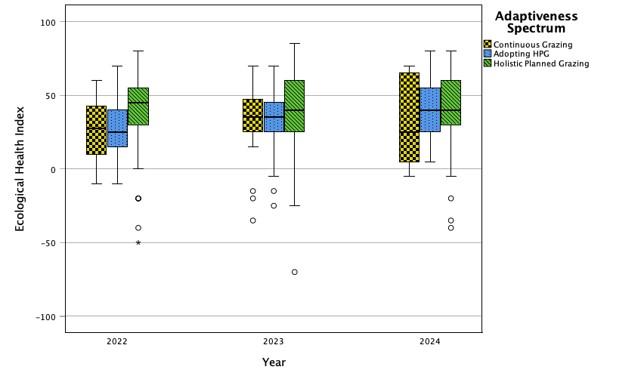
Due to the short-term nature of this project we cannot quantify any landscape-level changes, but based on feedback from the “end of project” survey we know that the producers did make changes to their grazing management practices such as increasing the frequency of cattle moves between pastures, the gained knowledge about monitoring for ecological indicators, and some of them changed attitudes about the feasibility of adaptive grazing. Due to the drought in the beginning of the growing season in Michigan (2023) we generally saw decreases in ecological wellbeing, but the monitoring team agrees that these declines are a direct result of the drought and not management choices. That said, some of the farms at the more adaptive end of the spectrum were using management practices such as supplementing hay during the growing season to help protect their pastures from degradation during the dry period.
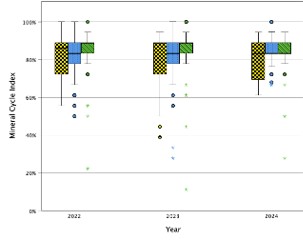
When looking at the sub-index data, the lowest scores are in Community Dynamics because of Michigan’s context.
ECONOMIC WB
Data from the economic team hasn't been disaggregated into the producer groups yet for our SARE participants due to personnel shortages. When combined with other research projects using the same tool in OK, TX, WY, and CO as well as MI scores ranged from 2.20-4.40, with an average of 3.59 (1 = poor, 5 = excellent).
–Farm subjective WB average = 3.31
–Household subjective WB average = 3.88
–Higher perceived FWB at household scale compared to farm
Generally we found producers very hesitant to share economic data and that has influenced our sample size and robustness of the analyses, hence integrgating with other study data. There is a need to communicate to farmers that objective information based on farm records can increase their confidence in decision-making, and that the suite of farm and household financial ratios that our tools help them compute are useful comparison tools for progress over time (i.e. Breakeven livestock prices for the cow-calf operation). By understanding the difference between cash, accrual, and economic profits, producers can move to more advanced understandings of their farm finances. Example outputs looked like this:
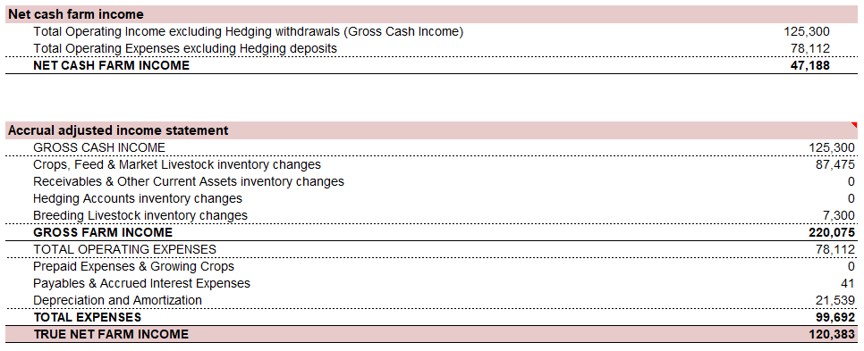
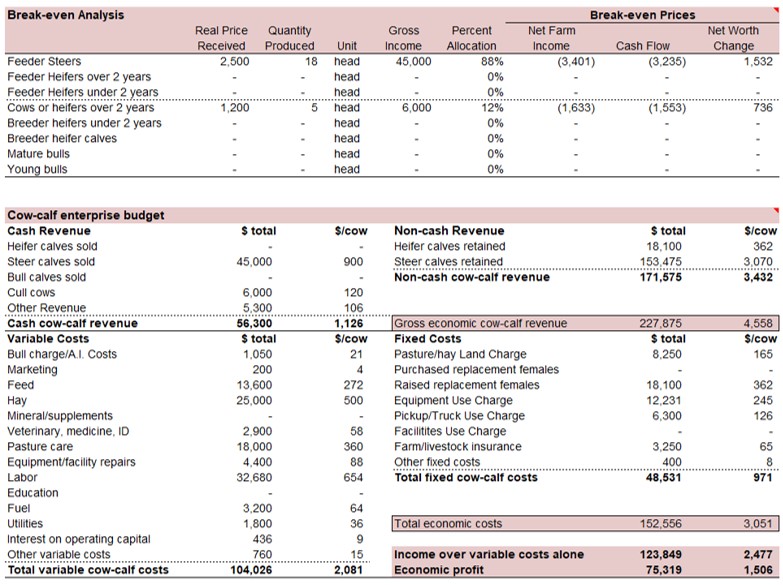
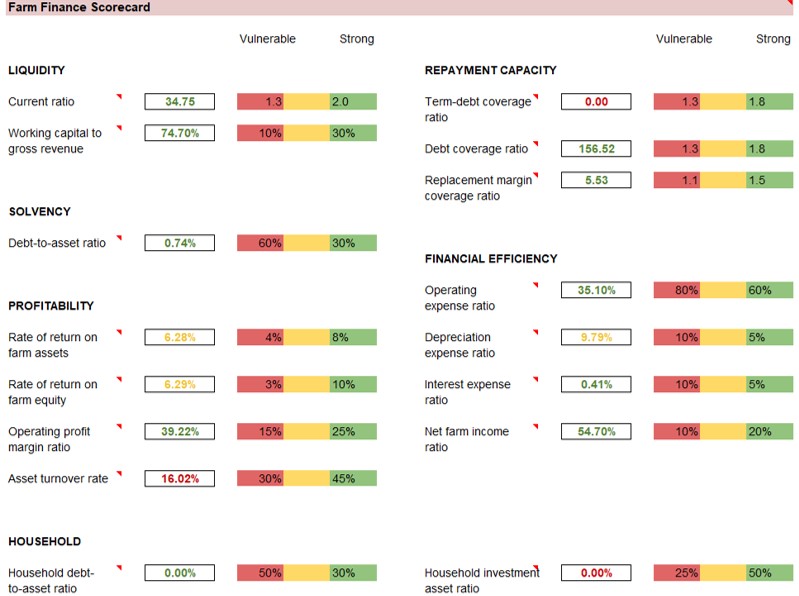
Preliminary results show farm cash flows that range from positive 250K with most financial ratios in the “strong” range, to negative 250K with financial ratios in the “vulnerable” range most of the time. However even the low income participants show a very healthy relationship with lenders, with high liquidity and solvency ratios. Although it is still early in the analysis to find correlations between this finding and farmer wellbeing, this seems to indicate that producers in this study tend to not rely on lenders which may improve both, their feelings of wellbeing as well as their objective financial wellbeing even in times of negative profits.
Over the project lifetime, our goals evolved and simplified slightly, as we realised without qualitative data we couldn't fully address conduits and barriers to adoption. We are able to break RQ2 into three more specific goals:
- To better understand how to monitor social, economic, and ecological wellbeing in farming
- To identify links between wellbeing and grazing strategy
- To better understand the links and trade-offs between types of wellbeing.
Before answering the RQ, we want to flag that integration involves acknowledging the complexity of each of these forms of wellbeing, and that because of small sample sizes we have qualitatively integrated the different subjective elements of wellbeing:
- 5 social wellbeing elements
-
1.Life Satisfaction: feeling good about one’s life as a whole.
2.Hedonic Wellbeing: the experience of positive and the absence of negative emotions in life.
3.Eudaimonic Wellbeing: a sense of accomplishment, and engaging in activities that provide a sense of purpose and fulfilment in one’s life.
4.Relational Wellbeing: feeling loved, supported, and valued by those we have relationships with.
5.Physical Wellbeing: being physically and mentally healthy to engage in daily activities, and having the economic resources that support enjoying life.
-
- 8 subj econ wellbeing elements
- Household short-term needs
- Household short-term wants
- Household long-term needs
- Household long-term wants
- Farm short-term needs
- Farm short-term wants
- Farm long-term needs
- Farm long-term wants
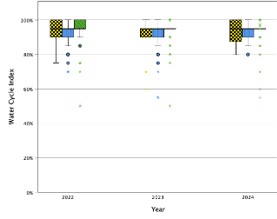
- 4 ecological wellbeing elements
- Water cycle
- Mineral cycle
- Energy flow
- Community dynamics
The analyses we have thus far are from the final 2024 dataset with the most complete econ data; final papers will also look at change over time (2022-2024). Therefore, this research answers ‘what’ questions, not ‘why’ questions. Here are our main conclusions from the data integration presented in this figure:
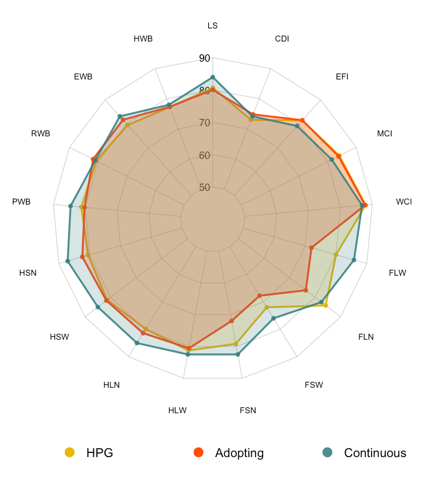
- Most of the variation by group is within the farm-level subjective econ WB:
- Only statistically significant differences by group are for Farm-level needs and FSW for HPG and adopting; FLW for cont and adopting
- Adopting seems to cause a temporary decrease in subjective farm-level financial WB
-
- The integration of objective metrics (still being collected) will deepen this analysis.
- Ecological WB data as expected, preliminary analyses say significantly different scores between producer groups, as expected.
- Adopting HPG group is lower than HPG group but slightly higher than continuous.
-
HPG average EHI was 41
-
Adopting average EHI was 34.
-
Continuous average EHI was 31
-
- Adopting HPG group is lower than HPG group but slightly higher than continuous.
- Good news – all types of WB as expected for all groups, no obvious trade-offs between types of WB
- HWB scores reflects stereotypical goals:
-
Prioritize Ecology if HPG
-
Prioritize Econ WB if continuous
-
Everyone’s Soc WB high
-
- Future qualitative and longitudinal work will help us understand why.
Education
37 Farmers participating in research
31 participated in EOV monitoring every year. We continued to have 5 participants who did not respond to our requests/outreach for conducting monitoring in summer 2023 or 2024. Four project participants took part in all the offered holistic management trainings, and one went on to become an accredited EOV monitor with the Savory Insititute.
Educational activities in 2022 were:
- 3 Short Term Monitoring (STM) workshops (3 days each) – 31 participants
- 1 Holistic Management workshop (3 days) – 14 participants
- 1 Holistic Planned Grazing workshop (2 days) – 23 participants
- 1 Holistic Land Planning workshop (2 days) – 17 producers
Educational activities in 2023 were:
- 1 Holistic Planned Grazing (HPG) Course (2 days) - 5 participants (agenda here: All_Agenda)
- 1 Financial Planning course (2 days) - 4 participants
- 1 Holistic Land Planning workshop (1 day) - 54 participants
- 1 HPG workshop (4 hours) - 9 participants
- Online Ecological Outcomes Verification (EOV) training launched July 12. Requires watching a series of 29 short (<5 min) videos and reading several workbook chapters. https://www.canr.msu.edu/regenerative-agriculture/eov-training/
-
EOV Training page: 2,898 total views
-
Videos: 775 total views
-
Workbook: 583 total views
-
Form submissions: 112 sign-ups - we have seen requests for access from across the globe. Some are producers/land managers, others are policy makers, and some are from academia.
-
Educational Activities in 2024 were:
- 1 Online Farm Finance training (8 modules) - 8 participants.
- HPG 2-day course May 22/23 that was attended by 4 project participants (of 15 total) as well as six Extension and/or State of Michigan employees who work with livestock growers and who received continuing education credit.
-
Dissemination day for producers = 19 farms participated
-
Dissemination webinar: https://www.canr.msu.edu/videos/sare-holistic-wellbeing-dissemination
Project Activities
Educational & Outreach Activities
Participation summary:
In 2021-22, the focus was on outreach to aid recruitment (newsletter articles, presentations etc.). We carried out education and outreach through the project activities described above - presentations to audiences in MSU as well as at international conferences, MSU news articles, and tours of Lake City to senior leadership at MSU.
In 2022-23, the focus was on training and data collection.
In 2023-24, the focus began to shift to dissemination of Y2 results to participating producers as well as to other audiences - other producers, ag educators, academia. We prepared summary reports to share widely through CANR and SARE as well as journal articles for academic audiences in extension and research.
Learning Outcomes
- Holistic approach to wellbeing
- Social wellbeing
- Economic wellbeing
- Ecological wellbeing
- Regenerative agriculture
- Short Term Monitoring
- Holistic Management
- Holistic Planned Grazing
- Holistic Land Planning
- Financial Record Keeping
Project Outcomes
Financial record keeping
Regenerative agriculture
Ecological Outcome Verification monitoring
Increased consideration of wellbeing when making farm management decisions