Final report for LNC23-489
Project Information
Our project titled "Enhancing sustainable pollination on urban farms using native plant conservation strips and outreach" will use research methods to explore pollinator biodiversity and management to enhance social, economic and environmental sustainability of urban farms in the North Central Region. We will emphasize farmer-driven research in sustainable agriculture by involving urban farmers in this research from beginning to end. We will utilize a farmer advisory panel, community contacts, farmer interviews and surveys to evaluate research methods and outreach throughout this project. The research will explore how pollination services are being affected by urbanization and how farmers can manage pollinators in these systems to enhance these ecosystem services. Urbanization has dramatically increased worldwide, with half of the global population currently residing in cities. Despite the lack of green space, cities have the potential to be hubs of agricultural production. Sustainable urban agriculture has been vital to increasing food security by giving access to fresh unprocessed food in underserved communities. Urban gardens can also enhance community-building and environmental stewardship. While urban agriculture has many benefits, concerns have arisen about its impact on ecosystem functioning and pollinator biodiversity. Many crops grown in urban agriculture are pollinator-dependent but little is known about urban pollinator communities. It is also important to understand how educational tools and outreach can influence farmer perceptions of best pollinator management methods. One of the most effective and accessible pollinator management tools used in sustainable agriculture is native plant conservation strips surrounding crop fields that consist of native plant species known to attract bee species. This project will also inform USDA Natural Resources Conservation Service (NRCS) by investigating how small-scale urban sustainable agriculture can adapt to implement conservation plans involving native pollinator management. Our findings will also provide information to the Federal Advisory Committee for Urban Agriculture and Innovation Production by giving further recommendations for supporting sustainable urban agriculture. In this project, we propose surveying and comparing bee communities in urban gardens when native plant conservation strips are implemented. This project will result in two primary outcomes: 1) we will learn about the importance of improving urban habitat for pollinators and, 2) urban farmers will gain educational resources to support making pollinator management decisions through outreach. These outcomes will enhance the future of sustainable urban agriculture by deepening our understanding of pollinators on urban farms and by giving farmers educational resources and experience with pollinator management.
Objective 1: Improve in-farm habitat for pollinators by utilizing native plant conservation strips on urban farms.
Learning Outcome 1: We will learn how floral resources can support pollinators and resulting crop pollination.
Action Outcome 1: Urban farmers will attend workshops and be given assistance in implementing native plant conservation strips on their farms.
Objective 2: Understand urban farmer perceptions and decision-making tools used for making pollinator management decisions.
Learning Outcome 2: Urban farmers will gain educational resources to guide decision-making for pollinator management.
Action Outcome 2: Urban farmers will make informed decisions when considering pollinator management.
The NCR SARE Research and Education Grant Program has not previously
funded projects at Michigan State University investigating pollination services in urban
agriculture. Previous work with native plants to support pollinators has been funded to
Dr. Isaacs (LNC08-297). Their research was conducted in fruit farms (apples,
blueberries, cherries) and their findings demonstrated that the incorporation of
conservation strips increased native bee abundance in crops. They also found an
increase in pollination adjacent to conservation strips. This research exclusively
focused on fruit farms and the enhancement of plant diversity in large-scale rural
agriculture. Our proposed project will investigate whether implementing native flower
strips improves bee diversity and pollination services on small-scale urban farms.
In our project, we aim to build upon this knowledge to determine whether native plant
conservation strips demonstrate similar advantages in promoting native bee
populations and associated ecosystem services in urban agricultural settings. This
research will be conducted in Detroit and Lansing, Michigan on urban farms that
produce cucurbits, a pollinator-dependent crop that is widely grown in urban
agriculture. At each farm, we will work with the farmers directly to establish native
plant conservation strips using plant species that are highly attractive to pollinators. If
these plantings are successful in improving pollination services in urban settings, we
will establish pollinator management strategies that are effective and accessible for
sustainable urban agriculture.
In 2022, we conducted surveys on 10 urban farms to gauge interest in incorporating
pollinator management methods and growers indicated that they want to understand
more about bee communities. While these urban farmers were enthusiastic about
pollinator conservation, there was some concern about the time needed for the
maintenance of pollinator management strategies. Urban farms frequently encounter
labor shortages and rely on labor from volunteers and community members. Thus, it is
an essential component of our project to both assist farmers with the initial planting of
these native plant strips and provide continued support to maintain the strips.
Additionally, there was hesitation about the monetary investment of these
management methods. Urban farmers do not receive federal support and often
depend on small grants, personal funds and have lower economic returns. We will
provide financial support to farmers to alleviate their concerns. Consequently, our
project will be enhancing both the economic and environmental value of these urban
farms without raising expenses. We also have communicated with other urban farmers
and community organizations that are enthusiastic about native pollinator plantings.
Brittany Bradd, the owner of Greydale Farms in Detroit, said that she was very
interested in learning how her efforts to increase native plants on her farm are
impacting bees. Community organizations are also interested in enhancing pollinator
habitats for sustainable agriculture and beyond. For instance, Rescue MI Nature Now,
Inc., a non-profit in Detroit that is working towards enhancing green spaces in urban
environments explained “We’d love to support you with this grant as we’ve been
working to create native pollinator habitats in our neighborhood and this will
complement what we’re doing.” We already have connections with several supportive
individuals and groups for enhancing pollinator habitats in urban spaces.
Cooperators
Research
We hypothesize that habitat enhancements will positively affect bee abundance and richness in urban farms, similarly to farms in rural settings. We also predict that farmers will be receptive to our outreach efforts and gain an understanding of how to help pollinators.
The overall purpose of this project is to 1) better understand how native plant conservation strips influence the composition of bee communities on urban farms and their associated ecosystem services and 2) determine the best approach to increase awareness and implementation of pollinator management on urban farms and, 3) create outreach materials and conduct field days and workshop series with our partnering organizations to increase overall awareness of native bees and their pollination services on urban farms.
Objective 1: Improve in-farm habitat for pollinators by utilizing native plant conservation strips on urban farms.
We established 46.5 m2 native plant provisioning habitats on nine urban farms and gardens in Detroit and Lansing, Michigan, U.S.A. in May and June of 2024. Habitats were composed of 240 individual plant plugs belonging to 15 perennial species that were sourced from a local plant nursery (Wildtype Native Plants, Mason, MI). Plant species were selected for their pollinator resource value and ability to thrive well in urban environments based on growth pattern, heat tolerance, and overall resiliency. The shape and dimensions of the habitat and species arrangement were left to farm or garden manager’s discretion, resulting in random habitat design and species distributions which were not accounted for in this study. In 2024 and 2025, we maintained species composition by removing plants from habitats that were not part of the original 15 species selected.
Prior to observing floral visitation, we recorded floral abundance for each species. For plant species with larger, spatially separated The floral unit of all other species was the capitulum, spike, or secondary umbel (Baldock et al. 2015; Lowenstein et al. 2019). We then observed all floral visitation interactions between bees and native plants in the provisioning habitats between 9:00 and 14:00. We recorded temperature, percent cloud cover, and windspeed during each observation period and did not survey when there was precipitation, high windspeeds, or when temperatures were below 10℃ (Bloom et al. 2021; Roedel and Szendrei 2025). Visitation surveys occurred once monthly at each site throughout the squash growing months of June, July, and August in 2025. To sample pollinators at different times of day within our sampling window, we randomized site visit order each month. During the 30-minute observation periods, the provisioning habitat was split in half with one observer recording all floral interactions in each half concurrently. Therefore, the entire habitat was observed for a combined one hour each month, resulting in a total of 27 sampling hours. As our study focused on foraging, not pollination, contact to floral reproductive parts was not required for an observed visit, although this incidentally often occurred.
Non-invasive sampling methods were used for our bee identification to avoid over collecting on small urban farms. Larger and easily recognized species were identified on the wing. When species identification was not possible, specimens were collected in individual vials that were labeled with a unique identification and stored in a cooler. Specimen were removed after 20-30 minutes so that photographs could be taken with an OM System TG-7 high-resolution digital camera. We later used photos and supporting resources, including Discover Life bee species guide and world checklist (Hymenoptera: Apoidea: Anthophila; Ascher and Pickering, 2020) and “Bees an Identification and Native Plant Forage Guide” (Holm, 2017), to identify specimens to the lowest taxonomic level possible. Identifications using images were extremely conservative and should largely be considered verified “on the wing” as species characteristics are rarely visible in photos. To further guide identification, we used a reference collection of locally sampled bees available in the Vegetable Entomology Lab at Michigan State University (East Lansing, MI). The collection included bees identified by an expert (Jason Gibbs, University of Manitoba, CA) for a similar study (Roedel and Szendrei 2025). When we were unable to identify a specimen on the wing or collect them, they were recorded as ‘wild spp.’ in surveys.
After bee identification, we classified specimen as squash pollinators or non-squash pollinators. Squash pollinator status was determined by previous literature observing bee-squash flower visitation. As many studies report only genus level identifications of pollinating visitors and many of our identifications are not down to species, classification of bees as squash pollinators is often by genera. In the case of Bombus, this resulted in the classification of the cleptoparisitic species B. citrinus as a squash pollinator. Although this species efficiency as a pollinator is likely low, the potential that they are among unidentified Bombus from previous studies can’t be ruled out. Other taxonomic groups classified as squash pollinators despite unresolved efficiencies include Ceratina and Triepeolus remigatus. We did not use reports of very few individuals (three or less) foraging on squash flowers as support of their role as pollinators if this was not reiterated in multiple studies.
We observed squash flowers after completing visual surveys in the provisioning habitat whenever squash was blooming, which varied by farm. Squash plantings were a minimum of 46.5 m2 and were planted within 305 m of the native provisioning habitat. On some farms, squash plantings were unsuccessful or planted too late in the season, resulting in flowering outside of the June-August sampling window. This limited squash observations to 5 farms, which were surveyed 1-2 times. During squash surveys, we visually observed up to 30 random open flowers (15 female, 15 male) for 1 minute each. For each 1-min trial, we counted the number of visits that resulted in a bee contacting the squash anthers or stigma. We identified all bee visitors following the same methodology previously described. Ultimately, we completed 127 1-min observation trials, or 127 sampling minutes.
All analyses were conducted using R Statistical Software (v4.; R Core Team 2024). Species accumulation estimates of bee species and morphotypes (unresolved species) were conducted using the ‘vegan’ package (Oksanen et al. 2020). We used the ‘DHARMa’ package (Hartig 2024) to investigate residual homoscedasticity and uniformity of all models, and the ‘performance’ package (Lüdecke et al. 2021) to check for model collinearity and singularity. For all models, we ran an analysis of variance modeling with the ‘Anova’ function from the ‘car’ package (Fox and Weisberg 2019). When significant differences were detected (p < 0.05), we investigated pairwise differences with a means comparison from the ‘emmeans’ package (Lenth 2025). Observations of floral visitation events were used to construct bipartite networks weighted by interaction frequency with the ‘bipartite’ package (Dormann and Fründ 2008). Network data were pooled together across the sites to create monthly networks for June, July, and August and all months together were used to create an overall network. We analyzed the monthly networks at the community (network) level using the networklevel function. Network-level analyses were performed using species and morphotypes, but for visualizations, we binned morphotypes by genus except in cases where they represented only two difficult to distinguish species. Although analyzing at different taxonomic levels is not ideal, it is accepted for field identification (Kremen et al. 2002; Moretti et al. 2009; Lowenstein et al. 2019).
Because network size heavily impacts all network values except for nestedness, we used a randomized null model and z-score approach to make comparisons across networks (Dormann and Fründ 2026; Dalsgaard et al. 2013; Gilarranz et al. 2015; James et al. 2013; Nielsen and Bascompte 2007; Sebastián-González et al. 2015; Takemoto and Kajihara 2016; Takemoto et al. 2014; Trøjelsgaard and Olesen 2013; Welti and Joern 2015). Additionally, we used null models to ensure that observed network indices were statistically different from random (Dormann et al. 2009; Dormann and Fründ 2026). To do this, we created 5000 weighted `r2dtable` null models (Patefield, 1981) for each network. Random null models were also used to compare site-level mean differences for each metric in the overall network with and without the observations of two extremely prolific Bombus species, B. bimaculatus and B. impatiens (henceforth referred to as BbBi), which accounted for ~47% of all interactions (Dormann and Fründ 2026).
Our overall network was also analyzed at the node (species) level using the specieslevel function. Node-level metrics were calculated using only fully resolved species (excluding morphotypes). For bees, we evaluated overall pollination service index (PSI), proportional generality, and two different measures of weighted centrality, betweenness and closeness. Proportional generality is the quantitative measure of normalized degree, revealing the number of interaction partners per species (Dormann and Fründ 2026) and PSI is the relative importance of a pollinator to community functionality based on species proportion and interaction (Dormann et al. 2008). For this study, PSI is theoretical as we were investigating foraging, not pollination, but it helps measure activity in the conservation strips and has strong translation to actual pollination services. Both centrality measures are commonly used to identify important species within a network (Russo et al. 2013; Jordán et al. 2006); betweenness ranks species as community connectors, closeness measures species proximity to others in the network (Freeman 1979; Martín González et al. 2010). Betweenness values greater than zero indicate a species is important for network cohesivity and connection (Martín González et al. 2010; Newman 2004), while a higher closeness value suggests a species readily impacts others within the community (Martín González et al. 2010). We then compared the mean node level metric values of squash pollinators and non-squash pollinators using generalized linear models with gamma distributions for all metrics except for betweenness, which was modelled using negative binomial distribution with the ‘glmmTMB’ package (Brooks et al. 2017).
To identify priority plants, we calculated mean proportional generality and both measures of centrality. These values also came from the overall network, as monthly networks were too small to calculate node level metrics after separating by site. To make comparisons across species, we used generalized linear mixed models and included site as a random effect. Proportional generality and closeness were modelled using gamma distributions with the ‘lme4’ package (Bates et al. 2015) but betweenness was modelled using negative binomial distribution. We used simple chi-square test analyses comparing total visitation frequency and visitor species richness across pollinator status to determine if squash or non-squash pollinators were supported more by each plant species. This was done excluding the visits of BbBi for a more balanced comparison. Highly attractive plants, those visited more frequently than expected given their floral abundance, were identified as those outside of the 95% confidence interval for the correlation between floral abundance and total visitation (Russo et al. 2013; Lowenstein et al. 2019). This correlation was modelled using zero truncated negative binomial distributions under four scenarios: all bees, all bees except for BbBi, all squash pollinating bees except for BbBi, and all non-squash pollinating bees. For the first two models, floral abundance, month, and plant species were fixed effects with farm as a random effect, but due to singularity in the remaining models, the random effect was removed (all squash pollinators -BbBi) or replaced with flower (non-squash pollinators).
We investigated the impacts of month and plant species as well as all other variables (bee origin and pollinator status, sampling time period, temperature, wind speed, cloud coverage) on total floral visitation rates. Here, we used the ‘dredge’ function from the package “MuMIn” (Barton, 2025) to select the top model. We repeated this process without BbBi observations to assess if these two Bombus species were shaping floral visitation patterns (Plant et al, 2025). Finally, we compared visitation in provisioning habitats to observed squash flower visits. Due to variation in sampling intensity between these two flower types (native and squash) and limited squash observations, differences are only visualized as proportion of total visits by observed squash pollinators to squash flowers and to all native flowers.
Objective 2: Understand urban farmer perceptions and decision-making tools used for making pollinator management decisions.
The primary objective of our survey was to identify and evaluate factors that informed pollinator management decisions initiated by urban growers. This included attempting to elucidate the relationship between the use of pollinator management methods and grower dependence on insect pollinators based on the crops they grow. Additionally, we aimed to investigate how decisions are impacted by grower demographics, perception of pollinators and conservation, motivation for urban farming and pollinator management, resource use and accessibility, and their source of educational information. A secondary objective was to evaluate pollinator educational resources used by growers to increase our understanding of their learning preferences and improve pedagogy.
To support our objectives, we developed a survey with 45 questions that were a mix of three-point Likert-style, multiple choice, true or false, and open response. The survey was made available in English and Spanish and was designed to be completed in approximately 10 minutes. No questions were required; therefore, participants could refrain from answering at their discretion. Questions were divided into four parts: farm/garden description, farm management, pollinator knowledge and resource accessibility, and participant demographics. Responses throughout these sections were used to determine crops grown and pollinator management strategies implemented by growers. They also informed our predictor variables, which fell within five major categories: demographics, perception, motivation, resource use and accessibility, and source of information.
Demographics: Studies have shown that grower demographics can impact the implementation of pollinator management strategies on farms (Hevia et al., 2021). Since grower demographics can influence the types of crops grown (Philpott et al., 2020), we inquired about the following grower demographics: age, gender identity, highest level of education, years of agricultural experience, and the percentage of overall income from farming. Age, gender identity, highest level of education, and percentage of overall income from farm were formatted as multiple-choices, while years of agricultural experience was open-response. We also included a multiple-choice for respondents to indicate whether their farm location was urban, suburban, or rural.
Perception: To understand how grower perception, or the knowledge and beliefs of pollinators and their management, influences the use of pollinator management strategies, we inquired about their limitations for implementation using a three-point Likert-scale (Table S1). We also included true or false questions to inquire about each respondents’ pollinator knowledge. These true or false questions tested grower perception of common beliefs regarding pollinators and their management.
Motivation: Based on previously found motivations for engagement in urban agriculture (McDougall et al. 2019), we asked respondents to indicate motivations for urban farming and gardening on a three-point Likert-scale consisting of the following statements: access to fresh and healthy foods, access to culturally appropriate foods, supplementing the food supply for self and household, environmental sustainability, the ability to provide food to the community, enhance social bonding within the community, and additional income.
Resource use and accessibility: Access to grower information and resources, or resource use and accessibility, can either limit or increase farmers’ capacity for pollinator management. Additionally, numerous urban farmers have experienced limitations when attempting to implement pollinator management strategies. To further understand this, we inquired about the following limitations using a three-point Likert-scale: financial investment, manual labor, city regulations, and access to plant resources.
Source of educational information: In this part of the survey, we asked respondents to select any of their preferred educational, pollinator sources from a list of online, hard copy, and in-person materials.
Pollinator management strategies: We evaluated the implementation (presence/absence) of eight common farm practices that positively influence pollinator abundance and diversity. These practices were selected because they provide resources for pollinators while requiring minimal financial or material investment. To avoid bias, pollinator management strategies were referred to as farm management methods in the survey. For each pollinator management strategy, participants were asked about their primary reason for implementation, with the following options: soil health, pest control, pollinator management, weed control, environmental impact, and "I don't use this method".
Crop richness and pollinator dependency: An estimate of farm crop richness was gathered by having respondents select the crops they grow out of a list of 21 common fruits and vegetables. These crops ranged in their pollinator dependency, which was used to categorize them into two groups. The highly pollinator dependent group included crops that pollinators are essential to (melons, summer squashes, winter squashes) or highly important for (cucumbers, apples, blueberries, cherries, peaches, plums, pears, raspberries, and blackberries) and the minimally pollinator dependent group contained crops with modest to no dependence (strawberries, currants, gooseberries, eggplants, broad-beans, sunflowers, tomatoes, peppers, and snap peas; Klein et al., 2007).
The proportion of high-pollinator-dependent crops grown was used to estimate the level of importance pollinators had for growers. We used this to classify growers into two groups: high and low pollinator importance. In the high importance group, 50% or more of the crops grown were highly dependent on pollinators (n=26). In the low importance group, less than 50% of crops grown were highly dependent on pollinators (n=46).
Data collection
Our survey was disseminated both online through Qualtrics (Qualtrics, Provo, UT) and in-person at various events from August to October, 2024. The survey was open to anyone in the United States (USA), but mostly circulated throughout Michigan, USA. Online distribution included social media posts, direct emails, various grower newsletters, university extension communications, Master Gardener Program leaders, and a post-webinar announcement. Hard copy versions and QR codes to the digital survey were made available at a ‘Pollinators in urban agriculture’ field day, the National Urban Agriculture Conference, a local farmers market, and at numerous events with the Greater Lansing Food Bank’s Garden Project. Growers were incentivized to complete the survey by providing entry into a post-survey raffle to receive a $100 gift card. A QR code and link to the raffle appeared after growers submitted their responses to the digital survey and it was also located on the last page of the paper survey. The winner was drawn one day after the survey was closed.
Data analysis
We received 126 initial survey responses which were analyzed using R studio version 2024.12.1+563 (Posit Team, 2025). Surveys with response time less than 4 minutes were removed from analysis (n=38). Surveys from non-urban growers (n=10), surveys without any responses, or that were duplicate entries were also removed from the analysis (n=4). After excluding these surveys, 74 were used in our analyses.
We used generalized linear models to investigate the correlation between the implementation of pollinator management strategies and grower pollinator dependency level. We also created generalized linear models to determine how implementation of pollinator management strategies and crop richness were influenced by the following predictor variable categories: grower demographics, perceptions, motivation, resource use and accessibility, and source of educational information. This was done by using a model selection process. We created separate global models for each of the five predictor variable categories for both pollinator management strategy implementation and crop richness as response variables. For grower motivation, ‘reasons for using various farm management methods’ was included only for crop richness as a response variable to avoid collinearity in the pollinator management implementation model. With crop richness models, we used three different response variables: total overall crop richness, total number of highly pollinator-dependent crops, and total number of low pollinator-dependent crops. We then used the ‘dredge’ function in the “MuMIn” package (Barton, 2025) to select the top model for each predictor variable category. Based on these results, we included the most important variables in our statistical models.
Using our model-selected variables, we created unique generalized linear models for each category for both response variables with the ‘glm’ function. Shapiro-Wilk tests were used to check whether the data were normally distributed. Gaussian error distributions were used for continuous response variables (crop richness) and binomial error distributions for dichotomous response variables (use of pollinator management strategies). We ran an analysis of variance modeling using the ‘Anova’ function with the “car” package (Fox and Weisberg, 2019). If significant differences were found (p < 0.05), we followed with a means comparison (package = ‘emmeans’; Lenth, 2025) to determine pairwise differences between predictor variables.
We also ran an analysis of variance to compare the overall effects of our five predictor variable categories on the implementation of pollinator management strategies. We created model averages from the five global models: demographic (N=16), motivation (N=64), resource use and accessibility (N=128), perception (N=1,024), and source of educational information (N=16,384). We then extracted the model averaged sum of weights for all variables for each management strategy. Next, we added the model averaged sum of weights for all predictor variables within a category together for each management method. We then frequency corrected these coefficients by dividing them by the number of variables in the predictor category they were from. We used the ‘Anova’ function to determine differences in the frequency-corrected coefficients across categories.
Objective 1: Improve in-farm habitat for pollinators by utilizing native plant conservation strips on urban farms.
During our study, we recorded 6,064 floral visits by 39 bee morphotypes to 13 floral species within the provisioning habitats. Two planted floral species were not visited; Fragaria virginiana, likely due to very low floral abundance and inconsistent flowering across sites (mean 26.33 ± standard deviation 36.25), and Symphyotrichum leave, whose flowering period began after our sampling had concluded and was therefore only detected in bloom at one site (Table 1). Two other species had very low total visitation despite relatively high floral abundance (Table 1); Packera paupercula (N=10) and Zizia aurea (N=37), but all other species were visited at least 100 times. The most visited species were Monarda fistulosa (N=1,449) and Penstemon digitalis (N=1,054).
Across the 39 morphotypes, identified bees belonged to five families (Apidae n=4,871, Halictidae n=539, Megachilidae n=297, Colletidae n=68, and Andrenidae n=2), and a minimum of 22 genera. The majority (75%) were squash pollinators, 20% were not, and 5% were not identified to a level allowing us to determine, making their status unknown (Table S1). However, two squash pollinators, B. bimaculatus and B. impatiens (BbBi) collectively accounted for 2,869 (~47%) of all visits, and without them only 52% of the remaining observations were of squash pollinators, while 38% were not, and 10% were unknown (Fig. 1, Table S1). The 39 morphotypes in our study represent 76% of species present, based off species accumulation estimates for all plots using Chao 1 which was ~51 (se.chao1=8.47). The most active genus was Bombus, and most frequent bee-floral species interactions always include BbBi: B. bimaculatus x M. fistulosa (N=836), B. impatiens x Oligoneuron rigidum (N=514), and B. bimaculatus x P. digitalis (N=402). These relationships also represent the predominant interactions for each month, as flowering peaked for P. digitalis in June, M. fistulosa in July, and O. rigidum in August. Without BbBi, Apis was the most active genus, followed by Bombus then closely Xylocopa (Fig. 1). The most frequent bee-floral species interactions were then Apis mellifera x O. rigidum (N=343), Xylocopa virginica x Asclepias incarnata (N=275), and Anthophora terminalis x M. fistulosa (N=199). Here, both A. incarnata and M. fistulosa were most abundant in July, so the predominant interaction for June (A. terminalis x P. digitalis, N=101) was not one of the most observed relationships (Fig. 2).
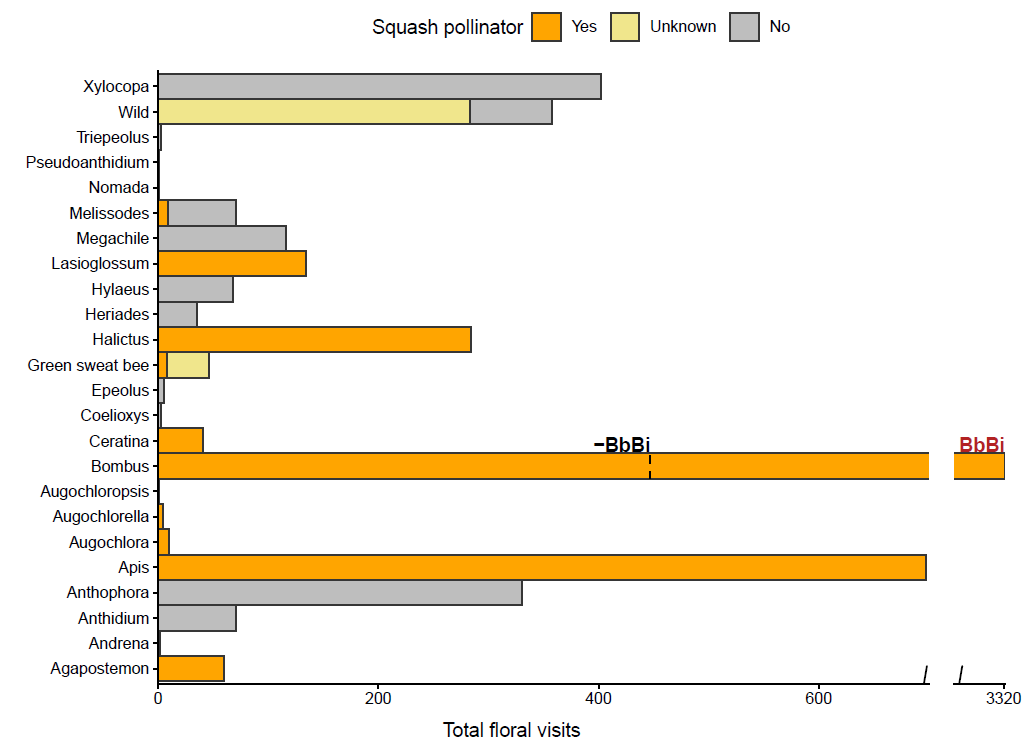
Figure 1. Flipped bar graph of the total floral visitation interactions observed for all genera (n=22) surveyed throughout the season. Morphotypes that were not identified down to a singular genus are binned under ‘wild’ except in the case of ‘green sweat bee’ morphotypes. Colors correspond to squash pollinator status (‘yes’, ‘unknown’, and ‘no’). The y-axis contains a scale break using the R package ‘ggbreak’ (Xu et al, 2021) to include Bombus outlier data of two species, B. bimaculatus and B. impatiens (BbBi), which accounted for ~47% of all observations. The black dashed line that runs through the Bombus bar and is labeled ‘-BbBi’ represents the total observations of all other Bombus species.
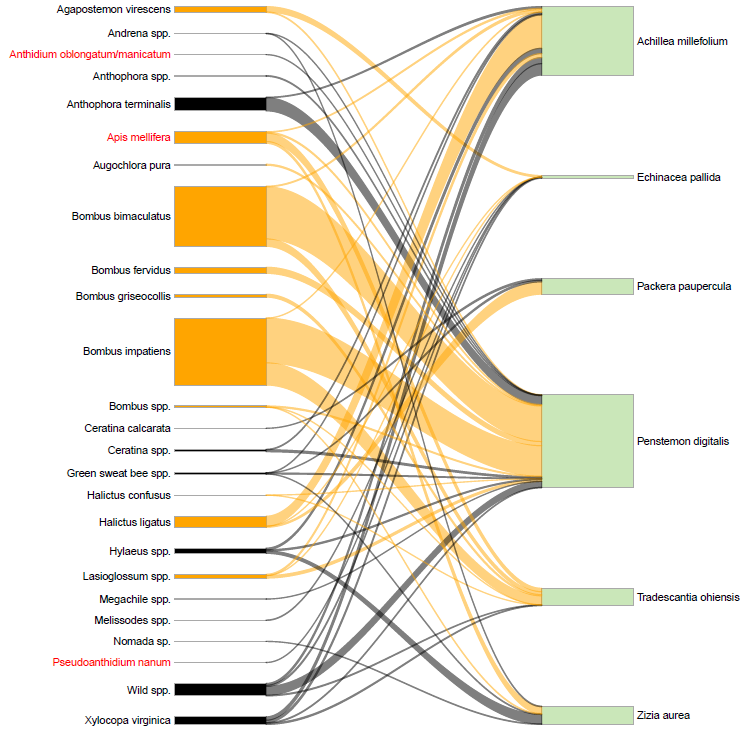
Figure 2. Overall visitation network displaying all observed floral interactions (6,064) between bees and native plants in the provisioning habitats across the season (June, July, August). Connecting link width reflects species interaction frequency, and plant species (right, green) boxes are scaled to their total floral abundance. Bee species (left) boxes are colored orange to highlight prominent squash pollinators and are scaled to activity (total visitation frequency); names of non-native species are in red. Include sentence here referring to the table of how you classified squash pollinators once you make that.
Visitation networks and node analyses
Observed overall network structure revealed lower than expected nestedness (z-score=-21.39; p < 0.001), linkage density (z-score=-228.02; p < 0.001), and connectance (z-score=-29.44; p < 0.001), but higher specialization (z-score=353.27; p < 0.001), when compared to the random networks derived from the null model (N=5,000). Monthly networks show the same pattern for all metrics, but values are most extreme in the overall network. All metrics were significantly different from random (Table 2). Structure changed throughout the season (Fig. 2; ); by month and z-score (when applicable), network size, connectance, and specialization were highest during July, while nestedness and linkage density were lowest at this period after peaking in June. Null model comparisons (N=5,000) of observed mean differences in metric values with and without BbBi showed significant differences in linkage density (mean difference=0.07, p < 0.001) and specialization (mean difference=0.003, p < 0.001), but not nestedness (mean difference=1.83, p > 0.05) or connectance (mean difference=0.002, p > 0.05). On average, BbBi increased network linkage density and specialization on individual urban farms (Table 2). Yet, z-score comparisons of the entire overall network without BbBi show greater linkage density (z-score=-136.89; p < 0.001) and reduced network specialization (z-score=223.33; p < 0.001).
Node level analyses of bees were conducted on the 24 fully resolved species, 14 of which were squash pollinators and 10 were not (Table 3). For pollination service index (PSI), the five highest values were all squash pollinators (BbBi, Agapostemon virescens, Halictus ligatus, and A. mellifera), but non-squash pollinator X. virginica had a very similarly high value (-0.001). Similar species had the highest proportional generality (B. impatiens, A. Mellifera, H. ligatus, X. virginica, and squash pollinator Bombus griseocollis). These seven species were also the only ones with betweenness centrality values greater than 0. Closeness centrality was again highest mostly among squash pollinators (BbBi, A. mellifera, and B. griseocollis) and X. virginica. When comparing mean metric values across squash pollinator status, squash pollinators had significantly greater and proportional generality (estimate = 0.51, SE = 0.24, t = 2.12, p < 0.05; Fig. 3a) and PSI (estimate = 1.23, SE = 0.59, t = 2.09, p < 0.05; Fig. 3b). Neither measure of centrality differed across pollinator status. After removing BbBi, no comparisons between squash pollinators (n=11) and non-squash pollinators (n=11) were significant (Fig. 3c; Fig. 3d).
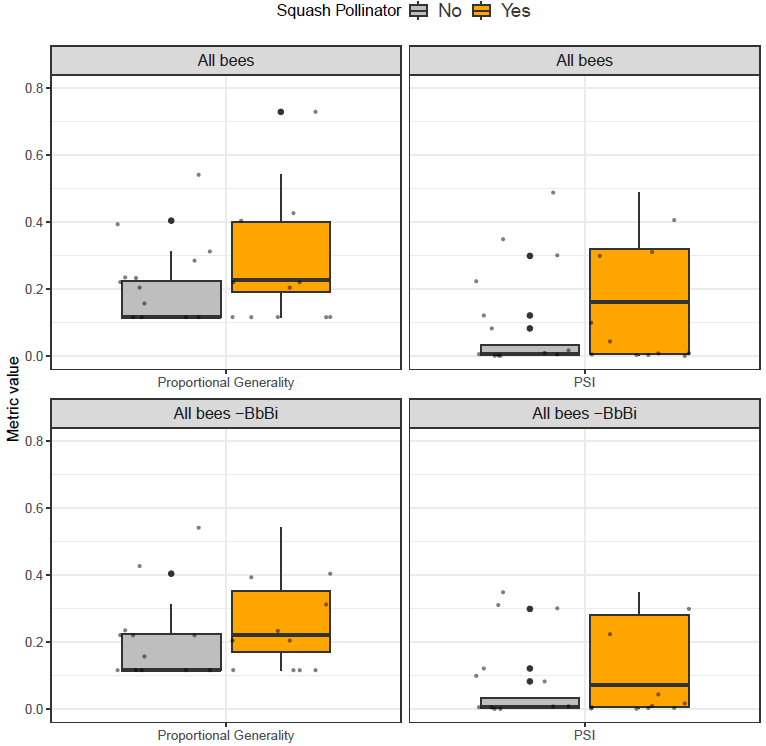
Figure 3. Boxplot comparing mean node metric values of non-squash pollinators (gray) to squash pollinators (orange). Panels (a) and (c) compare proportional generality, (b) and (d) compare pollinator service index (PSI); (a) and (b) used all bees in the analyses, and (c) and (d) excluded Bombus bimaculatus and Bombus impatiens (BbBi). When significant, the p-value appears in the top left corner, otherwise it is denoted N.S. (non-significant).
For plants, there were no differences in mean node metrics across species, but there was variation in which squash pollinator group was the predominant visitor to each plant species overall. Pooled calculations of node metrics show species with seemingly different values (Table 4), but they varied across sites (). Like the bee node analyses, few species had betweenness values greater than zero even when sites were pooled; Oligoneuron rigidum, Asclepias incarnata, Penstemon digitalis, Ratibida pinnata, and Monarda fistulosa. There were also no differences in visitor species richness across squash pollinator status for any plant species, so differences in visitation frequency were used alone to categorize which pollinator group each plant species supported most. Excluding the interactions of BbBi to create a balanced comparison between squash pollinator visits (n=1,653) and non-squash pollinator visits (n=1,216), nine of the plant species were still visited by squash pollinators more frequently. Three species were visited by non-squash pollinators more; A. incarnata (χ2=41.32, df=1, p < 0.05), M. fistulosa (χ2=142.32, df=1, p < 0.05), and P. digitalis (χ2=7.15, df=1, p < 0.05). Only one species, Zizia aurea, was visited equally by both pollinator groups (χ2=0.68, df=1, p > 0.05; Table 4).
Floral visitation and attraction
Floral abundance had strong impacts on the total visitation frequency of all bees together (χ2=21.91, df=1, p < 0.0001; Fig. 4a), all bees except for BbBi (χ2=11.7, df=1, p < 0.001; Fig. 4b), and non-squash pollinators (χ2=4.35, df=1, p < 0.05; Fig. 4c), but not for squash pollinators after excluding BbBi (χ2=0.29, df=1, p > 0.05; Fig. 4d). Although floral abundance was significant in the first three scenarios, different plant species are found above the 95% confidence intervals. When considering visitation of all bees combined, Oligoneuron rigidum and Monarda fistulosa are highly attractive while Ratibida pinnata and Achillea millefolium are visited less than would be expected given their floral abundance (Fig. 4a). To all bees except for BbBi, Asclepias incarnata is highly attractive (Fig. 4b). Asclepias incarnata is also highly attractive to non-squash pollinators, as is Monarda fistulosa (Fig. 4c), which supports previous Chi2 results (Table 4).
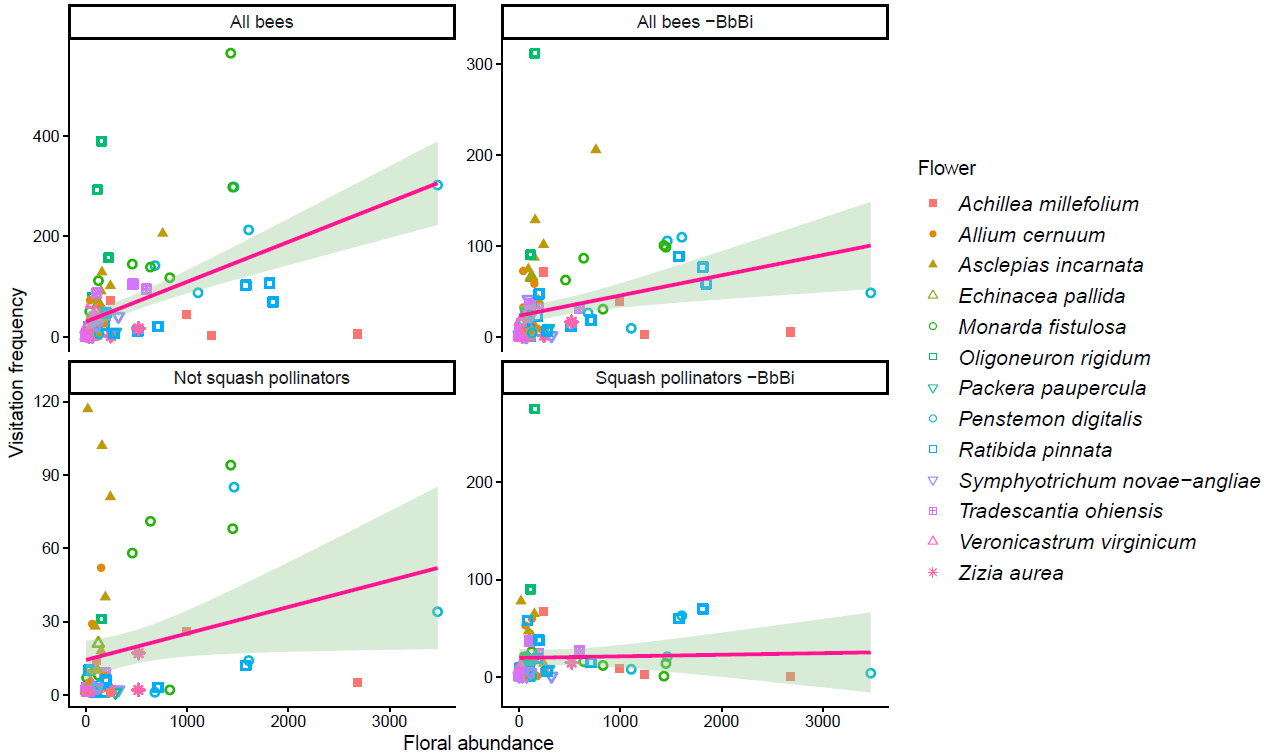
Figure 4. Plot of relationship between visitation frequency and total floral abundance at each site with 95% confidence intervals. Plant species visualized by color and shape according to the legend. Panel a) visitation of all bees, b) all bees except for Bombus bimaculatus and Bombus impatiens (BbBi), c) all non-squash pollinators, d) all squash pollinators except for BbBi. Floral abundance significantly impacts visitation in all panels except for d.
At the plant species level, total visitation frequency for all bees combined was also impacted by plant species, month, and squash pollinator status. Floral visitation varied across plant species (χ2=81.83, df=12, p < 0.0001) and month (χ2=18.85, df=2, p < 0.0001), with June having significantly higher species-specific visitation rates than July (estimate=2.63, SE=0.62, z=4.26, p < 0.0001) or August (estimate=3.07, SE=0., z=4.14, p < 0.0001). Pollinator status also impacted visitation (χ2=8.29, df=2, p < 0.05) as squash pollinators had higher species-specific visitation rates than non-squash pollinators (estimate=0.81, SE=0.28, z=2.86, p < 0.05). After removing BbBi, squash pollinator status no longer influenced total visitation (χ2=0.97, df=2, p > 0.1). Bee species origin (native or introduced), sampling window, cloud coverage, temperature, and wind-speed had no impacts on visitation frequency with or without BbBi.
Squash flower observations
Observed squash flowers were visited in 42.5% of the trials. The most common pollinators were squash specialists, the hoary squash bee (Xenoglossa (Eucera) pruinosa), which visited squash flowers 63.4% of the time. Bombus spp. (23.2%) and two-spotted longhorn bees (Melissodes bimaculatus; 8.5%) were also relatively frequent pollinators. The only other observed pollinators were recorded only for three visitations (green sweat bees; 3.7%), or just one vistiation (Apis mellifera; 1%). For these five morphotypes, activity (total floral interactions) in the native provisioning habitats varied drastically (Fig. 5a) and did not seem to correspond to observed squash pollination (Fig. 5b).
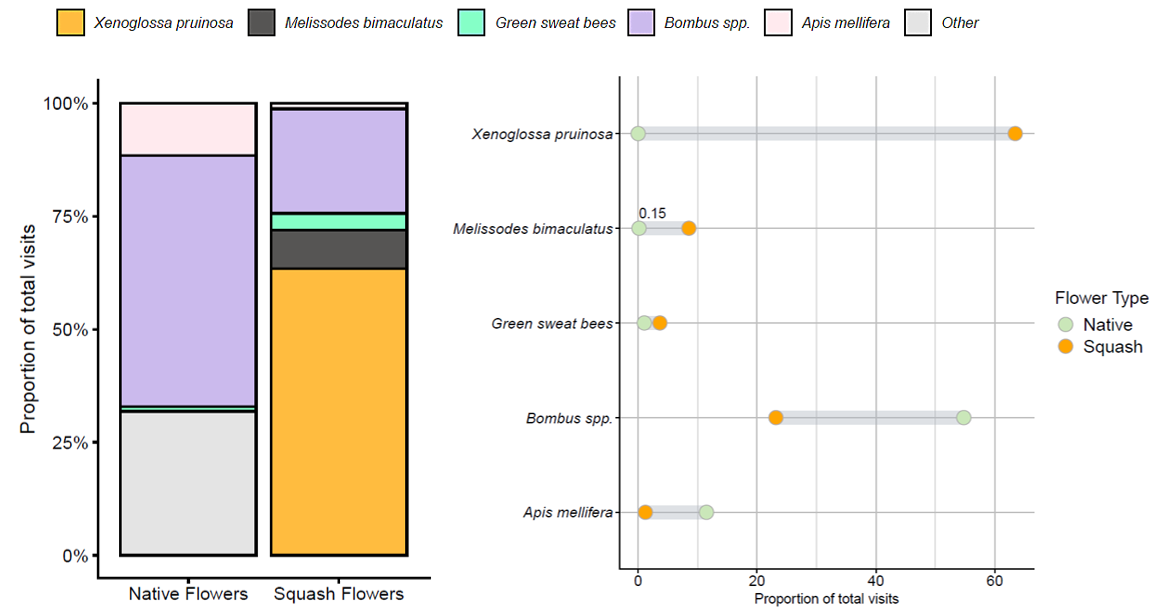
Figure 5. Proportion of total floral visits to native and squash flowers for each morphotype observed pollinating squash. Panel (a) stacked bar graph comparing floral visitors across flower type (native, squash), colors represent morphotype and correspond to the legend above. Panel (b) dumbbell plot comparing the proportions of each morphotype observed visiting the two flower types (native, squash), colors represent flower type and correspond to the legend to the right
Objective 2: Understand urban farmer perceptions and decision-making tools used for making pollinator management decisions.
In the 74 surveys included in analyses, grower age ranged from 25-75+, with 51% of the respondents 55 or older. Of the remaining respondents, 23% were ages 25-34. Years of agricultural experience also varied widely between 0 and 78, (19.4 ± 19.96, mean ± standard deviation). Gender and education level were heavily skewed towards women (87%) and at least some college experience (96%). The majority of survey respondents (72%) had a bachelor’s degree or some form of advanced degree. Similarly, percentage of overall income from farm was heavily skewed as the majority of growers (94%) made less than half of their incomes from their farms, and most growers (73%) reported none of their income came from their farm (Table 3).
When evaluating preferred sources of educational information from our limited survey options, the most popular were hard copy books and field guides. Conversations with colleagues/other farmers were the second most popular source of information of those listed in our survey and the most used conversational source. Online extension articles from universities and online non-profit organization resources were also popular, and both were used by more growers than their hard-copy counterparts (Table 2).
Pollinator management strategies
Implementation of the evaluated eight pollinator management strategies was influenced variously by our tested variables. Pollinator importance to growers (high vs. low) did not impact the incorporation of any of the management strategies (p > 0.1 for all models). Instead, grower decisions were influenced most by source of information, resource use and accessibility, perception, and motivation (Fig. 1). All four categories had significantly greater impacts on decision making than demographic variables (Fig. 1; perception: estimate = -0.14, SE = 0.03, t = -4.17, p = 0.002; resource use and accessibility: estimate = -0.12, SE = 0.03, t = -3.73, p = 0.006; motivation: estimate = -0.11, SE = 0.03, t = -3.4, p = 0.01; and source of information: estimate = -0.21, SE = 0.03, t = -6.44, p < 0.0001). Source of information was significantly greater than motivation (Fig. 1; estimate = 0.10, SE = 0.03, t = 3.0, p = 0.04) but not perception (Fig. 1; estimate = 0.07, SE = 0.03, t = 2.3, p = 0.18) or resource use and accessibility (Fig. 1; estimate = 0.09, SE = 0.03, t = 2.7, p = 0.07). There were also no differences between resource use and accessibility and perception (Fig. 1; estimate = -0.01, SE = 0.03, t = -0.4, p = 0.9) or motivation (Fig. 1; estimate = 0.01, SE = 0.03, t = -0.3, p = 0.99). The proportion of variables selected from each category in pollinator management implementation models further demonstrates the marginal impact of demographics.
Only 60% (3/5) of demographic variables were selected in pollinator management implementation models compared to 73% (8/11) for perception, 86% (6/7) for motivation, 88% (7/8) for resource use and accessibility, and 93% (14/15) for source of information. Further, source of information variables were relevant to the implementation of all eight management methods, while demographic variables were only relevant to four methods (Table S 2). Across these categories, 11 specific variables significantly altered management decisions for one or more methods.
Five out of the 11 surveyed variables that impacted grower decisions were related to source of educational information. Hard copy books and online extension articles both positively impacted implementation of two pollinator management strategies. Growers who used books were more likely to cover crop (estimate = 1.78, SE = 0.8, z = 2.2, p = 0.03) and maintain patches of exposed soil (estimate = 1.72, SE = 0.8, z = 2.1, p = 0.04), while those who used online extension articles were more likely to preserve unmanaged areas (estimate = 2.23, SE = 0.8, z = 2.6, p = 0.008) and use reduced tillage practices (estimate = 4.8, SE = 1.8, z = 2.7, p = 0.008). In contrast, growers who used hard copy extension materials were less likely to perform reduced tillage (estimate = -4.8, SE = 1.8, z = -2.7, p = 0.008). The same pattern was true for materials from non-profit organizations, as growers that used online sources were more likely to implement reduced tillage than those who did not (estimate = 3.11, SE = 1.36, z = 2.3, p = 0.02) while the use of hard copy materials made growers less likely to use this method (estimate = -2.51, SE = 1.19, z = 2.1, p = 0.04). The predictor variable category with the second greatest number of influential variables was resource use and accessibility.
Three factors, the use of educational resources to inform farm management practices, city policies, and manual labor, each impacted decision-making. Growers who used educational resources to inform management practices, rather than being neutral about these materials, were more likely to have preserved unmanaged areas (estimate = 3.15, SE = 1.32, z = 2.4, p = 0.04). Maintaining patches of exposed soil was more common with growers who did not feel limited by city policies and regulations compared to those who felt limited (estimate = 2.48, SE = 0.87, z = 2.86, p = 0.012). Lastly, growers who felt limited by manual labor were more likely to implement cover cropping than those who felt neutral about this (estimate = 1.80, SE = 0.74, z = 2.43, p = 0.04). One significant variable pertains to each of the remaining predictor variable categories, grower demographics, their motivation for urban farming, and their perceptions.
Both demographics and motivation impacted cover cropping. This method was implemented more by growers who made less than 50% of their income from their farm compared to those with no farm income (estimate = 3.04, SE = 1.08, z = 2.81, p = 0.04) and by those who agreed, rather than disagreed, with being motivated to farm by additional income (estimate = 2.2, SE = 0.9, z = 2.6, p = 0.03). Growers who perceived native bees as capable of providing sufficient crop pollination were more likely to reduce mowing than those who did not (estimate = 1.66, SE = 0.74, z = 2.2, p = 0.03)
Crop richness
Total crop richness was influenced by resource use and accessibility, and the source of educational information that growers were using. Resource use and accessibility, specifically limitations by city policies and regulations, had an influence on total crop richness (χ2 = 7.04, df = 2, p = 0.03). Growers who agreed that their ability to use pollinator management methods on their farm was limited by city policies and regulations had higher crop richness than growers who disagreed (estimate = 3.39, SE = 1.31, t = 2.59, p = 0.036). Multiple sources of educational information influenced crop richness, including hard copy extension articles (χ2 = 11.47, df = 1, p = 0.0007) and master gardening programs (χ2 = 4.82, df = 1, p = 0.03). Specifically, growers who did not use hard copy extension articles had higher crop richness than those who did (estimate = -3.37, SE = 0.96, t = -3.39, p = 0.001). Growers who participated in master gardening programs had higher crop richness than those who did not (estimate = 2.18, SE = 0.99, t = 2.2, p = 0.03). Grower demographics and perceptions did not influence total crop richness.
The number of highly pollinator-dependent crops grown was impacted by the source of educational information. Similarly to total crop richness, growers who did not use hard copy extension articles had a higher number of highly pollinator-dependent plants than those who did (estimate = -1.69, SE = 0.68, t = 2.48, p = 0.016). Growers who used information from master gardener programs had a higher number of highly pollinator-dependent crops than those who did not (estimate = 2.02, SE = 0.71, t = 2.86, p = 0.006). Grower demographics, motivation, and resource use and accessibility did not influence the total number of high-pollinator-dependent crops grown.
Resource use and accessibility and the source of educational information also had an impact on the number of low-pollinator-dependent crops grown. Limitations by city policies and regulations had an impact on the number of low-pollinator dependent crops grown (χ2 = 6.21, df = 2, p = 0.045). Growers who agreed that their ability to use pollinator management methods on their farm was limited by city policies and regulations had higher numbers of low-pollinator dependent crops than growers who disagreed (estimate = 1.44, SE = 0.59, t = 2.44, p = 0.046). Growers who did not use hard copy scientific literature (estimate = -1.93, SE = 0.55, t = 3.5, p =0.001) or hard copy extension articles (estimate = -1.2, SE = 0.42, t = 3.54, p = 0.006) had a higher number of low pollination dependent crops than those who did. Additionally, growers who communicated with colleagues or other farms about pollination management (estimate = 1.17, SE = 0.52, t = 2.2, p = 0.03) had a higher number of low-pollination-dependent crops than those who did not. Grower demographics, perceptions, and motivations did not impact the total number of low pollination-dependent crops grown.
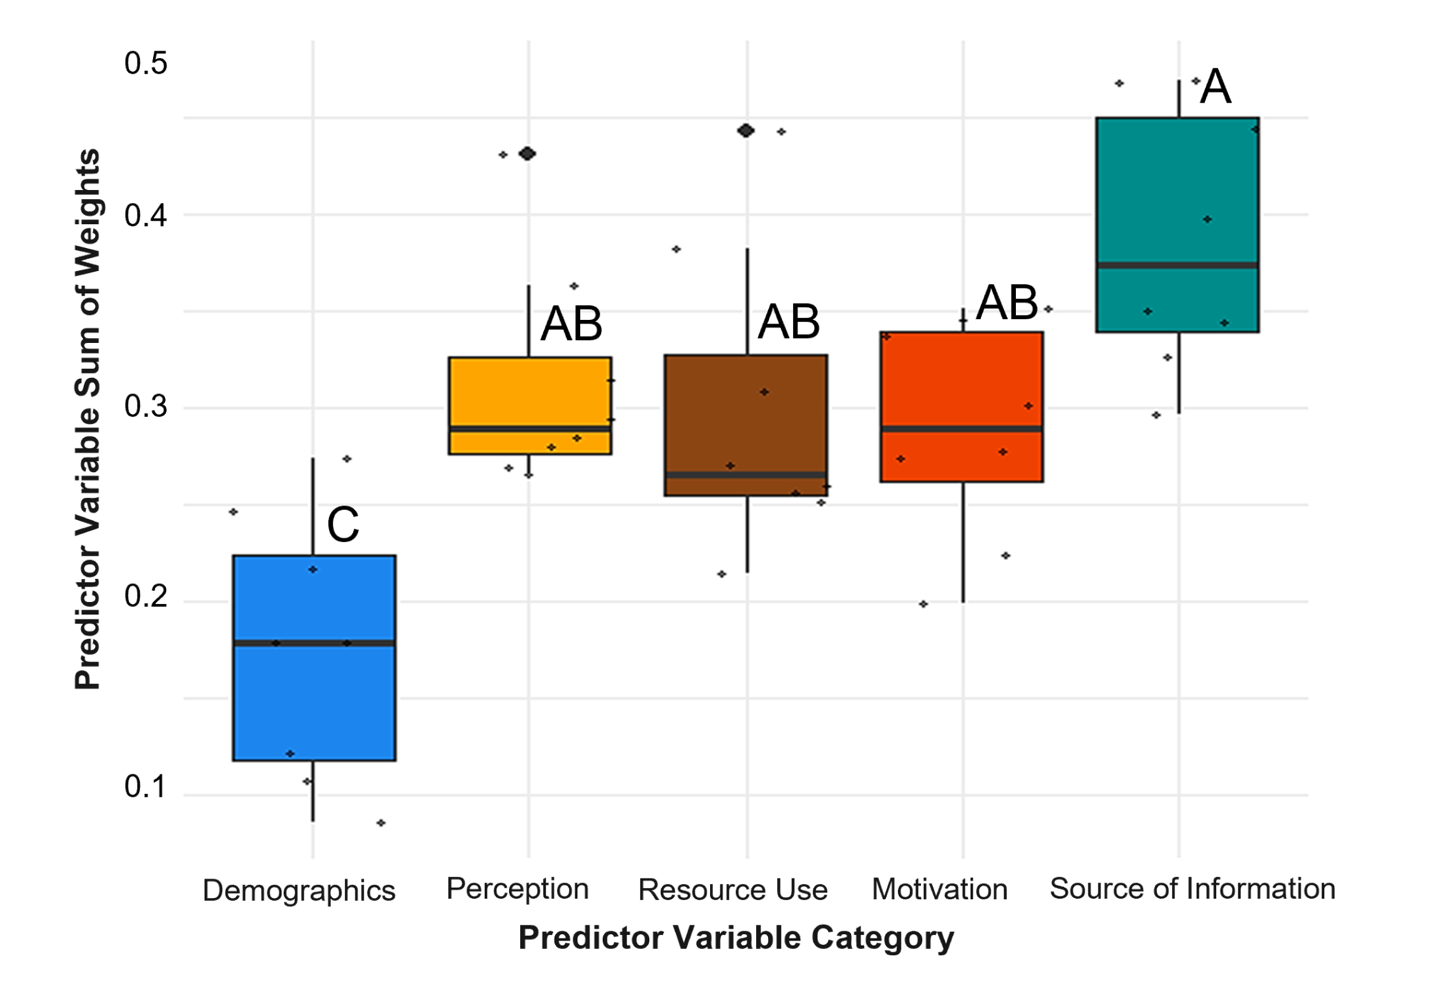
Figure 1: Box plot of the predictor variable sum of weights totaled for the eight pollinator management strategies across the five predictor variable categories (Demographics, Perception, Resource Use, Motivation, and Source of Information). The sum of weight values were extracted from the strategy implementation model averages (Demographics N=16, Perception N=1,024, Resource Use N=128, Motivation N=64, Source of Information N=16,384), pooled by pollinator management strategy, then frequency corrected by the number of variables within each category (Demographics N=5, Perception N=7, Resource use N=8, Motivation N=7, Source of Information N=15). Each dot represents the pooled sum of weights of all predictor variables within a category for a specific pollinator management strategy. Lower and upper hinges are the 25th and 75th percentiles, and the median across pollinator management strategies is represented by the black line in between.
Objective 1: Improve in-farm habitat for pollinators by utilizing native plant conservation strips on urban farms.
Our results highlight the importance of generalist crop pollinators, particularly B. bimaculatus and B. impatiens, in structuring floral visitation networks within urban native plant provisioning habitats. Importantly, both species are common and efficient squash pollinators that utilize provisioning habitats throughout the growing season, shifting among key floral resources including Penstemon digitalis in June, Monarda fistulosa in July, and Oligoneuron rigidum in August. These plant species also supported many other bees in the community, emphasizing their value for season-long pollinator conservation on urban farms. Although the provisioning habitats support abundant generalist pollinators like Apis mellifera and Bombus spp., other important squash-associated bees, including Xenoglossa (Eucera) pruinosa and Melissodes bimaculatus appear to benefit less from the provisioning habitats and may rely more on squash or other habitat features. Consequently, optimizing urban pollinator habitat for crop production may require more targeted plant selection to support a broader range of squash-pollinating bees. Overall, urban squash production systems may provide important opportunities to simultaneously support both food production and pollinator conservation.
Objective 2: Understand urban farmer perceptions and decision-making tools used for making pollinator management decisions.
Each management decision, including the eight pollinator management strategies and level of crop richness, was influenced differently by the various factors evaluated here. This suggests that the factors relevant to decision-making are context dependent. Our results reveal the decision-making paradigm that urban growers operate in, where their source of educational information, access to farm and educational resources, perception of pollinator conservation and crop pollination, and motivations for urban farming nonuniformly impact the various choices they face. Extension staff and other educators should strongly consider this when developing materials and programs intended to guide growers toward a desired outcome by addressing the most limiting factors on a case-by-case basis. This study reveals the importance of adequate and accessible resources and educational information to encourage the use of pollinator management strategies by urban growers. Enhancing urban grower awareness of the importance of the connection between insect pollinators and crop yield could improve long-term adoption of pollinator management practices to create more sustainable urban food systems.
Education
The Bee Urban Growers Project, a Sustainable Agriculture Research and Education initiative that has worked to conserve biodiversity, increase pollinator-dependent crop yield, strengthen communities, and connect them with educational materials for local food production. It was designed to address the unique challenges to pollinator management that urban growers face, including limited acreage and reduced proximity to natural habitat. To address these and other issues, we planted small-scale native wildflower habitat on farms then used them to research pollinators and build community. We did this with workshops and community science events, exposing youth and all ages to insects, the scientific process, and localized food systems. To reach diverse audiences and disseminate Extension materials we developed, we created a social media platform and collaborated with the MSU-Detroit Partnership for Learning and Innovation (DPFLI) to host free events. We also started a community science project for children and adults interested in learning more about urban crop pollinators. Here is a non-exhaustive list of our educational events:
- The BUG Project Orientation (participating grower education)
- South Lansing Urban Gardens kids (kids education)
- The BUG Project Field Day 2025 (grower and family education)
- The BUG Project 1st Advisory Board Meeting (participating grower education)
- Overwintering Webinar (grower and general public education)
- The BUG Project Advisory Board Meeting (participating grower education)
- Urban Bee Community Science Webinar (general public education)
- Introduction to bugs at Peckham (adults with disabilities education)
- Urban Bee Community Science Workshop (general public education)
- Butterfly garden planting at Forestview Elementary School (kids education)
- Birds and Bees Urban Farm Walk (university agriculture education)
- The BUG Project Field Day 2025 (grower and family education)
- On-farm Community Science Day 1 (grower education)
- On-farm Community Science Day 2 (grower education)
- Ann Arbor Farm & Garden Club Talk (grower education)
- Black Urban Growers Conference (From Bee City to Backyards & Beyond: Creating Habitat for Pollinators Everywhere) (grower education)
- Entomological Society of America Conference - The BUG Project talk (university agriculture education)
- Entomological Society of America Conference - social survey talk (university agriculture education)
- Floral strips for nocturnal moth pollination (general public education)
- Prime Time Nature Talk: Native bees in urban places (general public education)
- Bug Day at East Lansing Public Library (general public education)
- Healthy Habitats and Productive Pollinators conference (grower and general public education)
- Native bee habitat management for urban farms and gardens (grower education)
- It's a Bugs World (kids education)
Project Activities
Educational & Outreach Activities
Participation summary:
-Public outreach and tabling at the Garden Project Resource Center (x4): talking to the public and sharing educational resources and materials about the importance of wild pollinators for our food systems, sharing our research
-Public outreach and tabling at South Lansing Farmers Market: talking to the public and sharing educational resources and materials about the importance of wild pollinators for our food systems, sharing our research
-Children’s outreach at South Lansing Urban Garden: organized and led a kids “day in the life of an entomologist” activity, talked about the importance of wild pollinators for our food systems. Once for ages 5-8 and once for ages 9-13.
-Public outreach and tabling at Pumpkinfest: talking to the public and sharing educational resources and materials about the importance of wild pollinators for our food systems, sharing our research
-Tabling/exhibiting at National Urban Agriculture Conference: talking to farmers and agricultural professionals, sharing educational resources and materials about the importance of wild pollinators for our food systems, sharing our research, engaging and building a network with urban farmers
-Tabling/exhibiting/public outreach at Great Lakes Bioneers Conference: talking to the public and sharing educational resources and materials about the importance of wild pollinators for our food systems, sharing our research
-Tabling/exhibiting at Michigan Urban Agriculture Summit: engage with and provide educational resources to a network of urban farmers
-“Unexpected Visitors: Pollinator Community Diversity Across Pollination Syndromes”: presentation at the Wildflower Association of Michigan
-“Who’s in my Garden? Exploring Insect Pollinators in your Urban Garden!”: presentation at the Wildflower Association of Michigan
- The BUG Project Orientation (participating grower education)
- The BUG Project Field Day 2025 (grower and family education)
- The BUG Project 1st Advisory Board Meeting (participating grower education)
- Overwintering Webinar (grower and general public education)
- The BUG Project Advisory Board Meeting (participating grower education)
- Urban Bee Community Science Webinar (general public education)
- Introduction to bugs at Peckham (adults with disabilities education)
- Urban Bee Community Science Workshop (general public education)
- Butterfly garden planting at Forestview Elementary School (kids education)
- Birds and Bees Urban Farm Walk (university agriculture education)
- The BUG Project Field Day 2025 (grower and family education)
- On-farm Community Science Day 1 (grower education)
- On-farm Community Science Day 2 (grower education)
- Ann Arbor Farm & Garden Club Talk (grower education)
- Black Urban Growers Conference (From Bee City to Backyards & Beyond: Creating Habitat for Pollinators Everywhere) (grower education)
- Entomological Society of America Conference - The BUG Project talk (university agriculture education)
- Entomological Society of America Conference - social survey talk (university agriculture education)
- Floral strips for nocturnal moth pollination (general public education)
- Prime Time Nature Talk: Native bees in urban places (general public education)
- Bug Day at East Lansing Public Library (general public education)
- Healthy Habitats and Productive Pollinators conference (grower and general public education)
- Native bee habitat management for urban farms and gardens (grower education)
- It's a Bugs World (kids education)
Learning Outcomes
- Concepts of pollinators and crop pollination
- Maintaining pollinator plantings
- Community science and the scientific method
- Pollination biology
Project Outcomes
Pollination management
Maintenance of conservation plantings
Reducing pesticide use
The BUG Project is a North Central Region Sustainable Agriculture Research and Education (SARE) funded research grant dedicated to both pollinator conservation and supporting small-scale, urban farmers. We work with farms growing cucurbits (squash and pumpkins), which are popular, pollinator-dependent crops. This project started in 2023 and is ending in July 2026.
The primary objectives of the project:
- Improve pollinator habitat and pollination services in urban agricultural settings
- Provide farmers and community members with educational resources on accessible pollinator habitat management practices
To achieve these goals, we completed the following actions:
- In 2024, we planted native wildflower plantings on 9 partner farms throughout mid and southeast Michigan, consisting of 250 plants from 15 native plant species
- In 2024-2025, we surveyed urban farmers on their perceptions of pollinator management. We are currently analyzing this data and preparing a scientific article with these results- stay tuned
- In 2025, we surveyed native bee communities in these plantings and nearby cucurbit planting
- In 2024 and 2025, we hosted annual pollination management field days to educate growers in the community
- In 2025, we hosted 2 on-farm community science workshops for farmers to learn about researching crop pollinator
- In 2025, we started a community science project through iNaturalist surveying the bees of the Great Lakes Region
- In 2025, we published the ‘Native Bee Habitat Management of Urban Farms in the Great Lakes Region’ field pocket guide
- In 2026, we distributed 370 pocket guides to urban farmers and land managers. We have 200 remaining guides that are set aside to be distributed by MSU Extension Educators for Beginning, Urban Sustainable & Small-Scale Farmers, Consumer Horticulture Educators, Cultural Heritage Centers, and Invasive Species Coordinators
- Throughout the project, we attended numerous outreach events and presented to groups on the importance of on-farm pollination management
- In 2026, we will be publishing a peer-reviewed manuscript highlighting the benefits of planting nearby pollinator habitat for squash-pollinating bees on urban farms-stay tuned!
By providing small-scale farmers and community members with educational resources related to pollinator management, we enhanced pollinator habitat implementation and management in urban agricultural systems, while also improving food security in underserved communities.
We have no recommendations at this time.