Final report for LNE19-392R
Project Information
Problem
Honey bee colonies experience dwindling, inexplicable queen turnover events, and colony collapses during pollination. Preliminary experiments suggest pesticide contaminated pollen underlies these issues. Colonies fed fungicide contaminated pollen experienced excessive queen events and engaged in behavior that would confound typical management by experienced beekeepers. The pesticide exposed colonies also experienced reduced honey stores, nutritional stress and cannibalized their young compared to controls. The aim of this study was to further investigate the role that fungicides and insecticides have on queen, brood and nutritional status, and to determine whether using the novel approach of ameliorating pesticide exposure through pollen trapping and supplemental feeding may improve colony health during pollination events.
Objectives (Revised)
Our overall objective is to improve honey bee health during pollination. Through the use of multifactorial experimental designs, we examined:
- the effects of feeding colonies pollen supplements containing either fungicides, insecticides, or both on queen events and brood cannibalism . This experiment was completed in 2020. The field study compared queen, brood and nutritional status of 96 mini-colonies fed either: 1) pollen substitute; 2) pollen substitute amended with fungicides; 3) pollen substitute amended with insecticides; 4) pollen substitute amended with both fungicides and insecticides
- whether trapping pollen (reducing immediate pesticide exposure) and/or supplemental pollen feeding (improving nutrition) to reduce pesticide exposure during pollination events improved colony health. The revised field study used standardized colony assessments to test whether pollen trapping and pollen supplements reduced honey bee colony health risks associated with pesticide exposure for a commercial honey bee operation pollinating 3 separate Maryland fields expected to vary in the pesticide risk they pose to honey bees (high-corn only; medium-mixed corn/soy; low-mixed vegetable row crops) and compared colony health metrics for 3 treatment groups: 1) pollen trapped with no supplemental feed; 2) pollen trapped with supplemental feed; 3) no pollen trapped with supplemental feed) and a control (no pollen trapped and no feed) to ascertain which provides the greatest benefit and colony performance.
Research Findings and Conclusions
- Experiment one - confirmed previous preliminary studies and showed that both fungicide and insecticide exposure had a significant impact on queen events. However, the timing of these events varied between the two pesticide classes.
- Experiment 2 - Total pesticide diversity ranged from 4-9 in a single composite sample. All four pesticide classes were recovered: Fungicide (4), Herbicide (2), Insecticides (4) and Varroacides (1). The only Varroacide detected is the active compound in Amitraz, and in all case concentrations were Trace only. Interestingly, the site that showed the highest pesticide diversity had the lowest total pesticide concentration and HQ values, and vice versa. Three samples had 0 total HQ values, while the other 3 had total HQ values that indicate increased colony risk. This pattern was driven entirely by the pesticide compound Phenothrin, the systemic pyrethroid insecticide that was found in all 3 samples with high total HQ values. This compound was only found in the Corn and Corn/Soy samples.
- While differences were detected we did not see statistically significant differences either between treatments with yards, or between yards with respect to a feeding effect on colony health metrics. Increasing study time, sample size and repeating the study in other crops would continue to broaden our knowledge regarding the longer-term impacts of pesticide exposure.
Our objective is to improve honey bee health during pollination. Our novel approach ameliorates pesticide exposure and potentially increases pollen foraging on target crops, ensuring a steady pollination supply for blueberry and cranberry growers. This novel approach provides beekeepers with inexpensive protection and if “precision pollination” training is effective, significantly improves pollination of target crops, an important innovation as bees notoriously stray from blueberry and cranberry fields to more appealing resources within flight range.
Commercial beekeepers, the last nomadic farmers in the US, provide pollination services to over 230,00 acres of pollination dependent crops in the Northeast.(1) Growers pay commercial beekeepers $16.45 million to pollinate that acreage.(1) Pollination fees have escalated due to declines in colony health and beekeeper concern over pesticide exposure. Certain crops, such as blueberries (32,500 acres) and cranberries (29,500 acres), pose a significant risk of pesticide exposure for honey bees and are linked to imminent colony loss.(2)
Commercial beekeepers report pesticide exposure as the second most common reason for colony losses, right after other diseases and viruses,(3) which may be due to interacting factors like poor nutrition, parasite pressure, and pesticide exposure. According to the NJ State chief bee inspector Tim Schuler (project advisory board; see letter), some beekeepers have stopped pollinating blueberries, because colonies go queenless, stop rearing young, and break out in unexplained diseases.(4) When colonies go queenless or broodless, they significantly reduce nectar and pollen foraging,(5) negatively impacting crop pollination. Preventing pesticide exposure, improving colony health, and ensuring adequate nutrition during pollination contracts is critical to the agricultural industry.
Preliminary results demonstrate that bees exposed to contaminated pollen show increased queen events, brood rearing disruptions and signs of nutritional stress. We propose to test if removing contaminated pollen via pollen traps and supplementing colonies with food resources will reduce queen events and nutritional stress, leading to healthier colonies.
While many beekeepers complain of colony losses during and after providing pollination services for a number of crops, a few beekeepers fulfill pollination contracts without health issues arising. These successful beekeepers report feeding colonies during (blueberry) pollination to minimize exposure, but such anecdotal reports require substantiation. Research has shown that pollen from a number of food crops that honey bees pollinate is nutritionally poor, that colonies are exposed to high levels of fungicides and low levels of insecticides during these pollination events, and that colonies exposed to these conditions often develop brood disease symptoms that resemble European Foulbrood.
Our project investigated if we can confirm reports through controlled experiments whether trapping pollen (reducing immediate pesticide exposure) and/or feeding supplemental pollen (improving nutrition) improves colony health and pollination. If confirmed thisoffering beekeepers a simple and practical solution they can easily implement if effective. Through the use of multifactorial experimental designs, we examined
Cooperators
- (Researcher)
- (Researcher)
Research
Hypothesis 1: Pollen trapping reduces colony exposure to pesticides during pollination.
Hypothesis 2: Feeding pollen and nectar substitutes during pollination improves colony nutrition and resilience, reducing colony losses.
Hypothesis 3: Precision pollination—training bees to crop odors prior to pollination—can enhance foraging on target crops.
Hypothesis 4: Fungicide exposure increases queen events, while general pesticide exposure induces brood cannibalism, and nutritional stress.
Project Revisions
Due to PI Traynor accepting another position, Dr. vanEngelsdorp assumed the role of PI.As a result a number of changes were made to the hypotheses and field study that were approved by NE SARE March, 2020. The following modification were made to Experiment 2:
- The experiment 2 field study was conducted in field crop plots in MD rather than blueberry fields (Hypotheses 1 & 2)
- Nectar substitutes were not included in experiment 2 (Hypothesis 2)
- The precision pollen project (Hypothesis 3) was not conducted
Revised Hypotheses
Hypothesis 1. Pollen trapping and feeding pollen substitutes during pollination reduces colony exposure to pesticides and improves colony nutrition, resulting in better health outcomes than colonies without trapping and feeding
Hypothesis 2. Positive effects of feeding pollen substitutes during pollination is positively associated with the degree of pesticide exposure
Hypothesis 3. Fungicide exposure increases queen events, while general pesticide exposure induces brood cannibalism
Experiment 1 - Pesticide Feeding Trial
We conducted a field trial using 96 mini colonies that contained 4 mini frames used in queen rearing over the summer to test Hypothesis 4: Fungicide exposure increases queen events, while general pesticide exposure induces brood cannibalism, and nutritional stress. We had four different treatment groups, mixing in field relevant pesticide control products into the pollen patties we fed the colonies. The four treatment groups were:
- Control
- Fungicides
- Insecticides
- Both
Contaminated pollen was fed to the colonies and replaced weekly for 4 weeks. We continued to monitor the colonies for an additional two weeks post treatment. We inspected the colonies weekly to determine if there were any queen events (swarm cells, missing queen, emergency cells). We also assessed general colony strength 3 weeks into the trial and rated it on a score of 1 to 5.
Experiment 2 - Pollen Trapping & Supplementation during pollination
A cohort of 48 colonies was distributed over 3 agricultural yards: 1) corn; 2) corn/soy; and 3) mixed vegetables, all of which are located in Maryland (Clarksville, UM, Dead body; 16 colonies/yard), were monitored between 30 July and 20 August 2020. In each yard trial colonies were assigned using a stratified random assignment strategy to one of four treatment groups:
- Control: no pollen trapping, no feeding (12 colonies)
- Pollen trapping and supplemental feeding (12 colonies)
- Pollen trapping and no supplemental feeding (12 colonies)
- No pollen trapping, supplemental feeding (12 colonies)
Pollen supplementation (Bee-Pro brand) was provided continuously during this experiment. A 2 lb supplement patty was applied each week during the duration of the study. At the end of each week, any unconsumed patties were removed, weighed and a new patty was put in place. All colonies had pollen traps installed but only the colonies assigned trapping had the entrance engaged.
Pollen Pesticide Sampling Protocol - Pollen was collected every 3 days and weighed. At the end of the experiment, pollen trapped from the Feed-/Trap+ group from each yard (3) and Feed+/Trap+ group from each yard (3) was composited, homogenized and sent to the USDA/AMS lab for pesticide analysis.
To evaluate pollen pesticide pressure exerted upon colonies at the three different locations during the course of the study, the pollen samples submitted for pesticide analysis were collected from the pollen traps placed on the colonies during the study. At each of the three sites, two samples were sent for analysis: one composite sample from the Feed+/Trap+ treatment group and one composite sample from the Feed+/Trap- Group.
While we expected there to be differences among yards in pesticide pressure due to prior knowledge of land use history and the type of crops produced at each site (Locations: CV=Corn only, UM=Corn/Soy and DB=Mixed Vegetable Row Crops), composite samples between treatments within a location should be similar, due to the fact that pollen is being sampled from traps and not the bee bread stores within the colony and therefore a representation of the pesticides found in the local pollen resources available during the time of the study. Thus, preexisting differences in pollen stores and supplemental feeding ought not to have influenced trapped pollen pesticide results.
Colony health inspections (queen status, varroa and nosema sampling, overt disease inspection, etc.) were conducted twice - at the beginning and end of the project (day 21). No colonies received any additional protein or carbohydrate supplementation and no colonies were equalized or divided during the duration of the trial.
We calculated five pesticide risk measures and correlated these with colony morbidity:
-
pesticide prevalence (PP): the percentage of samples positive for any pesticide residue
-
pesticide diversity (PD): the number of different pesticide residues
-
pesticide concentration (in ppb) (PC): the summed concentration of all pesticide residues
-
HQ score (HQ): an estimate of an adult worker bee’s lifetime consumption risk (pesticide residue in ppb /respective LD50 in μg/bee)
We also summarized exposure patterns by their classification (e.g. fungicides, herbicides, insecticides, and Varroacides) and explored potential relationships between these groups and colony health metrics, and whether pollen trapping and/or supplemental feeding may alter those health outcomes.
Colony Health Metrics Analyzed - The colony-level health metrics measured in this study were:
- Colony mortality (if any, at each visit)
- Colony population size (frames of bees – FOB) only on visits 1 and 8
- Brood pattern (qualitative ranking from 1-5) only on visits 1 and 8
- Food stores only on visits 1 and 8
- Queen status only on visits 1 and 8
- Overt bee disease signs (presence/absence of Chalkbrood, sac brood, European foulbrood, and American foulbrood) only on visits 1 and 8
- Varroa load (mites/100 bees)(lab assessment) only on visits 1 and 8
- Nosema spores infestation (million spores/bee) only on visits 1 and 8
Experiment 1 - Pesticide Feeding Trial
Results showed a significant impact of both fungicides and insecticides on queen events, though the timing differed between these two treatment groups. This experiment confirmed preliminary data from previous research that showed similar effects of fungicides on queen events.
Experiment 2 - Pollen Trapping & Supplementation during pollination
Queen status and Colony mortality - There was no effect of treatment on queen status or colony mortality. Two colonies became queenless (one Feed+/Trap+ and one Feed-/Trap- from two separate apiaries) and one colony died (Feed-/Trap+) over the course of the study. The dead colony was removed from the dataset prior to analysis.
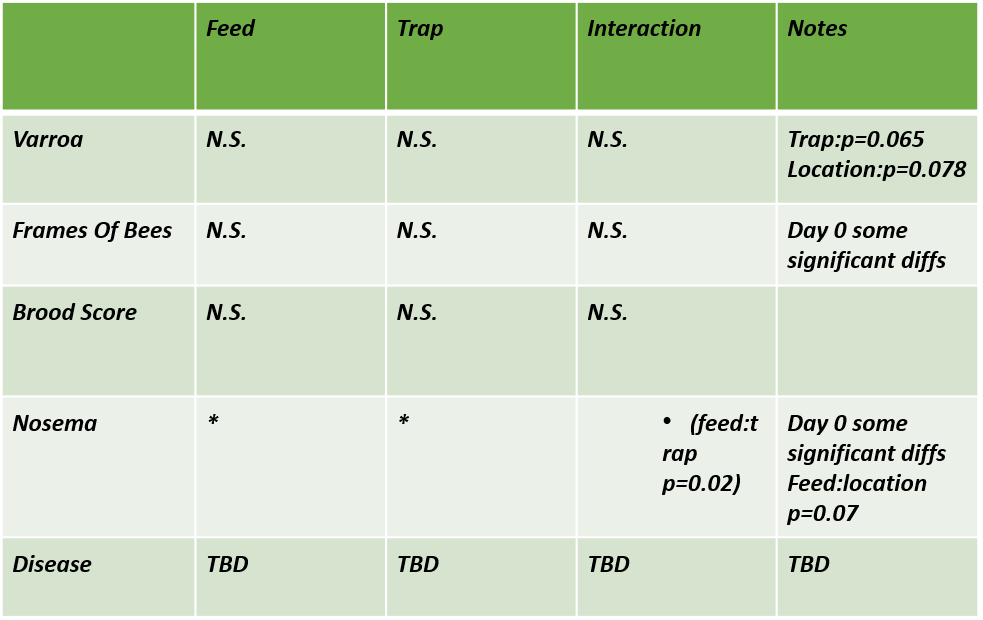
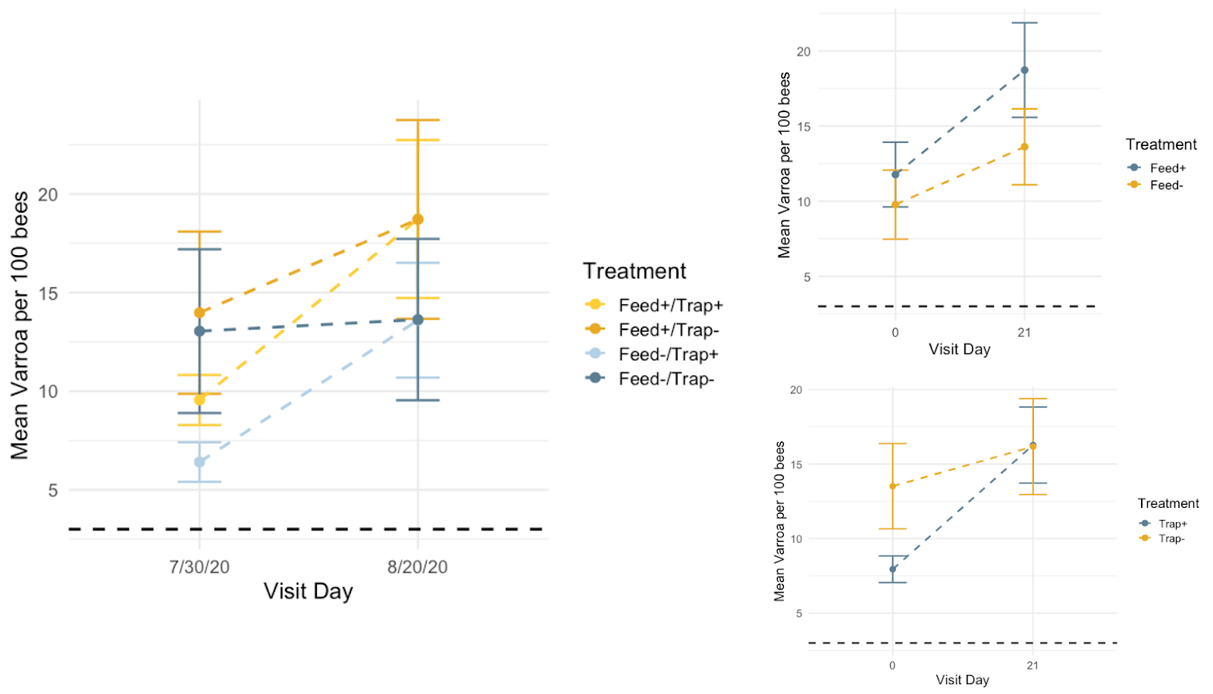
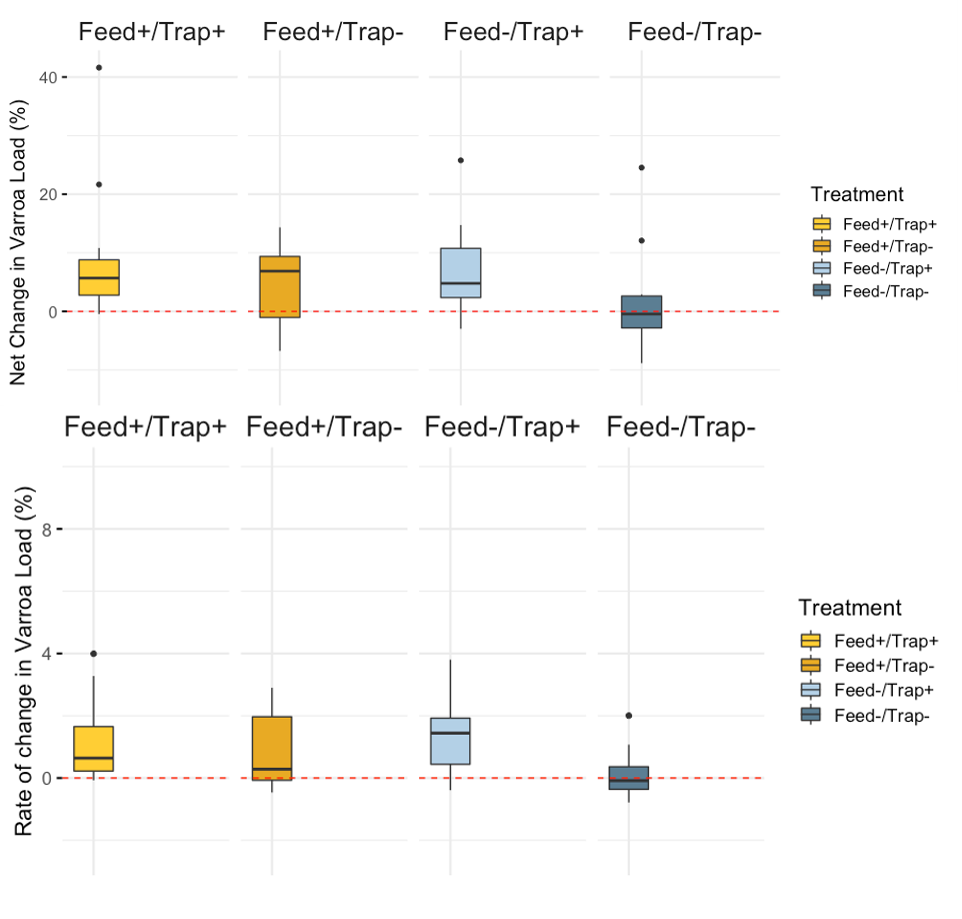
Varroa - Overall, mean Varroa per 100 bees increased from day 0 to day 21 of the study (day 0 mean = 10.79, day 21 mean = 16.22). This result is consistent across treatments (See Figures 1a-c), with the negative control colonies exhibiting the lowest net change in mean Varroa load (Figures 2a,b). However, there are no statistically significant differences among treatments in either the net change or the rate of change of mean Varroa per 100 bees (Figures 2a,b; Table 1).
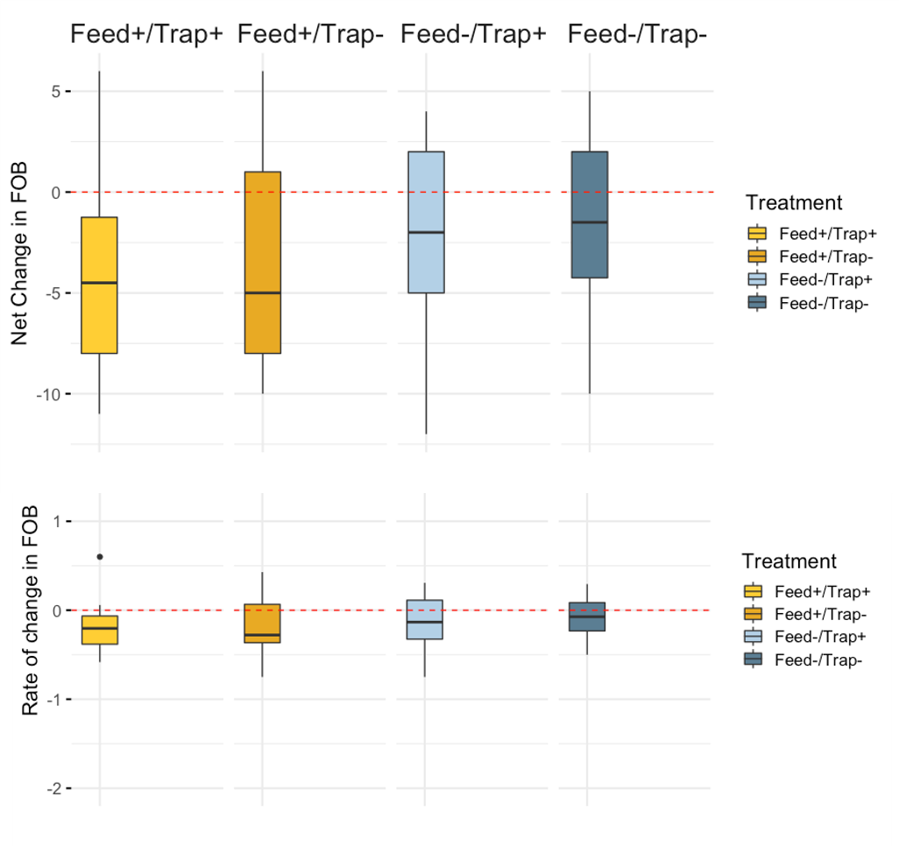
Colony Size (Frames of Bees) - Overall, mean colony size measured as frames of bees increased from day 0 to day 21 of the study (day 0 mean = 10.79, day 21 mean = 16.22). As with Varroa and brood pattern, no statistical differences were observed among treatments in net and rate of change of brood pattern (Figure 3a,b; Table 1).
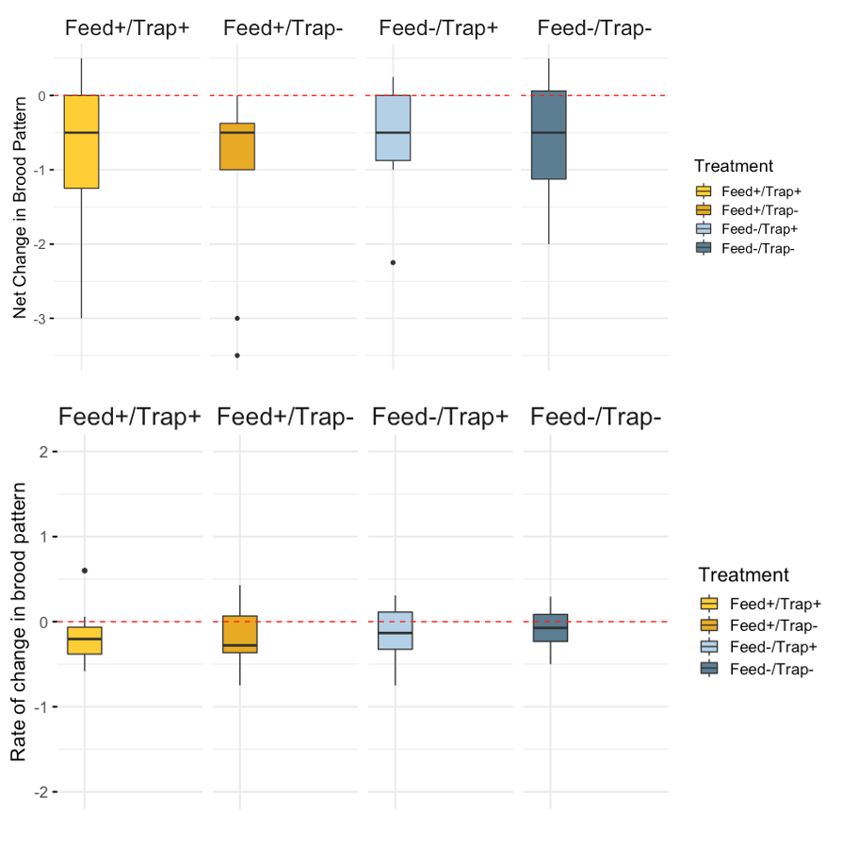
Brood Pattern - Mean brood pattern quality declined over time (mean 0 = 3.53, day 21 mean = 2.80); again no significant treatment differences were detected (table 1).
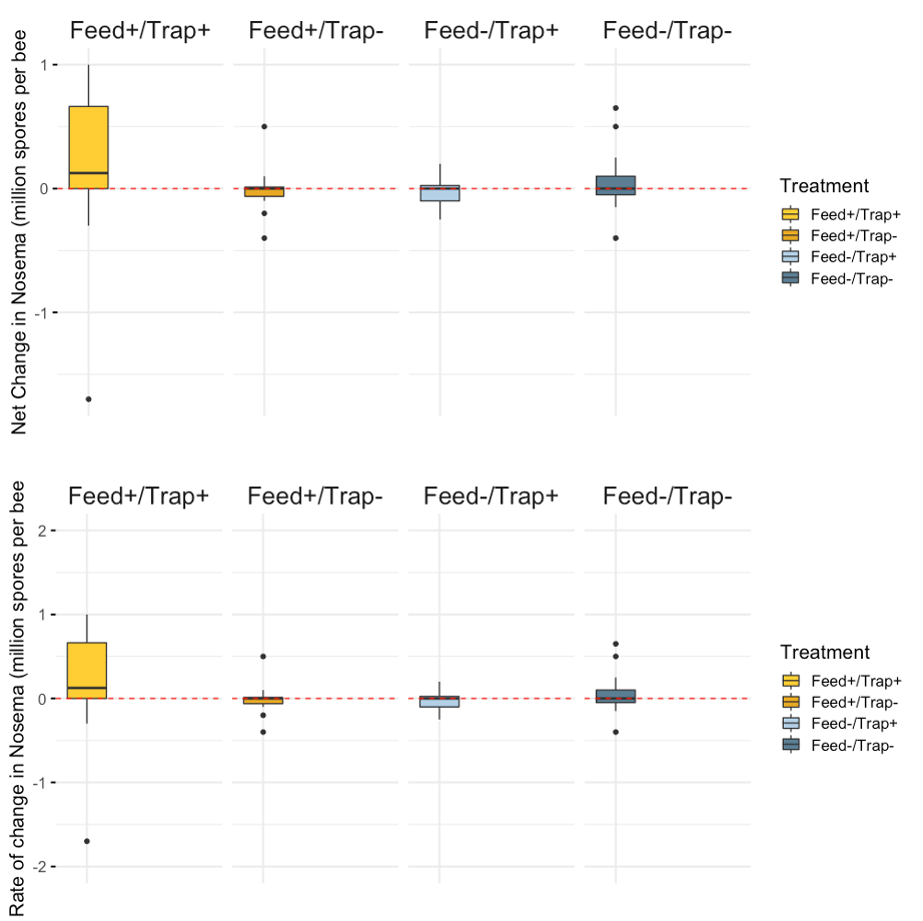
Nosema - Mean Nosema load (reported as millions of spores per bee;) increased over the course of the study (mean day 0 = 0.11, day 21 mean = 0.15). Significant differences were not detected among treatments; however, model results indicated there may be some significant differences among treatment groups at day 0 with regard to Nosema load and needs to be further evaluated.
Pesticides
Pollen collected from traps during the study were sent to the USDA AMS laboratory for analysis. Samples were screened for the presence and concentration of 192 pesticides. One composite sample of trapped pollen from Feed+/Trap+ colonies and one from Feed+/Trap- colonies in each of the three yards were analyzed (3 yards x 2 composite samples/yard = 6 samples). Samples were screened for 192 agriculturally relevant pesticides. The number of pesticides detected, pesticide concentration (ppb), identity, diversity and overall hazard quotient (HQ) were calculated for each sample. HQ, pesticide category and Mode of action analyses were conducted using the Bee Informed Partnership pesticide analysis platform.
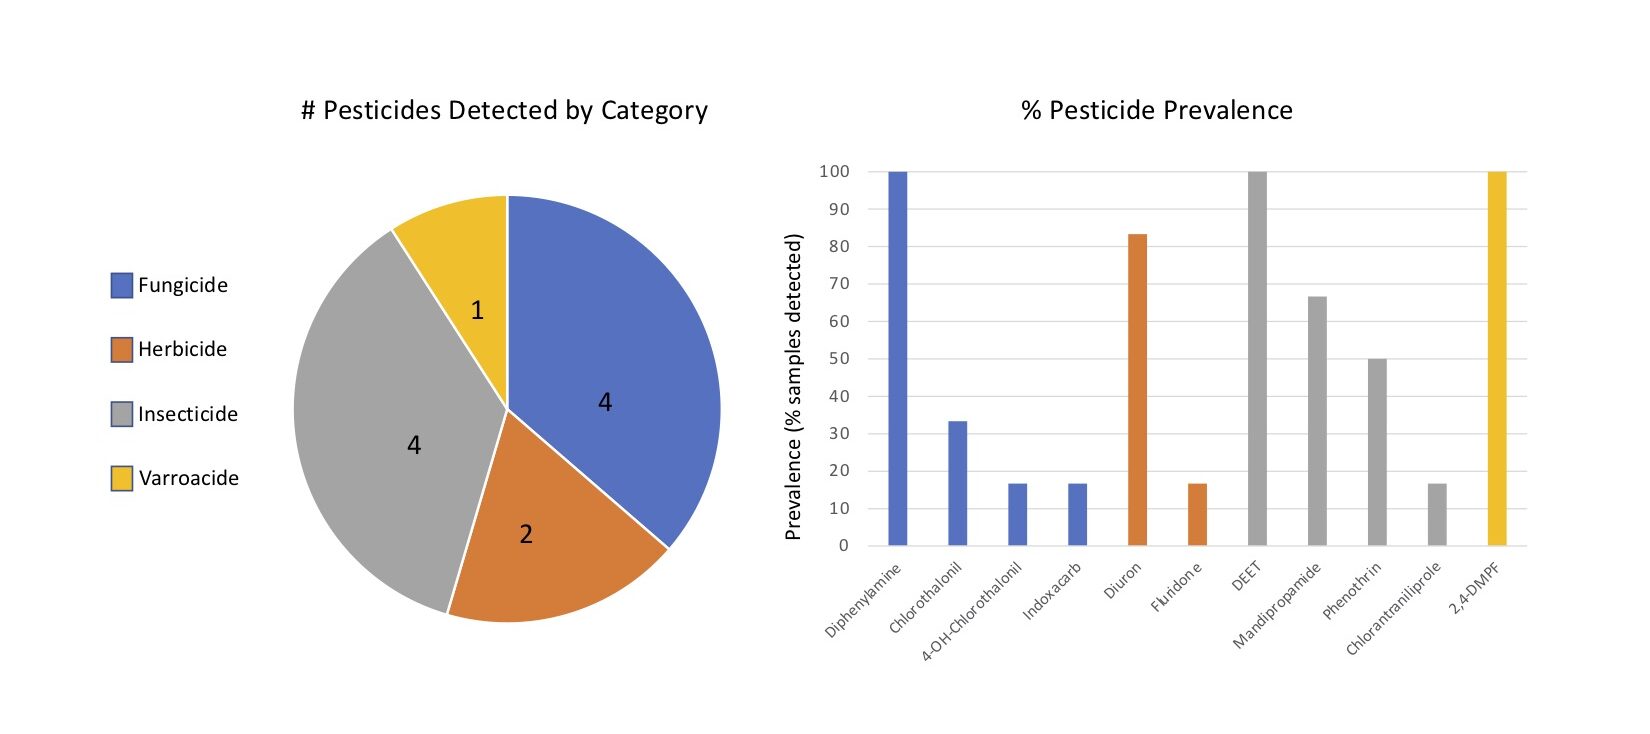
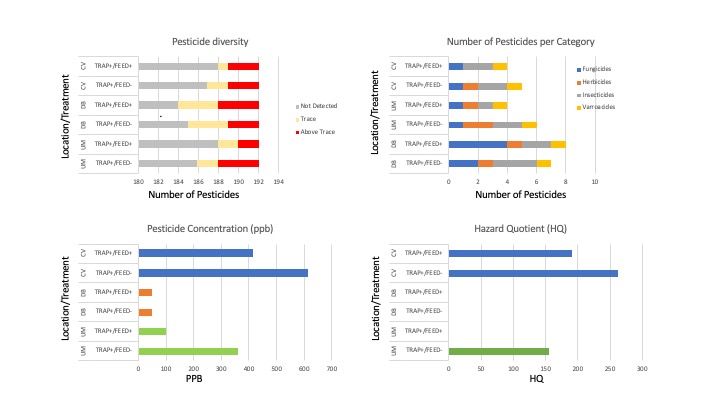
Pesticides detected - Eleven unique pesticides were detected in the six composite samples, collectively. The pesticides detected were 2,4-DMPF (a.k.a. Amitraz), Chlorantraniliprole, 4-OH Chlorothalonil, Chlorothalonil, DEET, Diphenylamine, Diuron, Fluridone, Indoxacarb, Mandipropamide and Phenothrin, falling into one of four categories: Fungicides, Herbicides, Insecticides and Varroacides. Fungicides and insecticides were the most abundant pesticide categories overall (4 compounds detected in each category), followed by herbicides (2) and Varroacides (1) (Figures 6a).
Of the eleven pesticides detected, only four compounds were detected at concentrations above trace: Chlorothalonil, DEET, Diphenylamine and Phenothrin, with DEET (Insecticide) and Diphenylamine (Fungicide) compounds having been detected above trace concentrations in 100% of the samples (Figure 6b, 7). 2,4-DMPF (Varroacide) was also detected in 100% of the samples, but only at trace levels (Figure 7).

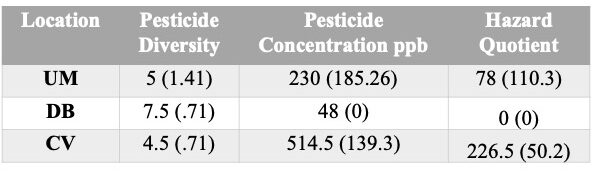
Pesticide variability within and among locations - Colonies in this study were placed in one of three locations, each with differing crop composition: 1) ; DB=Mixed Vegetable Row Crops; 2) UM=Corn/Soy; 3) CV=Corn only. Results are summarized in table 2.
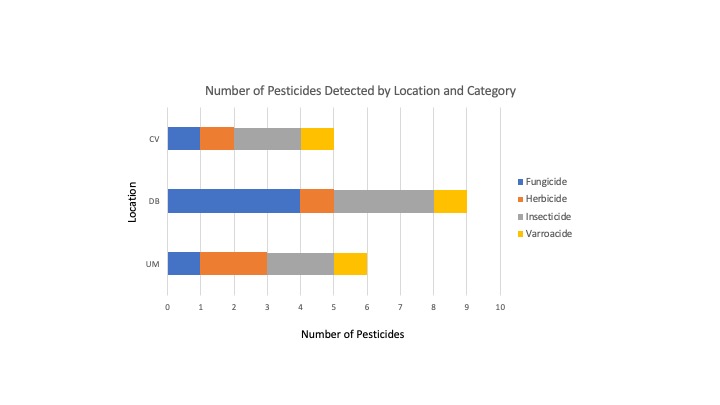
- Pesticide Diversity - The DB location had the greatest number of unique pesticides detected (9), followed by UM with 6 unique compounds detected and 5 found in the CV samples (Figure 8).
- Pesticide Category Distribution - DB had 4 fungicides, 3 insecticides 1 herbicide and 1 insecticide; UM had only 1 fungicide, 2 herbicides, 2 insecticides and 1 Varroacide; CV had 1 Fungicide, 1 Herbicide, 2 Insecticides and 1 Varroacide (Figures 8,9b).
- Pesticide Concentration - Similarly, the locations also ranked in the same order for average number of pesticides detected above trace as they did for pesticide diversity a well (average #pesticides detected above trace: DB=3.5, UM=2.5, CV=2 (Figure 9a).
- Hazard Quotient (HQ). Three of the 6 composite pesticide samples had Total HQ levels that were in the elevated risk category: CV Feed+/Trap+=262; CV Feed-/Trap+ = 191, and UM Feed-/Trap+=156 (Figure 9d, Table 2). While all samples did have at least 1 pesticide above trace levels, overall HQ levels were 0 for the other 3 samples. The major contributor to the elevated HQ levels in all 3 samples is the compound Phenothrin. While 2,4-DMPF and DEET were prevalent in all samples, they were whithin accepted concentrations. However, in the 3 samples with HQ>0, all had high concentrations of Phenothrin. Phenothrin is a systemic pyrethroid insecticide.
Effects of Pesticides on Colony Health Metrics - To ultimately compare treatment differences within locations, we first determined whether the pesticide data were or were not significantly different within locations, indicating that the colonies are experiencing similar incoming pollen pesticide pressure. To accomplish this, we first performed the Fligner test and Bartlett test to determine variance homogeneity and normality, respectively. We then performed a one-way ANOVA to compare composite sample means between locations for the Pesticide Diversity, Concentration and HQ.
Fligner test results were not significant for any data, though Bartlett results indicated the data are not normal for all samples. One-way ANOVA results indicated that there is no statistically significant differences in pesticide diversity, HQ, or concentrations within locations. Samples were also not statistically significant for any factor between locations, likely due to the low sample size (Diversity Fval=5.167, p=.107; HQ Fval=5.408, p=.101; Concentration: Fval=6.174; p=0.068).
While there are differences in mean frames of bees and frames of brood; however, these differences are not statistically significant. Further, CV, the site with the highest HQ values overall, actually showed mean values that were opposite in directionality than those from DB or UM, who both showed a higher mean value in Feed+/Trap+ colonies than in Feed-/Trap colonies, though again, these are just trends and not statistically significant.
Experiment 1 - Pesticide Feeding Trial
In the feeding experiments, our Results showed a significant impact of both fungicides and insecticides on queen events, though the timing differed between these two treatment groups. This experiment confirmed preliminary data from previous research that showed similar effects of fungicides on queen events. These data indicate that additional studies should still be pursued to further investigate the role of pesticides, and the relative importance of the specific classes of pesticides on colony health and survival in a real world setting.
Experiment 2 - Pollen Trapping & Supplementation during pollination
Due to the project revision, we were unable to perform field experiments in blueberry fields. Instead, we identified field sites in Corn only, Corn/Soy, and Mixed Vegetable Row Crops, expecting to see variation in pesticide data among sites. Locations did differ in Pesticide analyses, though these differences were also not statistically significant.
Total pesticide diversity ranged from 4-9 in a single composite sample. All four pesticide classes were recovered: Fungicide (4), Herbicide (2), Insecticides (4) and Varroacides (1). The only Varroacide detected is the active compound in Amitraz, and in all case concentrations were Trace only. Interestingly, the site that showed the highest pesticide diversity had the lowest total pesticide concentration and HQ values, and vice versa. Three samples had 0 total HQ values, while the other 3 had total HQ values that indicate increased colony risk. This pattern was driven entirely by the pesticide compound Phenothrin, the systemic pyrethroid insecticide that was found in all 3 samples with high total HQ values. This compound was only found in the Corn and Corn/Soy samples.
Treatment effects - We did not see any statistical significant differences between the Net change of Varroa, Nosema, FOBs, or brood pattern between treatments.
Overt disease symptoms - No significant differences were detected between treatments.
Survival rates - Due to the limitations of this experiment, colonies were not able to be maintained over winter to track longer-term survival and other colony health metrics.
In summary, laboratory experimental data provided additional evidence that pesticides, both fungicides and insecticides, can have a negative impact on honey bee queen health and survival. In this study, the largest contributor to overall pesticide exposure was to the insecticide Phenothrin, though additional pesticides were detected above trace levels in trapped pollen samples. Future studies that extend over a longer period of time, collect additional seasonal and survival data with increased pesticide sample sizes would be worthwhile to further examine this question. It also provides useful information regarding current pesticide application regimes both related to time of year and crop type would also provide beekeepers with invaluable information regarding whether time and cost associated with supplemental feeding and trapping contaminated pollen is justified and under what circumstances may it have the greatest positive effect colony health.
Education & outreach activities and participation summary
Educational activities:
Participation summary:
One manusript was published in 2021: Traynor et al (2021) Pesticides in pollen, Proof
Traynor, K.S., Tosi, S., Rennich, K., Steinhauer, N., Forsgren, E., Rose,
R., Kunkel, G., Madella, S., Lopez, D., Eversole, H., Fahey, R., Pettis, J., Evans, J.D., Dennis vanEngelsdorp, Pesticides in Honey Bee Colonies: establishing a baseline for real world exposure over seven years in the USA, Environmental Pollution, https://doi.org/10.1016/j.envpol.2021.116566.
One webinar was given 4 February 2021 by Dr. vanEngelsdorp and Dr. Traynor entitled: "Pesticide exposure in survey sampled colonies". This included discussion of this project's research and was an invited presentation from APHIS sponsors Anne Lebrun and Josie Ryan, and was presented to the Apiary Inspectors of America, APHIS and the Bee Informed Partnership Field and Research Staff.
One online presentation was given by Zachary Lamas at the 2021 American Bee Research Council annual meeting entitled: "Rearing bees in the laboratory: A new window into the bee world". This covered results from Experiment 1 of this Project
Due to the delay in obtaining pesticide data from the laboratory because of COVID-19, additional activities are still planned but have not yet been executed. These include:
- Blog presenting results on the Bee Informed Partnership and UMD Bee Research Lab websites
- One-page brochure highlighting major findings and results will be created and published on our website
- Journal articles will be published summarizing the research results in either American Bee Journal or Bee Culture.
- Additional presentations to local, national and online audiences will be conducted.
Learning Outcomes
There is still a great deal of information that is not known regarding the impacts of pesticides on honey bees. The webinar presented earlier in the year to a number of honey bee educators and outreach specialists received great feedback regarding interest in the work. Due to the many challenges associated with receiving final project results and the cancellation of opportunities that would otherwise provide opportunities to further share the results from this study, we look forward to continuing educational and outreach efforts related to this work for the remainder of 2021.
Project Outcomes
1 manuscript has been published as a result of this grant:
Kirsten S. Traynor, Simone Tosi, Karen Rennich, Nathalie Steinhauer, Eva Forsgren, Robyn Rose, Grace Kunkel, Shayne Madella, Dawn Lopez, Heather Eversole, Rachel Fahey, Jeffery Pettis, Jay D. Evans, Dennis vanEngelsdorp. "Pesticides in Honey Bee Colonies: establishing a baseline for real world exposure over seven years in the USA". Environmental Pollution. https://doi.org/10.1016/j.envpol.2021.116566
One webinar was given 4 February 2021 by Dr. vanEngelsdorp and Dr. Traynor entitled: "Pesticide exposure in survey sampled colonies". This included discussion of this project's research and was an invited presentation from APHIS sponsors Anne Lebrun and Josie Ryan, and was presented to the Apiary Inspectors of America, APHIS and the Bee Informed Partnership Field and Research Staff.
One online presentation was given by Zachary Lamas at the 2021 American Bee Research Council annual meeting entitled: "Rearing bees in the laboratory: A new window into the bee world". This covered results from Experiment 1 of this Project
Due to the delay in obtaining pesticide data from the laboratory because of COVID-19, additional activities are still planned but have not yet been executed. These include:
- Blog presenting results on the Bee Informed Partnership and UMD Bee Research Lab websites
- One-page brochure highlighting major findings and results will be created and published on our website
- Journal articles will be published summarizing the research results in either American Bee Journal or Bee Culture.
- Additional presentations to local, national and online audiences will be conducted.
Experiment 1 - Pesticide Feeding Trial
In the feeding experiments, our Results showed a significant impact of both fungicides and insecticides on queen events, though the timing differed between these two treatment groups. This experiment confirmed preliminary data from previous research that showed similar effects of fungicides on queen events. These data indicate that additional studies should still be pursued to further investigate the role of pesticides, and the relative importance of the specific classes of pesticides on colony health and survival in a real world setting.
Experiment 2 - Pollen Trapping & Supplementation during pollination
Due to the project revision, we were unable to perform field experiments in blueberry fields. Instead, we identified field sites in Corn only, Corn/Soy, and Mixed Vegetable Row Crops, expecting to see variation in pesticide data among sites. Locations did differ in Pesticide analyses, though these differences were also not statistically significant.
We did not see any statistical significant differences between the Net change of Varroa, Nosema, FOBs, overt disease symptoms or brood pattern between treatments. Due to the limitations of this experiment, colonies were not able to be maintained over winter to track longer-term survival and other colony health metrics.
In this study, the largest contributor to overall pesticide exposure was to the insecticide Phenothrin, though additional pesticides were detected above trace levels in trapped pollen samples. Future studies that extend over a longer period of time, collect additional seasonal and survival data with increased pesticide sample sizes would be worthwhile to further examine this question. It also provides useful information regarding current pesticide application regimes both related to time of year and crop type would also provide beekeepers with invaluable information regarding whether time and cost associated with supplemental feeding and trapping contaminated pollen is justified and under what circumstances may it have the greatest positive effect colony health.