Progress report for LNE23-481R
Project Information
Cover cropping is a soil health best management practice, but <10% of US farms and <15% of Northeast farms regularly use cover crops (CCs) and fewer manage CCs to maximize benefits for farmers and society. A key question is when to terminate CCs in spring, either mechanically or with herbicides. Farmers typically terminate CCs when small and “easy to deal with.” Delayed termination allows CCs to grow longer and may triple biomass produced, therefore greatly increasing such benefits as erosion control, weed suppression, nutrient cycling, nitrogen fixation, compaction alleviation, and summer water conservation. Farmers who use CCs are increasingly interested in facilitating late CC termination by “planting green” (PG), a practice whereby a cash crop is no-till planted into a living green CC with termination performed either simultaneously or a few days to weeks later.
Increasing climate change concerns have stimulated emerging markets that pay farmers to sequester carbon in soils. Current models have little-to-no basis for estimating carbon in CC roots. Data are therefore urgently needed on how CC termination timing affects root carbon contributions, which are more important than shoot contributions for carbon sequestration. Another issue lacking data and of concern to farmers is that CCs may increase slug problems. Finally, farmers need data on how termination timing affects weeds and soil moisture. We hypothesize that 1) shoot/root ratios are not constant over time and PG may optimize both root and shoot carbon sequestration; 2) green CCs coexisting with cash crop seedlings may distract slugs and reduce cash crop damage; 3) planting green may optimize weed suppression and summer water conservation.
We will conduct experiments on-station research with coarse and fine textured soils, and on-farm research at several collaborating farms. The on-station experiments will test three termination timings relative to cash crop planting (three-four weeks prior, simultaneously with, and one to two weeks after) and three CC types (no-cover control; grass-legume or grass-brassica-legume mixture; and pure winter cereal) in a no-till corn-soybean production system. Collaborating farms will use 2-4 treatments (farmer’s choice) per farm. Farmers will conduct all operations and measure yields while researchers will collect data on shoot/root biomass, slug damage, crop stands, seed placement, datalogger-sensed soil moisture and temperature, weed biomass and residue cover at canopy closure, and shoot nutrient content, as appropriate.
Researchers and farmers will keep detailed notes on planter settings, and operational issues such as CC wrapping, seed placement, slot closing, and machine wear. Lessons learned will be promulgated through extension efforts to reduce risk barriers for farmers wanting to grow more effective CCs that are more beneficial for their farm and ecosystem services. Farmers help design the research and those with PG experience will mentor other farmers wanting to try PG. An advisory board will guide the direction of the project, which will strive to include a range of farm types and sizes.
During the first six months of the project, we recruited and onboarded a graduate student to conduct much of the day-to-day research operations. In year 1, three farmers planted cover crops and designed on-farm trials to answer questions they had about termination methods and timing. Several additional farmers indicated their interest in establishing spring on-farm trials using cover crops they already have growing in their fields. The cover crop treatments for the on-station experiments were successfully established by overseeding into standing soybean and corn canopies in September 2023. Dataloggers were installed to sense and record soil moisture and temperature at two depths on an hourly basis on these experimental fields.
Research to optimize spring cover crop management with a focus on comparing termination methods and termination timing (from several weeks before to several weeks after cash crop planting). We will learn how these practices affect root and shoot carbon contributions, soil moisture use and conservation, weed and slug pressure, soil health functions, farmer costs and crop yields. Our results will reach 100s of farmers who are on-the-fence about cover crops or use them in ways that provide little benefit, and provide the confidence and information they need to adopt cover cropping with late termination practices that maximize cover crop benefits.
Cover cropping is a widely-recommended soil health best management practice. As a result of attention in the farm press, examples set by respected farmers, and financial incentives provided by various agencies, farmer interest in trying cover crops (CC) and their adoption of CCs increased substantially between 2012 and 2022 Ag census, but is still <18% in most NE States and <10% in most states nationally. Cover crops are now used on all types of farms, from large-scale grain to small vegetable operations, and even in hoop houses.
Adoption of CCing is only a first step. Like cash crops, CCs require thoughtful systems management to maximize benefits. One issue limiting CC effectiveness is that most farmers terminate CCs relatively early, which inhibits CC benefits. As a result, most farmers experience little or no increase in crop yields or observable increase in soil organic matter from CCs. They are therefore not motivated to continue using CCs or invest in their management. Typically, farmers terminate their CCs about a month ahead of cash crop planting when CCs are small because “covers are easier to kill when small”, “the residues need a few weeks to dry down and become easy plant through”, “they want to get that job out of the way”, to avoid CCs “getting away from” them, to avoid residue “winding around planter closing wheels”, to avoid possible competition with crops for stored soil moisture, or to reduce anticipated slug damage to emerging cash crops.
A key research question is when to terminate CCs, either mechanically or with herbicides. Delaying termination as late as possible in spring allows CCs to grow longer and may triple biomass produced, therefore greatly increasing such benefits as carbon sequestration, erosion control, weed suppression, nutrient cycling, nitrogen fixation, compaction alleviation, and summer water conservation. Farmers who use CCs are increasingly interested in facilitating late CC termination and greater CC benefits by “planting green” (PG), a practice where a cash crop is no-till planted into a living green CC with termination performed either simultaneously or a week or two later. This relatively new and still rarely used practice could greatly improve CC benefits on thousands to even millions of annual cropland acres on Northeast farms of all sizes.
To be willing to try PG practice, farmers need information on planting techniques and equipment settings and how to reap increased benefits while avoiding pitfalls. One issue is the lack of data addressing farmer concerns that CCs may increase slug problems if not terminated early. Farmers also need better data on how termination timing affects weeds and soil moisture.
Increasing climate change concerns have stimulated emerging markets that pay farmers to sequester carbon in soils. Current carbon sequestration models, such as COMET-Farm (USDA/NRCS, 2022), have little to no basis for estimating carbon in CC roots. Data are urgently needed on how CC termination timing and PG affect carbon contributions and soil organic matter, especially belowground, as root contributions are nearly twice as effective as shoot contributions for carbon sequestration.
The PI of the project is a senior faculty member at the University of Maryland (UMD), where community empowerment is driven by the Fearlessly Forward Strategic Plan, which emphasizes inclusive excellence and public service. The university uses a combination of data-driven assessments, collaborative structures, and targeted initiatives to ensure community members are active participants in their own growth and decision-making.
Goal setting at UMD is a cyclical process that combines institutional vision with grassroots input:
Assessment-Led Action: The university utilizes comprehensive tools like the Belonging & Community at UMD Survey (conducted most recently in spring 2024) to capture the experiences of students, faculty, and staff. Results from these surveys directly inform the creation of action plans for campus divisions.
Asset and Needs Mapping: Community-based programs often employ asset mapping to identify existing local resources and needs assessments to pinpoint challenges, ensuring goals are co-designed with residents rather than imposed upon them.
Collaborative Planning: Individual units, such as the College of Education, set specific objectives—like producing community interventions for holistic health—that align with the broader university compass of advancing the global common good.
UMD empowers its communities by moving away from top-down management toward shared responsibility:
Shared Governance: A core "critical enabler" of the strategic plan is Shared Governance, which engages all campus members in shaping the future of research, teaching, and service.
Participatory Practices: The Office of Public Health Practice & Community Engagement specifically commits to "power sharing" and "true participatory practices" in its collaborations.
Strategic Hubs: The Center for Community Engagement, established in 2023, acts as a centralized hub to facilitate mutually beneficial partnerships between the university and surrounding areas like Prince George’s County.
Belonging is operationalized through structured programs and dedicated spaces:
Terrapin STRONG Initiative: This program introduces every member of the community to UMD's values of diversity and equity, offering specialized workshops like Design for Belonging to help teams create inclusive onboarding experiences.
Multicultural Advocacy: The Office of Multicultural Involvement & Community Advocacy (MICA) empowers students through student-centered advising and advocacy focused on intersections of race, gender, and religion.
Inclusive Environments: Programs like SIGNA support neurodivergent students, while initiatives like the Civic Engagement for Social Good (CESG) program empower students to work directly with organizations tackling housing and food insecurity.
Investment in Infrastructure: Plans for 2026 include the opening of new graduate student housing with below-market rents to foster a stronger residential community.
Cooperators
- (Educator and Researcher)
- (Educator)
Research
Compared to early termination and planting into dead CC residues, planting green with properly adjusted equipment will:
- Achieve equally good seed placement, furrow closure and stand uniformity;
- Conserve summer soil moisture and reduce crop water stress;
- Reduce weed biomass before canopy close;
- Not affect slug numbers but decrease slug damage to cash crops;
- Increase above- and below-ground plant carbon inputs, increase stabilized soil carbon and Active Carbon in 0-30 cm soil by third year;
- Reduce time and herbicide used for CC management.
- Increase yields in site-years with wet spring and dry summer.
- Treatments: Proposed treatments with rationale for selection.
Replicated experiments use one cash crop (e.g. soybean, dry beans, sweetcorn, dent corn, industrial hemp) or rotations of cash crops according to farmer preferences. On-station trials use a soybean-corn rotation with each cash crop represented in each year.
For on-station trials, treatments comprise factorial combinations of CC termination times and CC species (including no CC) as listed below. Nine factorial combinations (marked by * below) are used (3 termination times x 3 CC species = 9 treatments). For on-farm trials, farmers choose at least two termination times or methods and 1-2 cover crops or cash crops to give 2 to 4 treatment combinations. On most farms these treatment are replicated 3 to 4 times and represented in strip plots large enough to manage with normal farm machinery.
Early, Mid and Late termination dates (in relation to optimal cash crop planting date for the site):
- *Early: 2-4 weeks prior to cash crop planting (08-12 April in Maryland). Chosen to represent the current standard practice of killing CCs while small and “planting brown”.
- *Mid: simultaneous with cash crop planting (planting green, 1-5 May in Maryland). Chosen to represent the most common, least complex PG.
- *Late: 1-2 weeks after cash crop planting. In Maryland, planting green in early May but waiting until mid-May to terminate, allows CCs to theoretically maximize aboveground biomass and reach the reproductive stage necessary for roller-crimping.
CCs species used (including a no-cover crop winter -weeds only control):
- *No CC (winter weeds only). A no-cover control included as the standard practice for many farmers who are still on the fence about using cover crops.
- *Winter cereal (Cereal rye or other winter cereal chosen by farmer). Most common standard cover crop. In Maryland winter wheat is the most popular, while cereal rye is second most popular and the most often recommended for its winter hardiness and effectiveness nitrogen capture.
- *Grass-brassica-legume mixture (farmer choice from each group plus others, if desired). This 3-species CC works well in the mid-Atlantic, with rye, radish, and crimson clover being most popular species. This CC provides aggressive fall growth and nutrient cycling by brassica, and long-lasting mulch from cereal, but without the nitrogen immobilization and yield drag single-species cereal CCs often entail.
- Other mixture (farmer's choice of species). Similar to #3 above, but no brassica for farmers with brassica crops in rotation or no legume if nitrogen is not an objective, or those who desire to limit CC seed costs.
- Methods: Experimental design, experimental unit size, and treatment application.
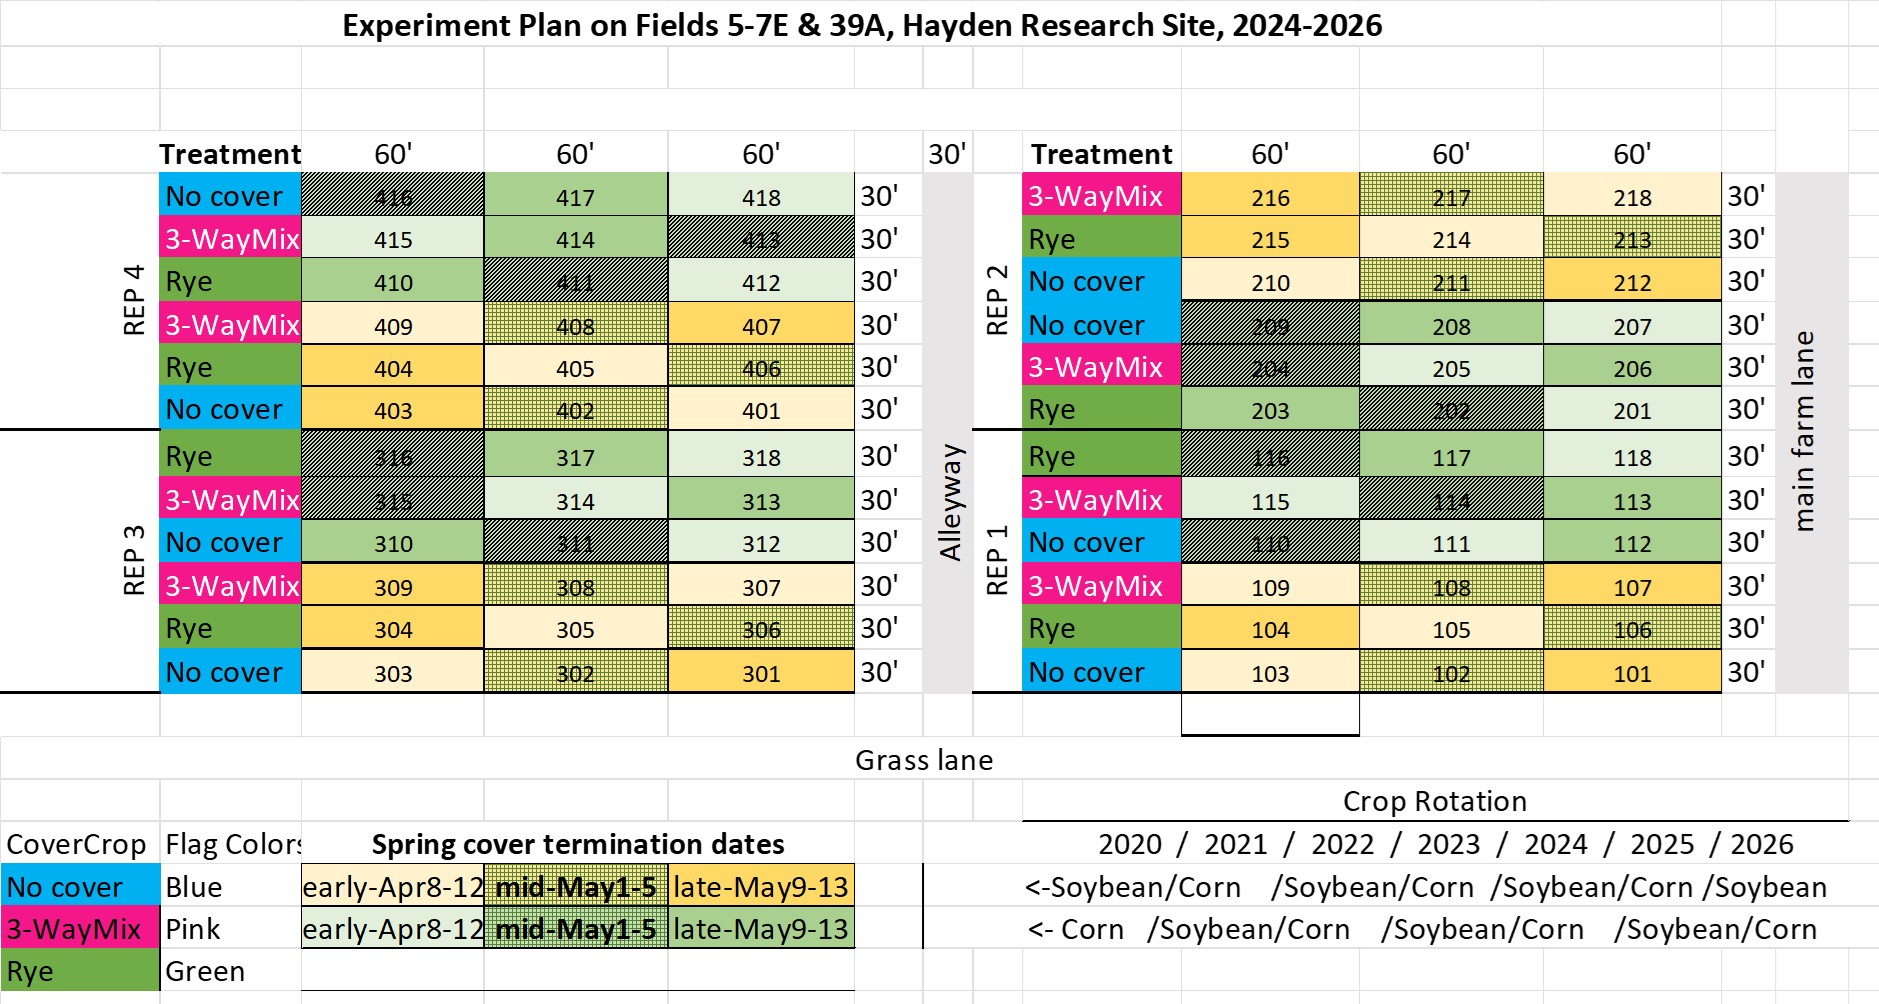
On-station experiments. Randomized complete block design with split-split-plot arrangement of treatments within blocks. The experiment is repeated on two sites representing a range of Mid-Atlantic soils, one with excessively well-drained sandy soils and the other with moderately well-drained silty and clayey soils. The main plots have either corn or soybean as the cash crop. Subplots are three CC species treatments: no cover, 3-species mix, and cereal rye. Subsubplots are termination dates: early, mid, and late. The experimental unit is the subsubplot, which measures 30 ft x 60 ft to accommodate farm-scale equipment (12 crop rows wide). The experiments have four replications at each site and were conducted for 3 project years using the same treatments on each experimental unit, giving 6 site-years of data. The experiments were initiated in 2020 with the same treatments, except for the subsubplots in the corn crop years were assigned levels of nitrogen fertilizer instead of termination dates (all three subsubplots were terminated at the "mid" date. Therefore, for cover crop species treatment effects, a total of 12 site-years of data will have been collected by Fall 2026 when the project funding ends.
On-farm trials research goals. Over a two year period, four to eight on-farm trials were planned, with the expectation that three to six would result in usable data. If possible, each would use a randomized complete block design with three replicate blocks. Two to six treatments (farmer's choice of termination times and CC/crop species) would be applied in simple strip plots with a total of 6 to 16 plots (experimental units) per farm. On-farm plots would be sized to accommodate the farmer's land and equipment. Each trial featured one cash crop (farmer’s choice) in a given year. For combine-harvested cash crops, plots would be long enough (>150ft) to obtain reliable data from calibrated yield monitors. Smaller plots might be used for crops requiring smaller equipment or hand-harvesting. Treatments would be randomly assigned to plots within each block. Blocks are laid out, with the assistance of the project researchers, to maximize uniformity within the block. Replicate blocks could be located on a farm, not necessarily in one field. Cover crop establishment, termination, and cash crop planting and harvesting are accomplished by the farmers using their normal equipment.
For both on-station and on-farm trials, cash crop planter adjustments will be optimized for plant and soil conditions, meaning adjustments may be made between plots with different treatments.
On-Farm Trials Conducted in 2024
In spring 2024, on-farm cover crop management trials were established on four commercial farms, as described below.
Steve Groff’s Cedar Meadow Farms is located in Lancaster County, PA. Steve is interested in trying a multispecies cover crop as a spring-planted companion crop to aid in the establishment of industrial hemp. Adjacent plots of industrial hemp with and without companion cover crops were planted in spring 2024 in a field located at 39°52.3783'N 76°16.9226'W. Hemp was seeded in 6 inch rows at ~405,000 seeds per hectare, across approximately 10 hectares. Companion cover crop seed was mixed with the industrial hemp seed. The idea was to have the cover crop species growing at the same time as the slow-starting hemp seedlings to offer protection from weather and slugs, then have the accelerating growth of the hemp eventually swamp the cover crop species, leaving them to die and mulch under the dense tall hemp stand. The following companion cover crops and respective seeding rates were use: 1.12 kg/ha of ‘radish’, 0.112 kg/ha of ‘oilseed rape’, 2.24 kg/ha of ‘meadowfoam’, 3.36 kg/ha of ‘annual ryegrass’, 11.12 kg/ha of ‘black oats’, 2.24 kg/ha of ‘dwarf white blossom clover’, 1.12 kg/ha of ‘phacelia’, 2.24 kg/ha of ‘red clover’, 0.112 kg/ha of ‘mustard’, 5.60 kg/ha of ‘barley’, 11.12 kg/ha of ‘cereal rye’, 11.12 kg/ha of ‘soybeans’, and 11.12 kg/ha of ‘wheat’.
Jim Lewis’ farm is located at 38°58.1303'N 75°50.7748'W in Ridgely, MD. Dominant soil series present according to USDA WSS are “Hambrook loam, 0 to 2 percent slopes”, “Ingleside sandy loam, 2 to 5 percent slopes”, and “Hambrook sandy loam, 0 to 2 percent slopes.” The Lewis farm grows primarily a soybean/corn rotation under no-till management and has used cover crop for more than 20 years. Two treatments of cover crop termination timings were established following harvest of soybean and corn in fall 2023. Different cover crop species were used depending on the preceding cash crop. Following soybean and preceding corn, vetch and radish were planted. Following corn and preceding soybean, radish and winter wheat were planted. In most of the field the co er crop was terminated on April 25, 2024 (early termination) while four replicated strips, each approximately 10m wide, and 700m in length were on May 8-10 2024 at the same time as corn or soybean planting (planting green). The planted green strips each had a similar 10 m wide strip of early-terminated cover crop between them. The corn and soybean were planted in adjacent fields equipped for center pivot irrigation. Slug counts and crop seedling damage ratings plus ancillary soil temperature and moisture measurements were made between mid-April and mid-May 2024. To facilitate slug counts, three shingle-traps were placed in each treatment strip. Crop stand counts were performed several times, corn V6 stage plant weights were determined in June and the farmer measured the final crop yields in October 2024.
Chapman Farm, a large field under management of Trey Hill’s Harborview Farms, is located at 39°17.1696'N 76°3.1584'W in Kent Co., MD. A field trial was initiated in the soybean phase of a no-till soybean/corn system at Chapman Farm. Two treatments of different cover crop species and killdates were established, within six alternating strips each measuring 45.7m x 121.9m. Pioneer P33A62E soybean were planted in both treatments on 4/16/24. The Standard treatment consists of a rye cover crop monoculture terminated at soybean planting time. Standard treatment was sprayed on 4/19/24 using Roundup (Glyphosate, N-(phosphonomethyl)glycine), Broadaxe (S-metolachlor & Sulfentrazone), and Enlist (2,4-D choline). The Extended treatment consists of a cover crop mixture terminated more than two weeks after soybean planting. The Extended treatment was sprayed with Sequence (Glyphosate & S-metolachlor) and Enlist (2,4-D choline) on May 8, 2024. Slug counting and damage rating alongside ancillary soil measurements was conducted between mid April and early May 2024. Three shingles were placed down the center of each strip 30.5m apart. The slug infestation was so damaging to the initial soybean stand that the crop was replanted in the field on May 22, 2024, using Pioneer P42A84E soybean. Calibrated yield monitors were be used to determine soybean yields at harvest in October 2024.
Mason’s Heritage farm operated by Stephen Kraszewski, Bill Mason's son-in-law, is located at 39°0.6391'N 75°56.7447'W, in Queen Anne’s Co., MD. Mason's Heritage Farm has been a certified organic grain farm since 2010. Soybean was established in an organic no-till system, with two treatments each for cover crop species and cover crop termination timing.
Diverse soil types are present at this farm. In the north field, H7, the majority soil series present per USDA WSS is “Nassawango silt loam, 0 to 2 percent slopes” with some “Ingleside sandy loam (0-2% and 2-5% slopes)” coverage and minor “Downer sandy loam, 2 to 5 percent slopes” coverage. In the south field (H8,9), the majority series present is “Ingleside sandy loam (0-2% and 2-5% slopes)”, with minor “Pineyneck silt loam, 0 to 2 percent slopes” and “Nassawango silt loam, 0 to 2 percent slopes” coverage.
In the standard treatment, 5.6 kg/ha each of crimson clover and balansa clover were aerially seeded in the north field (H7), and 11.2 kg/ha of crimson clover was aerially seeded in the south field (H8,9). In one treatment strip of an experimental plot (T2), 1.5 rounds of balansa clover was seeded at 11.2 kg/ha. In another experimental plot (T3), 1.5 rounds were “left untouched”, with no seeding of clover cover crop. In both north and south fields, Abruzzi cereal rye was seeded at a rate of 168 kg/ha using a no-till drill on November 2-4, 2023. Blue River 42D40 soybean was seeded early into standing cover crop on May 2, 2024, in experimental plots T1, T2, and T3. In T1, one round of soybean was seeded into the rye, crimson clover, and balansa clover mixture. In T2, one round of soybean was seeded into a rye and crimson clover mixture. In T3, one round of soybean was seeded into the rye monoculture. On May 29, 2024, the rest of the north field (H7) was seeded with Blue River 42D40 soybean after roller crimping the present cover crop. On June 4, 2024, the rest of the south field (H8,9) was seeded with Blue River 42D40 soybean after roller crimping the present cover crop. We did not do slug assessments in this field as the farmer reported little or no slug infestation. The farmer used a calibrated yield monitor to measure the resulting soybean yield in designated replicate sample areas within each treatment strip.
- Data Collection: Data to be collected and collection protocols. (*only on-station, **only at slug-infested sites).
- CC Shoot biomass just before termination. Three 50 cm x 50 cm quadrats per experimental unit clipped to 1 cm from ground and separated by species with dry matter recorded after drying to constant weight at 65o
- *CC Root biomass and root/shoot ratio on each kill date. At three locations in each experimental unit, a 20x20x20 cm cube of soil is excavated with a square spade, the CC shoots cut 1 cm above the soil surface, and a cube of roots washed with a sprayer over a nest of screens until clean roots are obtained. Dry weights are obtained for roots and shoots. This way the roots and shoots came from the same area of ground and the same plants. Dry tissue is ground and analyzed for C and N (LECO).
- **Slug counts every 3 days from before early termination through the establishment of cash crop with two true leaves (no longer susceptible to slugs). Counts 8-11 am using 30 cm x 60 cm roofing shingle traps.
- **Slug damage to cash crop in each experimental unit (scored from 0-5 as per (Stefun, et al., 2021) every 3 days from emergence through 2nd true leaf stage.
- Assessment of seed placement and emergence counts using three 1-meter rows per experimental unit.
- Cash crop population density at 2 leaf stage counting three 1-meter rows per experimental unit.
- *Hourly volumetric soil moisture and temperature readings at two soil depths in two replicates of no cover control and early and late termination plots for 3-species CC (8 METER Group capacitance sensors per site).
- **Soil moisture content during critical spring and summer dry periods as indicated by dataloggers. Measured using handheld meter with sensor for volumetric content or by soil core methods for gravimetric analysis. Three locations in each experimental units at 0-10 cm and 20-25 cm depth.
- *Weed biomass just before crop canopy closure. Three 50 cm x 50 cm quadrats per experimental unit clipped to 1 cm; drying to constant weigh at 65o
- Residue cover at canopy closure. At three locations in each experimental unit, a vertical photo edited to contrast soil and residue will be analyzed for percent residue cover.
- Cash crop yields are determined by calibrated combine yield monitor or hand harvest of two middle rows at least 20 ft long for corn or soybeans.
- Detailed record of observations regarding soil, crop, and equipment status.
- Data Analysis and Presentation of Results: Statistical methods to be used and the forms in which results will be presented. Describe plans
Data are analyzed using R, SAS and SYSTAT software. On-station trials are analyzed as split-split-plot RCB across two soils with soils, blocks within soil, and termination dates random effects while CCs and cash crops are fixed effects. On-farm trials mainly use simple RCB analysis with general linear models. For data such as slug counts and soil moisture, transformations are likely be needed to meet assumptions of normality. Results are then back transformed. If transformations are insufficient, non-parametric tests such as Kruskal-Wallis and Inman tests are used to determine significant differences. Trends over time for variables like slugs, soil moisture, and CC growth are visualized using line graphs and regressions. Cover crop and soil data will be presented in tables and graphs as well as in illustrated info-graphics for outreach to farmers.
Cover Crop Biomass Production in Fall 2023 (pre project funding)
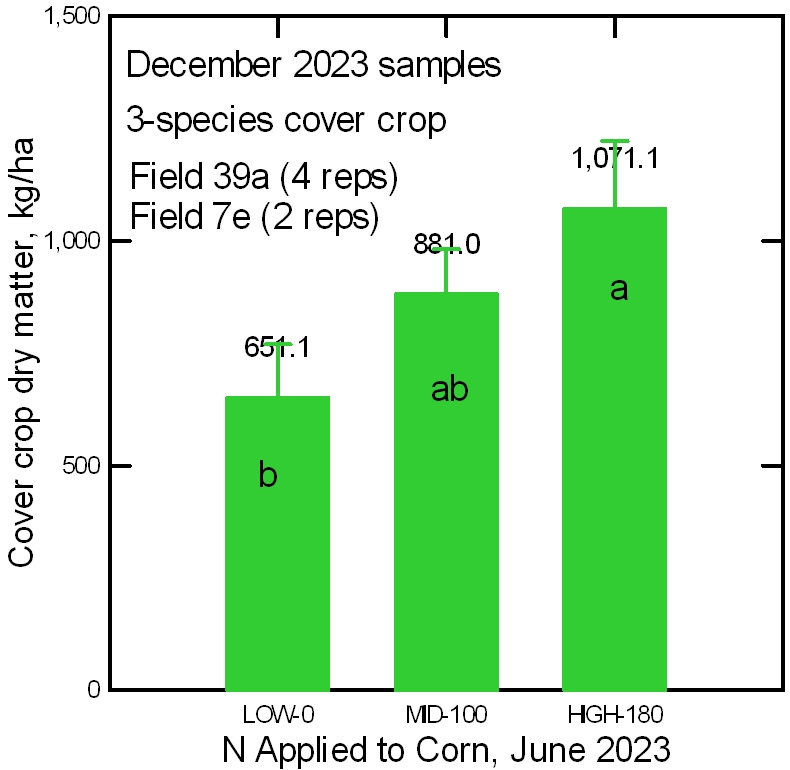
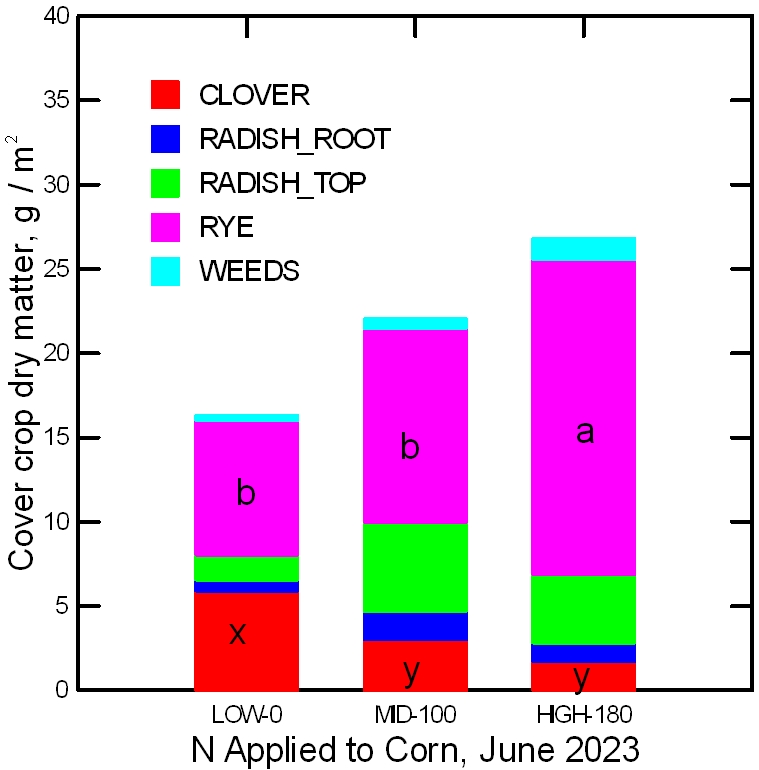
In early Fall/late summer 2023, cover crops to receive spring management treatments were planted on collaborating farms and at the Central Maryland Research and Education Center (CMREC), in Beltsville, MD. At CMREC, the cover crops were broadcast overseeded into standing corn canopies in late August 2023 and into standing soybean canopies at leaf yellowing in early September. Due to nearly a month without any significant rain, the cover crops didn't germinate until mid-September. Different rates of side-dressed nitrogen had been applied in June to corn plots as part of a prior agronomic experiment on the site. During the first year of the project cover crop experiments, this differential N could theoretically affect the cover crop performance in spring 2024 due to the effect of corn vigor in competing for light during early cover crop growth before corn harvest and due to possible residual N remaining on the soil for use by the cover crop plants. To assess this potential carry-over effect at CMREC, fall biomass was hand-harvested in December 2023 for the radish-crimson clover-rye mixture (3-Way) cover crop that was intersown into the corn before harvest. This data was collected for all four replications at the sandy soil site, and two of the replications at the silty-clay soil site. A statistically significant difference in aboveground cover crop dry biomass was observed between the high (160 or 180 lb N/acre) and low (0 lb Nacre) side-dress rate (Figure 1). The range of biomass values from about 600 to 1000 kg/ha is lower than expected for an early intersown cover mixture at this location, probably due to lack of rain during the early cover crop growth period. In addition, the N rate applied to corn in June differentially affected the rye and clover components of the cover crop, the higher N applied to corn in June increasing the relative amount of rye while decreasing the amount of clover (Figure 2). These results would be expected since the main competitive advantage of the clover is its ability to fix its own nitrogen, while the faster-growing rye would be more competitive where more N was available in the soil. We conclude that 1) N applied at the higher rate was not efficiently used by the corn crop since residual N was available to stimulate the growth of the rye cover crop in September-December. This was true across both the sandy and silty clay soils. In addition, the differential effect on species in the fall biomass suggests that we might see the effect of N applied to corn in one year affect the performance and N-fixation ability of the following cover crop in the spring of the next year. Although we will not apply different rates of N to corn in 2024, we monitored the cover crop biomass from all termination date subplots at the time of early termination (early April) and determined that this effect did not carry over into the spring.
Cover Crop Root and Shoot Biomass Production 2024
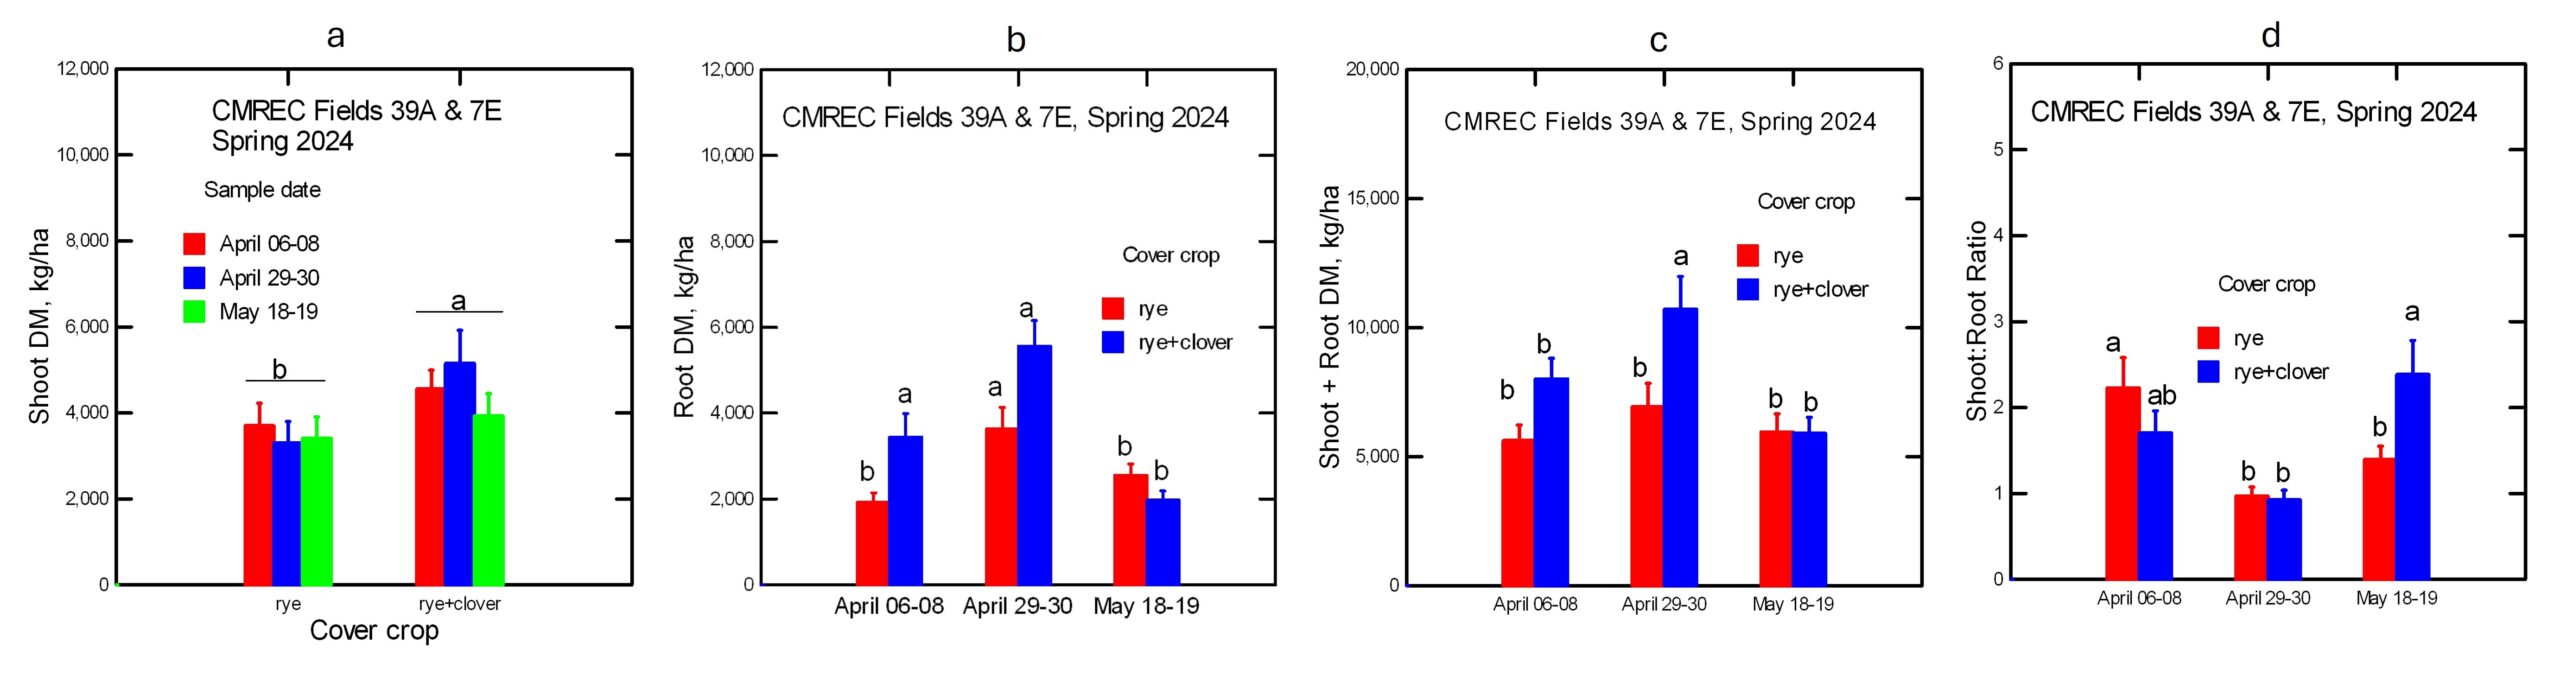
Figure 3 illustrates observations on the root - shoot biomass. Roots and shoots were sampled using the soil cube technique (see Figure , below). Shoot biomass changed very little with sampling dates that correspond to the early mid and late termination. However, the rye + clover vegetation (which is all that remained of the three-species cover crop) produced more shoot dry matter than the sole rye even though the latter had a more dense population. Root dry matter was affected by both the cover crop type and the sampling date. The greatest root dry matter from both the sole rye and the rye+clover occurred at the mid-termination time which was the end of April. The decline in root biomass between the mid and late kill dates does not necessarily represent less contribution of organic carbon to the soils. Rather the decrease in root DM may reflect carbon added to the soil during the the sloughing off of old roots and and regrowth of young ones. Shoot-to-root ratios varied with the type of cover crop and with the sampling date. The shoot-to-root ratios were lowest for the mid-sampling date and more than twice as high for the early and late sampling dates. For the late sampling date, the shoot-to-root ratio was almost twice as high for the rye +clover as for the sole rye. These data illustrate the inappropriateness of modeling cover crop below ground biomass by using a given shoot-root ratio for a given cover crop species.
Cover crop performance in 2024.
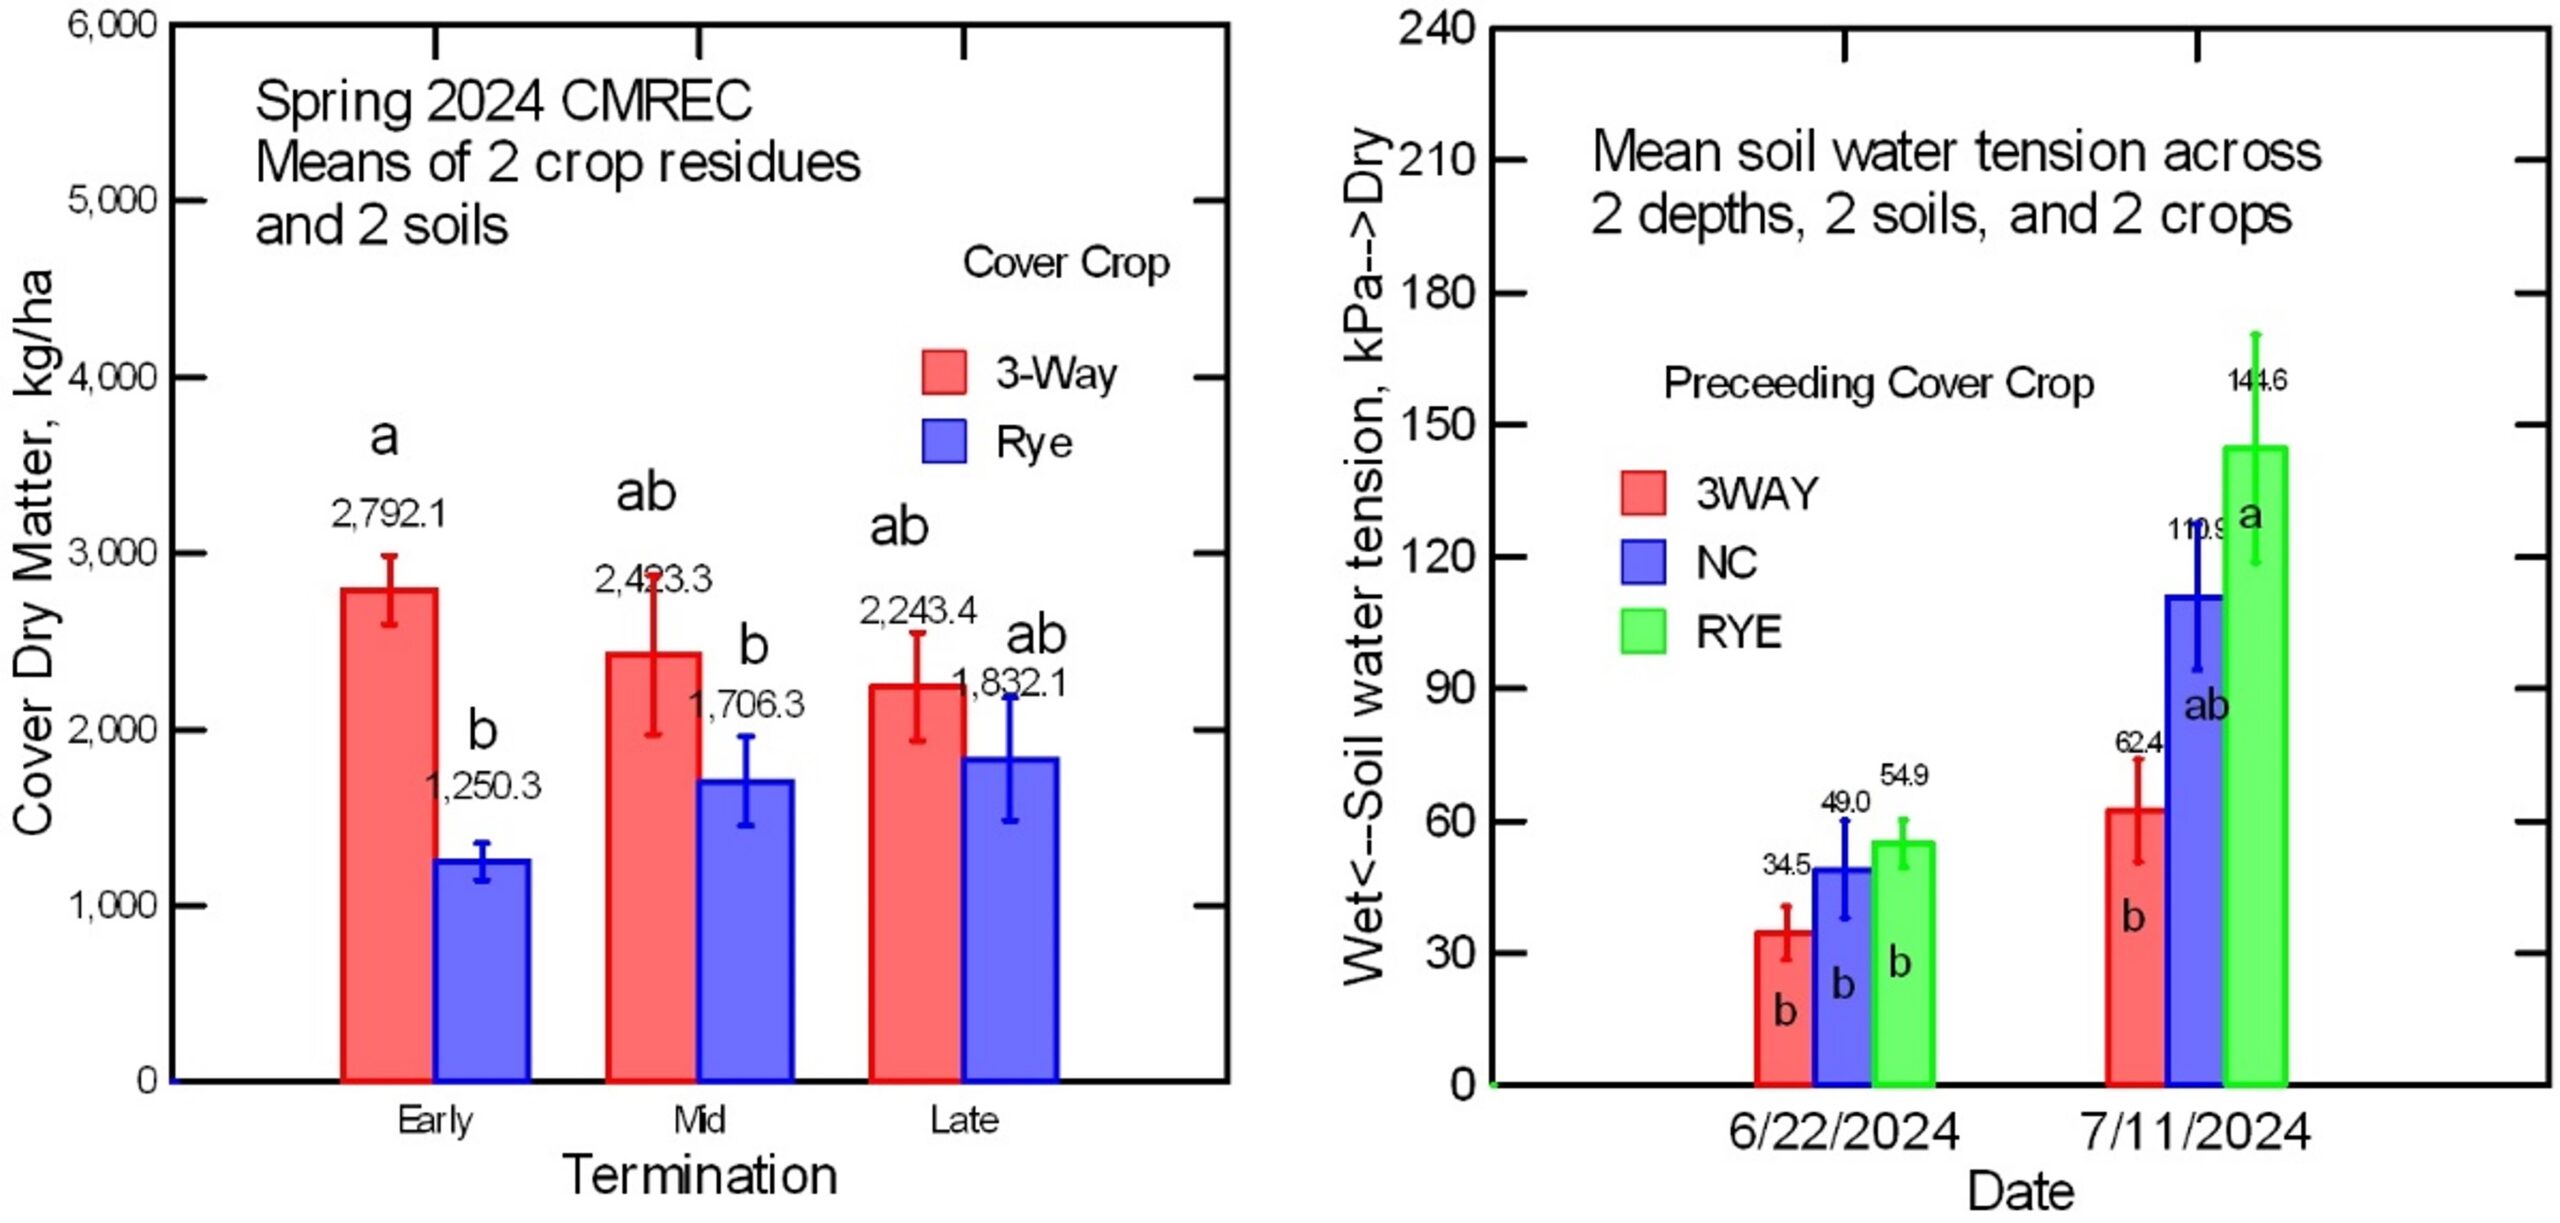
Cover crops produced moderate levels of biomass in the field experiments at the Central Maryland Research and Education Center (CMREC) Beltsville facility. This was partly due to less-than-ideal conditions for inter-seeding in the Fall of 2023 and also due to very cool and very dry conditions in April 2024. There was little difference in cover crop biomass between early mid and late termination dates, but the rye cover crop tended to increase biomass with time, while the three-way cover crop dominated by crimson clover showed little change or even a slight decrease (Figure 4, left). Nonetheless, cover crops and their residues did have an impact on soil moisture during the summer growing season, which was extremely dry and hot. The cover crop effects began to show up in the soil moisture tension data in late June, and by mid-July, there was significantly more water available in the soil under the three-way cover crop than under the rye cover crop (Figure 4, right). The no-cover plots were intermediate in soil moisture. These data are based on averages for plots growing corn and soybeans, for the sandy soil and the silty clay soils, and measurements at 15 and 30 cm deep, since none of these factors had a statistical effect on the soil moisture.
Slug Activity, Crop Damage, and Yields as Affected by Cover Crop Management
Study on Ridgely fields of James Lewis' Farm.
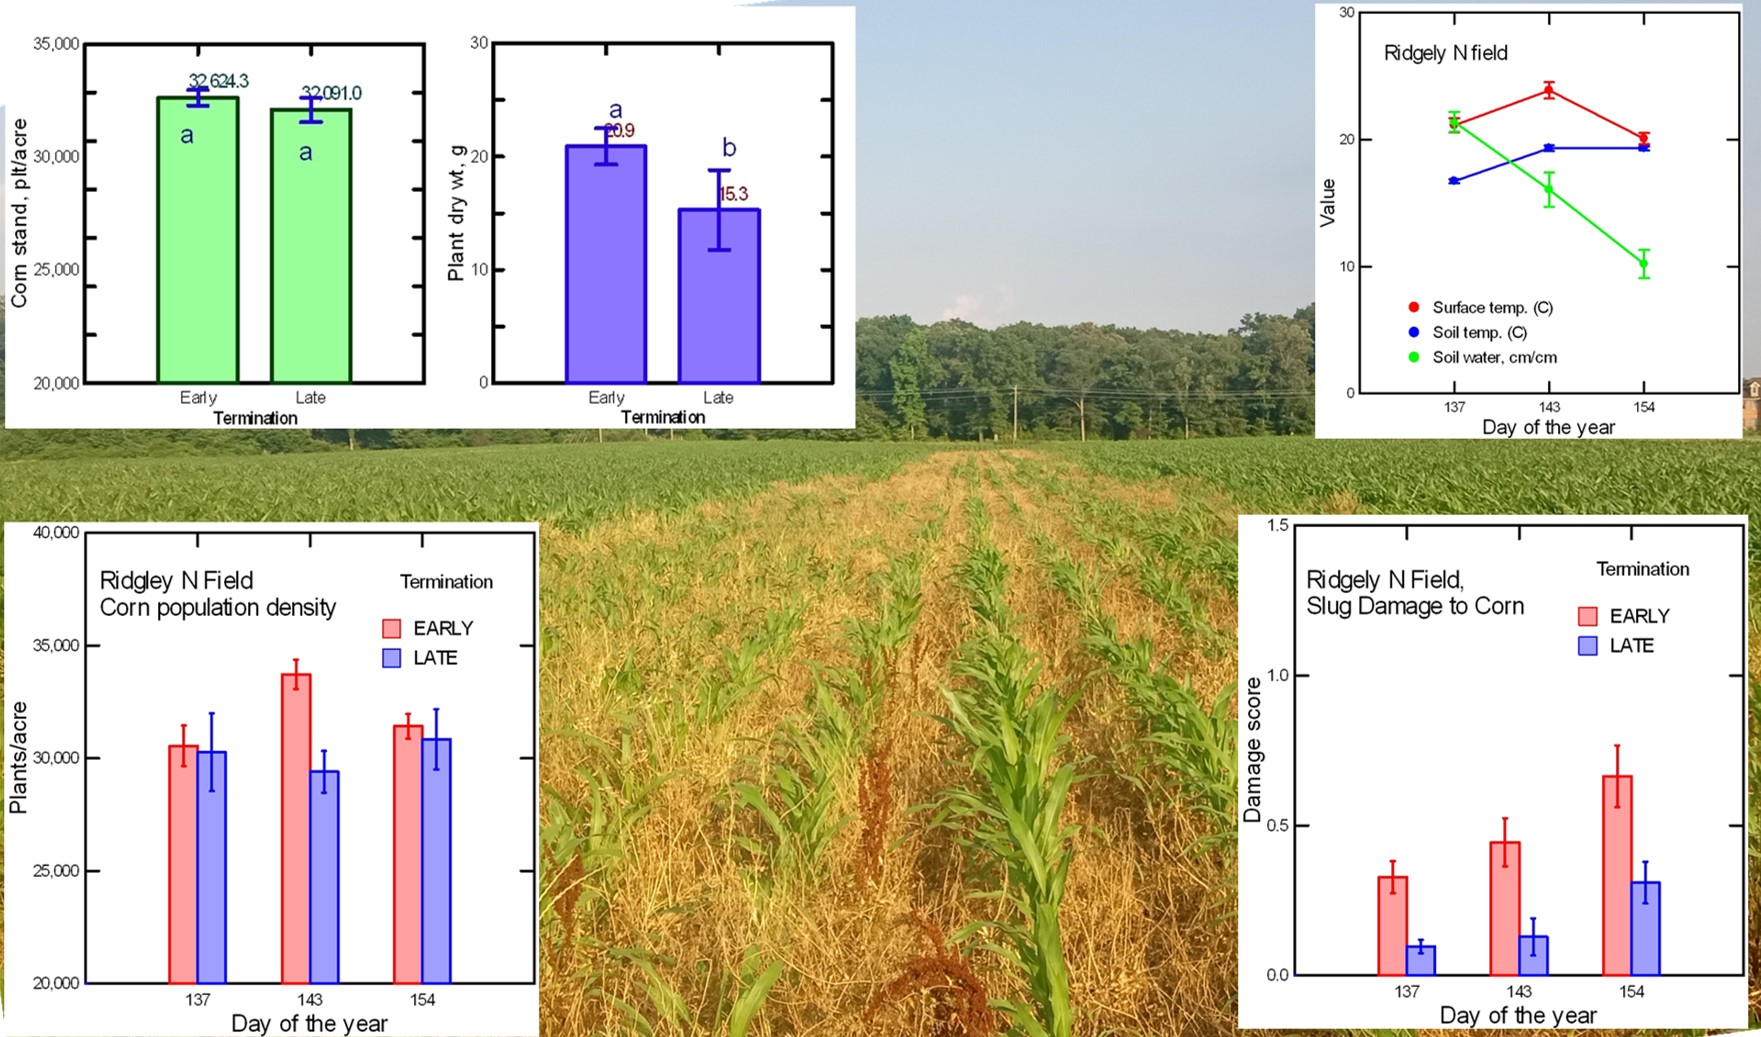
Monitoring of soil water, surface temperature, soil temperature, and slug numbers under shingle traps before the imposition of cover crop termination treatments and planting in the adjacent Ridgely fields revealed that the south field was significantly wetter than the north field. Slug numbers were weakly associated with soil moisture. Once the crops emerged, we monitored conditions and crop stand density on three dates for each field. The average data for the north field planted to corn are presented in Figure 5, below. The late-killed strips were not sprayed out until three weeks after corn was 'planted green' into them. They had slightly drier soil in the upper 5 cm, probably due to continued water transpiration by the cover crop during the very dry period in most of April. The corn stand establishment and stand density averaged over the three observation dates were not affected by the cover crop termination treatments. Slug damage to crop seedlings was scored on three dates in each field. Seedling damage by slugs was scored from 0 (no damage visible) to 4 (damage so severe that the seedling died or will die, such as eating off the terminal growing point on soybean). The figure below shows the damage scores for corn on three dates. On all three observation days, there was significantly less slug damage in the late-killed (planted green) strips than in the conventional early-killed cover crop strips. However, the corn seedling dry weight per plant was significantly lower in the late termination strips.
Unlike for corn in the adjacent field, later termination and planting green did not affect soybean stand population or slug damage at Lewis'' farm near Ridgley (Figure 6).
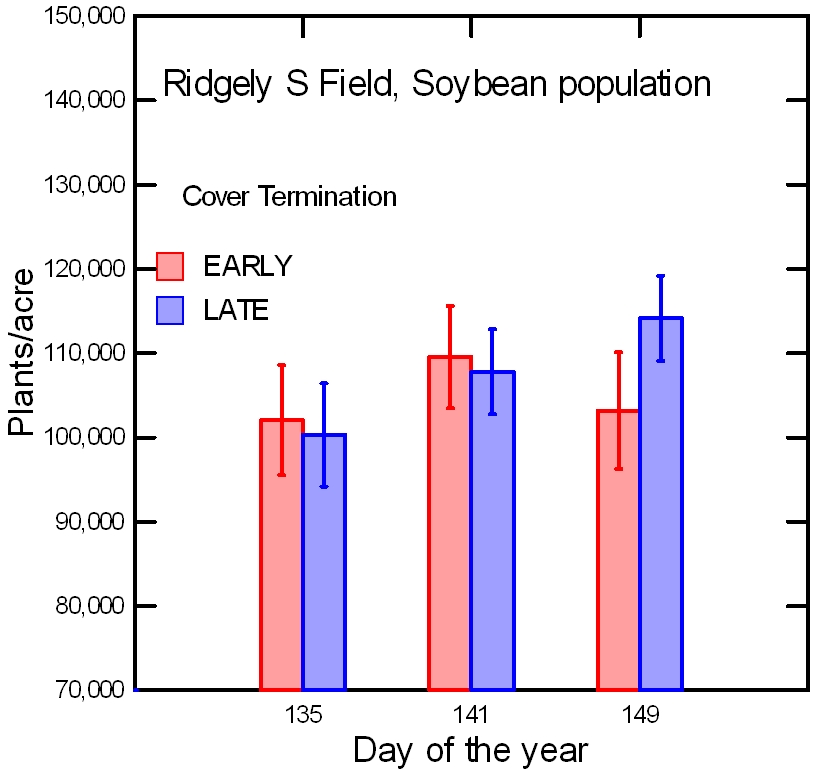
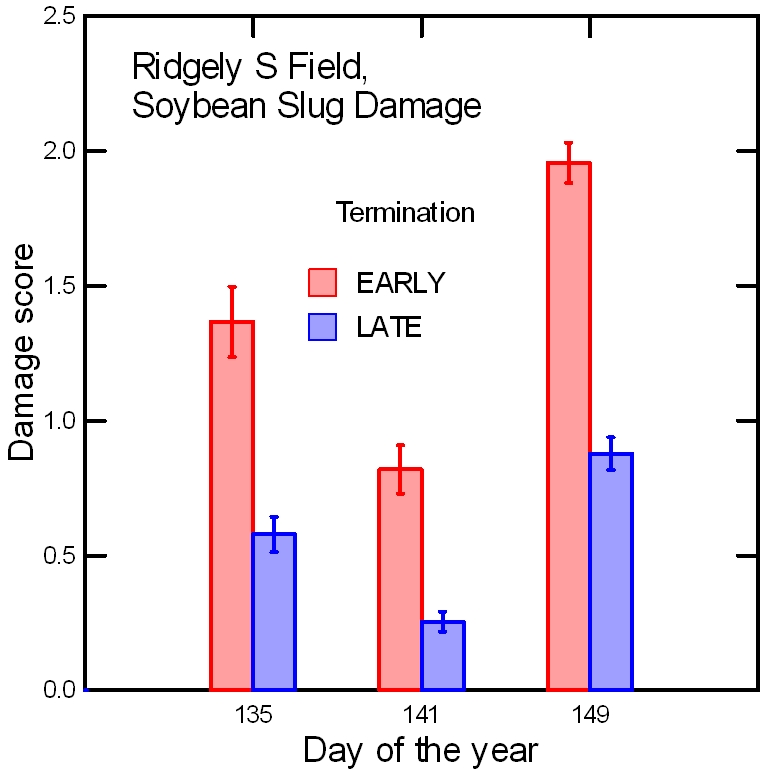
Figure 7. Effect of later termination and planting green on slug damage scores for soybean seedlings in Lewis farm field near Ridgely, MD on three dates.
Figure 8 shows the number of slugs counted per shingle in the corn and soybean fields at Ridgely as averaged on five observation dates. The last two dates were after cash crop planting. These data are averaged across the termination timing strips. The slug infestation was only moderate and the cover crop termination treatment did not affect the number of slugs observed in either the corn or soybean fields. The Figure also shows the surface and soil (5 cm) temperature and volumetric moisture content on the same dates. slug damage score for corn and soybean seedlings averaged over three dates. In this trial, letting the cover crop grow until cash crop planting by planting green into the living cover crop did not affect slug numbers or crop stand density achieved, but did reduce slug damage to both corn and soybean seedlings. The much heavier cover crop biomass residue on the late-killed strips could enhance yields when the summer is dry and water conservation is a factor.
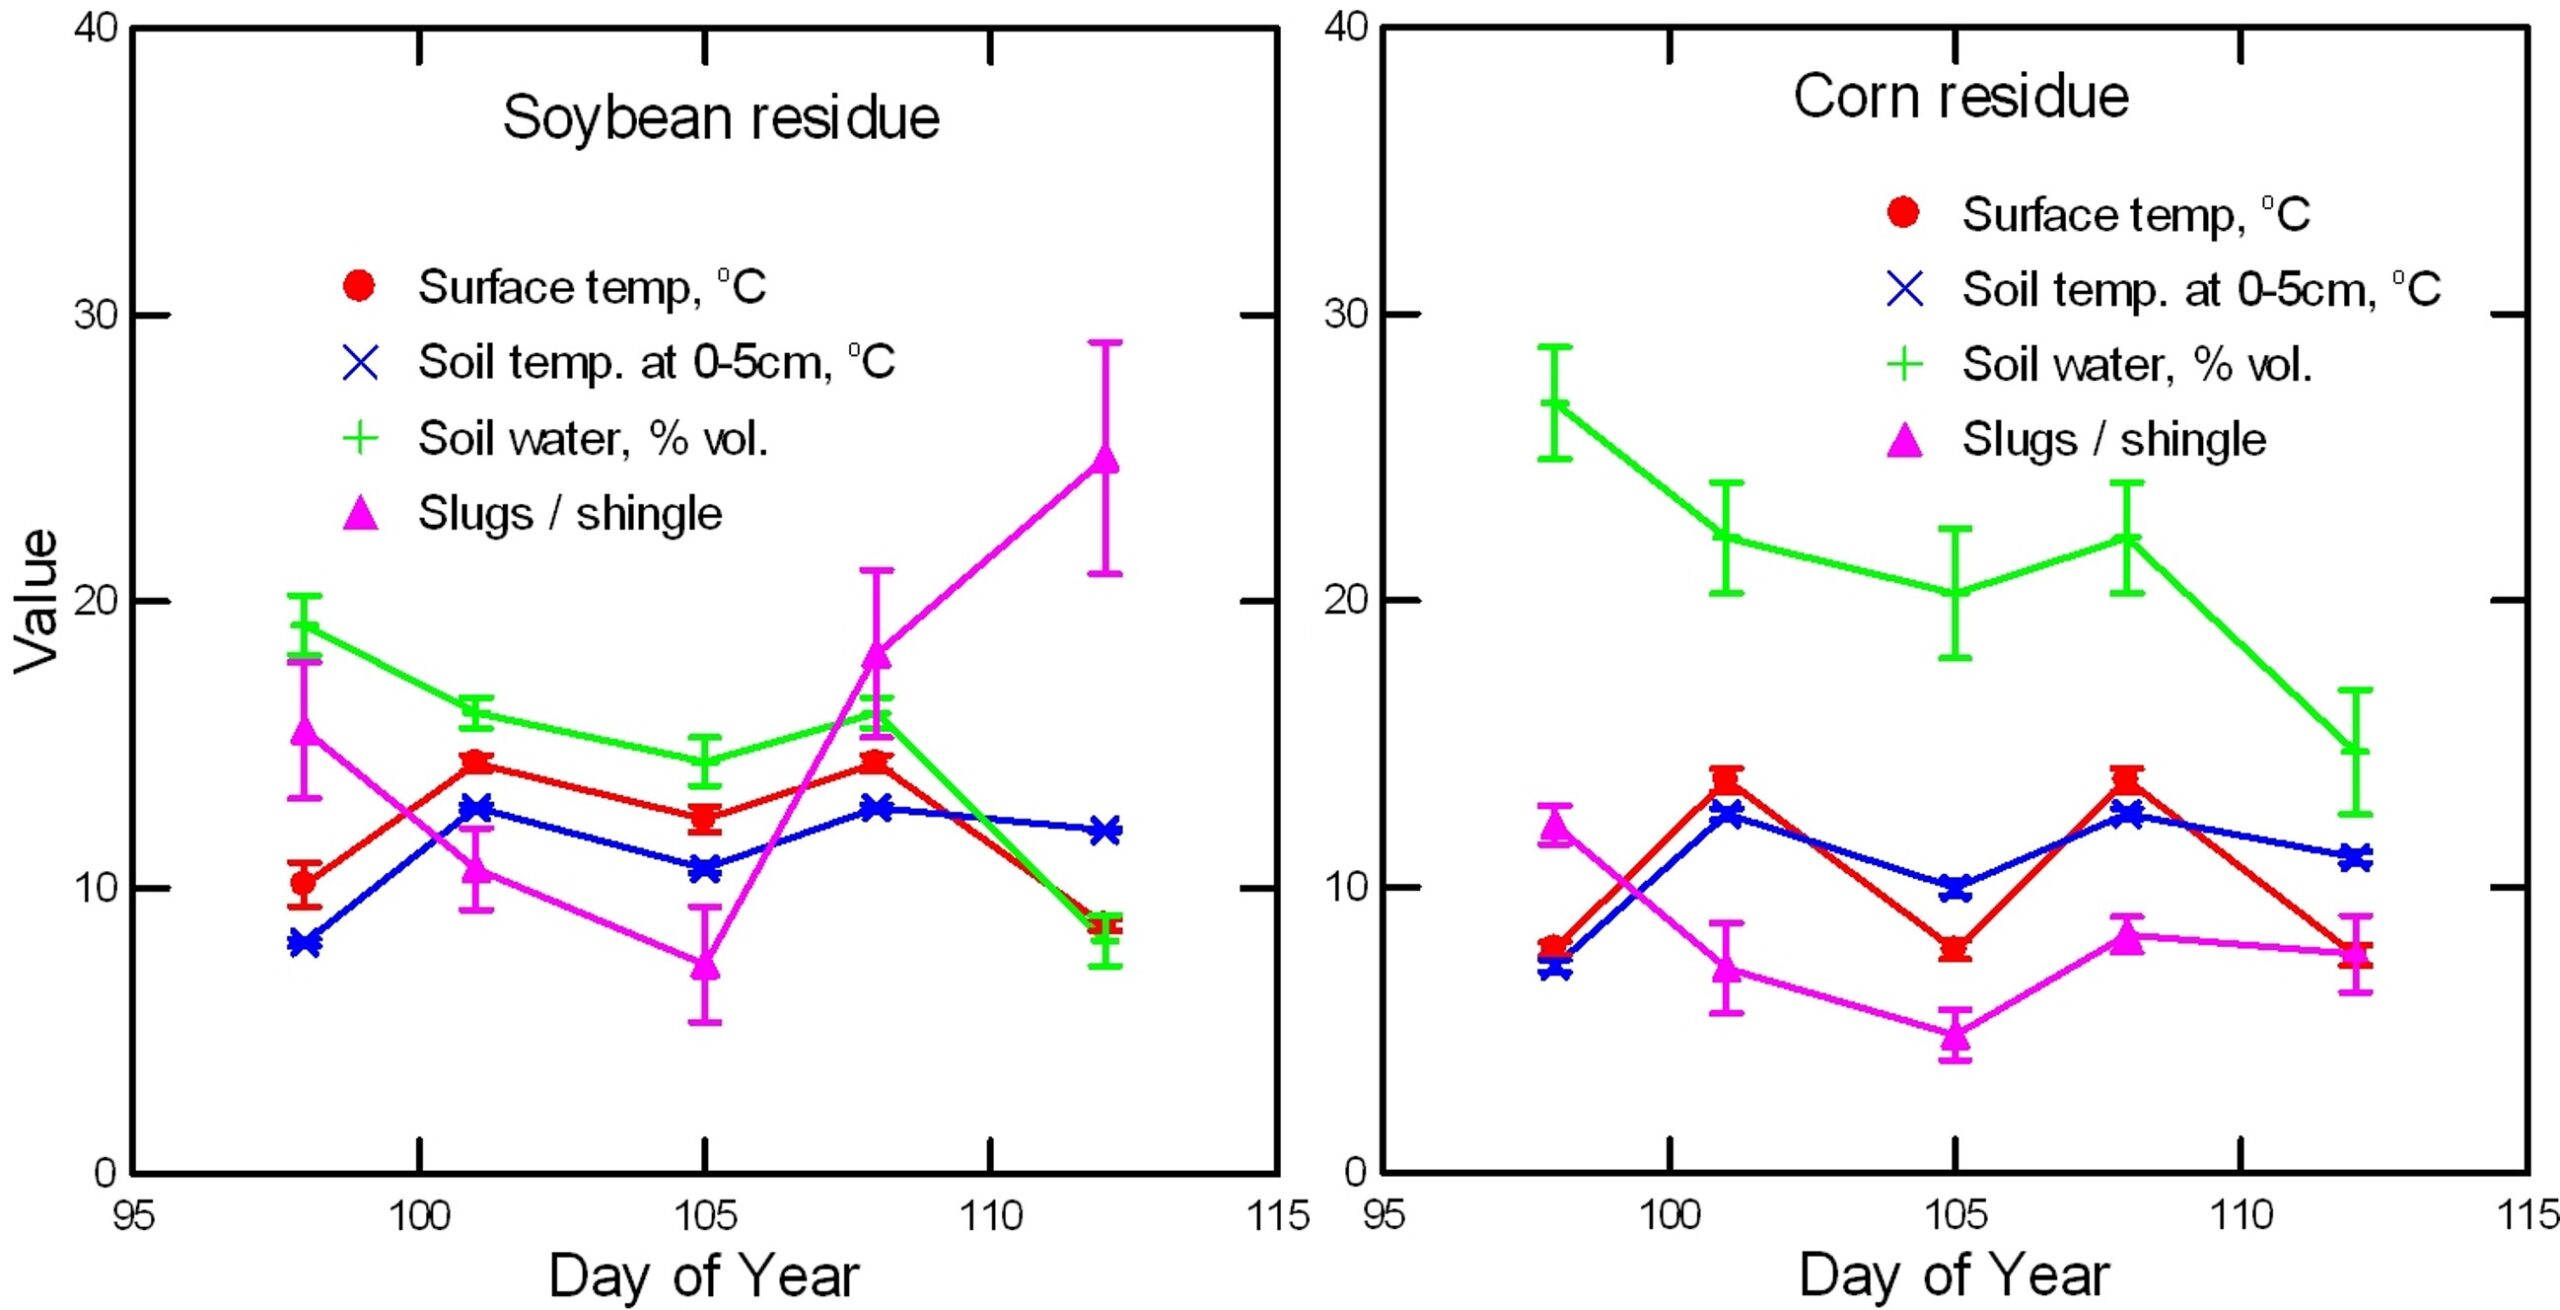
Figure 8. Slug study data for Lewis Farm fields at Ridgley, MD showing soil and surface temperature, soil moisture, and slug counts for the north field in soybean residue where corn was planted in 2024 and (right) south field in corn residue where soybean was planted in 2024.
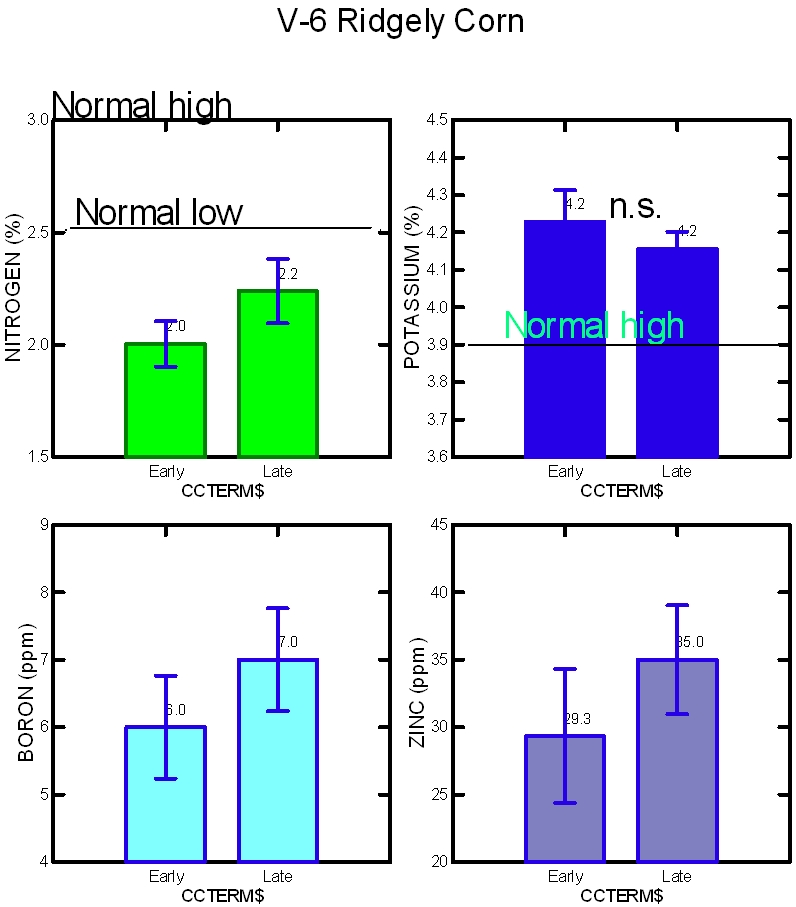
Because the corn was clearly stunted, we sampled the V5-stage corn plants and determined their dry weight per plant and the nutrient content of the plant tissue. The tissue concentrations of most nutrients were not affected by the cover crop management, except higher levels of Zn, B, and N in the corn planted green into late terminated cover crop hairy vetch, most likely due to less dilution as in the bigger plants in the early terminated plots. The K levels are also shown because they were unusually high, probably because the field had been regularly fertilized with poultry manure, which is very high in available K.
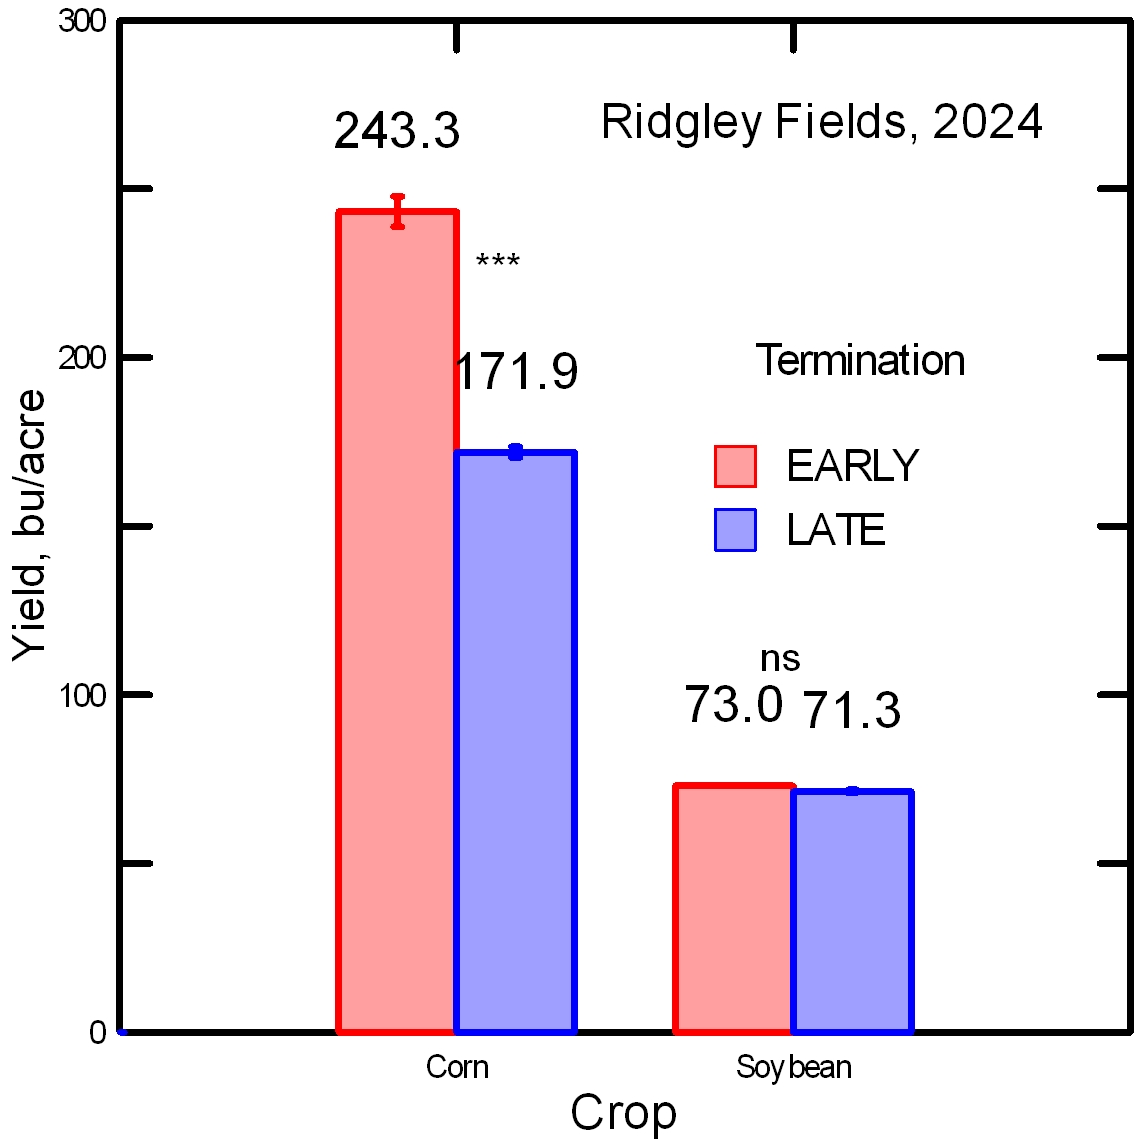
In any case, the early season stunting carried through to the final yield. Corn yields were quite good in this irrigated field, but the late terminated strips yielded 71 bushels per acre lower (172 bu/acre) than the early termination strips (243 bu/acre, Figure below). Although 2024 was a very dry year during the growing season, these fields had the benefit of center pivot irrigation and water was not limiting. We propose that the stunting was not due to effects of nutrients, slugs, soil temperature, or water. We hypothesize that the timing of the hairy vetch termination with herbicides may have produced active allelopathic compounds just when the corn seeds were emerging. Soybeans in the adjacent field, in contrast to the corn, yielded well regardless of the timing of the winter wheat cover crop termination and planting green. Although he did not use row cleaners or residue rollers as suggested by Penn State University researchers (Reed, H. K., Karsten, H. D., Duiker, S., Tooker, J., and Curran, W. S. (2019). Planting green 101: Penn State research summary Penn State University. https://extension.psu.edu/planting-green-101-penn-state-research-summary ), Jim Lewis said that he has had poor results in the past with planting green for corn, but this 71-bushel loss was the last straw. He liked the results with the soybeans and plans to continue to experiment with planting green to improve his soil health when growing soybeans, but won't again try planting green for corn.
Study on the silty field (7E) at CMREC Beltsville Facility.
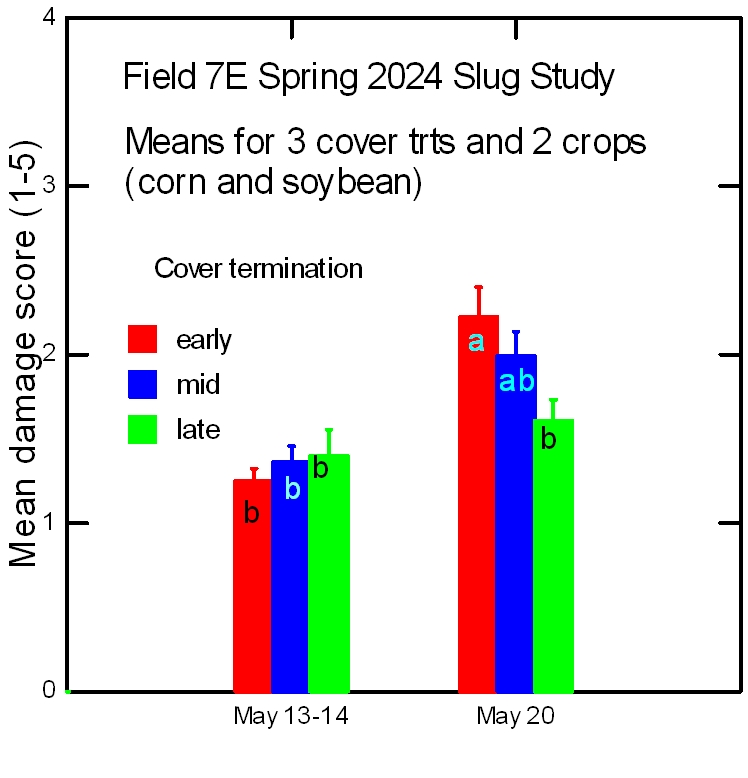
Of the two research fields at CMREC used in this project, Field 7E has fine-textured Christiana soil and a history of slug infestations. In the spring of 2024, we monitored the slugs and their impact on corn and soybean crops in this field in plots with rye, rye+clover, or winter weeds only. The average damage score increased over time during the first 10 days after emergence for both crops, but the damage from slugs was consistently worse on the soybeans than on the corn (Graph below).
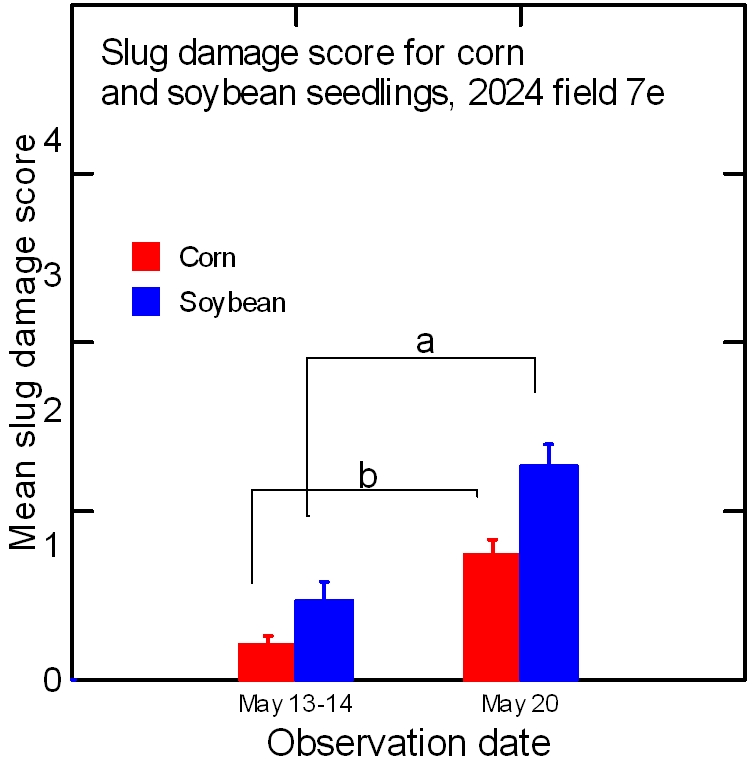
Slug damage to both corn and soybean seedlings was generally not made worse by allowing cover crops to grow longer. In fact, on some evaluation dates damage scores were lower for the late killed and planted green plots. These results are consistent with what we observed in the on-farm trials on the Eastern shore. In the graph below on May 20th 12 Days after planting corn and soybeans the slug damage to crop seedlings was significantly less severe in the late cover crop termination plots than in the nearly cover crop termination plots on average across all three cover crop treatments and both cash crops.
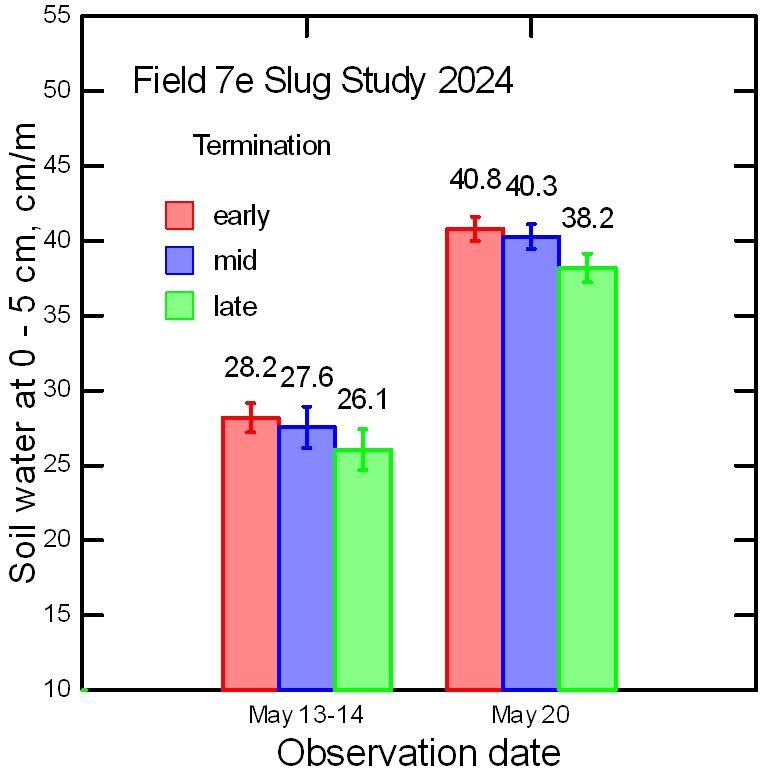
In addition to concerns about increasing slug damage, farmers are often concerned about longer-growing cover crops using up storage soil moisture. When making the slug counts and damage assessments we also measured soil moisture in the upper 5 cm of soil. Generally, the termination date did not affect this significantly and there was only a slight trend toward slightly drier soil in the plots with the longer-growing cover crop as shown in the graph below. Obviously, a much-needed rain was received between the May 13th observation and the May 20th observation date.
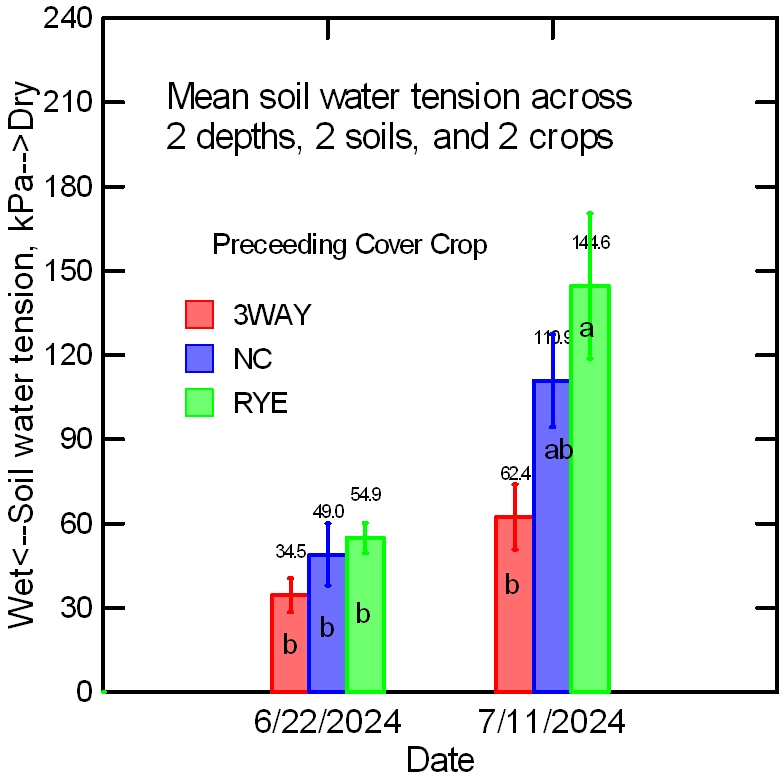
Cover crops did have a major effect on soil moisture conservation during the dry hot summer months. The spring and summer of 2024 were exceptionally dry on these non-irrigated plots. By June 22nd, a trend was beginning to emerge of greater moisture content (lower soil water tension) with the multi-species cover crop as compared to the rye, with the no-cover (winter weeds only) plots falling in between. With almost no rain received, by July 11 this trend was accentuated and was statistically significant. The graph below shows the soil water tension averaged across two soil depths (15 and 30 cm), two soils (a loamy sand field and a silty clay field ), and two crops (corn and soybeans). The reason why the rye cover crop resulted in dryer soil in the summer is uncertain but may have to do with the larger biomass and water uptake during its growing season, especially in April.
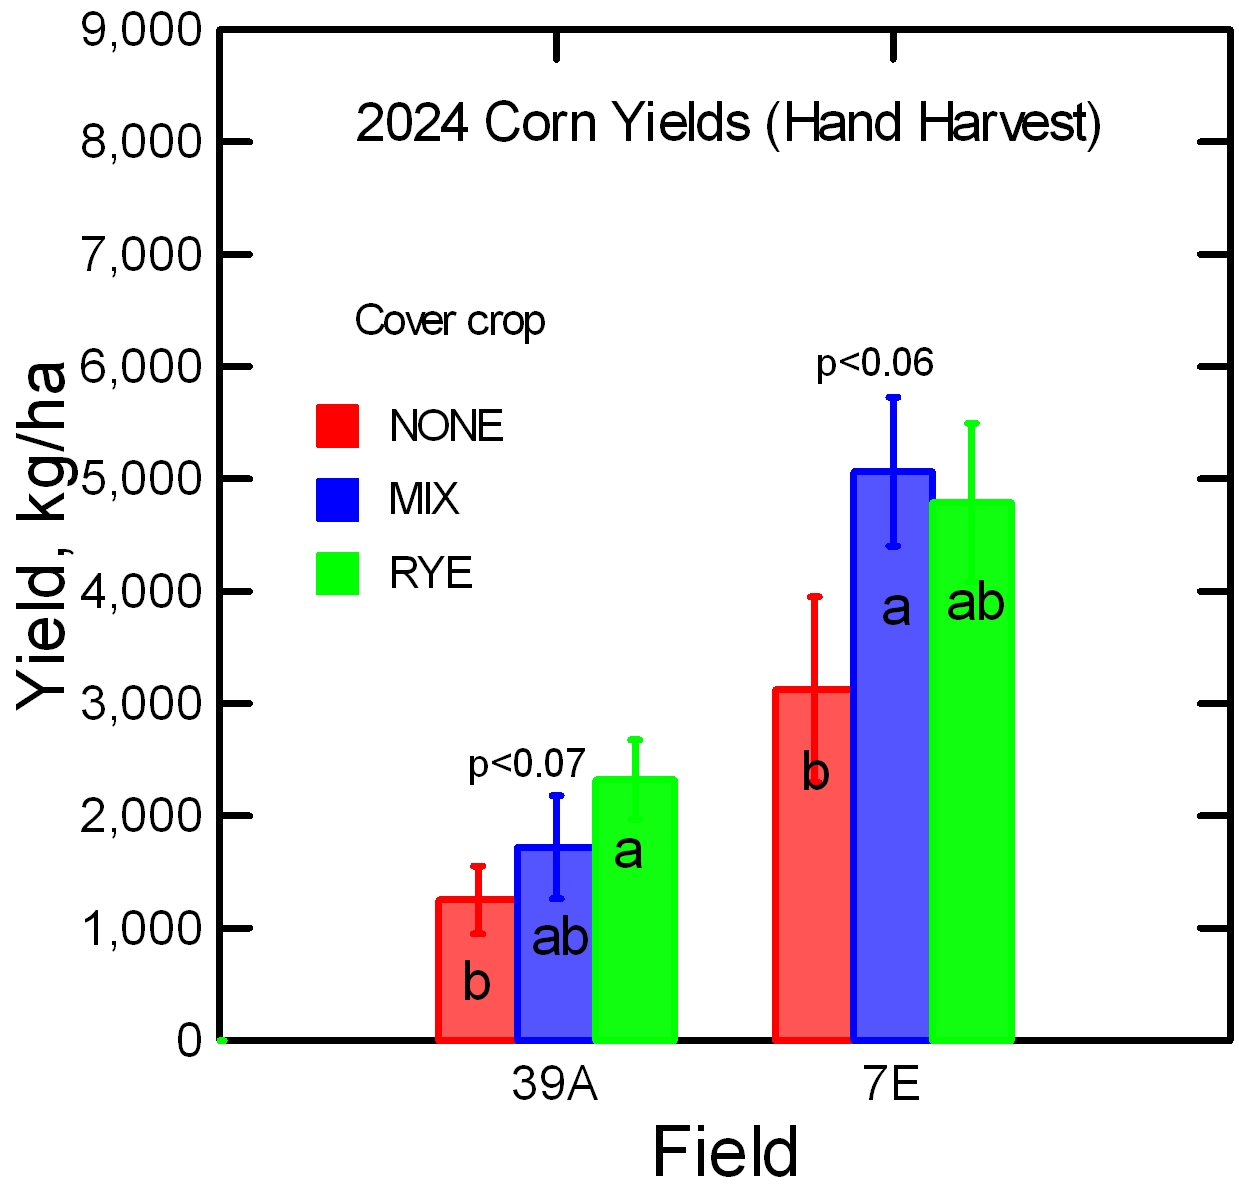
Cover crop effects carried through to final crop yields. As we have seen on other sites in dry growing seasons, corn yields with cover crops were significantly (p< 0.07) higher than in the no-cover control plots. Nonetheless, in this extremely dry year, non-irrigated corn yields were very low across the board, especially on the sandy soil.
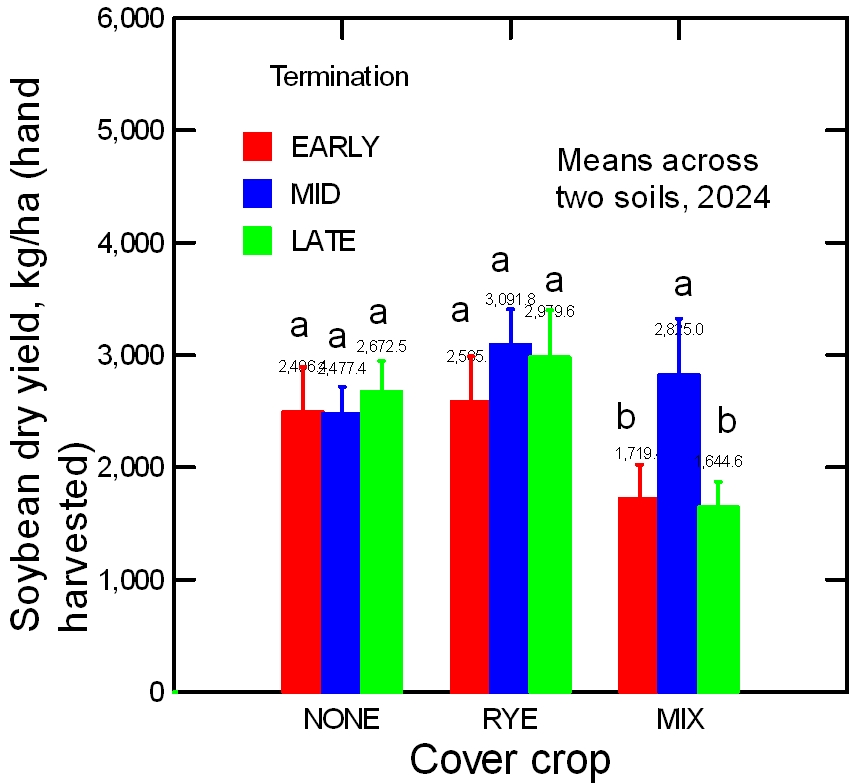
Averaged across the two contrasting soils at the Beltsville research farm, soybean yields were not significantly affected by cover crops and were not as extremely low as corn yields. However, there was an interaction between cover crop species and termination timing such that the early and late kill of the multi-species mix resulted in significantly lower soybean yields than the mid-kill which was planted green and terminated on the same day. This effect, we believe, was largely related to the weediness of the early and late terminated plots due to the dry weather at the time of herbicide spraying and the lack of moisture to ensure the herbicides were absorbed by the weeds. Therefore, summer weeds grew out of control and there was a significant negative relationship between weed biomass and soybean yield in these plots (data not shown).
Accomplishments during 2025, the project's second field season.
During 2025, we collaborated with three farmers and conducted experiments at two research station sites. The main objectives were to investigate the relationship between cover crop management and slug damage to crop seedlings, and to study the performance of cover crops when interseeded into standing canopies in fall and terminated at various times in relation to cash crop planting in spring.
Investigations of slug damage and crop stand establishment.
In 2025, we collected three site-years of data on slug damage and stand establishment in relation to spring cover crop management. These three site-years, in combination with the previous seven site-years provides a total of 10 site-years of data and allow us to draw conclusions on which farmers can base their decisions with considerable confidence. The three farmers we collaborated with in 2025 were Steve Kraszewski of Ruthsburg, Maryland, Steve Groff of Holtwood, Pennsylvania, and Jim Lewis of Ridgely, Maryland. All three also participated in the project Farmer Advisory Board.
Steve Kraszewski of Mason Heritage Farms proposed a comparison of planting soybeans green into rye to them planting green into a mixture of rye and crimson clover. Although we discussed having replicated strips, in the end the two cover crops were sown in two different fields. We visited these fields to collect initial slug and seedling damage data on May 1st, but the soybean seeds had not yet emerged, so no useful data could be collected on stands or damage. We also placed shingles overnight, but observed no slugs the next day. Conditions were very dry, and soils were quite sandy. We did observe a significant difference in moisture content and texture between the two fields. We concluded that there was no scientific comparison that we could make because the inherent differences between the two fields were confounded with the two cover crop treatments.
Steve Groff, at Cedar Meadow Farm in Pennsylvania, wanted to try an innovative use of cover crops for his industrial hemp cash crop. He set up four replicated pairs of test strips. In one treatment, he drilled the hemp seed by itself in the usual manner at a rate of 800,000 seeds per acre. In the other treatment, he mixed the 800,000 seeds per acre with cover crop seeds, mainly brassica species. The hemp and cover crop seeds were drilled together in the same rows on the same date as the pure hemp seeding. We visited the site on May 1st to set out slug trap shingles, and again on May 2nd to count slugs and score damage. Conditions were rather dry, and we found no slugs under the shingles. The hemp seedlings and brassica cover crop seedlings were just emerging. We were able to make stand counts, but recognized that these would be incomplete because the cover crop and hemp had not completely emerged. We returned to collect additional data on May 21st, which was a rainy day. Although the cool and wet conditions were good for finding slugs, we found only a few. However, we did get useful assessments of hemp seedling damage and hemp stand counts, as well as data on the temperature and moisture conditions in the upper 2 inches of soil.
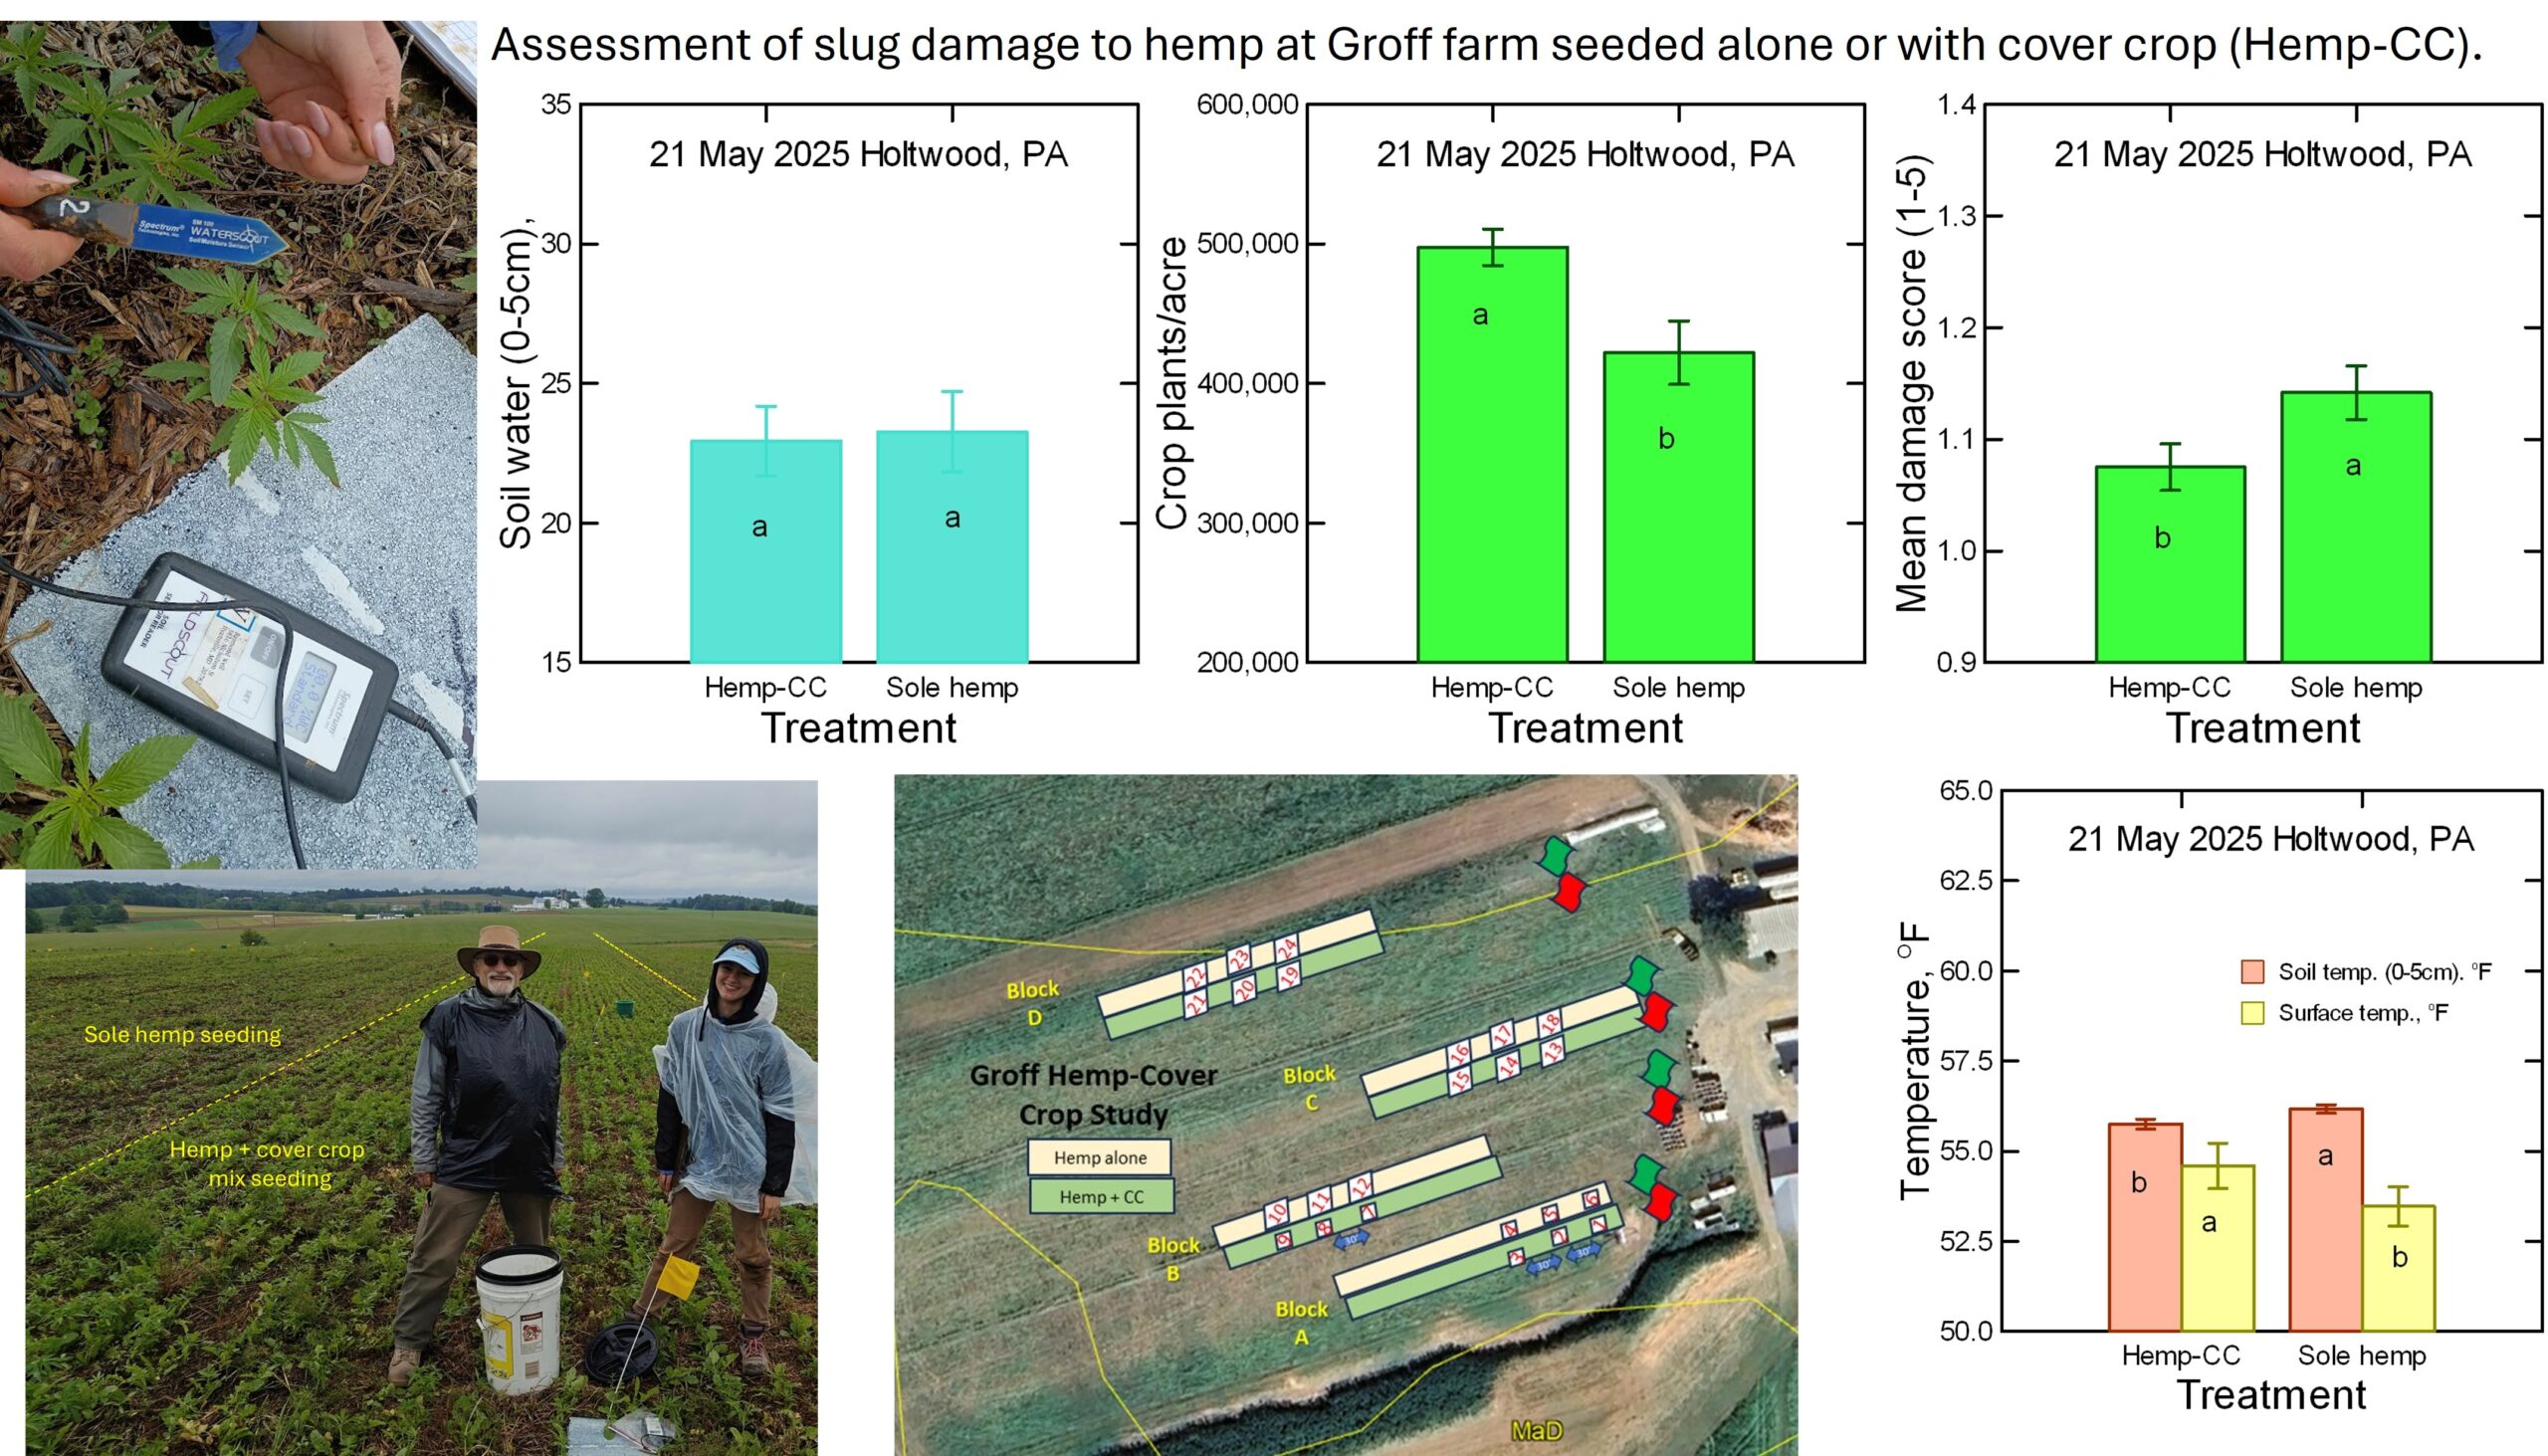
Although planting the mixed hemp - cover crop seed did not affect soil moisture, which was uniformly high, it did affect the temperature data. The land surface temperature measured with an infrared sensor was several degrees Fahrenheit warmer in the hemp cover crop mixture than in the sole hemp strips. In contrast, the 0-2 inch soil temperature was slightly but significantly warmer in the sole hemp compared to the hemp-cover crop mixture. We found significantly more damage to the sole hemp than to the hemp planted with a cover crop. We also found that the stand count for the hemp planted with a cover crop was about 60,000 plants greater per acre (474,418) than where the same seeding rate was used in the sole hemp (414,389). When we showed this data to Steve, he replied,
"We planted 800,000 seeds per acre, but a 50% stand establishment is fairly normal for him. This is interesting info - thanks for doing this!"
Steve ended up getting a bumper harvest of industrial hemp, but he said it would be logistically impossible to harvest the hemp separately from the research strips, so we do not have comparative yield data.
Jim Lewis established three replicated pairs of strips to make a comparison that was of interest to him. Jim chose a field that had been seeded by airplane in the fall with a mixture of wheat, triticale, and radish. This field has sandy coastal plain soils, but is equipped with a center pivot irrigation system to supplement the growing-season as needed. Jim compared two treatments: a mid-kill treatment that sprayed glyphosate to burn down the cover crop on April 22, eight days before planting soybeans. He compared this to three replicated strips of cover crop he left unsprayed and planned to plant green. We visited the farm on May 1st to lay out slug shingles and on May 2nd to count slugs and assess the soybean stand and damage. There was a small amount of slug damage on the cotyledons of the newly emerging seedlings. However, as the soybean seeds were still emerging, the stand counts were not conclusive. We returned to the site on May 21, after a rainy day, and found a significant number of slugs as well as slug damage to the seedlings. On this date, the cover crop in the mid-kill strips was completely dead and provided little groundcover, but the late-kill strips still had green, living triticale and wheat beginning to head out (See Figure 19). We measured a considerable difference in temperature with the still green late kill cover crop strips being 4° F warmer in the upper 2 inches of soil and about 2° F warmer on the surface. The mid-kill strips with the dead cover crop had wetter 0-2 inch soil with 22% water by volume, as compared to 18% in the still-green late-kill strips. There was no difference in soybean stand between the two treatments, with both having about 93,000 plants per acre. There was also no difference in the average soybean damage score, which ranged from 1 to 3 on a scale of 1 to 5. When we reported this data to Jim, he replied,
"I'm thinking about not spraying the planted-green beans. It's only going to be three weeks, and I'll put herbicide on the entire field anyway. The (cover crop in) the green-planted beans isn't that thick. The glyphosate application is around $15 per acre. That's worth 1.5 bushels of beans. If both treatments yield the same, I'm $15 ahead on the planted-green. What are your thoughts?"
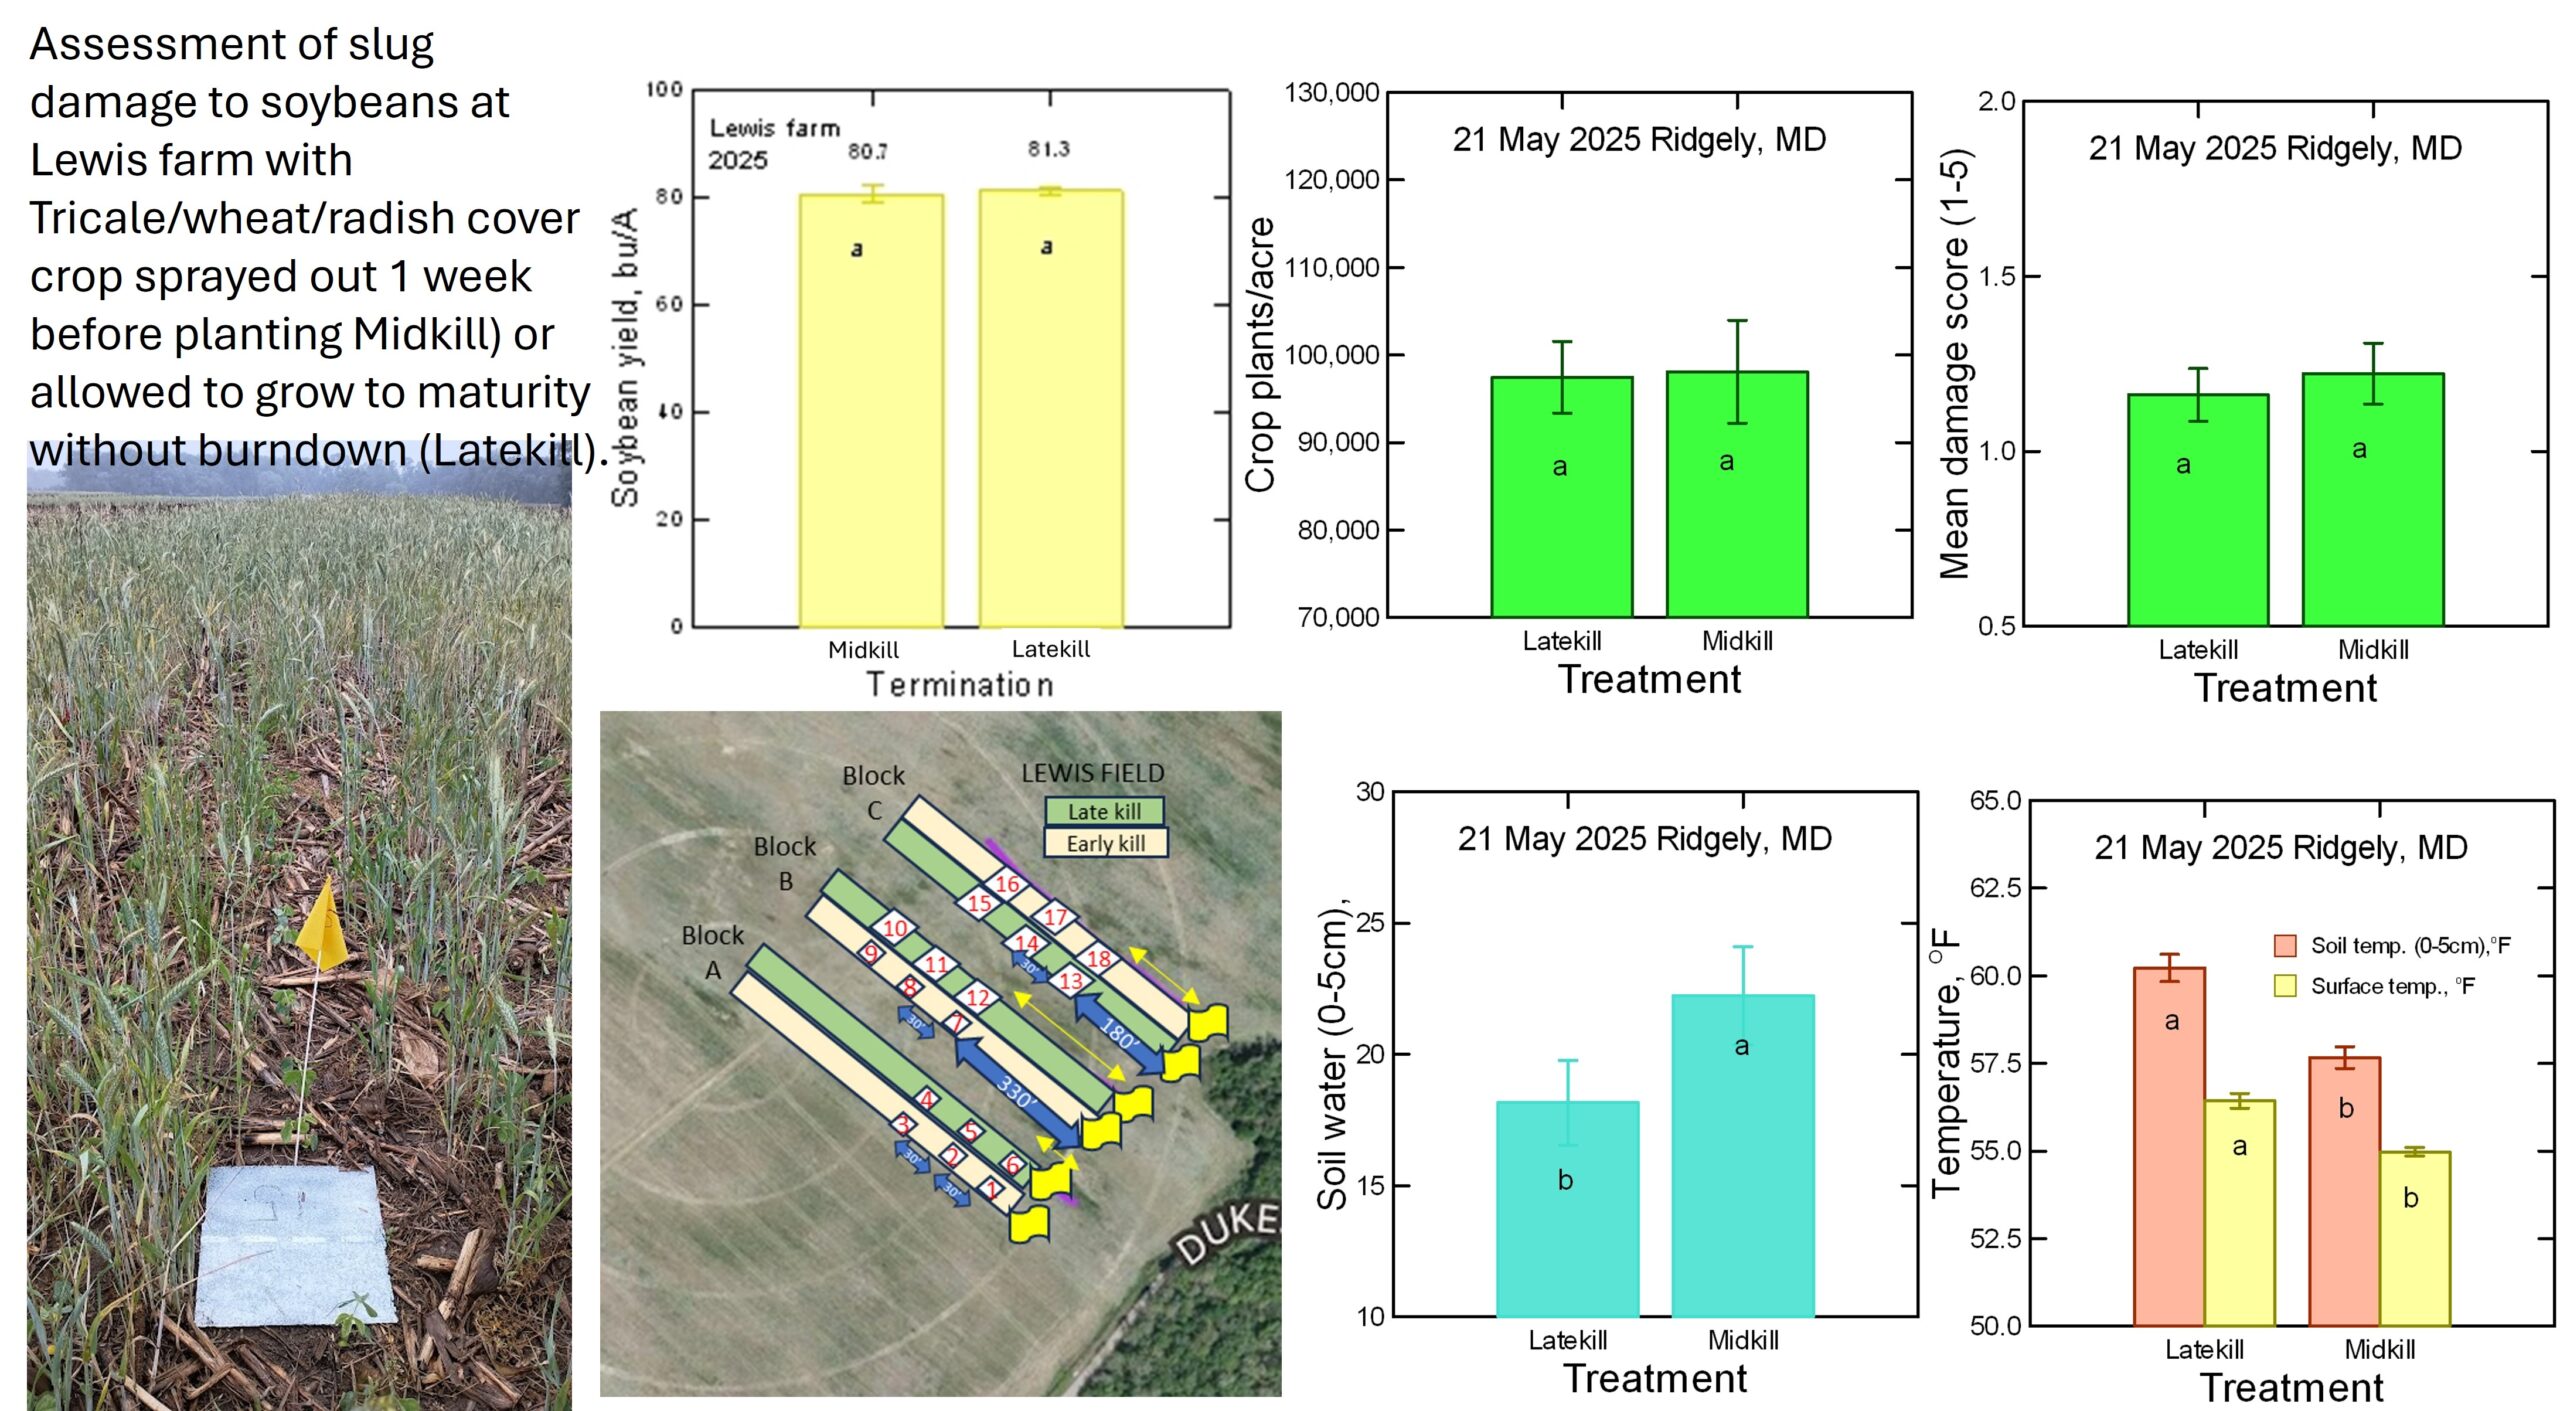
After this discussion, Jim decided not to spray those strips to see how the soybeans would perform when the wheat - triticale cover crop was allowed mature and senesce. When Jim combine-harvested the soybeans in fall and sent me the weights, the two treatments were almost identical in yield: 80.2 bushels/acre for the mid-kill sprayed cover crop treatment and 81.3 bushels/acre for the ‘late-kill’ planted-green unsprayed cover crop treatment. So, Jim was right, he would make more money from the planted green unsprayed cover crop. To be clear, this would work where a cereal cover crop stand was not too dense and had reached boot stage while the soybeans were still young (V1-2), so that the cereal would mature and senesce soon enough to cause minimal competition. Figure 19 includes a photo to show what the cover crop looked like when we assessed soybean damage on May 21st.
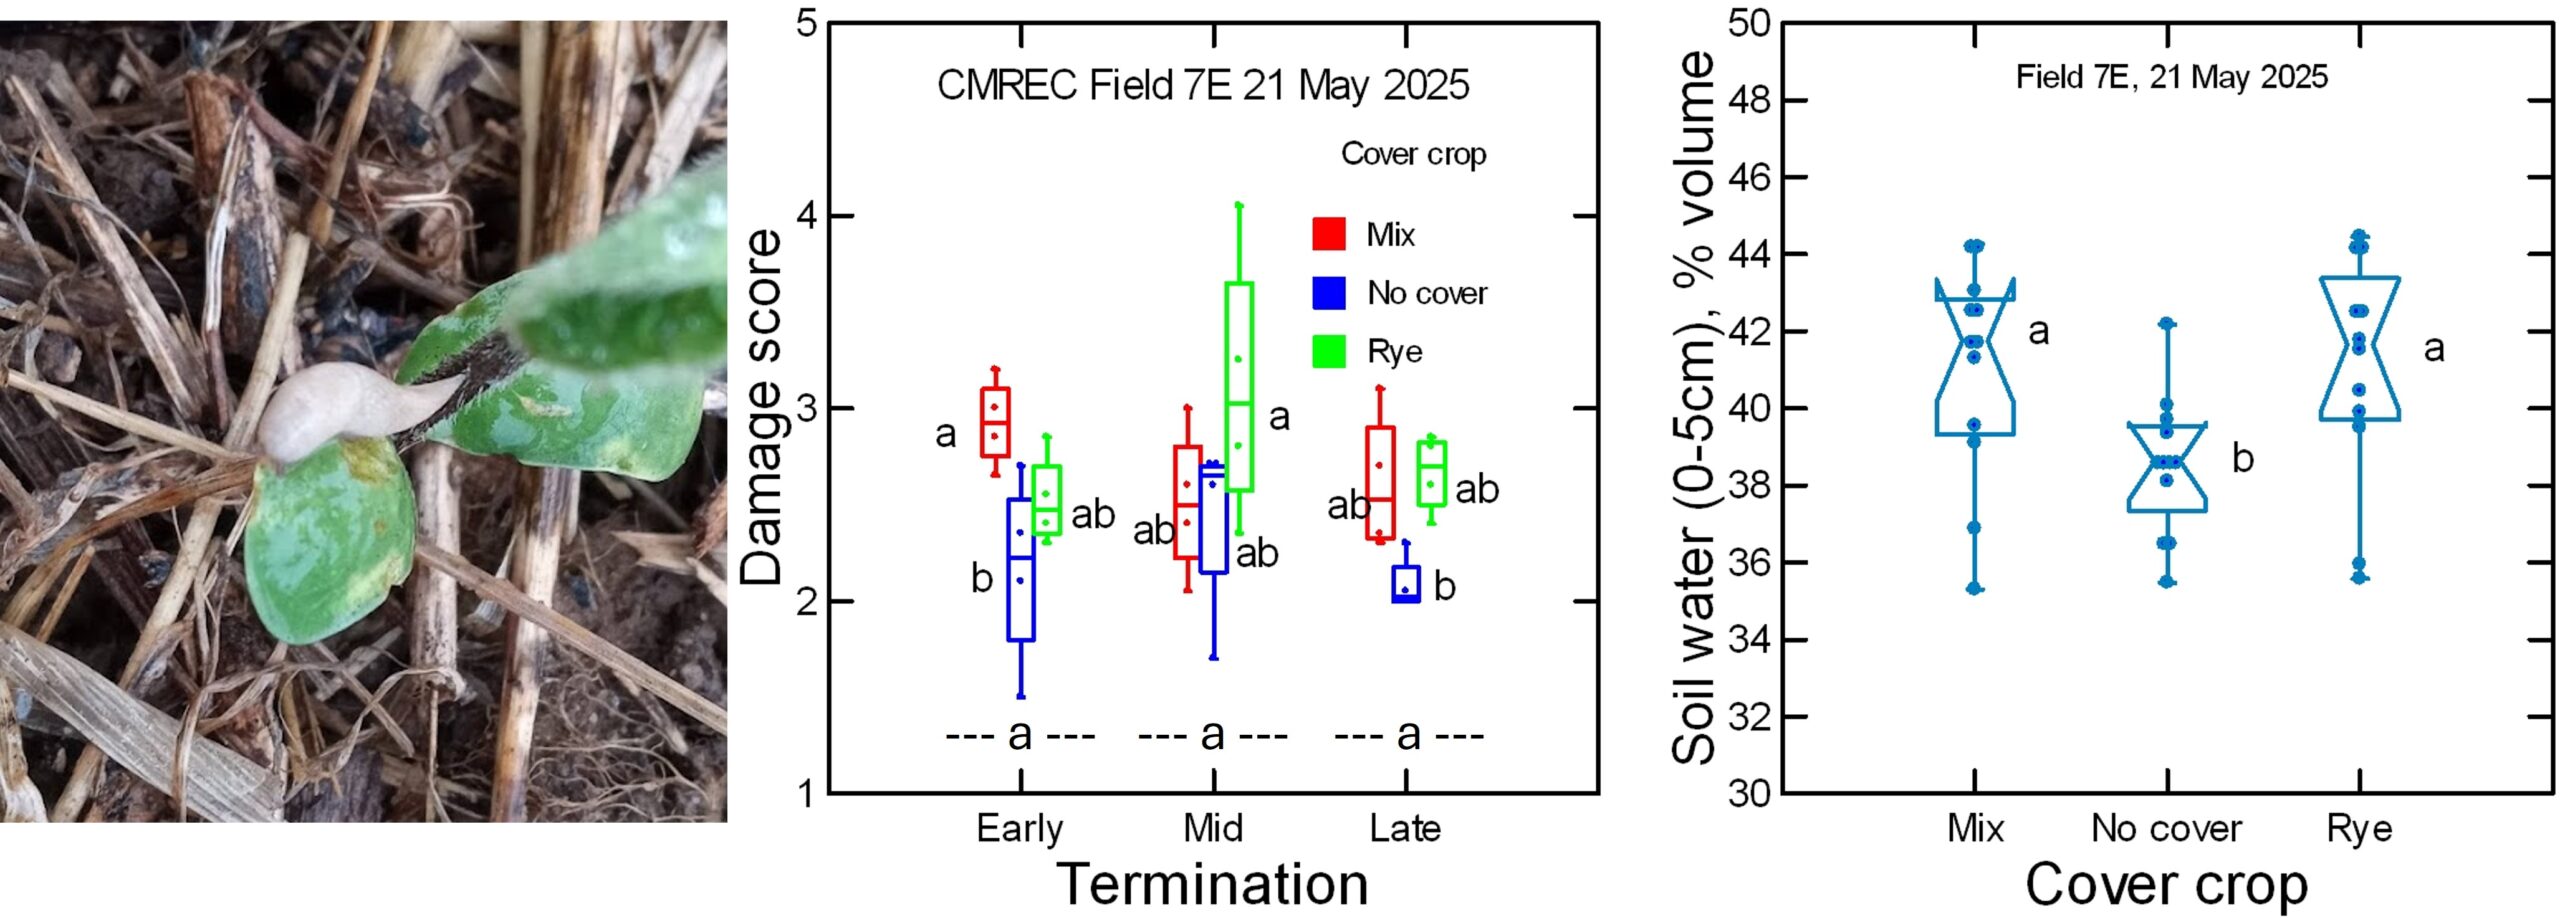
On a slug -infested, somewhat poorly drained soil at the University of Maryland research farm near Beltsville, Maryland, we assessed slug damage as affected by three cover crop treatments and three cover crop termination times. The environmental conditions and slug damage were assessed on May 21, the same rainy day that others on the project team were assessing slug damage on the collaborating farms. Soil conditions were very wet with volumetric water contents averaging 38% in no-cover plots and 42% in the cover-cropped plots. Soybeans in this field were planted green on May 3. Overall, there was no effect of cover crop early, mid, or late termination timing on the soybean slug damage scores, which averaged about 2.5 on a 1 - 5 scale (Figure 20). There was a cover crop effect only for the early termination plots, where the damage score was slightly, but significantly higher for the mix cover crop (rye + clover + radish) than for the no-cover control. No other cover crop or termination timing treatment combinations had slug damage scores that differed from the controls.
Overall, in 2025, our project added three site-years of slug damage data to the seven site-years previously collected during and just before this project funding began. Across all 10 cumulative site years, we consistently found no evidence that allowing cover crops to grow later and planting green into them worsened slug damage to crop seedlings. In fact, in some cases, the plots with late-terminated cover crops had significantly less slug damage. There were also very few instances where cover crops were associated with more slug damage than control plots without cover crops. However, this is not to say that a no-till environment does not favor slugs. All of our plots, except those on Steve Kraszewski's farm, which is organic, were in long-term no-till. No-till soils are permanently covered with decaying plant residues that provide habitat for a wide range of faunal species, including many beneficials. However, they also provide habitat for slugs, which can be damaging to crops. There is no question that a bare, tilled soil is less hospitable to slugs, as well as to earthworms and other beneficial fauna. However, our data show that in no-till systems, there is little risk of greater slug damage being caused by allowing cover crops to grow up to or even beyond the cash crop planting date.
Cover crop performance in 2025.
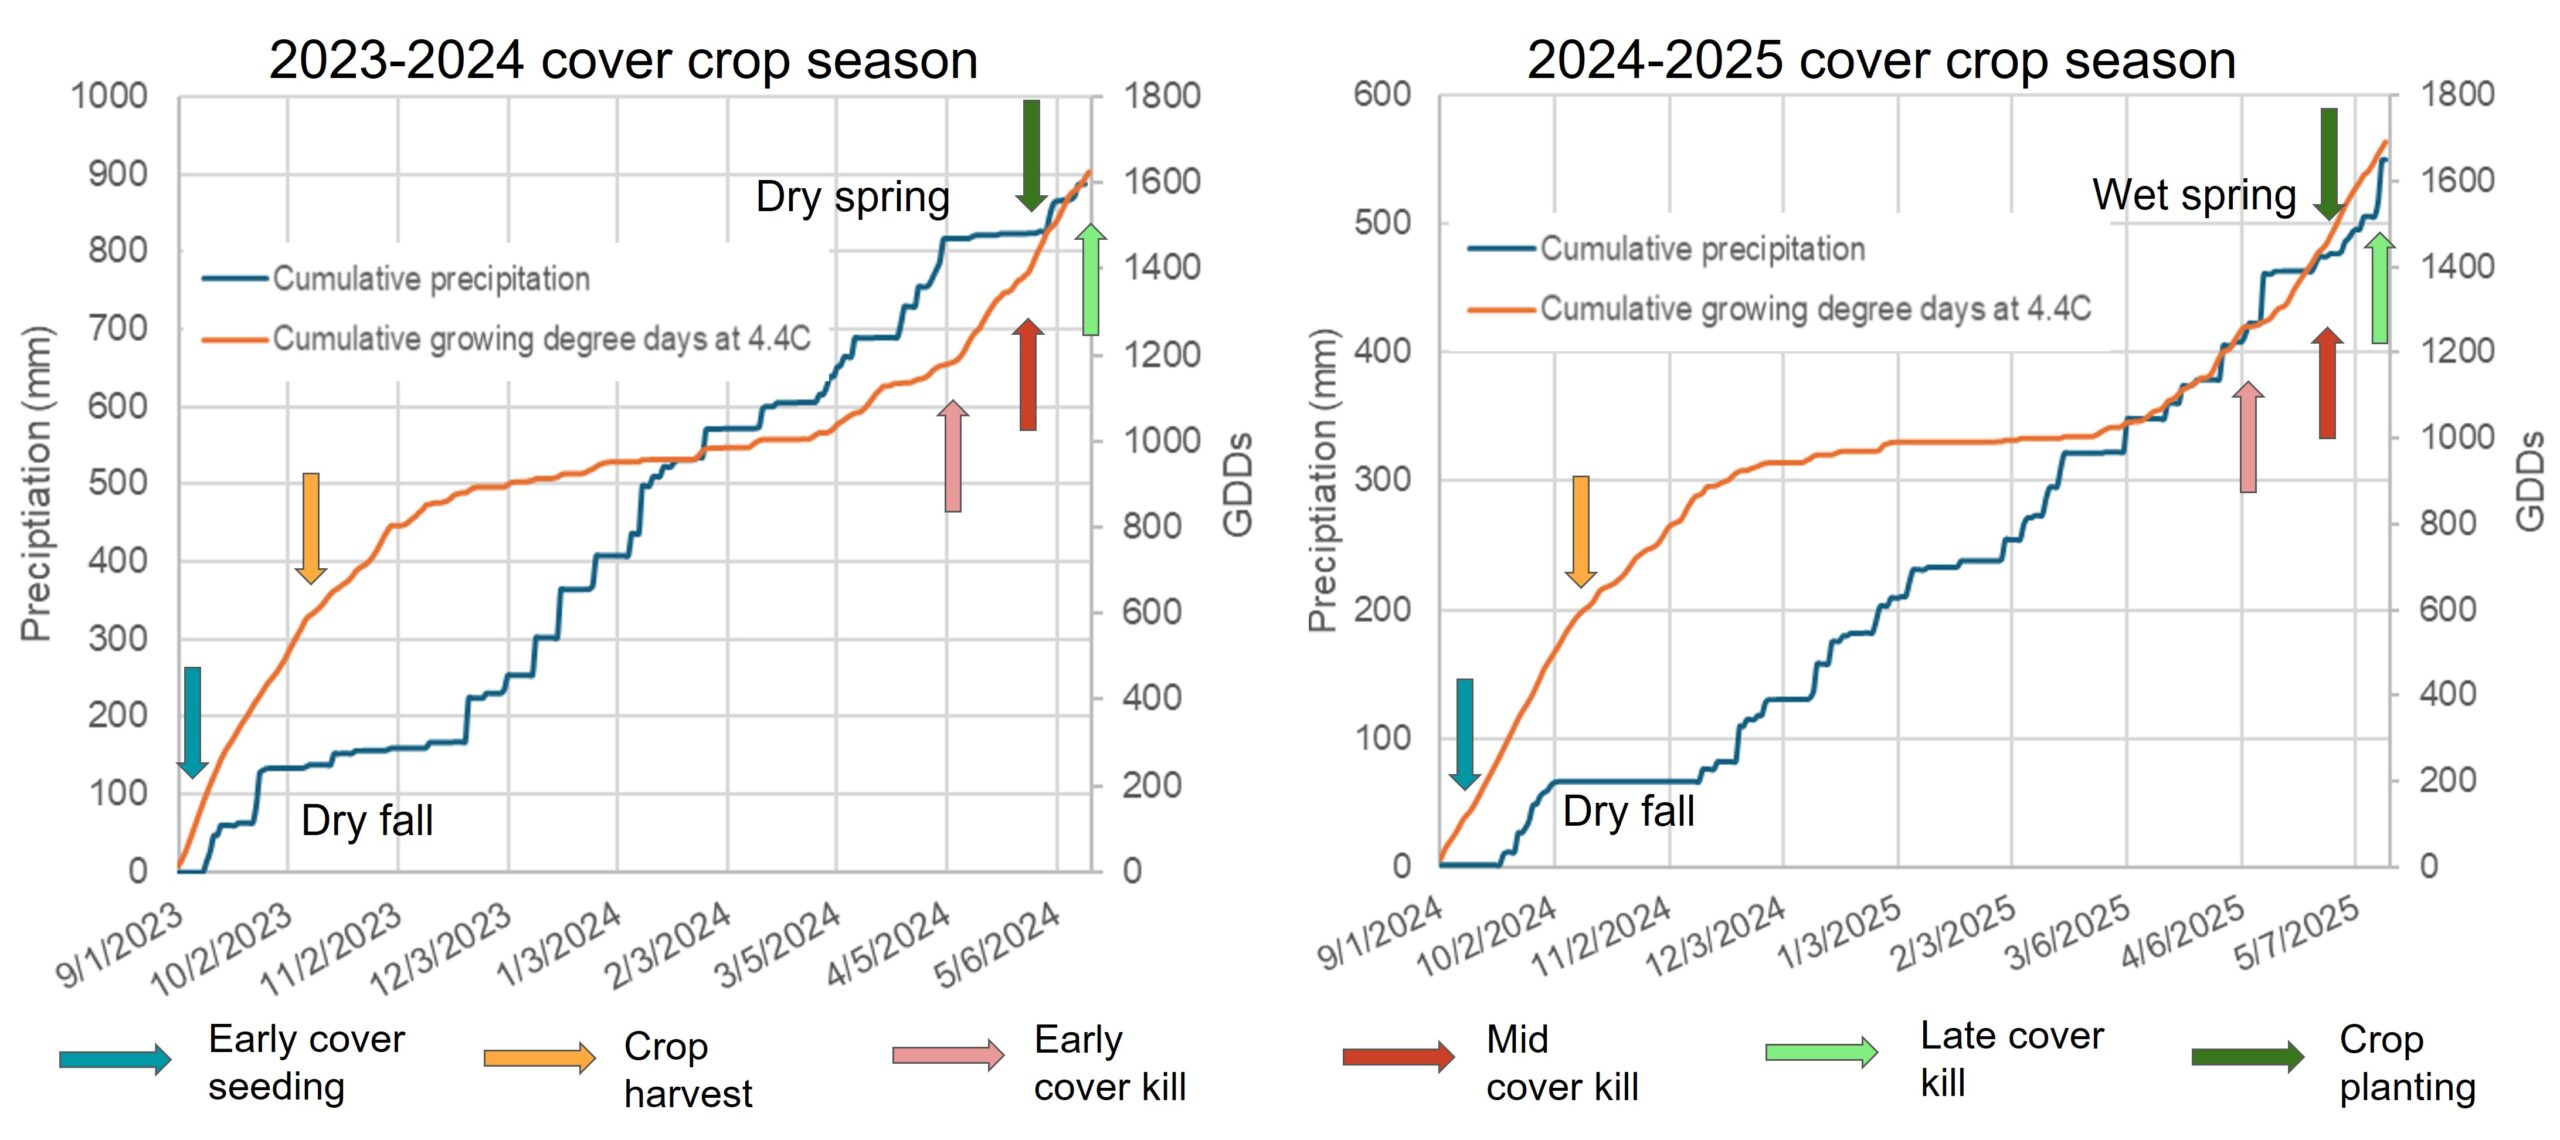
As can be seen from the precipitation and temperature data in Figure 21, the 2024-2025 cover crop season was much drier than the previous year's, but temperature patterns were quite consistent from year to year. The figure shows that the cumulative growing degree days (GDDs, based on a minimum temperature for cover crop growth of 40 °C) in 2024-2025 were almost identical to those of the previous year. The arrows in the figure indicate the timing of such operations as the interseeding of cover crops into standing crop canopies before harvest in fall, and the planting of cash crops into standing cover crops before the mid- and late-termination in spring. In both 2023 and 2024, conditions in the fall were quite dry with almost no rainfall in October. These dry fall conditions affected cover crop establishment from broadcast interseeding and limited their fall growth. Nonetheless, the graphs in Figure 21 also show that approximately 500 GDDs were gained by planting the cover crop seeds into standing crop canopies and not waiting to drill them after crop harvest. An additional 350 to 450 growing degree days were gained by delaying spring termination until planting or a week or so after planting.
In spring 2025, we measured the above-ground cover crop productivity by collecting 50 x 50 cm (0.25 m2) quadrats of shoot tissue clipped 1 cm above the soil surface. We collected these samples within one or two days of the early, mid, and late cover crop terminations. We also sampled the volunteer weeds growing in the no-cover crop controls. We are interested in measuring the cover crop dry matter because the amount of plant dry matter produced is expected to directly impact many of the benefits provided by cover crops, whether the recycling of nutrients, protection from erosion, conservation of water, or enhancement of soil organic matter and aggregation.
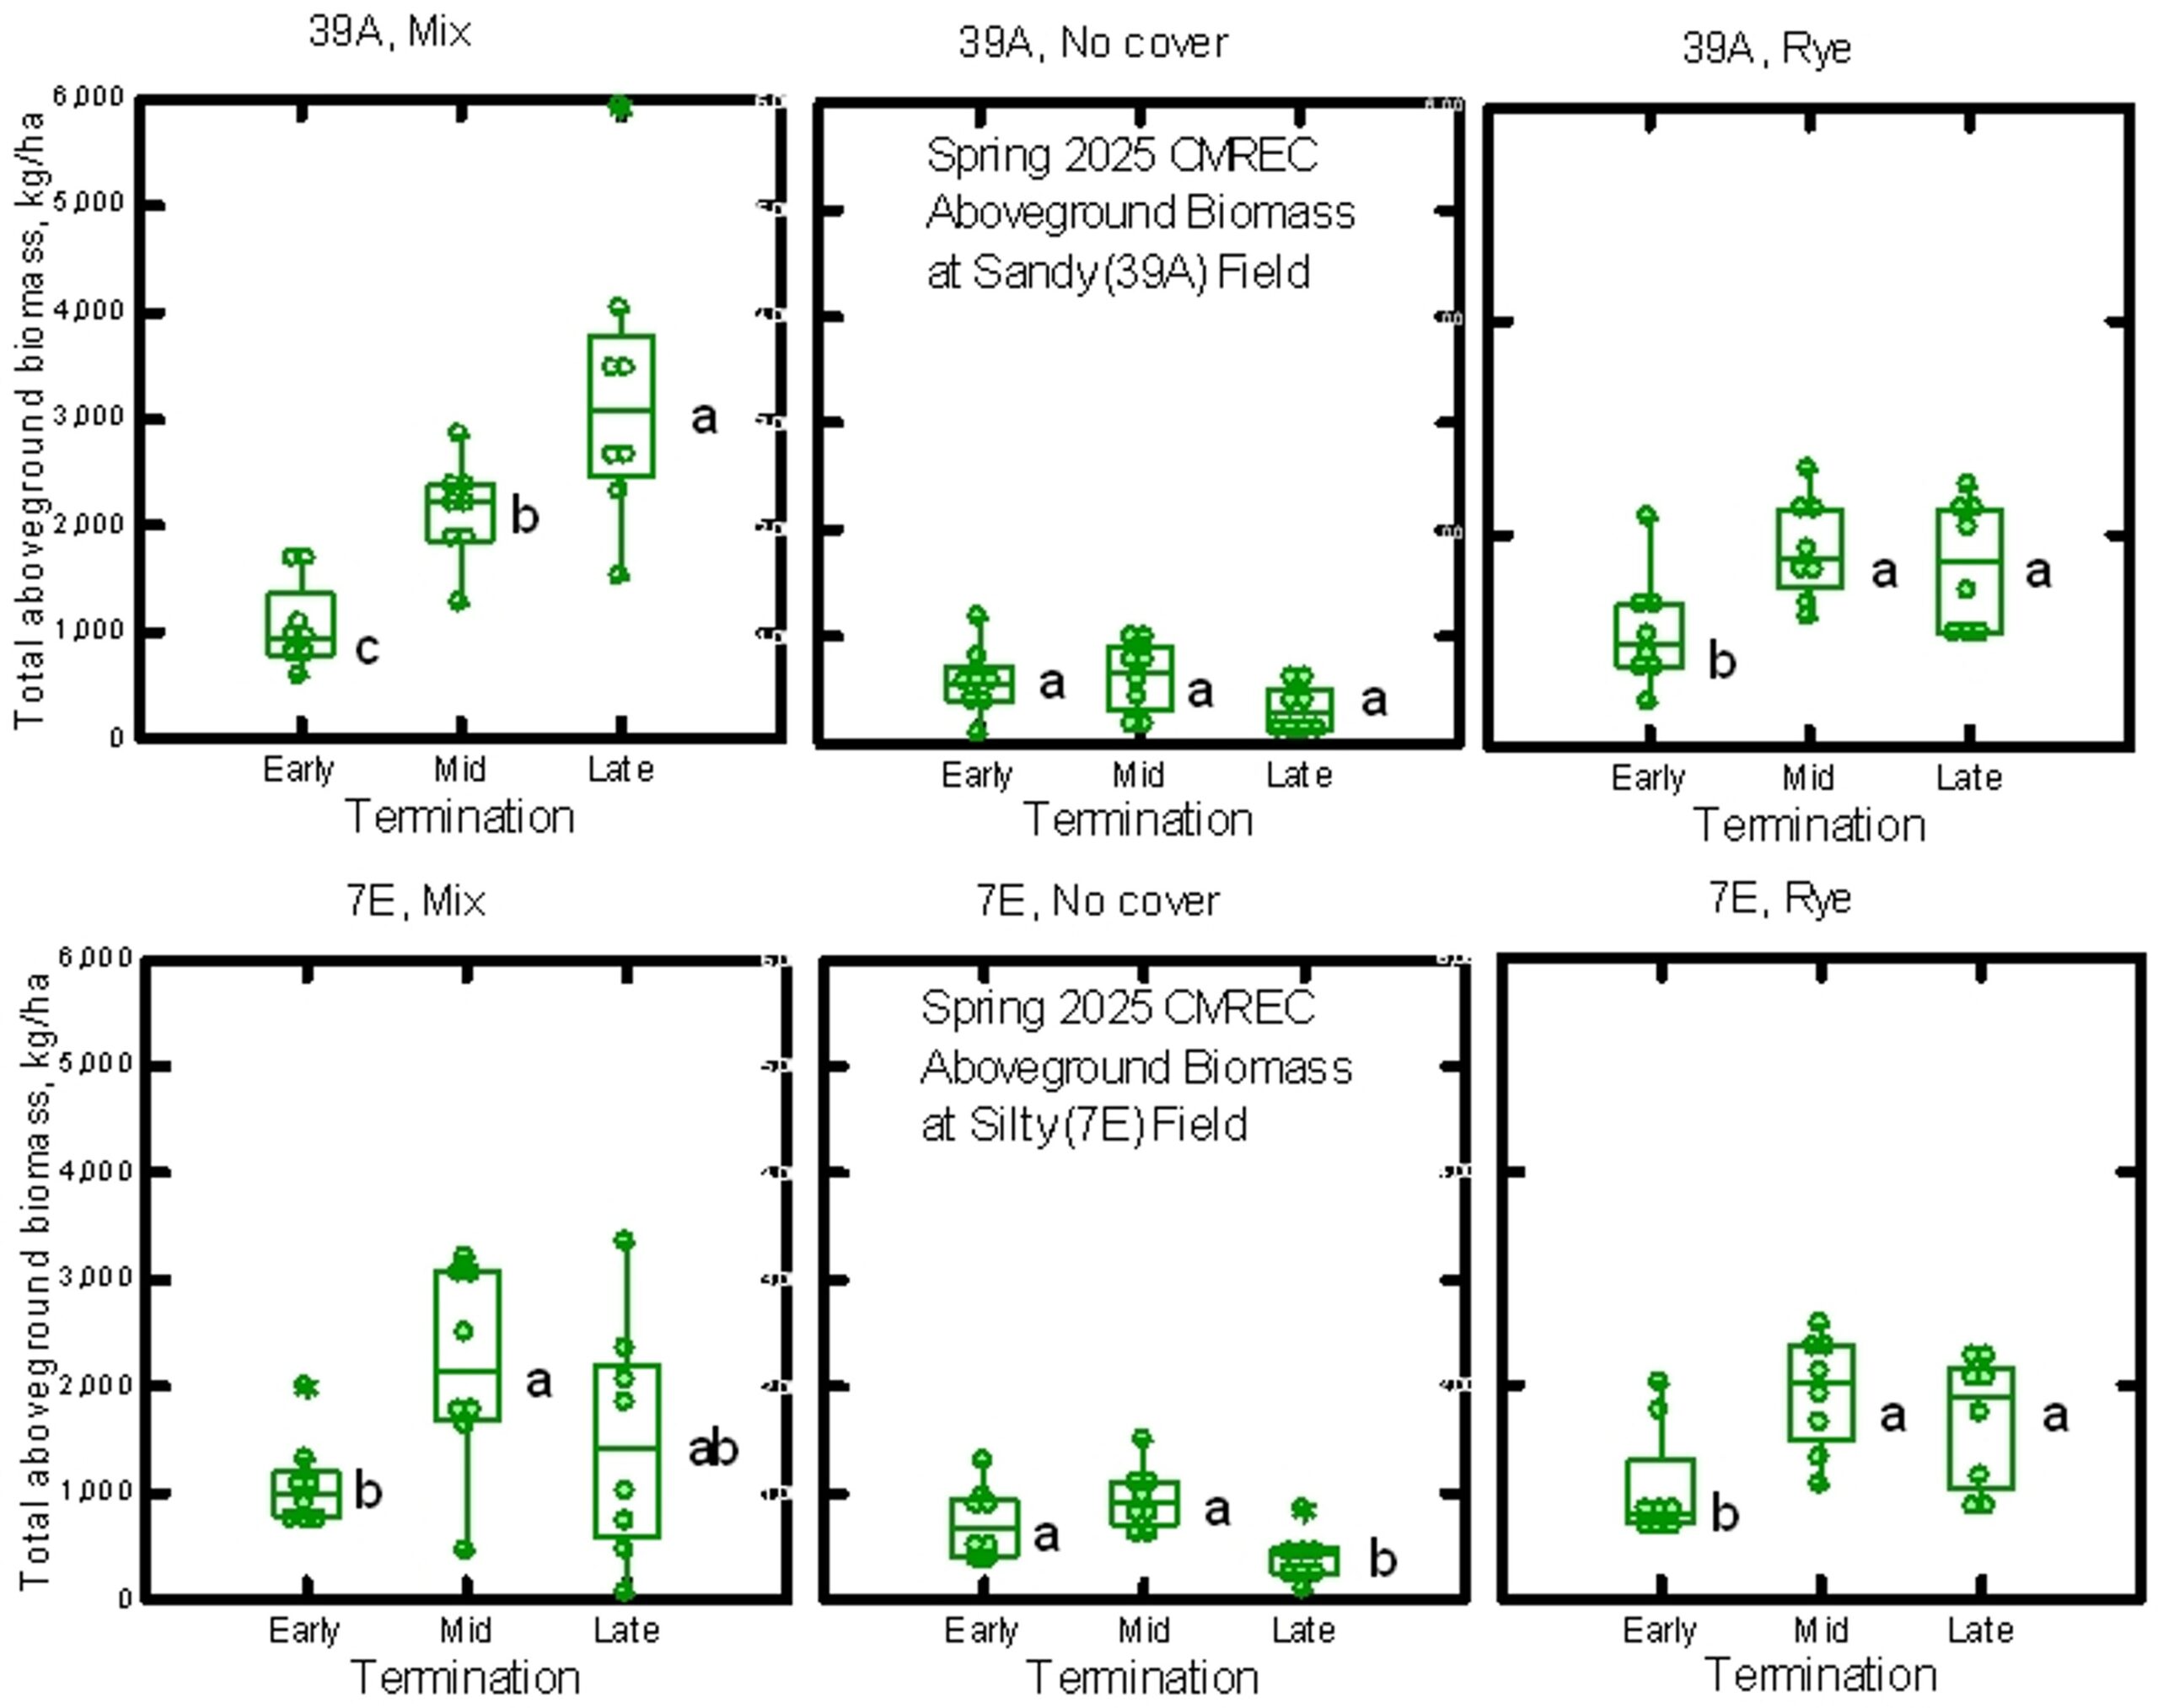
Spring 2025 cover crop biomass was relatively low due to a slow start and uneven stands caused by the dry conditions in the fall of 2024. The highest biomass was produced by the mixed species cover crop in the sandy field (Field 39a, upper left panel in Figure 5 ). For that cover crop, which was dominated in spring by crimson clover, biomass increased about 1000 kg per hectare between each of the termination times, with the late-terminated cover crop averaging slightly more than 3,000 kg per hectare of aboveground dry matter. The rye cover crop in the same field followed a similar pattern, with the early and mid-terminations, but leveled off and did not increase between the mid and late-terminations. Weed biomass in the control plots did not change significantly between early and late termination timing and was approximately 500 kg per hectare in the sandy field. In the silt loam field (7e, lower three panels in Figure 22), the cover crop biomass was very similar to that in the sandy field, except that the mixed species dominated by clover did not increase between the mid and late-terminations. By the time corn and soybeans were ‘planted green’ into the cover crops, the biomass in both types of cover crops was approximately 2,000 kg per hectare.
Cover crop root dry matter and root-to-shoot ratios in 2025.
Only a fraction of published cover crop studies report the above-ground biomass produced by cover crops, despite the importance of biomass data for interpreting the effectiveness of cover cropping practices. A much smaller fraction of cover crop studies report the below-ground dry matter produced by cover crop roots. The root dry matter is important to understand because roots are about twice as effective as shoots in contributing to stabilized soil organic matter, and roots are responsible for directly feeding the soil biology through sloughed-off cells and root exudates. The chemical composition of roots is also expected to be quite different from that of the shoots, with roots being characterized by organic compounds such as suberin and by dramatically different concentrations and ratios of nutrient elements. In most plant growth and carbon sequestration models, the root biomass is estimated from measurements or modeling of shoot biomass using a set root-to-shoot ratios for a particular type of cover crop. One of the objectives of this project was to determine whether there was a root-to-shoot ratio characteristic of a particular cover crop or whether these ratios varied with conditions and stage of growth.
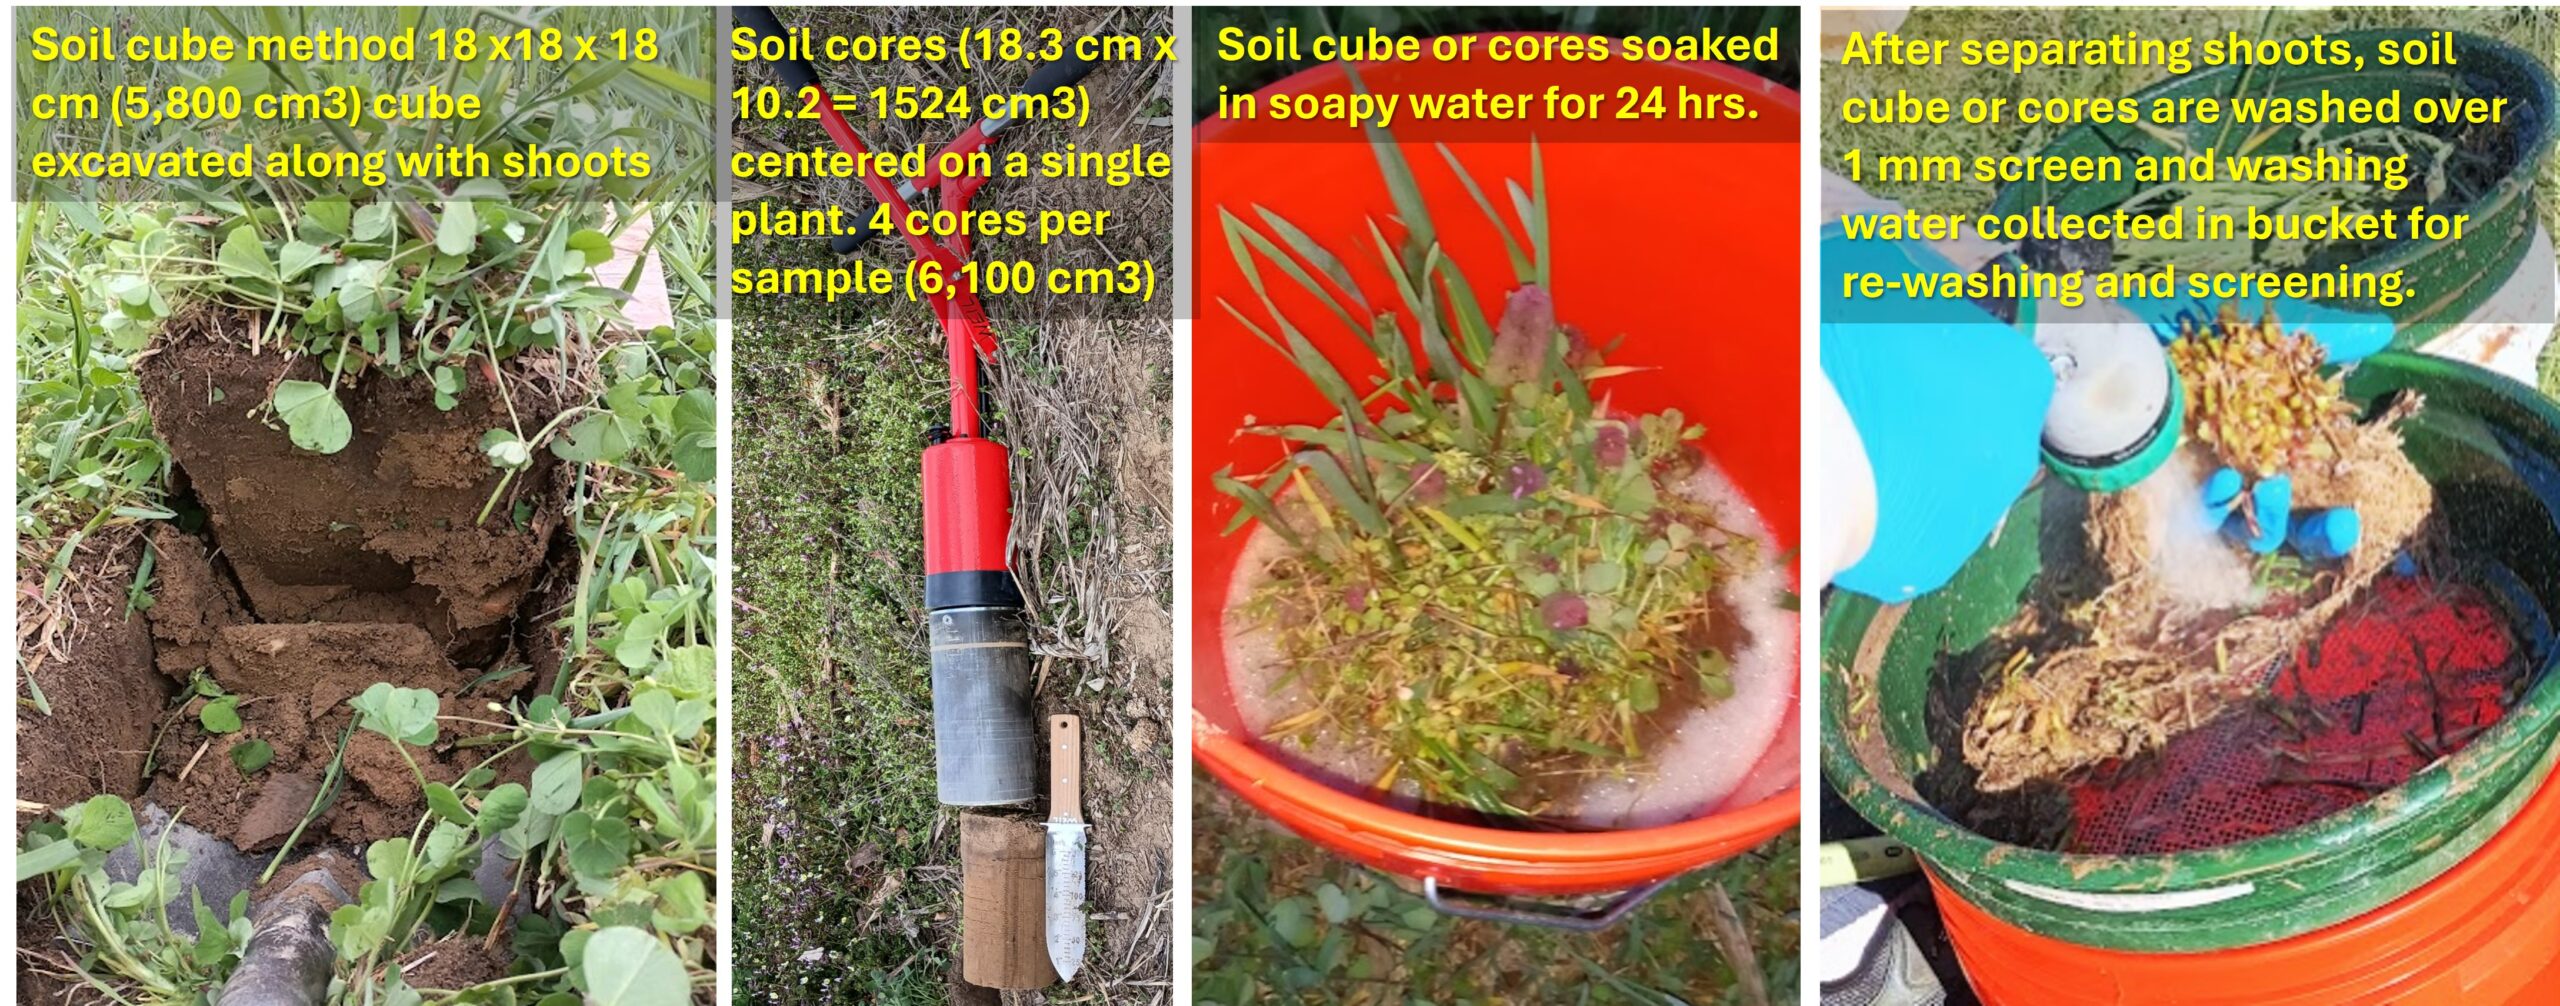
We used two different methods of sampling cover crop roots and calculating the root-to-shoot ratios (see Figure 23). In spring 2024, we sampled cover crop roots and shoots using the soil cube method, by which a cube of soil is excavated to a depth of 18 cm using a flat square spade. In the spring of 2025, we repurposed a large coring device originally designed to cut holes for golf course cups. This device obtained a core that was 20.3 cm deep and 10.2 cm in diameter. We obtained four such cores per sample, each core centered over an individual plant or clump of plants of either crimson clover or rye. One cube or four cores of soil and roots were soaked in soapy water for 24 hours to loosen the soil from the roots, and then washed under high pressure spray of water using screens and collecting the wash water in buckets. After washing, the roots and associated shoots from each sample were dried 65° C to a constant weight, and the dry weights were recorded. The dry root and shoot samples were ground through a 1 mm mesh for further analysis. The labor-intensive nature of this task probably accounts for why the literature has far less information about the below-ground parts of cover crops than the above-ground parts.
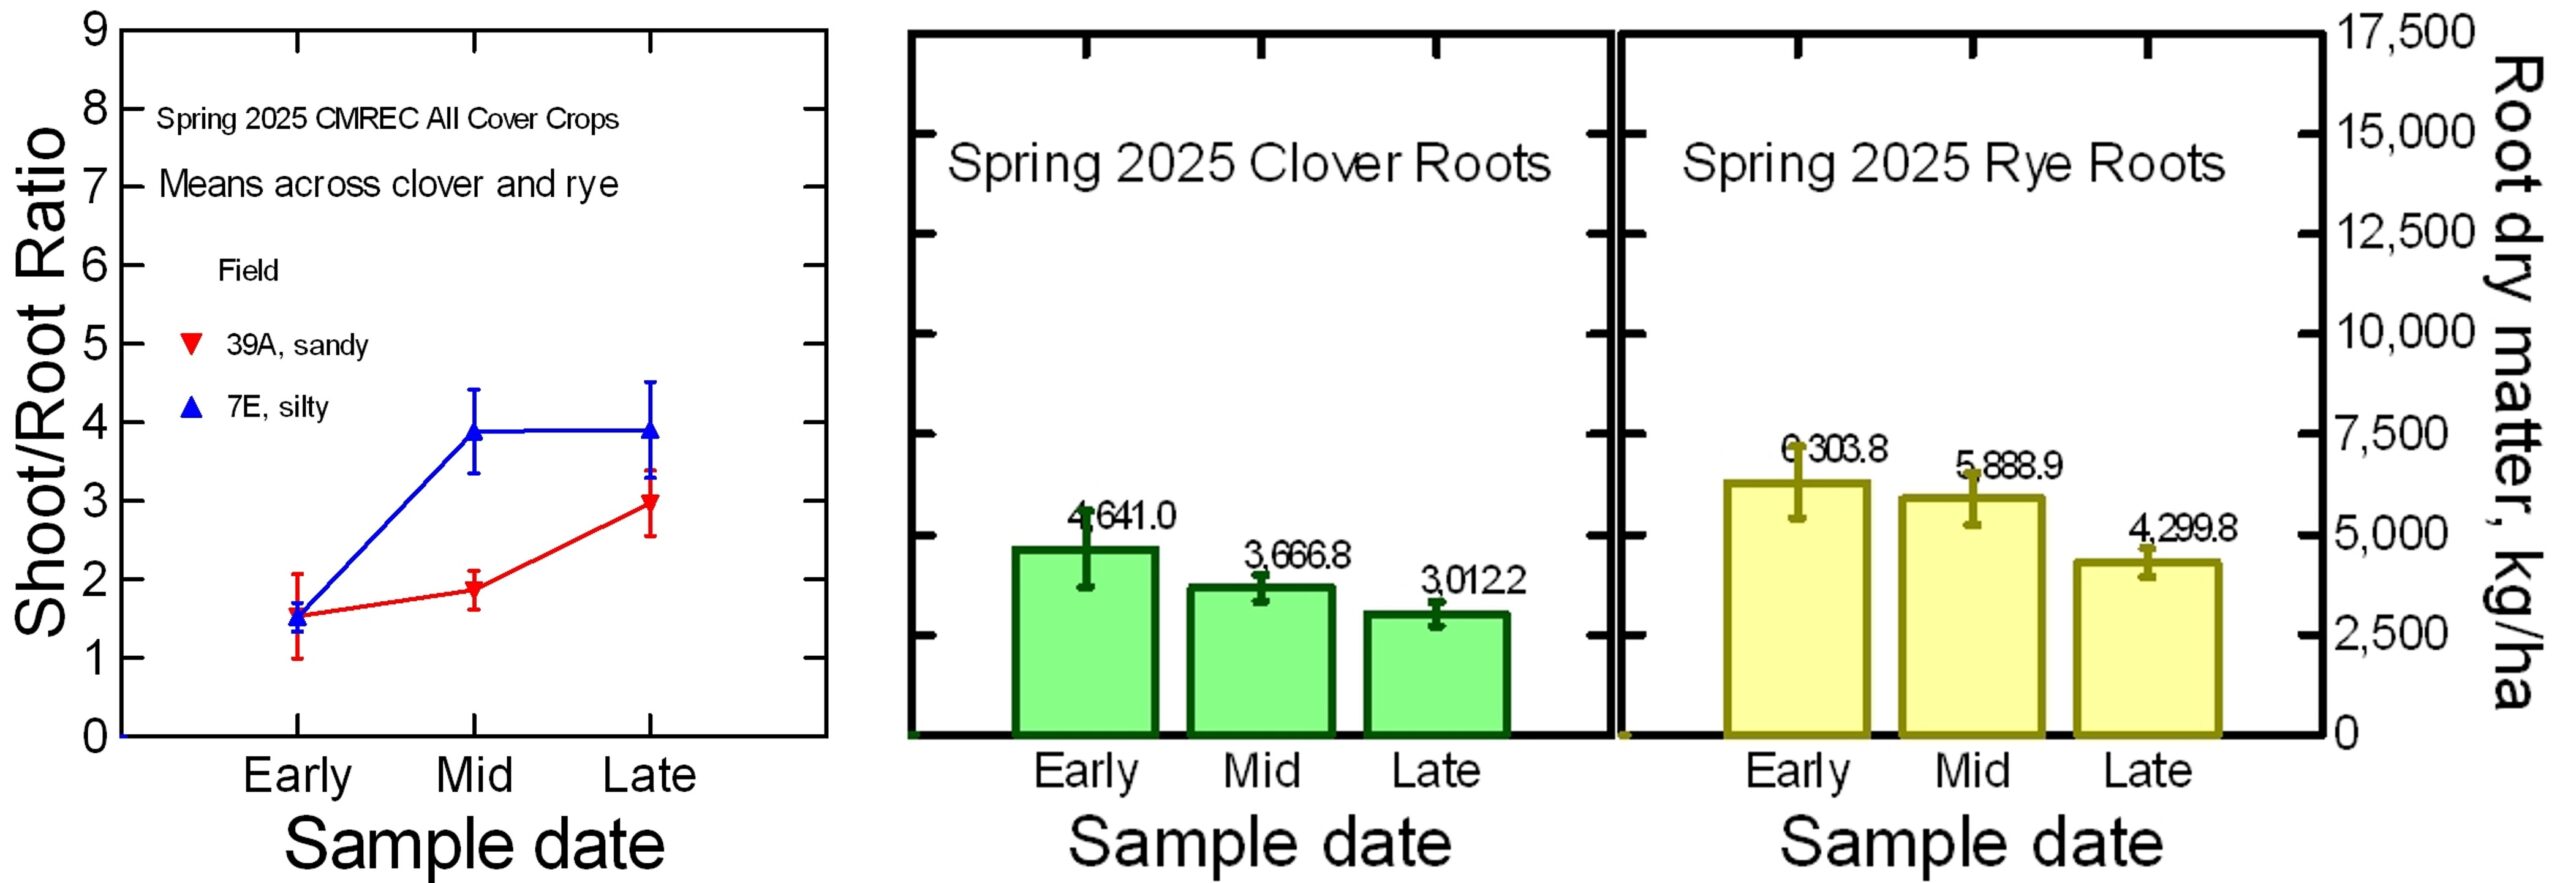
The spring 2025 dry matter data for crimson clover and rye roots are presented for each termination time in Figure 24. Note that the dry matter, expressed as kilograms per hectare, is much larger than the shoot dry matter displayed in Figure 22, where the shoot dry matter data were obtained from quadrant samples, which represented the uneven cover crop stands. The data in Figure 24 are based on soil cores centered over individual cover crop plants and therefore do not account for the plant density and uniformity. The shoot-to-root ratio data shown in Figure 24 were calculated from the shoot dry matter of the individual plants over which the soil core was centered. It is also important to note that the root dry matter at different stages of growth always represents roots from the same core volume, even though the plant's root system may have expanded to permeate a larger soil volume. Nonetheless, there were clear trends towards greater root biomass for the rye than for the clover, and less root biomass for both species as the cover crop plants matured.
The dried, ground tissue of roots and shoots associated with the core samples was analyzed for total carbon (C) and total nitrogen (N) content by high temperature combustion/gas chromatography at Penn State University Agricultural Services Lab. From these values, the C/N ratios were calculated. The tissue C/N ratio is a good predictor of how fast cover crop residues will decay after termination and whether they are likely to release or immobilize nitrogen in the soil. Residues with C/N ratios less than 20/1 reliably release nitrogen for crop plants to use, while residues with C/N ratios greater than 30/1 can be expected to immobilize nitrogen as decomposing microbes compete with crop plants for this element. Figure 25 illustrates how the C/N ratio varied between crimson clover and rye, between roots and shoots, and over time as the plants matured from early to late termination dates. The crimson clover shoot tissues had the lowest C/N ratios, increasing slightly from 13/1 at the early termination time to 16/1 and 17/1 at the mid- and late-termination dates. Interestingly, C/N ratios were considerably higher in clover roots, increasing significantly from 19/1 at early termination to just over 30/1 at the late termination. The rye shoot tissues had higher C/N ratios than the clover roots at all dates, starting near 30/1 at the early termination and increasing to 35 at the mid- and late-terminations. Most interestingly, roots of the rye plants had still higher C/N ratios, which were 35/1 for the immature plants in the early termination, but increased significantly to 44/1 by the mid- and 58/1 by the late-termination time. These root and shoot C/N ratios are similar to those reported in other studies, though the literature has very limited data on the C/N ratios of cover crop root tissue at different stages of growth.
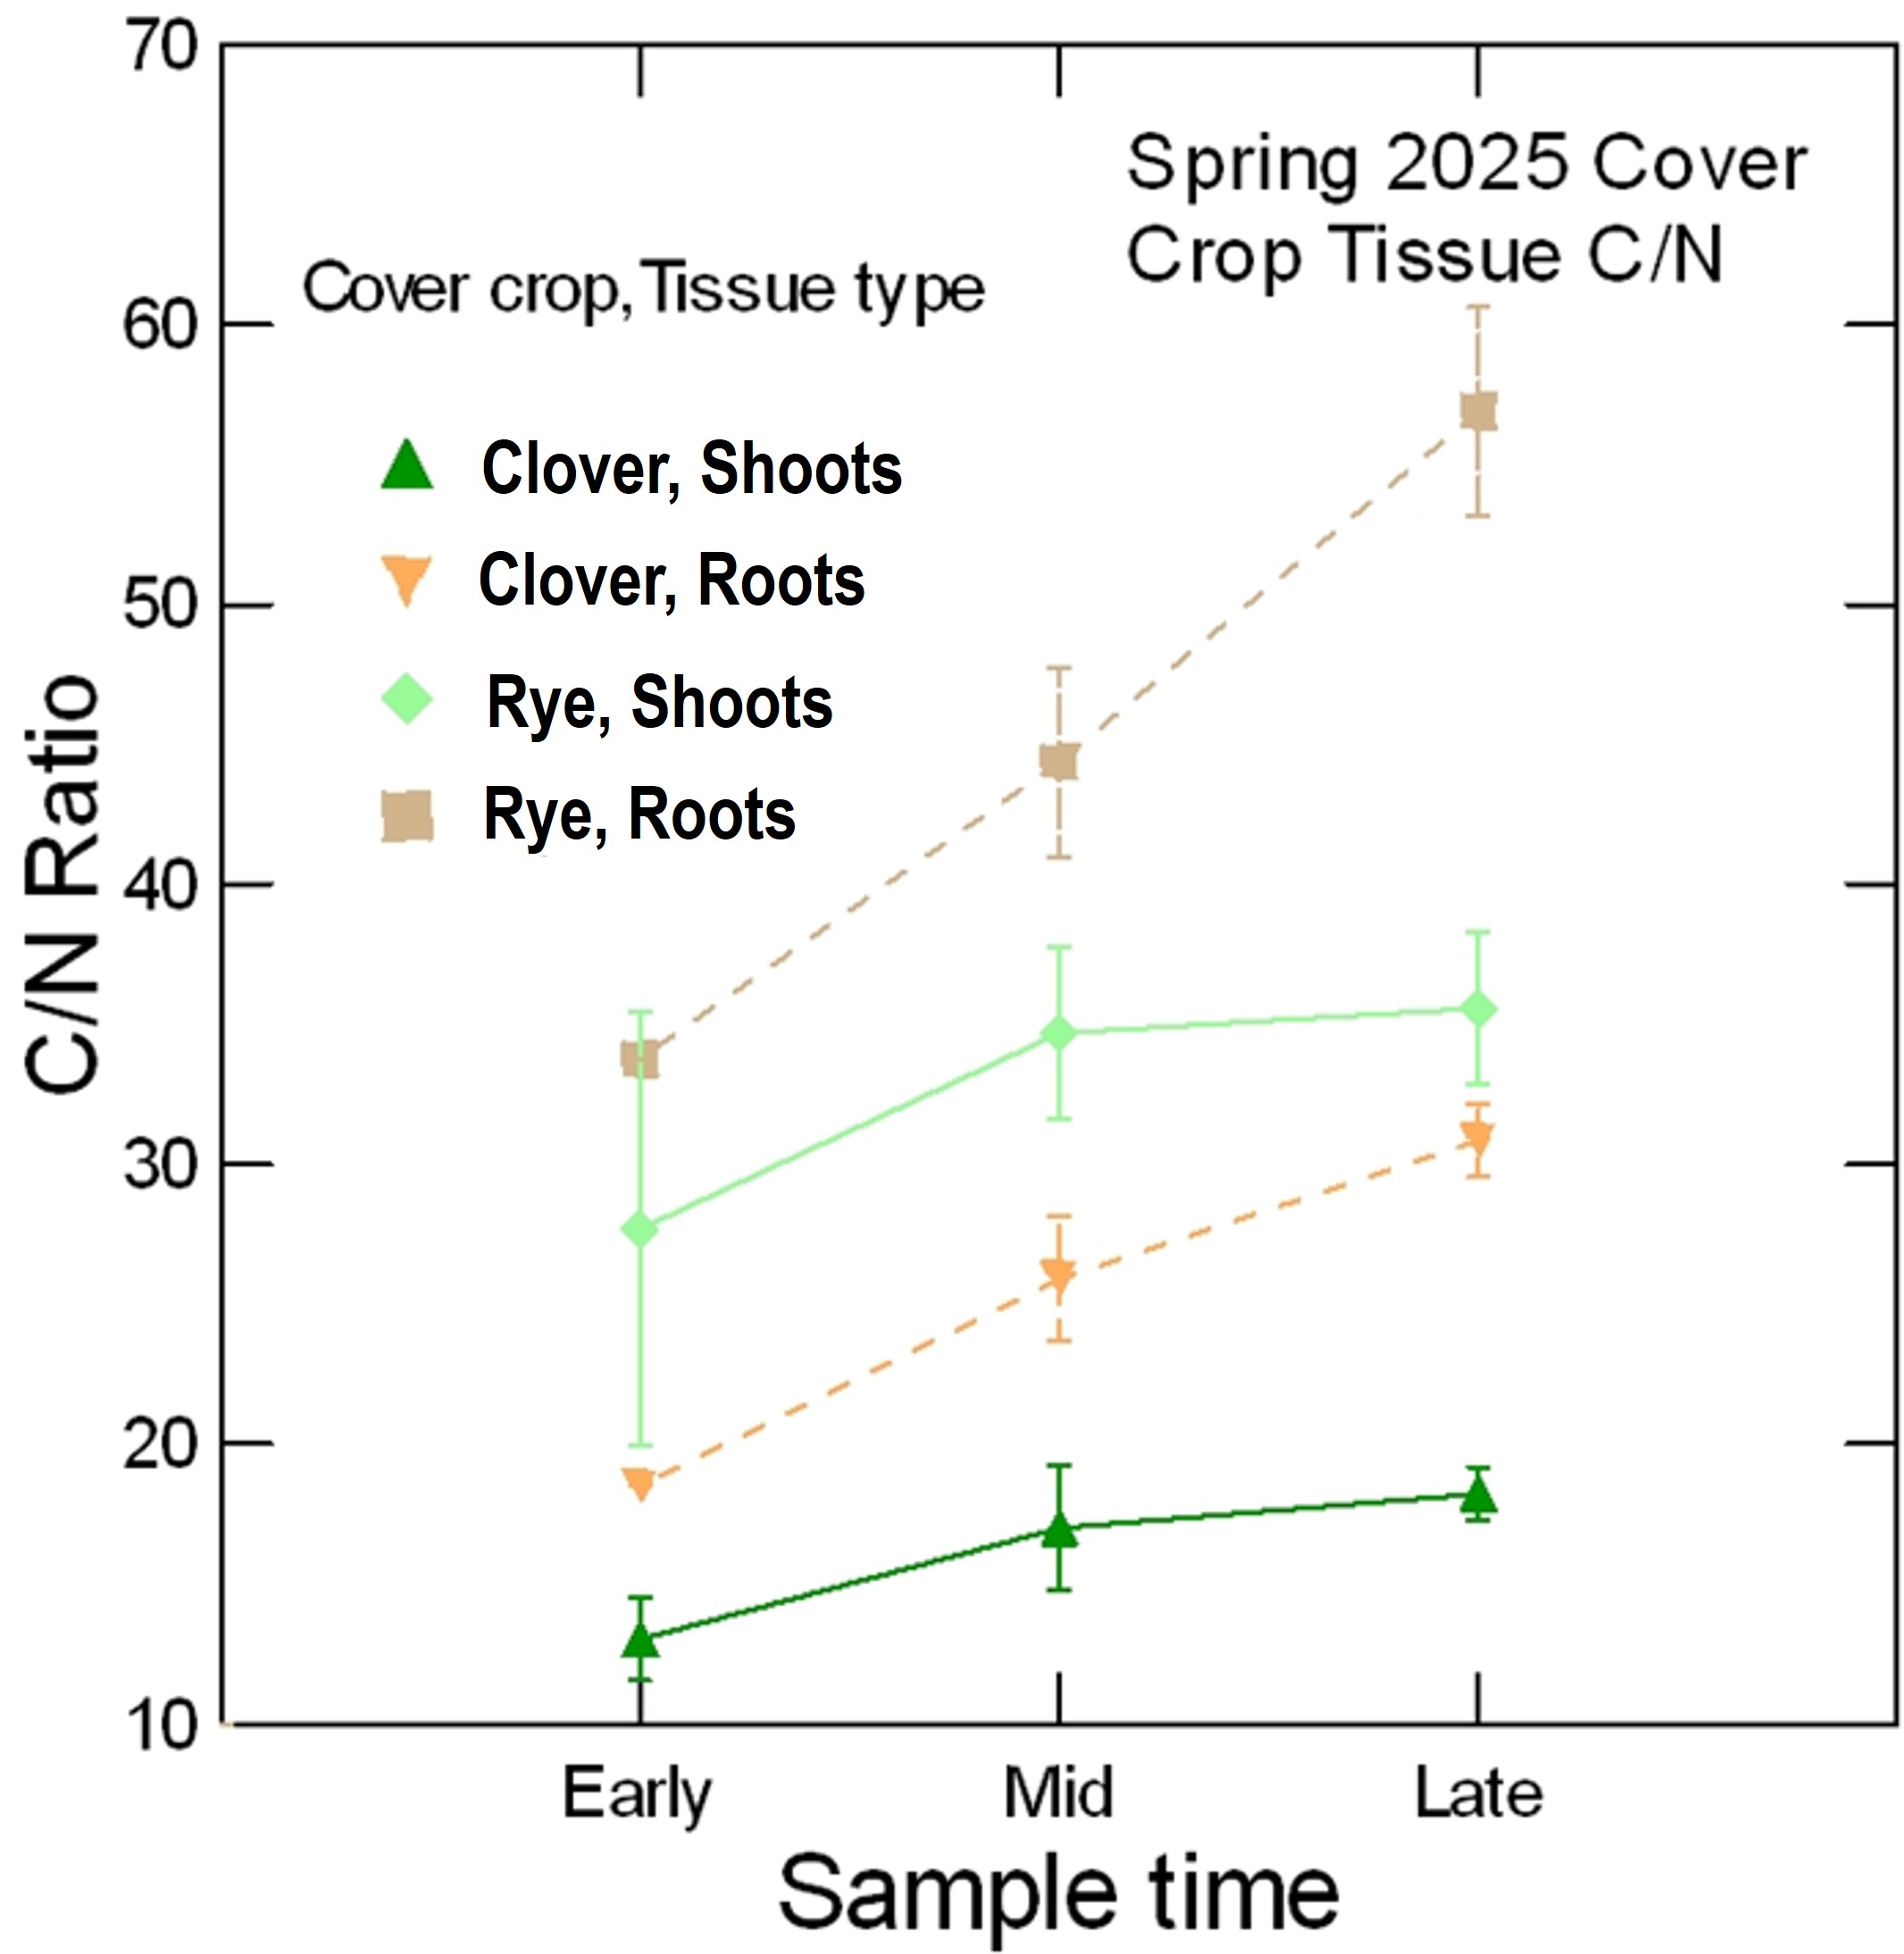
The much higher C/N ratios of the rye roots compared to shoots may help explain why rye cover crops are notorious for tying up nitrogen and reducing corn yields unless extra nitrogen is applied. The relatively high C/N ratios of even the clover roots may help explain why the amount of nitrogen that subsequent corn crops typically receive from legume cover crops is often quite disappointing relative to the total amount of nitrogen measured in legume cover crop shoots. Terminating legume cover crops by non-chemical means, such as roller crimping, requires that they be in the full flowering stage. It seems possible that the high C/N root tissue of even the legume cover crops, when allowed to grow to the flowering stage, may immobilize enough nitrogen to make a difference.
Cover crop management effects on corn and soybean yields at CMREC, Beltsville.
In 2025, the Beltsville location saw ‘normal’ growing conditions for corn and soybeans. Corn yields were good for rainfed land and were significantly higher on the sandy field than on the silty field, probably due to greater weed and slug pressure at the silty field (see slug data above).
Across the two fields, corn stand density was significantly lower but still acceptable where rye was used as a cover crop compared to where there was no cover crop or the clover-rye-radish mixture was used (Figure 26, lower left). We measured corn grain yields using two methods: by hand-harvest of two 20-ft rows in the center of each termination date subplot, and by calibrated yield monitor during the combine machine harvest of the entire area of each termination date subplot. The results were similar and reasonably well correlated. The hand harvest values were slightly higher because the hand harvest avoided obvious anomalies like skips in the planting stand or groundhog mounds. The combine harvest yield in the sandy field was 153 bushels/acre in the mixed species cover crop plots, which was significantly higher than the 135 bushels/acre recorded for the no cover plots. At the silty field, yields were slightly lower, and there were no cover crop effects on the combine harvest yield data. At the sandy field, the hand harvest gave a similar pattern with higher yields in the mixed cover crop plots than in the no cover controls. However, in the silty field, the rye cover crop plots had significantly lower hand-harvested corn yields than the mixed species cover-cropped plots. The higher yields in the mixed species cover crop plots were probably due to a combination of somewhat better stands achieved by planting into the living clover and the advantage of some nitrogen provided by that legume cover crop. By either method of measuring corn yields, we detected no significant differences among the termination treatments in 2025.
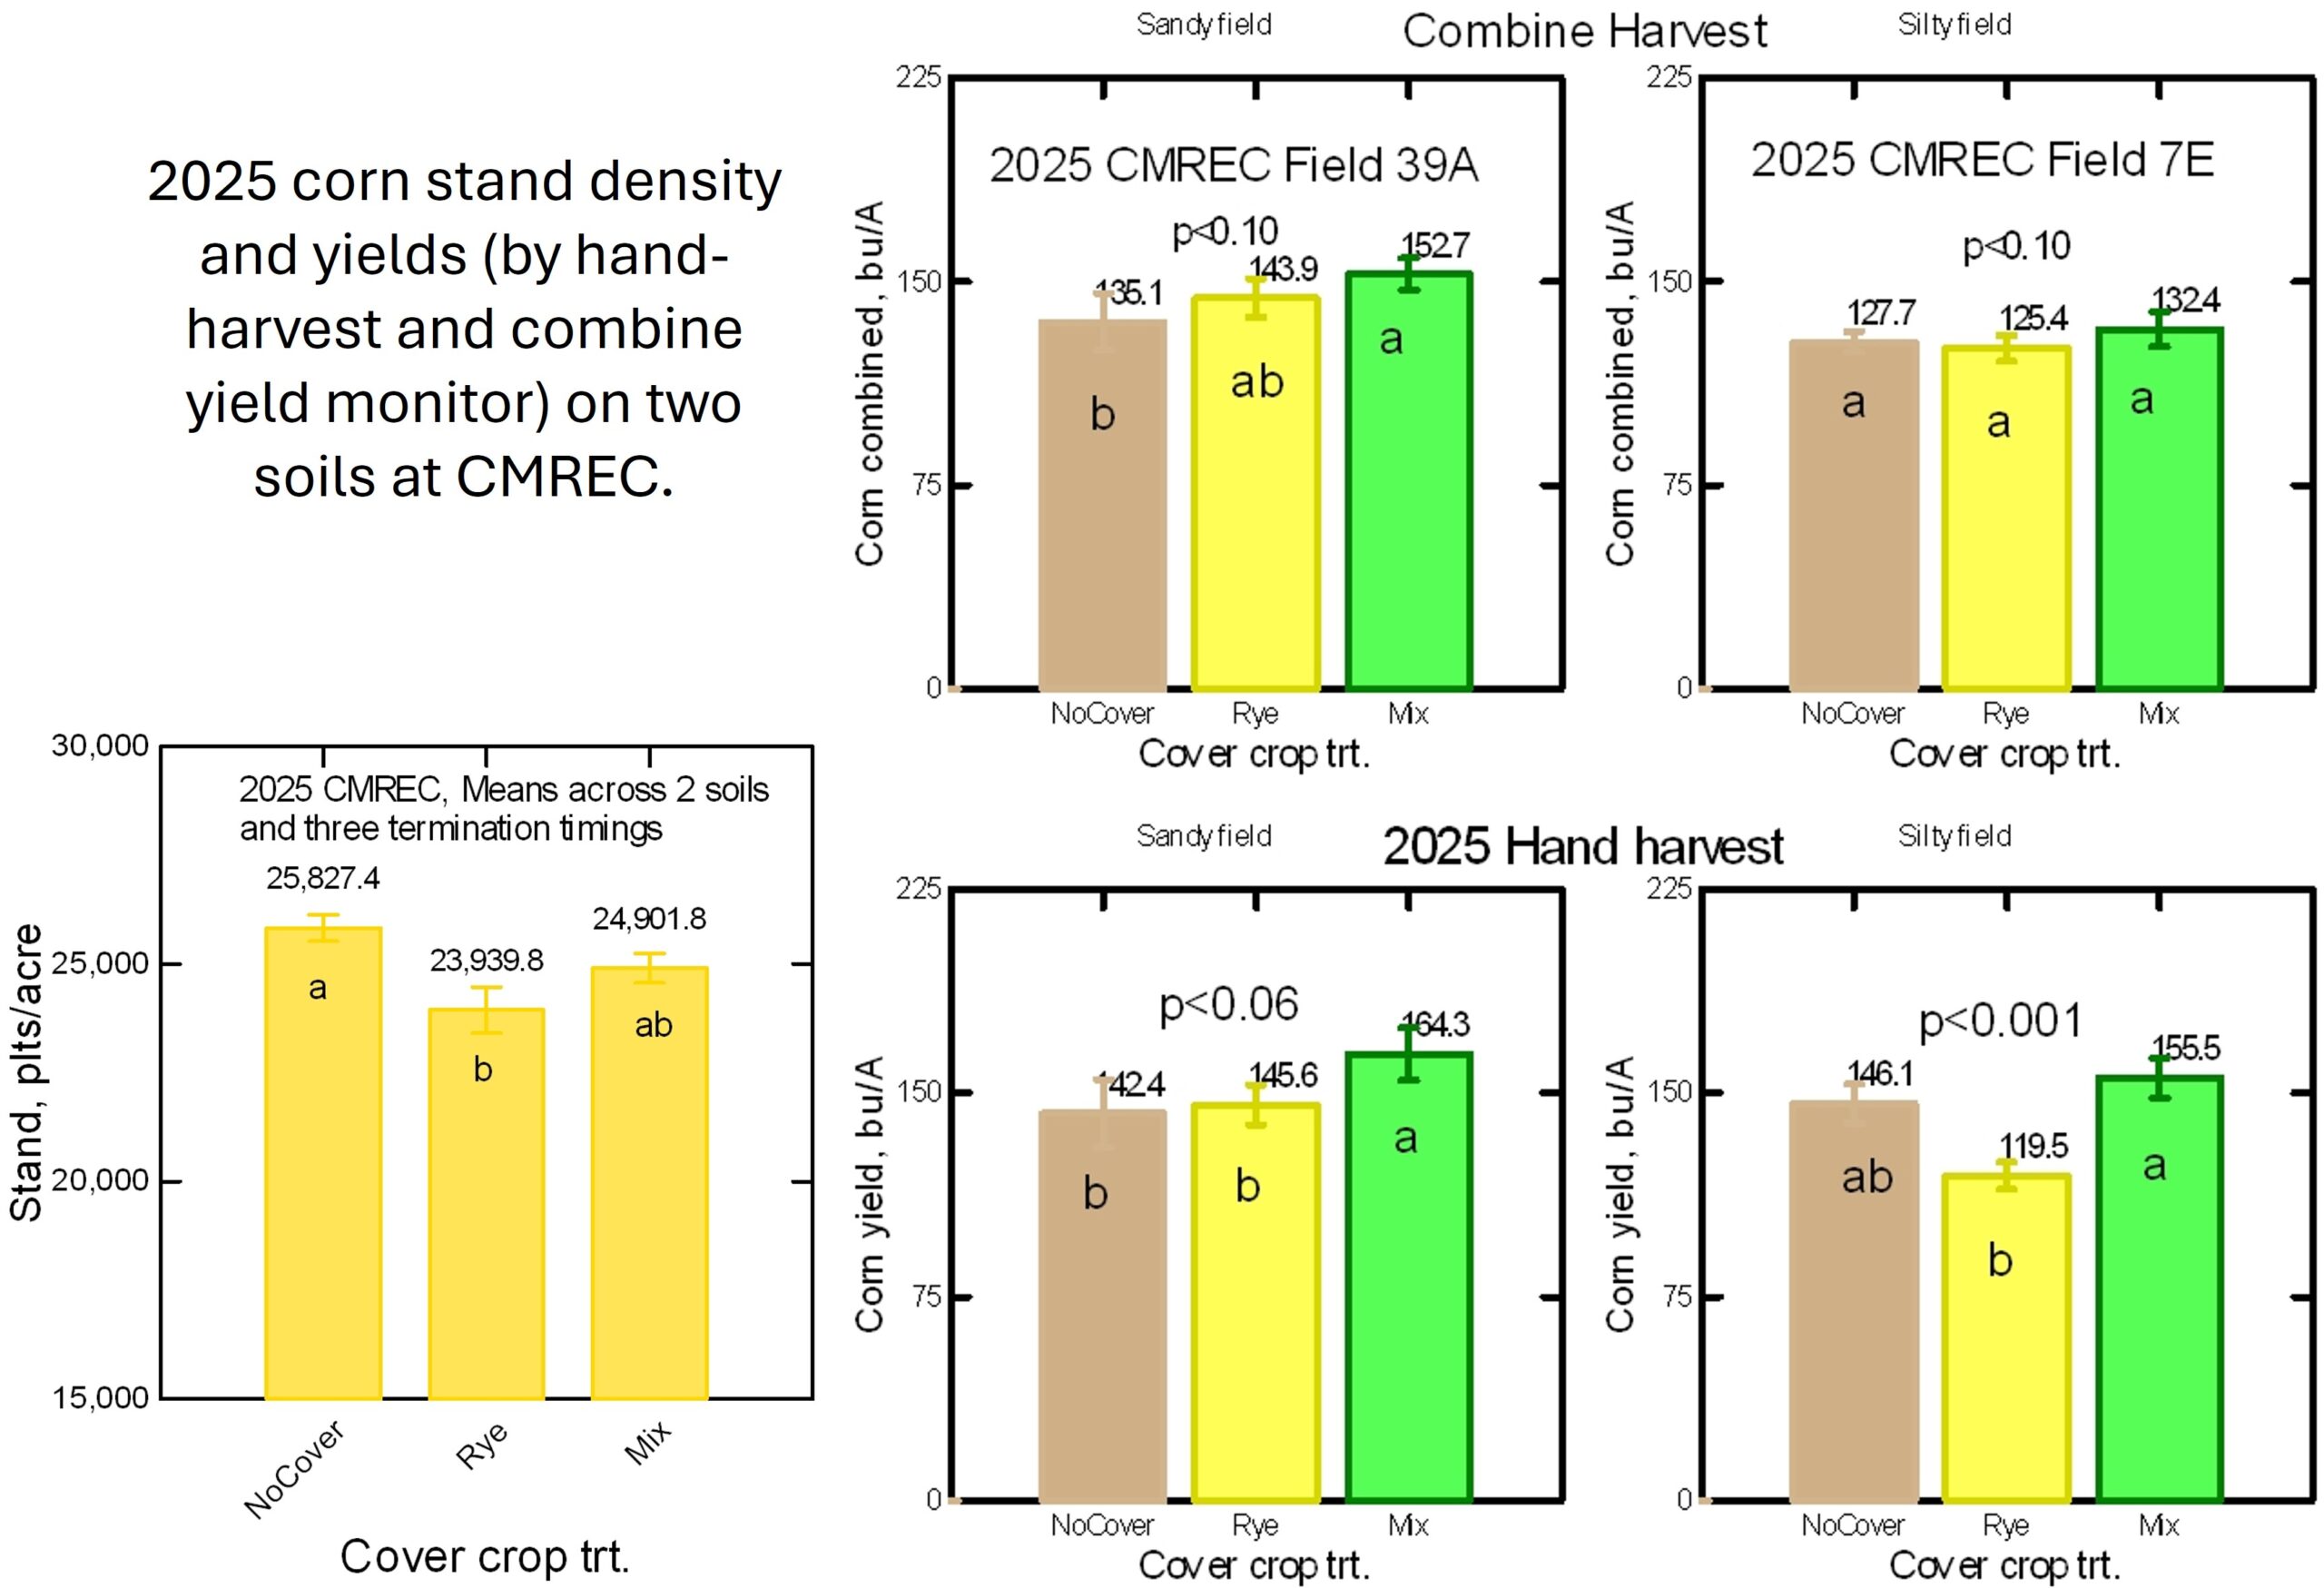
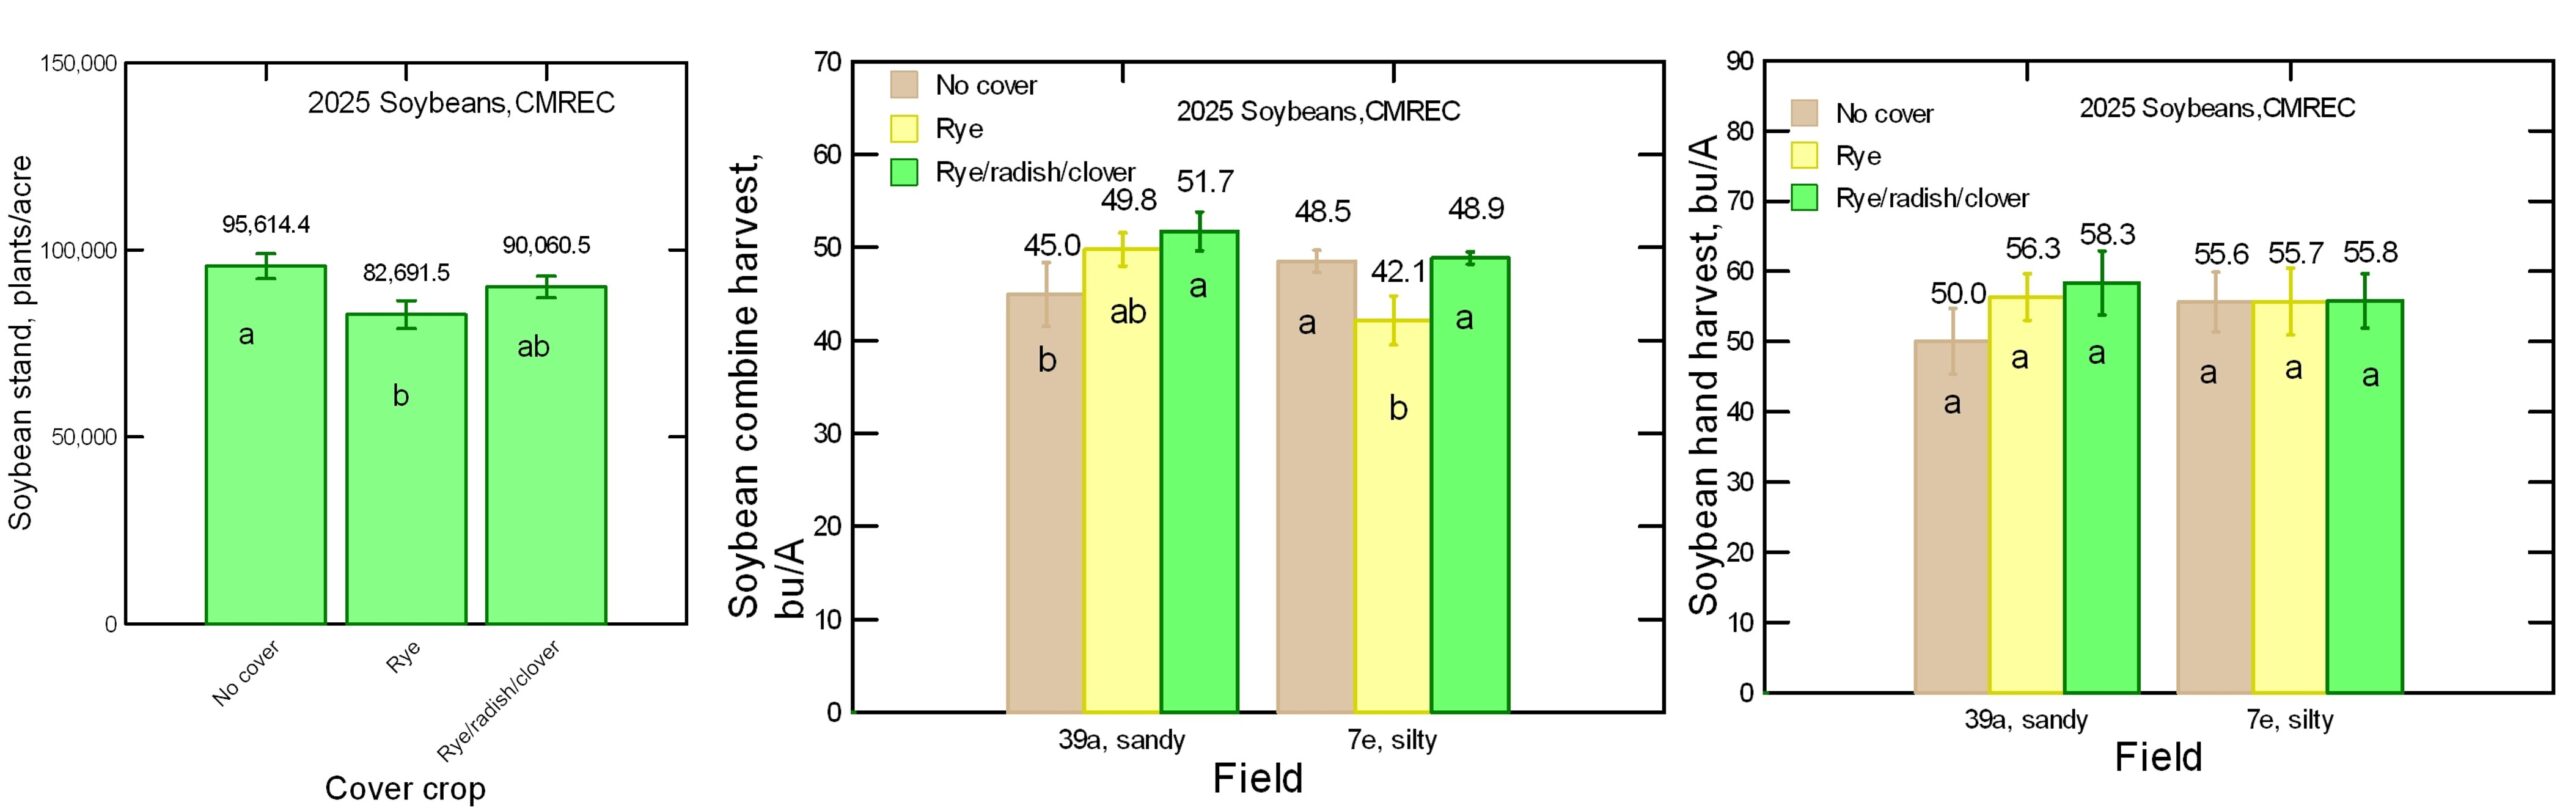
Soybean yields were also measured by both hand-harvest and a calibrated combine yield monitor. However, the termination subplots were not long enough to get reliable yield monitor data, so only yields for the cover crop species main plot were measured by the combine. Soybean yields in the smaller termination date subplots were measured by hand harvest, but no termination date effects were observed. As with the corn, soybean stands were slightly but significantly lower in the rye cover crop plots compared to the no cover control plots. The yield monitor data showed significantly higher soybean yields in the mixed cover crop plots on the sandy field compared to the no cover plots on that field. On the silty field, soybean yields were significantly lower in the rye cover crop plots than in the no cover controls or the mixed species cover crop. The hand-harvest soybean yield data did not show any significant effects of either cover crop species, termination date, or soil texture.
Planting green in general did not negatively affect crop stands or crop yields. Cover crops, compared to no cover crops, more often increased crop yields than decreased them. Results from both the research station fields and the collaborating farms should help new adopters gain confidence that well-managed cover crops will not be a drag on their productivity or profitability.
Cover crop impacts on soil health
In fall of 2025 we sampled soil from the mid-termination plots of all three cover crop treatments at both the sandy and silty fields. The samples will be used in 2026 to determine the range of soil health parameters as affected by the previous 5 years of cover crop treatments.
Education & outreach activities and participation summary
Educational activities:
Participation summary:
During the first 6 months of this research project, the main outreach activities were a farmer extension newsletter story about the establishment of the new project and a workshop presentation that discussed spring cover crop management in organic systems for the Mid-Atlantic Crop School in Ocean City Maryland in November 2023.
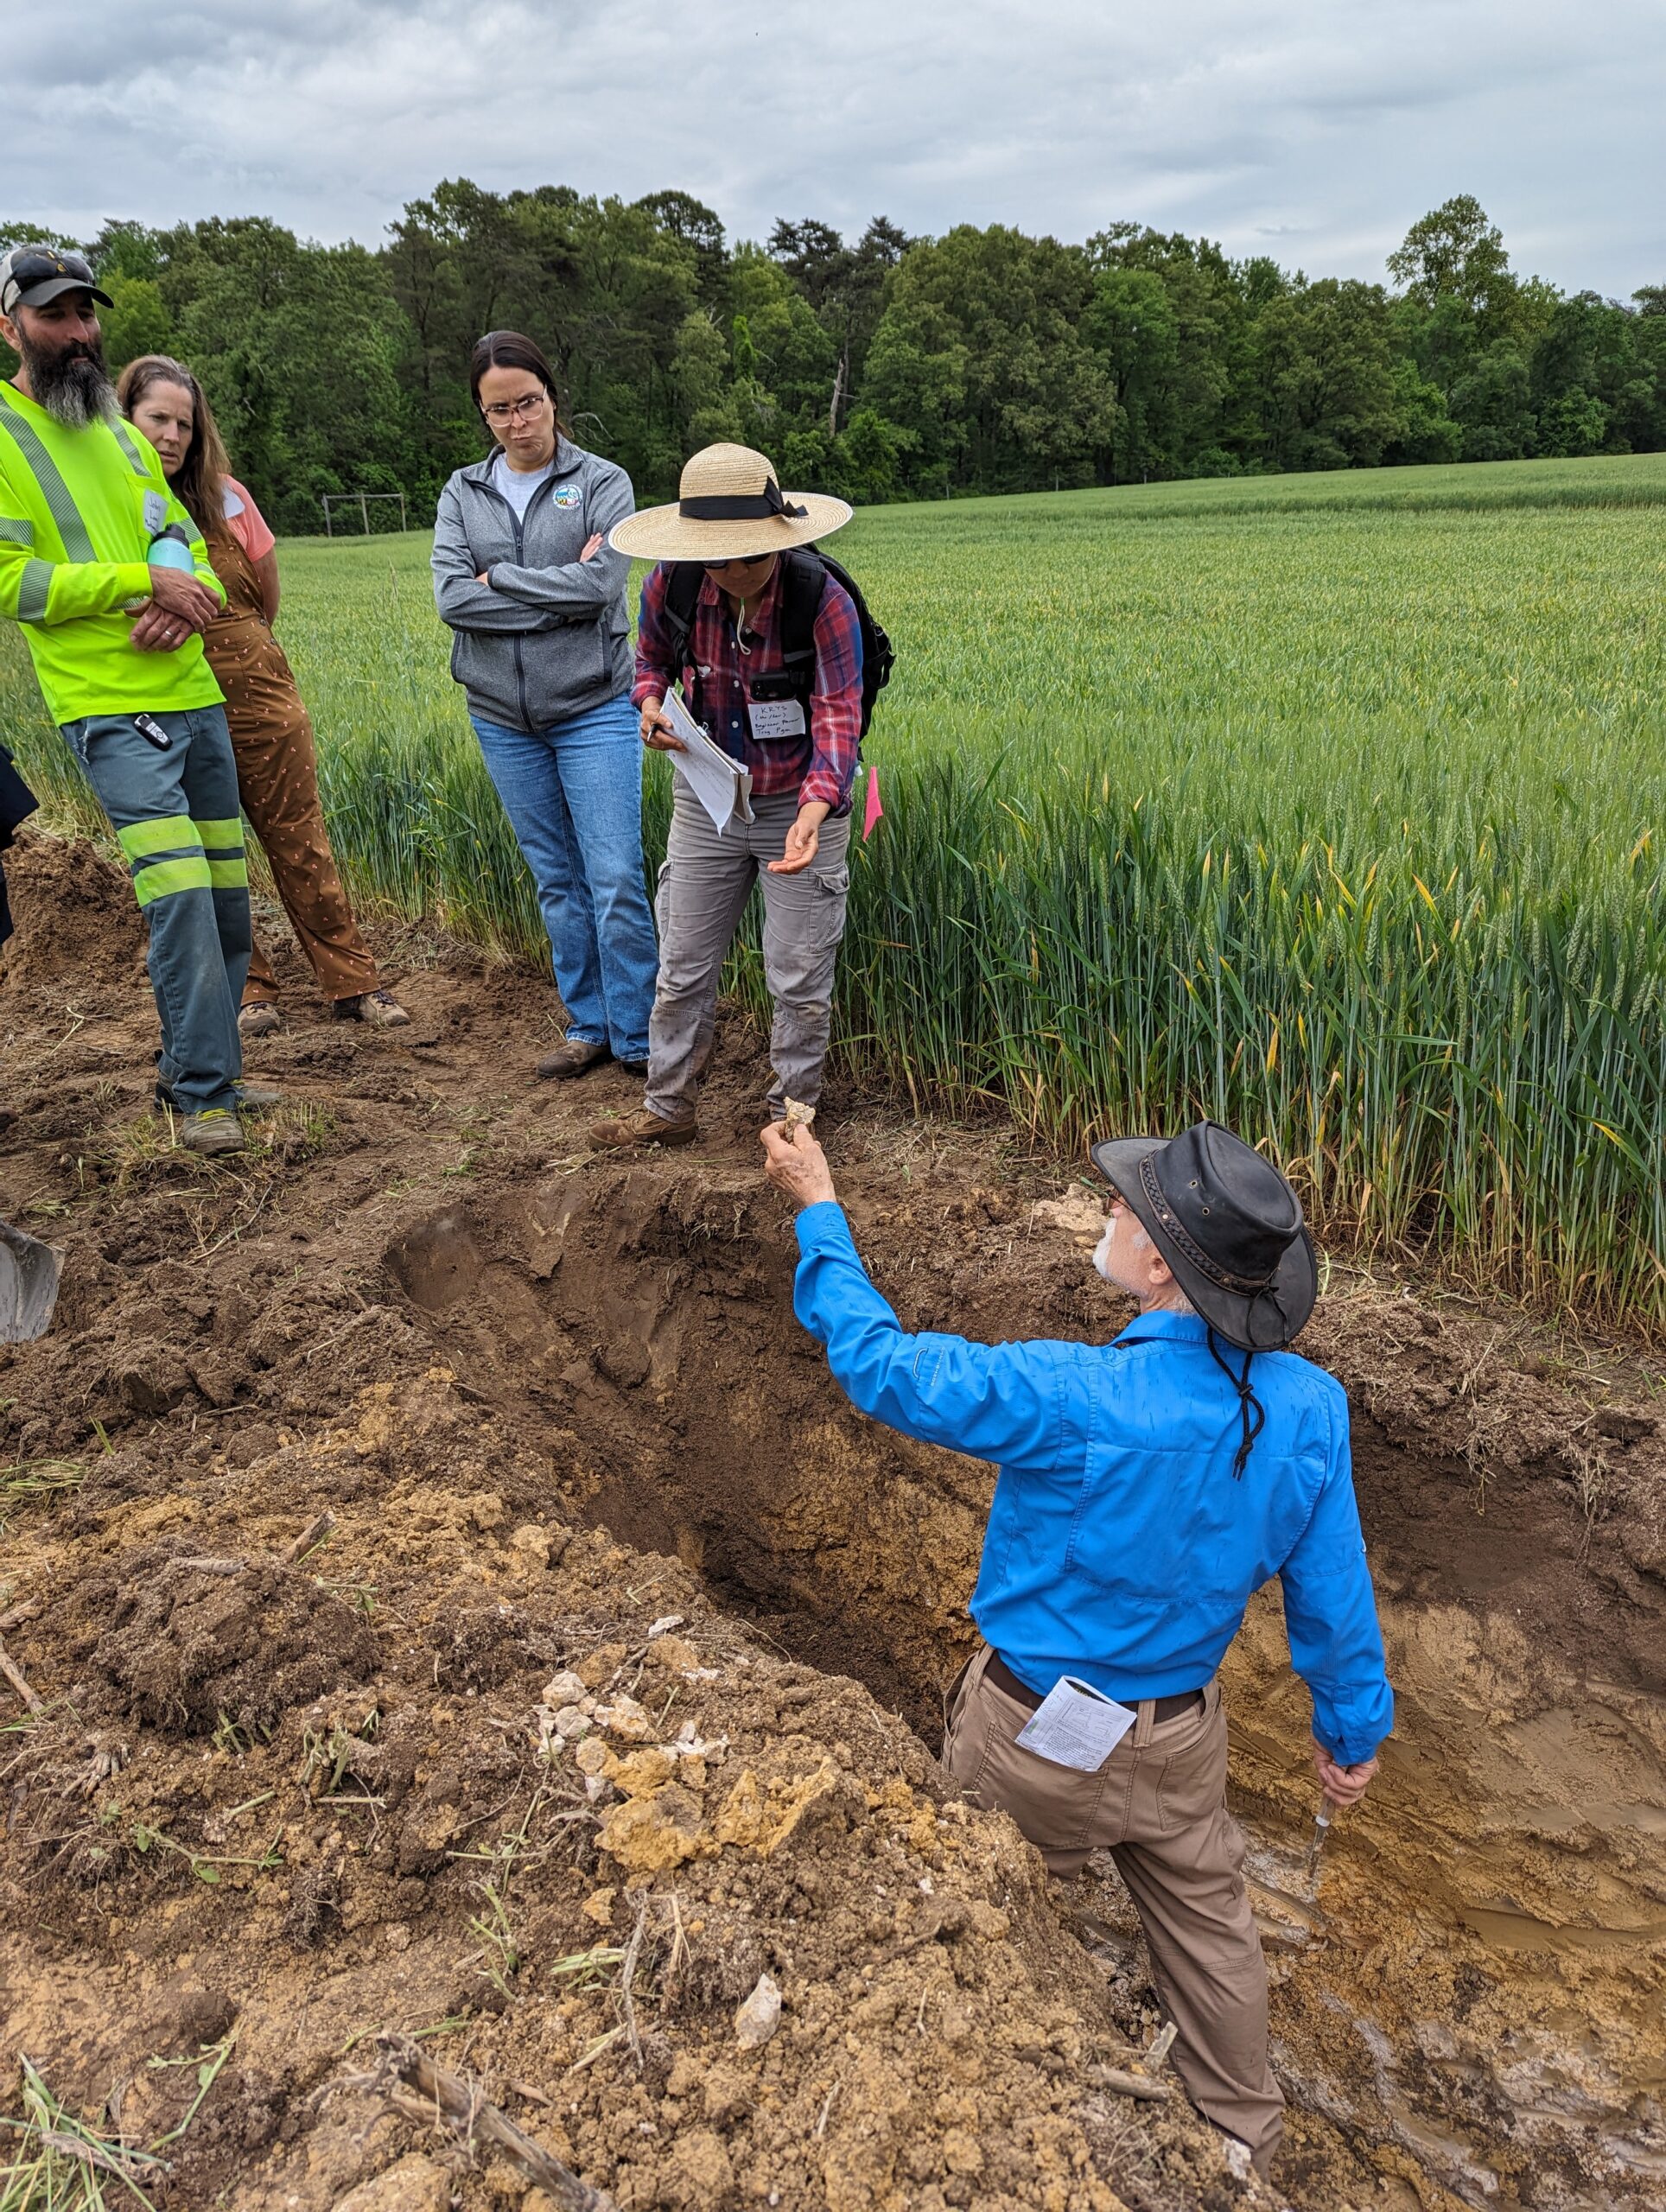
In spring 2024 we planned and held a field day on May 9th, a few days after our research plot were planted green to corn and soybeans at the Central Maryland Research and Education Center Beltsville Farm. More than 50 people were in attendance for the field day which was held from 9:30 am to 2:30 pm. Farmers and ag service providers were invited to learn about our latest research on planting green techniques and slug control methods. Activities included a Planting green demonstration, Biomass and root sampling activities, a Soil pit investigation, Slug scouting and control methods. Single species and cover crop mixes were demonstrated on widely contrasting soil condition (very sandy v. silty clay).
In March 2025 the PI, Ray Weil, made a presentation to the College of Agriculture and Natural Resources at the University of Maryland:
Weil, R. R. (2025). Rocks and roots: Managing soils to mitigate and adapt to climate change. 2025 AGNR Climate Adaptation and Mitigation Workshop. College Park, MD March 27, 2025 https://docs.google.com/presentation/d/1pFjwN0dY0y32TzzFWb5cO0lZ9DiPaI6g/edit#slide=id.p1
Also in March 2025, Cassie Gabalis, the graduate student supported by the project, won second prize for best presentation to the College of Agriculture and Natural Resources at the University of Maryland:
Gabalis, C., and Weil, R. (2025). Climate -smart cover crop management. 2025 AGNR Climate Adaptation and Mitigation Workshop. College Park, MD. Poster. March 27, 2025 https://docs.google.com/presentation/d/1Y_cIeeNPm606QOh5fugl9_zAQrQ5Z8V1/edit#slide=id.p1
In early May 2025, we participated and co-sponsored a cover crop management field at Mason's Heritage Farm run by Steve Krasewski, a member of our advisory board. We posted these educational videos from that day:
Weil, R. 2025. Tradeoffs with turbo-till for cover crop termination. YouTube, https://youtu.be/vi53w8M0sVg?list=PLPrYKy8dAAVCSaODyAL7X_jb_aEGhjnk8
Weil, R. 2025. Strip till deep ripper loosens disk compaction in a narrow band. YouTube, https://www.youtube.com/watch?v=OOCYH17OzK0
In July, made a poster presentation to a crowd of farmers gathered in Queenstown, MD for the Commodity Classic field day sponsored by the Maryland Grain Growers Association:
In November 2025, Cassie Gabalis won third place in a graduate student poster competition with a poster presentation to the American Society of Agronomy International Meetings in Salt Lake City:
Gabalis, C. S., and Weil, R. R. (2025). Root and shoot biomass and nutrients with enhanced cover crop management. CANVAS Annual International Meetings. Salt Lake City, Utah, USA. Poster. American Society of Agronomy. https://scisoc.confex.com/scisoc/2025am/meetingapp.cgi/Paper/168709
Learning Outcomes
Survey of participants for May 9, 2024 Cover Crop Spring Management Field Day at Beltsville, Facility University of Maryland. NE SARE Spring Mgt of Cover Crops Research Project.
|
Level of knowledge about cover crops before and after the field day activities. (Total of 21 respondents, 40% farmers) |
||||||||||
|
# |
Question |
None |
Very Little |
Average |
A Lot |
None |
Very Little |
Average |
A Lot |
|
|
BEFORE FIELD DAY ACTIVITIES |
AFTER FIELD DAY ACTIVITIES |
|||||||||
|
1 |
Various cover crop purposes |
0.00% |
28.57% |
47.62% |
23.81% |
0.00% |
0.00% |
42.86% |
57.14% |
|
|
2 |
Tailoring cover cropping to cash crop rotations and planting windows |
5.00% |
40.00% |
45.00% |
10.00% |
0.00% |
5.26% |
47.37% |
47.37% |
|
|
3 |
Planning and designing cover crop mixes |
19.05% |
28.57% |
33.33% |
19.05% |
0.00% |
9.52% |
38.10% |
52.38% |
|
|
4 |
Cover crop planting and termination options |
14.29% |
19.05% |
52.38% |
14.29% |
0.00% |
0.00% |
26.32% |
73.68% |
|
|
5 |
The importance of cover crop residue and carbon to nitrogen ratios |
4.76% |
28.57% |
33.33% |
33.33% |
0.00% |
4.76% |
42.86% |
52.38% |
|
|
As a result of the field day, how likely you are to take these actions (farmers) OR advise others to take these actions (ag service providers)? |
|
|||||
|
# |
Question |
Not at all likely |
A little likely |
Somewhat likely |
Very likely |
|
|
1 |
Evaluate various cover cropping options, rather than just blanket applying 'a cover crop' on the farm |
0.00% |
0.00% |
23.81% |
76.19% |
|
|
2 |
Plant cover crop mixes |
4.76% |
4.76% |
19.05% |
71.43% |
|
|
3 |
Plant cover crops earlier in the fall than I typically do |
5.26% |
0.00% |
47.37% |
47.37% |
|
|
4 |
Allow cover crops to grow later in the spring than I typically do |
5.00% |
0.00% |
55.00% |
40.00% |
|
|
5 |
Plant a cover crop more likely to benefit my following cash crop (e.g., include a N-fixing legume in a mix ahead of corn) |
5.26% |
0.00% |
26.32% |
68.42% |
|
|
6 |
Modify cash crop rotations in order to open windows for cover crops that will serve more purposes |
10.53% |
5.26% |
36.84% |
47.37% |
|