Final Report for LS13-259
Project Information
Constraints and changes across twenty years in Southern agricultural sustainability were explored in a survey of Southern Extension agents and farmers. Combining these results with case studies of nine resilient local food systems and recent research in ecological resilience, we developed a sustainability/resilience index (SRI) which quantitatively measures sustainability at the county level. Preliminary work with quality of life indicators (e.g., health, poverty) show high correlations with SRI. Researchers, educators and farmers have a new tool to predict and improve sustainability of food and agricultural systems. Refining the model and index is required to incorporate anomalous results in certain regions.
The following Objectives and Activities are as listed in the approved proposal.
Objective 1. Qualitative exploration of constraints to sustainable agricultural systems through a rolling workshop/tour and case studies of farmers who have established locally-owned integration of sustainable production, processing, marketing (also known as locally-owned value added or LOVA enterprises) in regions where integration is scarce.
Activity 1.1 Recruit stakeholders and engage them in participatory exploration of whole system integration from production to processing and marketing with other successful integrators in a rolling workshop.
Time: March-April 2014
Deliverables: At least eleven stakeholders participate in KY event. Stakeholders recommend additions to survey. Stakeholders compare their enterprise development process to other participants.
Activity 1.2 Conduct series of interviews with case study participants to both prepare for development of formal case studies detailing decisions and strategies for overcoming barriers and a draft model incorporating findings from all case studies and Activity 1.1.
Time: March-April 2014
Deliverables: Case study interviews complete in four states. Draft model of LOVA development complete.
Activity 1.3 Prepare Decision Case studies from information collected in Activity 1.2.
Time: April-August 2014
Deliverables: Case studies complete, published and available online.
Objective 2. Assemble quantitative data on constraints and opportunities through surveys of stakeholders. This survey will include all questions in the original SOS survey plus questions exploring emergent issues as informed by key stakeholders.
Activity 2.1 Pretest survey with participants in Activity 1.1 and finalize survey 1; pretest survey 2 with participants in Activity 4.1 and finalize survey 2.
Time: March-June 2014 and March-June 2015
Deliverables: Robust surveys finished.
Activity 2.2 Conduct two online surveys, one after case studies interviews/rolling workshops and a second after first set of regional workshops.
Time: July-Oct 2014 and July-Oct 2015
Deliverables: At least 2000 surveys complete for each of two surveys. Results analyzed and used to modify model developed in 1.2. Final survey results published and available online.
Objective 3. Detail major characteristics and identify potential challenges and opportunities in Southern agricultural systems by integrating secondary databases of indicators of sustainable agricultural systems with survey data from Objective 2.
Activity 3.1 Select, access and analyze secondary data bases based on conclusions from Objective 1 and comparison to SOS 1995.
Time: May-Oct 2014
Deliverables: Relevant data chosen based on input from Objective 1, analyzed by county, and compared to data of SOS 1995.
Activity 3.2 Integrate survey data with secondary data to explore draft model developed in previous Activities.
Time: Nov 2014-Feb 2015
Deliverables: Survey and secondary data integrated to develop indices to test model.
Activity 3.3 Integrate survey and secondary data with Opportunity Conference results
Time: Feb-Oct 2015
Deliverables: Analysis by stakeholders in 4.1 used to select and integrate new databases and develop second survey. All data integrated from all sources, published and available online.
Objective 4. Identify and lay foundation for removing constraints identified in Objectives 1, 2 and 3 by developing farmer/entrepreneur-researcher networks with Opportunity Conferences.
Activity 4.1 Conduct two Exploring Opportunity Conferences which analyze survey 1 in context of case studies and database analysis to determine barriers to sustainable whole system integration.
Time: Nov 2014-Feb 2015
Deliverables: Two meetings develop consensus on barriers to sustainable agricultural systems and draft model of LOVA development.
Activity 4.2 Conduct two Designing Opportunity Conferences to integrate results from case studies, surveys and databases.
Time: Nov-Dec 2015
Deliverables: Two final conferences design prototype research and education projects to remove barriers identified in previous Objectives.
Activity 4.3 Design and implement interactive SOS website to support all Objectives.
Time: Jan 2015-Jan 2016
Deliverables: Project website presents project data, conference proceedings, LOVA development model and continuing training in ecological resilience approach to sustainable agricultural systems.
Objective 5. Achieve widespread activities to remove constraints through presentations and publications to recruit participation based on analysis of all data from the first four Objectives.
Activity 5.1 Publicize and discuss results at regional conferences, elicit questions for survey 2 and recruit participation in Activity 4.2 and model development.
Time: Jan-Feb 2015
Deliverables: Two regional conferences explore implications of results and recruit participants for 4.2.
Activity 5.2 Publish Southern Futures 2015 papers and recruit continued participation in model development.
Time: Nov 2015-Feb 2016.
Deliverables: Results available in comprehensive final report, peer-reviewed articles and online. Model will be available for interactive discussion online and in post-project workshops to stimulate further testing.
The goal of this project is to help farms and communities deal with the ever-changing challenge of producing healthy food in the face of innumerable disturbances, whether from climate change or market volatility or input supply glitches or policy perturbations
The ecological resilience perspective on sustainability provides a framework for accomplishing this objective. It has enabled us to create a quantitative measure of sustainability, which we call the Sustainability/Resilience Index or SRI.
We began this work more than twenty years ago with a study of sustainability of agricultural systems in the thirteen Southern States (AR, AL, FL, GA, KY, LA, MS, NC, OK, SC, TN, TX, VA).[1] One conclusion of that study was that locally owned processing and marketing was crucial to sustainability.
Since then locally organized food systems have become widespread in the US, but not in the many social ecosystems in Southern states. So we decided to explore how farms and local food systems have managed to survive and thrive in this region not especially congenial to local and sustainably produced food.
The main question explored in this report is: what qualities beyond locally owned processing and marketing are necessary for sustainability and resilience? Our search for answers led us first to conduct extensive interviews with resilient farmers, processors and marketers who have succeeded in creating resilient local food systems in recalcitrant areas. Some we had followed since we began this study twenty years ago. Case studies resulting from these interviews were integrated with the survey and databases employed in SOS 1995 and with additional survey data and secondary databases (in collaboration with University of Mississippi's Center for Population Studies) to determine the progress the South is making toward sustainable systems.
A consensus of thousands of farmers and agricultural professionals who participated in SOS 1995 was that environmentally sound production systems require integration with locally-owned marketing and processing systems in order to be sustainable. Without sustainable marketing and processing systems, even the most biologically sustainable system will not be able to prosper.
Since then, many state and federal programs have been developed to remove this constraint. However, some parts of the South consistently receive more SSARE grants and generate more locally owned processing and marketing enterprises than other regions which are very similar geographically and demographically.
Since the original SOS, systems theory and research has dramatically evolved—especially in ecology. Living systems are now widely viewed as interacting complex adaptive systems (CAS) which participate in adaptive cycles. These adaptive cycles can result in ecological resilience and resource enhancement or in decline to lower levels of productivity and resilience. Resilience depends on whether the systems' components maintain key qualities while cycling through various phases or regimes. In this ecological resilience perspective on sustainability, managers create and modify production, marketing and processing systems in response to trends of adaptive systems at other scales and in other domains (e.g., consumer demand trends, government policy, input supply prices). However, insuring sustainability at one scale (e.g., through one farm or processor growing ever larger) may decrease resilience of the whole system.[2]
Current trends in domains influencing Southern sustainable agriculture reflect the original SOS findings as well as pointing out new areas which must be understood. A key constraint on sustainable agricultural systems identified by SOS 1995--lack of locally-owned processing and marketing systems--has become a national focus in the last 20 years. Several state and federal programs have been implemented to address this constraint including Value-Added Producer Grants, Farmers Market Promotion Program, Local Foods Promotion Program, and Kentucky Agricultural Development Board. However, much of the South still lags in creation of such crucial systems.
Where locally-owned, value-adding (LOVA) systems have been established, they provide a positive answer to the dozens of popular books and articles released every year which criticize the American food system. Many of these best-selling authors engage in hyperbole, as when one alleged that today's American industrial food system “has hastened the malling of our landscape, widened of the chasm between rich and poor, fueled an epidemic of obesity, and propelled the juggernaut of American cultural imperialism abroad”.[3] However, these books and articles do reflect a growing consumer belief that the industrial food system has “lured us into choosing diets deficient in nearly everything except calories, supporting practices deceptive in every aspect from advertising to flavoring, and systems that degrade nearly everyone and everything involved. The problems arising from the fast food industry are rooted deeply within American society”. [4]
This trend has provided a powerful opportunity for Southern agriculture--increased support for healthy, locally grown food products. In a 2005 U.S. consumer survey, 72 percent of respondents believed that geographic characteristics such as soils influence the taste and quality of foods and 56 percent were willing to pay 10 to 30 percent more for locally grown.[5] A national survey in mid-2008 reports that nearly nine out of ten Americans (89 percent) would like to see food stores sell more fruits and vegetables that come from local farms, and over two thirds (69 percent) said they would pay slightly more for such produce.[6]
Twenty years ago, local food systems were struggling to be born. Though one of the first local food systems workshops in the nation was conducted by the State of the South in early 1994 in Williamsburg, VA, the South is ranked extremely low in prevalence of local food systems. One prominent 2013 index[7] puts only Kentucky, at 18, in the top half of all US States in presence of local food systems. Virginia is 28th, North Carolina 31st, but the 11 other Southern States are ranked in the lowest 16 with three Southern States having the lowest prevalence of local food systems.
The trend toward local food systems is reflected in USDA policy papers. As late as 2000, USDA policy papers addressing the evolving food and agriculture system do not mention local foods or farmers markets. In that policy review, our food system was characterized as a mature and stable market with changes expected only around the edges. The review did note that this supposedly stable, mature market, is encountering a new trend: a “consumer driven era” for our food system. It notes we are moving toward a more product-based rather than commodity-based system.[8] Food production is characterized as adapting to this mature, stable food system dominated by international processing and marketing entities.
No mention is made of local food systems challenging the stable, mature system, though the study did note that the supermarket share of grocery food sales that was 78 percent in 1992 had fallen to 70 percent by 1997. This trend has continues (in 2012 supermarket market share had fallen below 60%). In 2010 the USDA/ERS recognized the trend with a local food systems review which chronicles the rise and importance of local foods[9] and now maintains a continuously updated database (KYF Compass) on local and regional food initiatives.
The trend has become so powerful that one farmer’s market manager contended that “every church wants a farmers market.” Policy makers all across the spectrum are supportive. “The future of food is local” is the opinion expressed by the Republican Chair of the Rural Development subcommittee of the House Committee on Agriculture in public meetings in both 2012 and 2013.[10] On June 3, 2013, Wal-Mart announced it planned to double sales of locally grown produce by December 2015.[11] Wal-Mart and a rural Republican Congressman are promoting what was once a very suspect alternative agriculture, even among the most ardent sustainable agriculture advocates.[12]
Twenty years ago, less than 1700 farmers markets were officially documented in the country. This number rose to 2,756 in 1998, to 5,274 in 2009, and in summer 2013 stands at 8,144. In 2001 there were 400 community-supported agriculture organizations (CSAs) in operation and 1,144 in 2005. By 2009, one estimate was 3,637.[13] Some estimates place the number of CSAs today as high as 6,000 nationally.[14]
The number of farm to school programs, which use local farms as food suppliers for school meals, was 2 in the 1996-7 school year, increased to 400 in 2004, to 2,095 in 2009, and in the 2012 reached 3,812 or 43% of all districts (USDA 2013 Farm to School Census and National Farm to School Network). North Carolina is one of the states with highest participation, while Arkansas, Mississippi, Tennessee and Alabama are among the lowest.
Some regions of the South have benefited from these trends through creation of jobs and economic opportunity through LOVAs. Other regions (as shown by the USDA KYF Compass) have not been so fortunate. For example, Tennessee and the hill regions of north-central Arkansas, north Mississippi and north Alabama have lagged behind Kentucky, North Carolina and Virginia, though demographically and geographically, all seven regions are similar. However, even in such recalcitrant regions, at least a few LOVAs have succeeded. We seek to understand how these enterprises have succeeded in such recalcitrant regions and broadcast lessons learned through decision cases based on each LOVAs development.
Our initial planning activities with farmers revealed that networks of similar sustainability-oriented farmers are key to their success. Therefore, another primary focus of our project is developing networks to support sustainable systems.
We also seek to expand the conceptualization of sustainability used by farmers and researchers in the South. Agricultural systems often focus on a vision of sustainability which, though helpful in maintaining short term sustainability, may actually decrease long term resilience. Ecologists increasingly are taking an approach to sustainability known as ecological resilience.[15] Ecological research indicates that systems are most resilience when they maintain certain qualities in their components (e.g., flexibility, redundancy, modularity, connectivity, diversity and reassembly) rather than narrowly focusing on maintaining the existing system. To be sustainable from the ecological resilience perspective, the entire system must maintain components with the capacity to adapt and even reassemble in response to disturbances and trends from outside domains including policy and markets.
Some of the most powerful outside disturbances on our American agricultural systems are changing markets. Consumer attitudes have undergone a well-documented shift toward more interest in health and environmental consequences of our food system.[16]
Many health problems, including obesity, high blood pressure and diabetes are increasingly tied to food. Type of food intake is linked to cardiovascular health, including risk of stroke, coronary heart disease and type two diabetes.[17] Southern states have long had the highest obesity rates in the nation, though the Midwest is catching up.[18] Diabetes has reached epidemic proportions in the United States. A cluster of 644 counties mostly in Southern states has been designated the "Diabetes Belt” by the Center for Disease Control.[19]
The number of overweight and obese persons is generally lower in neighborhoods where there are supermarkets offering healthy food choices. [20] The availability of nutritious foods has a positive influence on people's dietary patterns and health status.[21] Rural food deserts, where nutritious foods are not available, are concentrated in Southern states.[22]
Recently, public health researchers have begun to reemphasize the relationship of health and agriculture and food systems in an approach known as ecological public health.[23] Given that concerns about impacts of food on health are a driver for local food and organic food, we will document whether regions of the South with and without strong local food systems differ significantly in tying health to our food and agriculture systems. If a primary function of the food system is to support health of people in an area, then long term sustainability would perforce maintain that function.
Entrepreneurs and venture capitalists see opportunity in these new trends impacting our food system. One recently reported raising $8.5 million for a multi-city local food systems venture.[24] Another report cited $850 million recently invested in new food ventures.[25]
Adaptive response to feedback is a key to sustainability of any system. Any strong research and education program seeks out feedback on outcomes. This project's assessments provide that feedback to SSARE. Twenty years ago, the original State of the South project attracted national and international attention and contributed to development of several state and federal programs designed to help farmers move toward more sustainable agricultural systems. However, many parts of the South still lag in creation of such systems. This project measures the changes toward more sustainability in the South and develops models, networks and research and education prototypes to move the South toward even more sustainability.
All sectors of Southern agriculture can benefit from understanding such trends and integrating production more closely with sustainable processing and marketing. We all seek to understand how we, our foody system, our farms and our communities can thrive and be healthy. We all seek new tools and concepts for dealing with the ever-changing challenge of producing healthy food in the face of innumerable disturbances, whether from climate change or market volatility or input supply glitches or policy perturbations.
[1] Worstell, J., 1995. Southern Futures: Opportunities for Sustainable Agricultural Systems. Almyra, AR: Delta Land & Community. Also available at: https://projects.sare.org/media/pdf/4/8/3/483southern-futures.pdf
[2] Walker, B. and D. Salt, 2012. Resilience Practice. Washington, D.C.: Island Press.
[3] Schlosser, E., 2001. Fast Food Nation. Houghton Mifflin Harcourt.
[4] Ikerd, J. 2005. Eating local: a matter of integrity. http://web.missouri.edu/ikerdj/papers/Alabama-Eat%20Local.htm
[5] DeCarlo, et al., 2005 Consumer Perceptions of Place-Based Foods, Food Chain Profit Distribution, and Family Farms. Leopold Center for Sustainable Agriculture: Ames, Iowa.
[6] Deloitte, 2008. Deloitte Food Safety Survey. Washington, D.C.: Deloitte Development.
[7] Locavore Index, 2013. http://www.strollingoftheheifers.com/locavoreindex/
[8] ERS. 2000. Food and Agricultural Policy, Washington, D.C.: USDA. Pp. 16-35.
[9] ERS, 2010. Local Food Systems: Concepts, Impacts, Issues. Washington, D.C.: USDA.
[10] Crawford, R., 2013. U.S. Rep. Rick Crawford speaking in DC and Jonesboro, AR.
[11]Wal-Mart, 2013. http://www.arkansasonline.com/news/2013/jun/04/retailer-stock-fresher-produce-20130604/
[12] Hoefner, F. 2000-2015. Personal communications from Policy Director of National Sustainable Agriculture Coalition.
[13] Galt, R. E. 2011. Counting and mapping community supported agriculture in the United States and California. Int E-J Crit Geogr 10(2):131–62.
[14] University of Kentucky, 2013. Community-supported Agriculture. Univ of Kentucky Coop Exten Serv Publication.
[15] Walker and Salt, ibid.
[16] IFICF, 2013. 2013 Food and Health Survey. http://www.foodinsight.org/foodandhealth2013.aspx.
[17] Akil, L. and H. Ahmad, 2011. Effects of Socioeconomic Factors on Obesity Rates. Ethnicity and Disease, 21: 58-62; CDC, 2013. Vital Signs: Avoidable Deaths from Heart disease, stroke and hypertensive disease—United States, 2001-2010. http://www.cdc.gov/mmwr/preview/mmwrhtml/mm6235a4.htm?s_cid=mm6235a4_w.
[18] CDC, 2012. Prevalence of Obesity in the United States, 2009-2010. NCHS Data Brief No. 82. http://www.cdc.gov/nchs/data/databriefs/db82.pdf.
[19] CDC, 2011. CDC Identifies Diabetes Belt. http://www.cdc.gov/diabetes/news/docs/diabetes_belt.htm.
[20] Morland, K. et al., 2006. Supermarkets, other food stores, and obesity: the atherosclerosis risk in communities study. Amer J Preventive Medicine 30:333-339.
[21] Matson-Koffman, D. et al., 2005. Site-specific literature review of policy and environmental interventions that promote physical activity and nutrition for cardiovascular health: what works? Amer J of Health Promotion 19:1671–1693.
[22] ERS. 2013. Household Food Security in the United States in 2012. Economic Research Report Number 155.
[23] Lang, T. and G. Rayner. 2012. Ecological public health: the 21st century's big idea. British Medical Journal, 345:1-5.
[24] Grant, R., 2013. GoodEggs raises $8.5M http://venturebeat.com/2013/09/26/goodeggs-raises-8-5m-to-fix-our-food-system-one-egg-at-a-time/#fzflZ5otFhVxo2YH.99.
[25] Wortham, J. and C. Miller, 2013. Venture Capitalists Are Making Bigger Bets on Food Start-Ups. New York Times, April 28, 2013.
Cooperators
Research
Introduction
With our overall goal of defining the key constraints and opportunities to sustainable agricultural systems in the South, we collected data for key economic, social and environmental indicators for all counties in the South. We compared this to data obtained twenty years ago.
This goal required both qualitative and quantitative research methods. In complex adaptive systems, few variables can be tightly controlled because nearly all systems adapt, making response to stimuli unpredictable. Non-experimental observational quantitative methods allow the researcher to track the effects of complex adaptive systems on variables of interest. However, to determine which variables reflect the most important factors, qualitative research is necessary. Therefore, we will use a mixed-methods research approach: qualitative research methods (comparative multiple case study methods and group methods) and quantitative survey methods and analysis of secondary database indicators determined by the results of the qualitative results.
Case studies
Case study is now recognized as an important research approach for agricultural systems[1] and in the social sciences.[2] Today, numerous agricultural journals publish several case studies every year. The cases developed here will primarily be used to generate and inform hypotheses for our quantitative research process and to explore issues not readily accessible through quantitative methods.
Few published cases have involved study of integrated production, processing and marketing businesses in the South. One recent example is a[3] study of Acres of Land winery in Kentucky. Kentucky along with North Carolina, Virginia and South Carolina have been hotbeds of entrepreneurial agricultural activity in the last 20 years. One prominent 2015 index[4] put two of the Southern states (South Carolina and Virginia) in the top half of all US States in presence of local food systems. North Carolina was 28th, Kentucky 29th and the other nine Southern states are ranked in the lowest 11 states. All the lowest ranking Southern states are decreasing yearly relative to the rest of the nation, according to this index. Those four high ranking states are also similar in geography and demography to regions of three Southern states (AR, TN, and MS) which have not experienced high levels of creation.
We used standard case recruitment and selection methods[5] to choose the subjects for our case studies. In addition to being from one of the three states with low LOVA creation (AR, TN and MS), the primary selection criteria were that the enterprise must integrate sustainable production, processing and marketing, must have lasted for a minimum of five years, must have arisen and be located in an area where few such enterprises (also known as locally-owned value-added enterprises or LOVAs) have developed, and must be whole-heartedly willing to participate in all aspects of the study.
A multiple case study design was chosen to study our topic from several perspectives and contexts.[6] We examined systems in four regions where integrated agricultural system managers worked independently in different contexts and communities, providing the opportunity to identify common and distinct processes.
We used a case study protocol that outlines the key information to be gathered from each case and primary sources (Yin, ibid.). Initial issues for exploration were extrapolated from project leaders' experience, previous ecological resilience research, and related literature. These initial issues were points of departure to guide interview questions and preliminary analysis. The initial researcher-identified issues evolved and be influenced by issues raised by the study's participants. Particular issues were developed and explored in each case to guide data collection and analysis for the individual case descriptions. The emerging issues from each case were then examined to identify shared issues, which then directed the cross-case analysis. Regularly revisiting and refining these issues during data collection and preliminary analysis provided an emergent theoretical structure from the data collection processes.
As is consistent with case study design, data collection methods in this study included in-depth semi-structured interviews, document review, direct observation and participant observation. Information was gathered from the inception of the initiative to the time of data collection in order to capture process changes.
Data analysis occurred in two stages following the method of Eixenhardt.[7] Stage 1 involved the independent, in-depth analysis of each case. Stage 2 involved a cross-case analysis of the four cases. In stage 2, each case's main processes were compared to explore how different contexts and processes varied across the cases. The key issues that are identified for each case (as described previously) were re-examined to distill common issues that were addressed differently across the three cases. Finally, case-specific issues were identified that affect all cases.
The cross-case model was used to select secondary data to analyze and questions to ask in survey.
Participants reviewed the questions included in the original SOS survey and were engaged in a process of refining and expanding the survey instrument and making recommendations for secondary database indicators.
Case studies were finalized after each case has been reviewed by as many active practitioners as possible. This process enabled refinement of concepts and relationships from all cases. These cross-case processes will develop a theoretical framework applicable to all cases.
Nine case studies of resilient local food systems in Tennessee, Arkansas and Mississippi were developed and analyzed in the context of the frameworks noted above--resulting in the indicators of the eight qualities of ecological resilience.
Survey
The case study process tested the original questions of the first State of the South survey[8] and developed new questions addressing issues and trends emerging since 1995.
A robust survey instruments was constructed using standard methods to compare results from 1995 and explore new areas. The design and administration of the questionnaire was informed by the Tailored Design Method developed by Dillman.[9] Particular attention was directed toward having a survey instrument that can be answered by both farmers and agricultural and natural resource professionals.
With assistance from Kentucky State University, State Cooperative Extension Services, State Farm Bureaus, NRCS, SSAWG and National Sustainable Agriculture Coalition, we compiled a list of target respondents' email addresses. We also contacted all these organizations' representatives in the 13 Southern States to enlist their support in recruiting participants via their own email distribution lists. This convenience and snowball approach was not intended to represent all farmers, resource professionals, etc. Instead, the focus was to gain input from those stakeholders interested in having their perspectives included in developing priorities and recommendations for Southern agricultural sustainability and resilience.
Through the University of Mississippi Center for Population Studies, we managed the survey using Qualtrics. This online survey platform allowed us to manage the sample, monitor completion rates, send out invites, reminders, etc. It also provided data immediately in Excel and SPSS compatible formats. Results were tabulated and made available to the participants.
A total of 1,491 people clicked on the survey link and started the questionnaire by answering the "18 years or older" question. Of those, 587 (39.4%) respondents answered what state they lived in. Because of the importance of identifying geographic patterns in the survey data, much of the analysis presented in the report is focused on those respondents. All of the states targeted for this survey were represented in the final database. The highest percentages of respondents were from Kentucky (15.0%), North Carolina (13.6%), and Mississippi (12.1%).
Secondary databases
Indicators from publicly accessible databases were selected which reflected levels of each of the qualities of resilience defined by integrating eight case studies of resilient local food systems in recalcitrant areas of the Southern U.S. with previous frameworks for assessing resilience. Aggregate county-level data were accessed from the following data sources: 2012 and 2007 National Census of Agriculture, 2010 Decennial Census, American Community Survey 2012 Five-Year Estimates, Winkler et al. Net Migration Patterns for US Counties, County Health Rankings, 2013 USDA Food Atlas, USDA Farm to School Database; and a Meat Processing Facilities Database assembled by Jody Holland, at the University of Mississippi.
The total number of counties is 1344 in the 13 state Southern Region as designated by USDA: Alabama, Arkansas Florida Georgia Kentucky Louisiana Mississippi, North Carolina, Oklahoma, South Carolina, Tennessee, Texas, and Virginia. Forty counties were treated as missing due to insufficient data on number of farm operations in either 2007 or 2012. All other missing values were in the index were counted as 0. Final analysis was based on 1304 cases (counties) and 1302 when the assets measure was included.
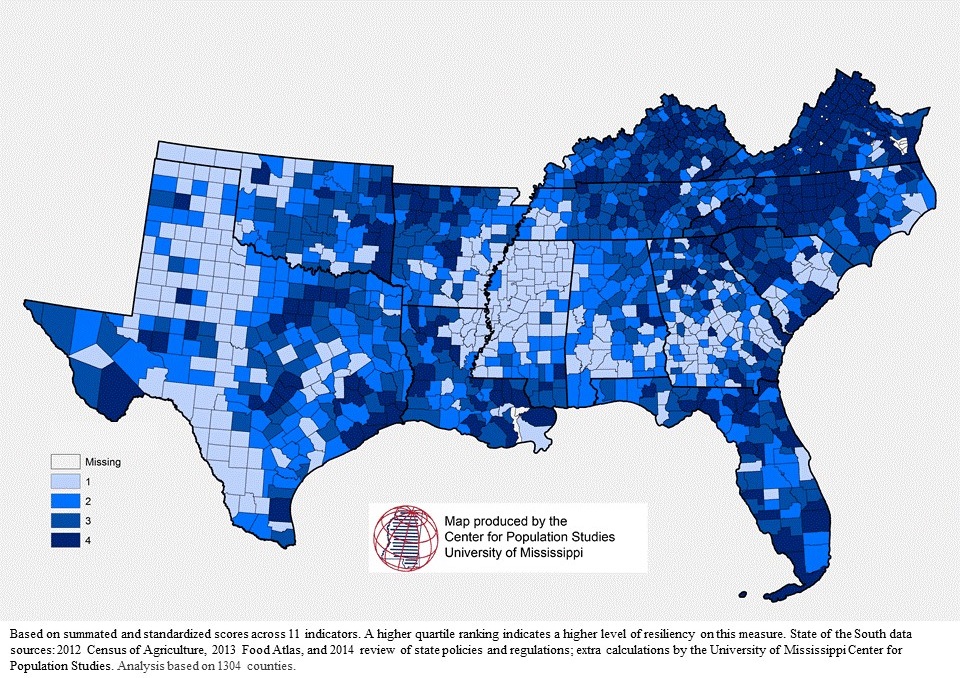
All percentages were transformed to z-scores. Multi-variable indicators were calculated by summing z-scores across component variables. Z-scores were then ranked (higher scores have higher ranks) by county across the entire region. Ranks were then recoded into quartiles for analysis and mapping: Because of low organic certification rates, this variable was only ranked in two categories. On color maps the quartiles were organized as: very low (red), low (orange), moderate (yellow), and high (green). These were later transformed to blue scale (from light to dark) to assist people with color blindness and to make patterns distinguishable when the maps are printed in black and white.
Indicators were selected from the available databases which matched the eight qualities derived from integrating the eight resilient local food system case studies with the ecological resilience literature. Numerical values for each county for each of the eight resilience qualities were obtained using the following variables from the above data sources.
Locally self-organized
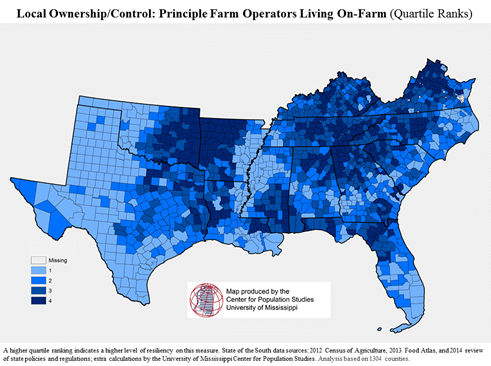
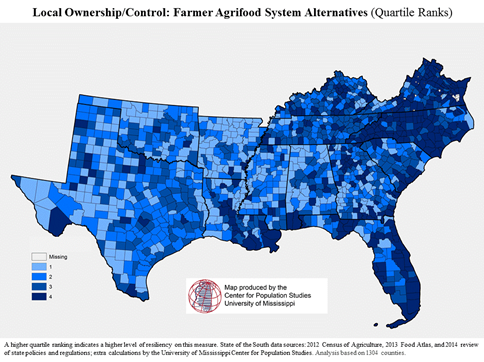
Data on three variables were used to calculate scores for locally self-organized: local farm management, and locally-organized community marketing and processing. Local farm management was measured by one variable: % of principal operators living on farm. Locally-organized on-farm processing and marketing was composed of three indicators (alpha = .739): % operations with on-farm packing; % operations with direct marketing to retail; and % operations with community supported agriculture. Locally-organized community marketing and processing was composed of a cumulative score of meat processing facilities, farmers markets, and farm to school programs.
Ecological integration
Data from four variables were used to calculate Ecological Integration scores. A low chemical input index (alpha = .759) was created from two variables, % agricultural land not treated with herbicides and % agricultural land not treated with insecticides. Acres of crop land was the denominator. The numerator for insecticides excludes treatment for nematodes.
The two other variables included were organic practices (% operations certified organic) and the ecologically integrated practice off management intensive/rotational grazing (% operations practicing management intensive/rotational grazing).
Modular connectivity
Only one indicator was available in county level databases which addressed connectivity: % operations with internet access. None addressed modularity.
Building physical infrastructure
The only available county level data relevant to the Building Assets quality was financial value of machinery. Percentage change in the value of farm machinery between 2007 and 2012 comprised this indicator.
Responsive redundancy
Scores for this quality were obtained by integrating data from two variables. First variable was average age of farm operator: First each county was given a score of the % of the highest average age in the region (68.7). Then these scores were reverse coded for lower average ages to have higher scores on the final indicator based on the assumption that younger farmers provided greater redundancy. Second variable was % decrease in number of farm operations between 2007 and 2012. Scores were reverse coded such that counties with lower percent decrease had higher scores.
Complementary diversity
No county level data were available to reflect complementarity of diversity, so scores for this quality reflect only diversity. Diversity at the county level was derived from three indicators: row crop diversity (average percent of operations producing across seven different row crop options); vegetable production (percent of operations with vegetables harvested) and livestock production (percent of operations with livestock sales).
Conservative innovation
A number of variables indicated conservative innovation but they also are indicators of other qualities. We did not include them in calculations of the resilient index since we didn’t want the index to be heavily influenced by repetition of one variable. As the farm scale index is developed, indicators specific to this quality are available and will be incorporated.
Periodic transformation
At the county level, transformation can only be measured as innovation. No direct measures of transformation are possible. As the farm scale resilience index is developed, the transformation quality will be measureable. However, since this study was focused on county level data, no specific measure of transformation was possible.
Summary Sustainability/Resilience Index (SRI)
All individual variable values were converted to standardized values (z-scores) using the southeastern region as a whole as the base. Multi-variable indicators were calculated by summing z-scores across component variables. An overall summated “Sustainability/Resilience Index (SRI) was then constructed, adding the standardized scores across all of the separate indicators, and then the final index was standardized.
Thirteen standardized scores were summed to create SRI:
- Principal operator lives on farm (1 variable)
- Farmer alternatives (3 variables combined into one indicator)
- Community alternatives (3 variables combined into one indicator)
- Financial value of machinery (1 variable)
- Average age of farm operator (1 variable)
- Stability-change in number of farms (1 variable)
- Row crop diversity (7 variables combined into one indicator)
- Vegetable production (1 variable)
- Livestock production (1 variable)
- Low chemical input (2 variables combined into one indicator)
- Organic practices (1 variable)
- Management intensive/rotational grazing (1 variable)
- Internet connectivity (1 variable)
It is important to note that the SRI was not conceptualized to be equivalent to a scale where multiple indicators would be expected to be highly inter-correlated, each one measuring relatively the same concept and thereby serving as indicators of some broader latent construct. Instead, this index combined a range of indicators that were: a) not expected to be highly correlated, and that b) were better thought of as causes of or contributors to a latent construct, that is “sustainability/resilience” of a specific system.[10]
Methods for demographic and socioeconomic variables
In order to identify the demographic and socioeconomic factors that statistically associate with the sustainability/resilience index, additional indicators were added to the analysis. These included total population as measured through the 2010 Decennial Census. This was based on the assumption that more highly populated areas would likely be able to support more markets and alternative practices. Total net migration between 2000 and 2010 was included from the perspective that places with high levels of out-migration might have trouble supporting local markets and that net out-migration serves as an indicator of a place in somewhat of a downward socioeconomic spiral. Finally, the percent of adults 25 years and older with a college degree and the percent of the families living below poverty according to 2012 ACS five-year estimates (data drawn from 2008 through 2012) were used because these are widely used measures of the general socioeconomic conditions of an area.
Methods for health measures
Two general health measures were used for this study to explore the connection between sustainability/resiliency and health status. One measured focused on adults' self-rated health, and the other concerned maternal and child health in the form of low birth weight rate. These are common population health measures used in the literature, both domestically and internationally.
County-level self-rated health estimates were obtained from 2014 University of Wisconsin/Robert Wood Johnson Foundation County Health Rankings Program, drawing on 2012 five-year aggregated data collected by the Centers for Disease Control and Prevention Behavioral Risk Factor Surveillance System (BRFSS) survey. The original telephone (landline and cellphone) survey question asked respondents age 18 years of age and older to rate their health on a five-point scale ranging from poor to excellent. For the county-level estimates, responses were combined in the poor and fair categories to reflect overall poor health.
County-level low birth weight rate data were obtained from the National Vital Statistics System-Natality (NVSS-N) section, drawing from the Centers for Disease Control and Prevention, National Center for Health Statistics (CDC/NCHS), and state departments of health. Pooled data from 2011-2013 measured the percentage of live births with birth weights of less than 2,500 grams (5 lbs, 8oz). These were standardized into rates per 100 live births.
Analyses of the association between sustainability/resiliency and these health outcomes should be interpreted with caution. The relationships should not be viewed as causal, because the health data were drawn from aggregated time periods that include some years before and overlapping with the times in which local agriculture and food system resilience data were obtained. Instead, the patterns should be viewed as suggestive for future analysis as more recent health data become available.
Methods for integrating resilience index and demographic and socioeconomic variables
Analysis was focused on identifying if patterns existed between the variables. Analysis of the relationship between the resilience index and the demographic and socioeconomic variables were not focused on causality. This would be difficult, especially since the data from both domains were collected from relatively the same time periods. Instead, Association and correlation were measured through the use of two statistically tools. Spearman’s rho was used to measure the association of the continuous standardized scores. A non-parametric measure of correlation on ranks between variables, rho ranges from -1 to +1, with 0 representing no association. Kruskal's Gamma was used to measure the association between variables when they were recoded into quartiles. Gamma also ranges from -1 to +1.
[1] Abatekassa, G., and H.C. Peterson. 2011. Market Access for Local Food through the Conventional Food Supply Chain. Intern Food and Agribus Man Rev, 14(1): 63-82; Bitsch, V. 2005. Qualitative Research. J Agribusiness 23(1):75-91.
[2] Yin, R. K., 2014. Case study research: Design and methods. Los Angeles: Sage.
[3] Maumbe, B. and C. Brown, 2013. Entrepreneurial and Buyer-Driven local wine supply chains: case study of Acres of Land Winery in Kentucky. Intern Food and Agribus Man Rev, 16:135-157.
[4] Locavore Index, 2014. http://www.strollingoftheheifers.com/locavoreindex/
[5] Lauckner, H. et al., 2012. Using Constructivist Case Study Methodology. The Qualitative Report, 17: 1-22.
[6] Yin, ibid.
[7] Eisenhardt, K. M. (1989). Building theories from case study research. The Academy of Management Review, 14(4), 532-550.
[8] Worstell, J., 1995. Southern Futures: Opportunities for Sustainable Agricultural Systems. Almyra, AR: Delta Land & Community. pp. 161-163. https://projects.sare.org/media/pdf/4/8/3/483southern-futures.pdf
[9] Dillman, D., et al., 2008. Internet, Mail, and Mixed-Mode Surveys. Hoboken, NJ: John Wiley.
[10] For more information on this issue of differentiating between scales and indices, see: Bollen, K., & Lennox, R. (1991). Conventional wisdom on measurement: A structural equation perspective. Psychological Bulletin 110(2), 305-314.
State of the South 2015. A major milestone accomplished in this study was capturing the State of Sustainability in Southern States in 2015. This was accomplished through case studies, secondary database analysis resulting in a county-level sustainability/resilience index (SRI) and a survey of Extension agents and farmers which revisited a survey conducted twenty years ago.
The survey yielded voluminous data which is best understood as presented below in the context of each state and its major agroecoregions. One general finding was that nearly all states showed huge increases compared to twenty years ago in whether respondents thought sustainable agriculture was economical. Nearly every state rose at least ten percent, with GA, LA, OK, SC and TX all increasing more than 20%. Only MS, TN and VA had slight decreases.
Consistent with the results of twenty years ago, lack of farmer/rancher interest was ranked by agricultural practitioners as the worst constraint to sustainable agricultural systems across the region. Consistent with overall SRI scores, NC, VA, SC, GA, and FL all saw lack of farmer interest as less a constraint in 2015 than in 1995 as shown below. Also consistent with SRI scores, AR, LA, MS and TN each saw farmer interest in sustainable agriculture practices as more of a problem in 2015 than in 1995.
Removal of the "lack of farmer interest" constraint, among others, may be in the offing due to our quantitative and qualitative results of applying ecological resilience to sustainable agriculture in the Southern states. Ecologically resilient systems withstand and adapt to disturbance. All farmers regularly encounter disturbances they need to overcome or adapt to. Viewed through the lens of ecological resilience, sustainable agriculture research becomes necessary and vital to all farmers.
Progress toward understanding ecological resilience in Southern agricultural systems began with nine case studies of long-lasting local food systems in recalcitrant areas of the South. Case studies were completed and are published online. They are available at: https://meadowcreekvalley.wordpress.com/projects/land/roots-of-resilience-the-book/.
Case studies, in conjunction with an extensive review of past ecological resiience research, provided the foundation for arrival at eight qualities of resilience. Exploration of these qualities and practical means of strengthening them are also found at the above link.
Combining the eight qualities into an overall index of sustainability/resilience. Using the methods described in Materials and Methods, we obtained data for every county in the 13 Southern States on all these qualities for which county level indicators are available. Below we provide this data for each quality. We united the data from all these qualities in an overall sustainability/resilience index (SRI) which provides estimates of sustainability/resilience for each county in the South.
County-level SRI scores are summarized in the following chart. Virginia counties had higher scores than any other Southern State. 68% of Virginia counties scored in the top quartile of all Southern counties. North Carolina was second with 53% of counties in the top quartile. Kentucky was third with 46.7%. However, Kentucky had the lowest number of counties in the lowest quartile of all Southern States (2.5%).
Mississippi, on the other hand, had 68.3% of counties in the lowest quartile, for the lowest ranking of all Southern States. Only 2.4% of Mississippi Counties ranked in the highest quartile of Southern counties. Alabama was second lowest overall with 3% in the highest quartile.
The data reveal a fascinating set of patterns. Mississippi is extremely bottom heavy with number of counties in each quartile growing exponentially as the scores go lower. The highest number of counties per quartile for Alabama, however, was the second lowest quartile.
Other states, though having high numbers of counties in the lowest category, had flatter distributions, spread over all quartiles. Georgia had the second highest number of counties in the lowest quartile (40.9%), but still managed to get 14.5% of counties into the highest quartile.
Simple means obscure this county level variation. Number of counties ranking in the top quartile across the South seems a better measure of how each state is moving toward sustainability/resilience. The percentages and ranking of each Southern State are shown in the above box
Total SRI scores show Southern states falling into five groups based on these scores. Virginia stands out above other states. North Carolina and Kentucky make up the second tier. South Carolina, Florida and Louisiana have similar percentages to comprise a third tier (32.6 to 27.4). Tennessee, Arkansas, Georgia, Oklahoma and Texas comprise a fourth tier with scores from near 12 to 17.9. Alabama and Mississippi are clearly at the bottom on this measure of sustainability/resilience at the county level.
|
States ranked by % of counties in highest quartile across South |
||
|
Rank |
State |
% |
|
1 |
Virginia |
68.3 |
|
2 |
North Carolina |
50.3 |
|
3 |
Kentucky |
46.7 |
|
4 |
South Carolina |
32.6 |
|
5 |
Florida |
31.3 |
|
6 |
Louisiana |
27.4 |
|
7 |
Tennessee |
17.9 |
|
8 |
Arkansas |
17.4 |
|
9 |
Georgia |
14.5 |
|
10 |
Oklahoma |
13.0 |
|
11 |
Texas |
11.8 |
|
12 |
Alabama |
3.0 |
|
13 |
Mississippi |
2.4 |
However, the variation within states is profound and much more revealing than state level scores. Every state has several counties in the top quartile of SRI scores and several in the bottom quartile. See the following map for details.
Individual qualities of resilient systems I:
Local Self-Organizing in Resilient Systems
Locally owned processing and marketing systems based on ecologically sound production systems are the foundation of sustainable food systems.[1]
Is your system owned cooperatively? Do you know who and what businesses are around you? Are you working with your neighbors? Do you work with any state or government organizations to lobby for political changes? Are you active with local groups like a farmers work exchange? What are you doing to foster and improve local organizations?
Natural systems are self-organized based on interactions of local components. Self-organization is a process where order and coordination arise out of components of an initially disordered system. This process is spontaneous and not directed or controlled by any agent or subsystem inside, or outside, of the system. Self-organizing systems are encountered in many scientific areas including biology, chemistry, geology, sociology and information technology.[2]
Self-organization of matter generates much of the complexity of the inorganic world, from molecules to galaxies. Self-organization in living systems is evident in the formation of proteins, the spindle apparatus and other micro-tubular forms, the cell membrane and various vesicular forms, and in the construction of the nests of social insects—to name some of the more intensively studied systems.[3]
Natural systems develop organization without an outside agent to insure local organization. Biological systems often function with mechanisms of decentralized control in which the numerous subunits of the system—the molecules of a cell, the cells of an organism, or the organisms of a group—adjust their activities by themselves on the basis of local information.[4]
Planetary systems, organic cells, and animal societies show self-organization at various scales. What is local is relative to the scale of the system. At different scales, local can be magnitudes of difference in distance. Local for a country is bordering nations. Local for a community is farms around it. Local for rhizobia is a few inches of soil. Local for a planet is its solar system. Local to a solar system can be the galaxy. Local to a garlic bulb is its bed. What is local to a garlic farmer?
From a systems perspective, local is, therefore, more about self-organization than about distance. Local is the scale at which a system can self-organize with other complementary systems. Self-organization in our food system has occurred over vast distances through the interaction of huge agribusinesses. We show below that such far-flung systems have repeatedly created food systems which are not resilient for small farmers or for consumers. Survival of individual small farms or individual consumers is of no concern to agribusinesses operating at a global scale. However, the global agribusiness depends on the survival on consumers. If the global company is only extracting profit by providing inputs, then the outputs of the consumers have no market and the resilience of the global company is gradually undermined through destruction of the local economy. Destruction of local food economies and subsequent increase in famine is too often the result of provision of food aid from outside for famine stricken countries.[5] Transportation technology can make distances short but only by introducing the risk of multiple disturbances which no system can withstand. Moreover, even if the production cost of those items is lowered to an extreme low, the distribution costs often outweigh the savings.[6]
Urbanized civilizations which only extract from rural areas eventually collapse as the rural resource base is eroded. If not based on complementary support to local producers, such systems decline and disappear. The self-organizing of living systems means that centralization is a powerful driver in food systems. However, we need not accept this tendency as inevitable.
The following will show how a system which is decentralized, modular, and redundant can withstand and overcome a system which does not support small, local farmers. In resilient systems, each locally self-organized system is a unique innovation, but a conservative innovation based on past successes. Self-organization leads to innovative redundancy. That is, a system organizes itself locally with one output always being new units of the same type—creating redundancy. But these new units, to condition resilience, are not cookie cutter version of original. They are all unique and innovative, though conserving the successful innovations of the past. So the redundancy is not just replacement, but always replacement with something slightly different. In an agricultural community this could take the form of a new apprentice over time changing the system slightly, or dramatically, to integrate new ideas that the original farmer wouldn’t have included themselves. Redundancy, innovation and transformation are more thoroughly explored in other chapters.
In the final section of this chapter, we will focus on one particular sector (meat processing) to show how self-organization at any scale will only survive if there are no competing organizations around which operate at a higher scale. Local food stores thrived until corporations operating at larger scales ran them out of business. To survive, small producers must join forces to create emergent wholes at a higher scale, but this can only happen if a group of small producers are complementary and compatible. If the component systems are too diverse, they won’t be able to work together and will fail. If anyone of them is too selfish, then others will fail and the emergent system will collapse.
Locally self-organized systems and justice. One final introductory comment is a caveat. Local self-organization is no guarantee of that everyone’s criteria for justice and equity will be met.[7] Local self-organization is a necessary quality for food system resilience because it is necessary in nature. Nature is not compassionate or even cognizant of 21st century standards for social equity. This is explored in more detail in Impact of Results section. This section shows that ecological resilient counties (as measured by our sustainability/resilience index) are more likely to have low poverty rates and better health outcomes.
Food systems and local organization. Systems generated by people are often not locally organized on the farm scale. Food systems in the U.S. became notoriously lacking in local organization in the latter half of the 20th century. The reasons are many. Consumers want cheap food and supermarkets want high profits. Big box stores competing for market share have learned to force farmers to meet their standards and accept low returns. Even buyers which pay reasonable prices dictate that small farmers must be GAP certified and pay horrendous insurance bills before they can sell one tomato.[8]
The only way to meet both desires is to lower quality and increase volume. So the Hard Times, Hard Tomatoes[9] story unfolded where lower quality food was grown on larger and larger farms run by huge corporations. Economies of scale can’t be finessed in commodity production. Once a product or process becomes commodified, those with access to the most capital will win.[10] Small family farms disappear.
For large corporations to achieve economies of scale in production, they must transport foods long distances. Fruit and vegetable breeders have produced tougher and tougher food which resembles packaging more than the food.
Many books and movies, more every day, document this trend. In recent years, it’s a blizzard.[11] Best-selling authors do overstate the case to sell books: the industrial food systems “has triggered the homogenization of our society… has hastened the mauling of our landscape, a widening of the chasm between rich and poor, fueled an epidemic of obesity, and propelled the juggernaut of American cultural imperialism abroad.”[12] These books thoroughly document how the industrial food system/university complex has “lured us into choosing diets deficient in nearly everything except calories, supporting practices deceptive in every aspect from advertising to flavoring, and systems that degrade nearly everyone and everything involved. The problems arising from the fast food industry are rooted deeply within American society.”[13]
The result of this cultural blizzard is that local food has become politically correct. Nearly every undergraduate is taught local food is best. The trend has reached such a crescendo, that some contend that, “every church wants a farmers market.”[14]
People across the political spectrum are on the bandwagon. “The future of food is local” is not the motto of a radical earth mother, but the sentiment of a conservative Republican Arkansas Congressman in public meetings in both 2012 and 2013[15]. On June 3, 2013, Wal-Mart announced it planned to double sales of locally grown produce by December 2015[16]. Wal-Mart and a rural Republican Congressman are promoting what was once a very suspect alternative agriculture, even among the most ardent sustainable agriculture advocates[17].
Twenty years ago, local food systems were struggling to be born; in some places the struggle continues. Though the first “local food systems” workshop held in the US[18] occurred in the South and the South has virtually unlimited food production capacity, the South is ranked extremely low in prevalence of local food systems.
One prominent 2015 index[19] puts only two of the Southern states (South Carolina and Virginia) in the top half of all US States in presence of local food systems. North Carolina is 28th, Kentucky 29th and the other nine Southern states are ranked in the lowest 11 states. With the exception of the top three states, all other Southern states’ rankings are decreasing.
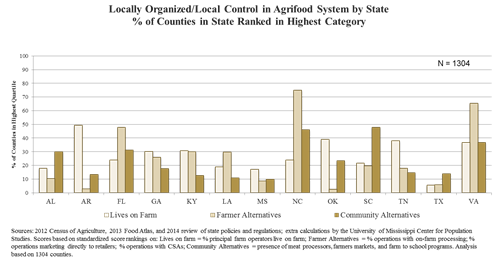
Secondary database analysis of locally self-organized (LSO) quality. Based on variables available at a county-level in the 20122 and 2007 USDA Agricultural Census, we made the estimates of strength of this factor in all Southern states. The following charts and maps show the rankings of states on three county-level measures of the locally self-organized (LSO) quality of sustainable/resilient systems. More resilient counties and states are more locally self-organized. The three available county-level measures, as discussed in the Methods section are: % of farm operators living on the farm and two sub-indicators indices. Farmer Alternatives Index measures local self-organization for marketing and processing at the farm-level. Community Alternatives Index measures local community level processing and marketing. These three components of the LSO quality are shown in the following bar chart.
Manager living on the farm measure of LSO. The following box shows the rankings of states regarding managers actually living on their farms. The top three states on this measure of local self-organization (Arkansas, Tennessee and Oklahoma) rank much higher than their overall SRI scores. Virginia and Kentucky, more consistent with their overall SRI scores, also rank highly.
North Carolina, South Carolina, Florida and Louisiana, on the other hand, rank much lower than their overall SRI.
Alabama, Mississippi and Texas rank near the bottom of this measure as well as the overall SRI.
The spread between the top state, Arkansas, and the rest of the states is noteworthy, as is the distance Texas is below all other states.
|
States ranked by % of counties in highest quartile of farm operators living on the farm across South |
|||
|
On Land |
Overall SRI |
State |
% |
|
1 |
8 |
Arkansas |
49.3 |
|
2 |
10 |
Oklahoma |
39.0 |
|
3 |
7 |
Tennessee |
37.9 |
|
4 |
1 |
Virginia |
36.8 |
|
5 |
3 |
Kentucky |
30.8 |
|
6 |
9 |
Georgia |
30.2 |
|
7 |
2 |
North Carolina |
24.0 |
|
8 |
5 |
Florida |
23.9 |
|
9 |
4 |
South Carolina |
21.7 |
|
10 |
6 |
Louisiana |
18.8 |
|
11 |
12 |
Alabama |
17.9 |
|
12 |
13 |
Mississippi |
17.1 |
|
13 |
11 |
Texas |
5.5 |
The adjacent map shows graphically the county level scores on this indicator of LSO across the South.
The second measure of the LSO quality of resilient systems is the sub-index of farmer organization of processing and marketing. The following box shows the rankings of states regarding such local farmer organization.
This measure showed one of the widest variations of any measure across states. In the top state, North Carolina, 75% of counties were in the top quartile on this measure, compared to less than 3% for the lowest ranked states: Arkansas and Oklahoma.
Also extreme is the reversal of both of the latter states compared to their ranking on the previous measure of local self-organization. From ranked at the very top, Arkansas and Oklahoma ranked at the very bottom on this measure. Tennessee also dropped from the top tier on the first LSO measure to the bottom half of states.
Alabama, Mississippi and Texas had consistently low scores on both measure, but the extremely low scores of Arkansas and Oklahoma kept them from staying in the bottom three ranks.
North Carolina and Virginia occupy the top two spots on this measure, far above other states, consistent with their top spots on the overall SRI.
|
States ranked by % of counties in highest quartile of farm-level organization of marketing and processing |
||||
|
Local farm organized |
On Land |
Overall SRI |
State |
% |
|
1 |
7 |
2 |
North Carolina |
75.0 |
|
2 |
4 |
1 |
Virginia |
66.3 |
|
3 |
8 |
5 |
Florida |
47.8 |
|
4 |
5 |
3 |
Kentucky |
30.0 |
|
5 |
10 |
6 |
Louisiana |
29.7 |
|
6 |
6 |
9 |
Georgia |
25.8 |
|
7 |
9 |
4 |
South Carolina |
19.6 |
|
8 |
3 |
7 |
Tennessee |
17.9 |
|
9 |
11 |
12 |
Alabama |
10.4 |
|
10 |
12 |
13 |
Mississippi |
8.5 |
|
11 |
13 |
11 |
Texas |
5.5 |
|
12 |
1 |
8 |
Arkansas |
2.7 |
|
13 |
2 |
10 |
Oklahoma |
2.6 |
The following map shows county level scores on this indicator of LSO.
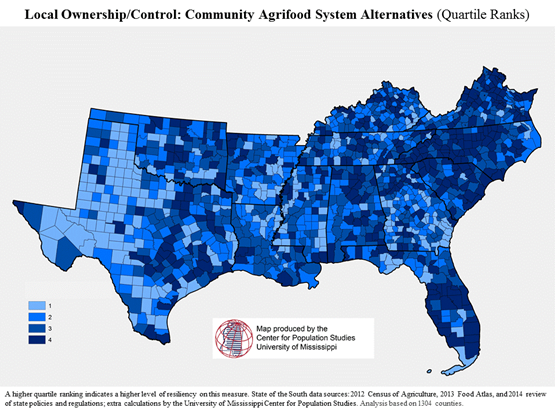
The third measure of the LSO quality of resilient systems is the sub-index of community organization of processing and marketing. The following box shows the rankings of states regarding such community organization.
The top ranked states on this measure of resilience generally rank high on overall SRI and on the second LSO measure: locally farm organized.
Alabama and Oklahoma, however, score high on this measure though they achieved low rankings on overall SRI and local farm organized processing and marketing.
Mississippi, Arkansas, and Texas all ranked low on this quality. Louisiana stands out at the bottom of these rankings because it’s overall score and local farm organization score are both much higher than the Louisiana score on local community organization of processing and marketing.
|
States ranked by % of counties in highest quartile of community organization of marketing and processing |
||||
|
Local community organized |
Local farm organized |
Overall SRI |
State |
% |
|
1 |
1 |
2 |
North Carolina |
64.0 |
|
2 |
7 |
4 |
South Carolina |
52.2 |
|
3 |
2 |
1 |
Virginia |
50.0 |
|
4 |
3 |
5 |
Florida |
46.3 |
|
5 |
9 |
12 |
Alabama |
34.3 |
|
6 |
13 |
10 |
Oklahoma |
29.9 |
|
7 |
4 |
3 |
Kentucky |
29.2 |
|
8 |
8 |
7 |
Tennessee |
29.5 |
|
9 |
6 |
9 |
Georgia |
21.4 |
|
10 |
12 |
8 |
Arkansas |
17.3 |
|
11 |
10 |
13 |
Mississippi |
17.1 |
|
12 |
11 |
11 |
Texas |
16.9 |
|
13 |
5 |
6 |
Louisiana |
14.0 |
The adjacent map shows county level scores on this indicator of LSO.
Citations on Local Self-Organizing Quality
[1] Worstell, J., 1995. Southern Futures: Opportunities for Sustainable Agricultural Systems. Almyra, AR: Delta Land & Community. Also available at: https://projects.sare.org/media/pdf/4/8/3/483southern-futures.pdf
[2] For overviews of this research see, for example, Camazine et al., 2003. Self-Organization in Biological Systems, Princeton University Press.
[3] Edelmann, J.B. and M. J. Denton, 2007. The uniqueness of biological self-organization: challenging the Darwinian paradigm. Biol Philos, 22:579–601.
[4] Seeley, T.D., 2002. When Is Self-Organization Used in Biological Systems? Biol. Bull. 202:314–318.
[5] http://www.feedthefuture.gov/
[6] Ralph Bordosi- In his book “The Distribution Age” For a full reading visit this website: http://www.soilandhealth.org/03sov/0303critic/030308borsodi.dist.age/030308toc.htm
[7] See, e.g., Born, B. and M. Purcell, 2006. Avoiding the Local Trap: Scale and Food Systems in Planning Research Journal of Planning Education and Research, 26:195-207.
[8] Personal communication 6/18/2012 from Julie Donnelly of Deep Woods Farm in Bradley, County, AR who is very pleased with the price from Whole Foods, had to pay $1100 for insurance in order to sell to them..
[9] Jim Hightower, 1973. Hard Times Hard Tomatoes, Rochester, VT: Schenkman Books.
[10] Worstell J., 1991. Commodification waxes, sustainability wanes: the case of burley tobacco. Rural Sociological Society Annual Meetings. August 20, 1991, Columbus, Ohio.
[11] Thirteen examples of recent books on our changing our destructive food system: http://www.cornucopia.org/2013/06/13-books-on-the-food-system-that-could-save-the-environment/
[12] Eric Schlosser, 2001. Fast Food Nation: The Dark Side of the All-American Meal. Penguin.
[13] [13] Ikerd, J. 2005. Eating local: a matter of integrity. http://web.missouri.edu/ikerdj/papers/Alabama-Eat%20Local.htm.
[14] Christian Shuffield, April 13, 2013, Argenta Farmers Market manager, North Little Rock, AR.
[15] U.S. Rep. Rick Crawford represents North Central and East Arkansas and spoke in DC and Jonesboro, AR.
[16] http://www.arkansasonline.com/news/2013/jun/04/retailer-stock-fresher-produce-20130604/
[17] Ferd Hoefner, esteemed chief policy analyst for National Sustainable Agriculture Coalition, once dismissed local foods as indefinable and unworthy of legislative support.
[18] Held in February 1994 at Williamsburg, VA and summarized in Chapter 11 of Worstell, 1995, ibid.
[19] http://www.strollingoftheheifers.com/locavoreindex/
Individual qualities of resilient systems II:
Networked Yet Independent: Modular Connectivity
Do you know your neighbors? Do you share labor and equipment with them? Are you independent enough to survive without these connections? Can those connections be severed if need be? Do information and resources flow freely and openly through your system? Do you maintain good relationships with alternate markets? Can this free flow be staunched in times of crisis?
These questions reflect the sometimes contradictory contributions of modular connectivity to resilience.
For a farm, business or any system to withstand catastrophe, networks inside and outside the system are crucial. Managing connectivity between components is consistently cited as one of the most important factors in resilience of ecosystems and agroecosystems.[1] Those interested in sustainability have often adopted a simplified way of looking at connectedness as illustrated in the adjacent figures. The centralized system relies on the strength of the central node to withstand disturbance. The decentralized system makes possible survival of part of the system by cutting only a few links. The distributed system is more resilient to some types of disturbance (such as an enemy attack on a communication network) but since every node is ultimately connected to every other node introduction of some disturbances, such as fire and disease, result in a system as vulnerable as the centralized system.
Centralized systems are more vulnerable to fluctuations, less able to adapt to changing conditions, and often imply large investment in both the system itself and its supporting infrastructure. Decentralized systems tend to be more flexible and able to adapt to local conditions. Because of these attributes, they often not only operate more efficiently, but also reduce energy use.
In human systems, large, centralized systems are, by necessity, controlled by expert specialists and organizations that can leverage the requisite capital; as such, they are divorced from democratic decision-making processes.[2] Centralized system also tend to centralize costs and benefits, which often accrue to different parties at opposite ends of the system: costs accrue "downstream;" benefits go to those who control the systems that are "too big to fail." Thus these systems become engines of inequality. Studies of the rise and fall of civilizations shows two types of social trajectories: one characterized by increasing hierarchy, large-scale capital investments, environmental change, and ultimately collapse; the other characterized by local decision-making, incremental change, and long-term resilience.[3]
Social capital and connectivity. In social ecological systems, the types of connectivity have been thoroughly explored under the rubric social capital. Three types of social capital (bonding, bridging and linking) help communities withstand disturbances such as hurricanes, drought, climate change, market shocks, and violent conflict.[6] Connectivity in natural ecosystems is much more complex. In ecosystems, typically each species is closely linked, directly or indirectly, to all others in the system, as shown in the adjacent Figures.[4] Connectivity is especially crucial in resilience to disturbance. For example, after a typhoon or hurricane when coral is damaged, algae can invade and prevent coral from reestablishing themselves. If the coral reefs offshore are connected to near-shore nursery habitat for algae-eating fish, the fish come to the rescue, keep algae in check and enable coral reefs to bounce back.[5]
Our local food system case studies demonstrate the powerful impact of connectivity in agricultural systems. A network of farmers and locavores in Mississippi kept a farm productive and profitable when the owners had to stay away for weeks at a time from the farm to attend to a sick child. Their farm would not have survived without the network connections. Also in Mississippi we spoke with a cooperative in Macon, developed in the 1960’s to create a market for black farmers. Their willingness and ability to connect to one another and cooperative agencies throughout the south determined the livelihood of black farmers for decades after the establishment of the cooperative.
Bonding social capital is seen in the strong relationships between community members. It engenders trust, reciprocity, and cooperation, and is often drawn on in disasters, where survivors work closely to help each other to cope and recover. Trust is cited as crucial in many reviews of resilient communities.[7]
Bridging social capital connects members of one community or group to other communities/groups. It often crosses ethnic/racial lines, geographic boundaries and language groups, and can facilitate links to external physical infrastructure and broader social and economic identities. Bridging social capital makes a direct contribution to community resilience in that those with social ties outside their immediate community can draw on these links when local resources are insufficient or unavailable. High levels of connectivity between different social groups can increase information sharing and bring in outside perspectives and new methods for dealing with local issues.
Linking social capital is seen in trusted social networks between individuals and groups interacting across explicit, institutionalized, and formal boundaries in society. Linked networks are particularly important for economic development and resilience because they provide resources and information that are otherwise unavailable. This type of social capital is often conceived of as a vertical link between a network and some form of authority or power in the social sphere.
Networks, social capital and development. A vast literature exists on the success of networks of small and medium-sized enterprises in coordinating manufacturing and marketing to increase profitability[8]. Prominent examples of transformation of regional economies through such networks are the Mondragon region of Spain[9] ; north central Italy[10] ; the dense social networks of East Asian economies such as Japan, Korea, Taiwan, China[11] ; Co. Monaghan, Ireland[12] ; Silicon Valley, Route 128 in Boston, Toulouse, Baden-Wurtemburg, Bavaria, Jutland, and many others[13].
Such observations have led to a significant increase in policy strategies which seek to build such networks[14]. Such rural development efforts have also increased political effectiveness of local farmers in Rondonia[15], Chiapas, and many other regions[16]. The political impact on regional rural development policies extends far beyond the marketing, processing, or credit ventures which were the original goals of the networks.
Where rural networks of small enterprises have transformed local economies, consistently present is an atmosphere encouraging competition of ideas and innovation[17] and cooperation between entrepreneurs[18]. The consistent social characteristics of successful entrepreneurial networks and successful rural communities have been labeled as ‘network capital’[19] , ‘social networks’[20] , ‘guanxi networks and guanxi capital’[21] and as ‘social trust’[22] . All these concepts are variants of the concept of social capital which has a history of use in print since at least 1916[23] . The social atmosphere which encourages innovation, competition of ideas, and cooperation between entrepreneurs requires all three types of social capital: bonding, bridging and linking.[24] Much like a resilient system which requires all components to be resilient, not just a few, to build robust and healthy social networks all three types of social capital are inherent to success.
The use of such social capital is seen to explain success of various ethnic groups including Chinese in the Mississippi Delta[25] , Lebanese in West Africa, Armenians in Europe and US, Koreans in US inner cities, Indians in New Zealand, Palestinians in California and many others[26] . Bonding social capital corresponds to the few strong connections characteristics of resilient systems. To be sure though, there is risk inherent in developing a network or system that is too linked, too bridged, or too bonded.
The dark side of bonding social capital. High levels of bonding, can result in homogenization of norms and a drop in the explorative ability of group members, leading to a situation where the network members all think in the same way and may believe they are doing well while they are actually traveling unsustainable pathways. Organized crime groups and youth gangs are among groups exhibiting high levels of bonding, but low levels of long-term resilience. The rise of the nationalistic political parties is accompanied by increases in standard measures of bonding social capital.[27] In Russia and China, blat and guanxi refer to a very intensive bonding social capital where participants can make virtually unlimited demands on each other leading to corruption and non-resilient allocation of resources.[28] Though, Crony capitalism including lobbying for support of commodity payments is a result of linking, bridging and bonding social capital which enables systems to expand at the expense of long term system resilience.
Necessary but not sufficient. Some contend that high levels of bonding social capital, when accompanied by high levels bridging and linking social capital will result in high levels of resilience.[29] The case studies and database analysis shown in this study indicate social capital is just one of the factors required for resilience. However, when such social capital is combined with the other factors we discuss, resilience is vastly enhanced.
In natural ecosystems and early theories[30], change toward more resilient systems is stimulated by crisis or disturbance. Natural systems don’t change unless they have to. Human systems can change toward more resilient social ecological systems without a crisis, but often with a paradigm shift which is facilitated by linking, bridging and bonding social capital.[31] Carlisle chronicled a group of grain farmers, organized around a resilience perspective, who faced the same problems of drought and debt as their neighbors. However, this producer group embraced a more ecologically integrated approach. To experience this shift, producers needed a theory, not just a problem. The theory was supplied through their bridging and linking connections. Farmers re-oriented their focus from maximizing the exchange value of resources leaving the system to sustaining and renewing the value of resources remaining in the system (see Building Physical infrastructure chapter). As shown in our case studies, the resilient farmers diversified their markets and built up their soil, water and processing physical infrastructure.[32] Social capital, however, was just one of the components needed to engender resilience.
Some sustainability and resilience advocates contend that broadening participation is key to resilience. Though this is an admirable goal, much empirical research shows broadening participation can only result in increased resilience if other required factors are also present. In fact, broadening participation may bring in people who thwart resilience.[33]
Tempering connectivity with modularity. Too much connectivity (whether bridging and linking or other) can be a problem. Limited connectivity can sometimes boost the resilience of an ecosystem service by acting as a barrier to the spread of disturbances such as a forest fire. An overly connected system may reduce the probability of population survival when all populations are affected by the same disturbance, for instance a fire or disease. A social-ecological examples is the loss of electricity across the eastern USA and Canada in 2003, which affected some 50 million people, and occurred when local failures in a highly connected system eventually led to a total, systemic collapse.
Just as high connectivity across a landscape can increase the risk for simultaneous exposure to a disturbance, well-connected actors with similar types of knowledge, and preferences for immediate gains rather than long-term resilience can lead to negative outcomes. Stock market and real estate bubbles can be some of the results.
Modularity helps contain disturbances by compartmentalizing social-ecological systems whereas over-connectivity can be associated with the collapse of systems. Modularity, the ability to close down connections, denying connectivity, prevents the collapse that unbridled connectivity permits. Modularity contains disturbances by separating social-ecological systems from each other, e.g. land management with prescribed fire that uses firebreaks to limit the spread of the fire. Similarly, quarantine mechanisms may restrict the spread of epidemics or invasive species.
Modularity, by preserving populations, assist in regeneration following disturbance. For example, where populations are too closely connected, severe disturbances to one population (such as oil spills, hurricanes, or disease) may affect all populations. However, where populations are separated in space, disturbances to some will not impact all, and unaffected populations may provide important regional sources of seed stock and other materials for recovery.
Modularity requires the ability to be independent. Systems must be able to survive with reduced external input in order to keep a disturbance outside. Farmers who can produce their own transplants won’t get disease from transplants grown elsewhere. Creation of fertilizer on the farm rather than relying on outside suppliers is perhaps one of the most poignant examples of independence today. So much of agriculture relies on the total connectedness of farmer to purchaser, farmer to seed supplier, farmer to chemical company, farmer to….. With reliance on so many external system to uphold the farm, it becomes increasingly vulnerable, especially when required to enter restrictive contracts that often consider on farm physical infrastructure as collateral. With increases in weather extremes and the fluctuation of water availability to many parts of the world it is increasingly likely that a crop failure could occur. This single failure, perhaps by no fault of the farmer, could spell the end of his career based on seizure of his physical infrastructure. This is clearly an example of connectivity gone awry.
The relationship between connectivity and resilience is characterized by a threshold effect. Connectivity contributes to resilience up until a certain point at which a degree of modularity can prevent revolt in a system and a shift to an alternative stable state.
In other cases, openness of a social-ecological system might be the key to general resilience, e.g. seed dispersal as a key to recovery from large infrequent forest fires. Hence, there are a number of trade-offs between modularity and connectivity that is well understood for some social-ecological systems, but not for others.
Connectivity and redundancy. Successful networks support and stimulate each other. In resilient systems, this support of networks leads to what ecologists call redundancy. Redundancy builds out of networks. The resilient system is always using modular connectivity to build redundancy. A network of similar enterprises helps each other overcome constraints and disturbances which might destroy a farm or company of any system operating on its own. The redundancy chapter (Who’s got your back?) explores this in more detail.
Feedback and connectivity in complex adaptive systems. Feedbacks are the two-way ‘connectors’ between variables that can either reinforce (positive feedback) or dampen (negative feedback) change. An example of reinforcing feedback is introduced grasses in Hawaii that catch fire easily, which promote further growth of the grasses and curb the growth of native shrub species. More grass leads to more fire which, in turn, leads to more grass. This becomes a loop and self-reinforcing feedback. An example of a dampening feedback is high body temperature causing the body to sweat leading to decreased body temperature.
In many situations negative feedback does not occur quickly enough to change a system before resilience is radically reduced. Imagine an ecosystem such as a freshwater lake that provides you with readily accessible drinking water. The quality of this water is linked to slowly changing variables such as the phosphorus concentration in the sediment, which is in turn linked to fertilizer runoff into the lake. These “slow variables” do not have tight, quick feedback to the farmers applying phosphate to their fields. Similarly, when we import goods from overseas, often we don’t know how it was produced or the deleterious effects on social ecological systems from its production. This lack of tight feedback can result in change in the slow variables of pollution and worker degradation which stifle resilience.
In the social domain, values and traditions can also be important slow variables. They can affect existing ecosystem services, for instance, through agricultural practices, such as when and how much fertilizer is used in the fields surrounding a lake. When these values and traditions change (e.g., through paradigm shifts to more ecological integration), slow variables eventually see the effect.
In most cases, dampening feedback helps to counteract disturbance and change so that the system recovers and keeps working in the same way, producing the same set of ecosystem services.
An example of this is the shift from clear to algae-dominated water in shallow lakes. Clear water shallow lakes usually have many rooted plants growing on the lake floor. These plants absorb phosphorous and nitrogen runoff from agricultural and urban development in the surrounding catchment and help to keep the water clear.
However, there is a limit to how much disturbance or change a system can be exposed to before they are overwhelmed. The system may then become configured in a different way. In the case of the lake, increasing agriculture in the surrounding area might result in phosphorous and nitrogen levels in the water that eventually exceed the absorptive capacity of the plants. Once this threshold is crossed, excess nutrients in the water lead to growth of free-floating algae. The algae in turn reduce light penetration, gradually leading to the death of the rooted vegetation and the loss of the dampening feedback they provided. Restoring a clear water regime usually requires repeated manual removal of algae, and the reduction of nutrient runoff to a level far lower than what it was before the regime shift occurred. Only then may the rooted plants re-establish themselves and help recreate a clear water regime.
Complex adaptive systems and feedback. The feedback loops discussed above are simplified. As discussed in earlier chapters, biological and social systems are self-organizing systems that adjust and reorganize in response to disturbance and change, such as floods, hurricanes, fires, invasive species, or immigration of species.
These complex adaptive systems are composed of complex adaptive systems which are continuously changing and adapting to the other systems they are in contact with. The key challenge in managing slow variables and feedback is identifying the slow variables and feedbacks that maintain the social-ecological regimes which produce desired ecosystem services. Since all systems are adapting and changing as complex adaptive systems, unforeseen consequences are ubiquitous. Intensive experience in the system is required to identify key feedback systems which must be enhanced to insure resilience.
Limiting fishing around coral reefs did not result in increase of fish which graze on plants competing with coral until researchers recognized that these fish were hatched and spent their youth away from the coral near shore. When these areas were protected, the abundance of herbivorous fish controlled competing plants and enabled resilience of the coral.[34]
Feedback and nonverbal communication. Feedback is a type of communication. In social ecological systems, communication between people is crucial. Lack of understanding of feedback from key stakeholders in a social ecological system can stymie efforts to increase resilience. Much communication is beyond words and those who don’t read these nonverbal cues may be unable to facilitate resilience. The constant adaptation and change of complex adaptive systems means a misinterpretation of nonverbal behavior can destroy progress toward resilience. Individual differences in nonverbal communication skills have been quantified as emotional intelligence.[35] Most nonhuman communication is nonverbal and other organisms must be very adept at it to be resilient. Nonverbal skills and abilities are important in initiating and maintaining social interaction, developing interpersonal relationships, and managing impressions. Nonverbal skills and abilities are also linked to stress management. Most importantly, nonverbal skills can be learned and improved. For example, research on deception detection suggests that this decoding ability improves by providing feedback concerning performance and accuracy and with practice.[36]
The foundations of community resilience. Though controversial and outside the mainstream of evolutionary research, increasingly many contend that ecological communities are the units which survive extinction events and recover from them. [37] Charles Darwin described the sterility of certain castes of social insects, and more generally, the reproductive self-sacrifice such organisms represented, as "one special difficulty, which at first appeared to me insuperable, and actually fatal to my whole theory." In the 1960's, W.D. Hamilton proposed the theory of "kin selection," which offered a brilliantly simple explanation for such altruistic behavior. Hamilton recognized the importance of a measure he called inclusive fitness, which incorporates both the individual's personal reproduction (classical fitness) and its influence on the reproduction of collateral relatives. The essentials of kin selection and inclusive fitness are summarized according to a simple equation, called "Hamilton's Rule," which is expressed: C/B < b. "This says that the cost C (which is the loss in expected personal reproductive success through the self-sacrificing behavior) divided by the benefit B (the increase in the relatives' expected reproductive success) must be less than b, the probability that the relatives have the same allele," if the altruist gene is to survive natural selection.
If, for example, an individual had the choice of saving his own life or the lives of two sisters or eight cousins then the survival of the fittest theory should be indifferent about the choice as they will save the same number of genes. But on the other hand if I could save three sisters instead or nine of my cousins then the theory would favor the self-sacrificial act, “saving my kin rather than saving my skin!”
The idea of the “fittest” in Darwin’s theory is the ability of an individual to survive and reproduce and therefore to pass on some of their genes. If a mother gives up her life for her offspring, the mother ceases to exist. But, from another point of view, the mother continues to live on in her child, genetically. Although the mother as an individual has not benefited from her altruism, half of her genetic code survives.
This new definition of fitness shifts the focus from individual fitness to family fitness, which takes into account the survival of an individual’s relatives. Evolution is no longer seen simply to be a process of individual selection, but also one of family selection.
Certain small birds, robins, thrushes and titmice, for example, warn others of the approach of a hawk. They crouch low and emit a distinctive thin, reedy whistle. Although the warning call has acoustic properties that make its source difficult to locate in space, to whistle at all seems at the very least unselfish; the caller would be wiser not to betray its presence but rather to remain silent. The bonding connectivity underlying resilience is the foundation for resilience of communities.
Cooperation and altruism even in algae? The cooperation and even altruism found in tightly bonded human groups is found throughout Nature. Volvox is a green algae which lives in colonies of up to 50,000 cells. Volvox colonies have a division of labor. Most permanently renounce reproducing themselves to take on other jobs, such as moving the group around by swimming. A similar division occurs in most multi-cellular creatures: their cells are either “germ” cells—reproducers such as sperm and eggs—or “somatic” cells, all the others, which leave no heirs after the individual dies. This can be seen as a profound form of altruism. By not reproducing, somatic cells commit evolutionary suicide to benefit the group. Something similar also occurs in insect colonies, which often have sterile “worker” castes.
In Volvox, biologists have found that a gene called RegA causes this “reproductive altruism.” RegA suppresses cell growth. Because a cell must grow a certain amount to reproduce, RegA also ends its reproductive career. Both germ and somatic cells have the gene, but in germ cells it’s inactive.
To trace RegA’s ancestry, researchers hunted for genes similar to RegA in a one-celled creature, Chlamydomonas reinhardtii, believed to be closely related to Volvox’s single-celled ancestor. The most similar DNA sequence they identified was one called Crsc13. It also suppresses cell growth, they found, but apparently for a different reason—to help the cell through lean times.
C. reinhardtii, like plants, conducts photosynthesis: it uses light energy to build sugars needed to live. In darkness, the researchers found, Crsc13 goes into action. Since photosynthesis can’t occur in the dark, the gene blocks the assembly of chloroplasts, tiny compartments where photosynthesis occurs. Crsc13 thus prevents “unnecessary investment” in temporarily useless activities, saving resources for more essential work.
In Volvox, evolution apparently co-opted the gene for the grander goal of cellular cooperation. This transformation may have required no change in the gene itself; all that needed to change was the way it was activated and inactivated. Every organism has this ability to switch genes on and off. It’s often accomplished by coating the relevant DNA with specialized molecules blocking its use.
In evolutionary terms, there may be no fundamental difference between altruism in Volvox and the generosity that inspires people to give, say, to charity. Both might ultimately stem from similar mechanisms. Any gene that allows someone to delay gratification for future benefits, might be co-opted by evolution to shift those benefits to others instead. Variable or stressful environments may encourage this process according to the authors of the study. Periodic hardship frequently spurs the evolution of survival mechanisms that involve suppressing biological activities, like Crsc13. [38] In tough times, people often come together; so do many smaller organisms.
Resilience and cooperation. In humans and apes, cooperative behavior extends beyond the family. While hanging laundry, researchers "accidentally" dropped a clothespin out of reach. Stretch as he might, he couldn’t grab it. He even cried out, "My pin!" A young chimpanzee sitting nearby picked up on the distress and retrieved the clothespin.
Since the chimp received no reward, or even a "thank you," this experiment indicates chimps can be altruistic, a quality many scientists thought only humans possessed. Researchers performed the same experiment with human infants and found them equally helpful. Interestingly, if researchers threw the pin deliberately, neither chimps nor humans would pick it up. They only retrieved it if they could infer that Warneken needed it to complete his task. The researchers went on to investigate more complicated tasks, such as retrieving an object from a box with a flap. Children and chimpanzees are both willing to help, but they appear to differ in their ability to interpret the other's need for help in different situations. When the scientists accidentally dropped a spoon inside, and pretended they did not know about the flap, the children helped retrieve it. They only did this if they believed the spoon had not been dropped deliberately.
The tasks were repeated with three young chimpanzees that had been raised in captivity. The chimps did not help in more complex tasks such as the box experiment, but did assist the human looking after them in simple tasks such as reaching for a lost object. While infants helped on a variety of tasks, the chimps weren’t as willing to help with some of the more difficult chores.
Situations were set up in which an adult did things like hold out a basket in which the infant was asked to place a toy. After the infant complied, in the test for role reversal, the adult placed the basket within the infant’s reach and held up the toy herself. All 18 month olds and even some of the 12-month-olds spontaneously held out the basket for the adult while at the same time looking to her face, presumably in anticipation of her placing the toy inside. Chimps never do this. [39]
Altruism as an innate instinct has limits in application. Rhesus monkeys were given a lever which dispensed food but at the same time as dispensing food, it gave the monkey in the next cage an electrical shock. The monkeys with access to the 'shocking' food levers would not pull the lever, foregoing food for many days, rather than give the monkey next door a shock. However, the monkey was less likely to refrain from pulling the lever if another species of animal (a rabbit for example) was being shocked. Scientists deduced that the monkeys were more altruistic toward animals of their own species rather than animals of different species
Is this the case on a larger scale within human society as we care for our own species more than those around us? Much has been written on the emotional and physical disconnect of humanity from other species, manifesting in animal abuse, overt pollution and degradation of whole ecosystems and general disregard for the long, or short, term health and well-being of species other than our own. It is then a paradigm shift on a larger scale to move towards a more encompassing altruism that embraces our own species as well as others? Farmers of the past and present have seen the soil they tend as a kind of kin, the animals they care for as valuable beyond their monetary gain and the seeds they sow as their own kind of family deserving of care and attention through the growing season. In the working with nature chapter we discuss this more fully, though it’s important to realize here the value of integrating our compassion, empathy and subsequent altruism with the earths many ecosystems, species and habitats. It is the recognition of this irrefutable connection that can help us to respond to large scale pollution and habitat destruction with the commitment and energy necessary to the scale of the issues at hand.
Size of group and size of brain. Social intelligence hypothesis posits that complex cognition and enlarged ‘executive brains’ evolved in response to challenges that are associated with social complexity, The number of social group members a primate can track appears to be limited by the volume of the neocortex region of their brain. This suggests that there is a species-specific index of the social group size, computable from the species' mean neocortex volume. There is a correlation between brain size, particularly the newer frontal lobes, and the size of the social group an animal lives in. This rule works for our primate lineage and, it turns out, also for hyenas: those with the simplest social systems have the tiniest frontal cortices.
The spotted hyena, which lives in the most complex societies, has far and away the largest frontal cortex. The brown and striped hyenas, with intermediate social systems, have intermediate brains. It appears that primates are not unique in the complexity of their social lives. Holekamp and colleagues, who have found an array of complex social behaviors in spotted hyenas that are as complex as those of baboons. The groups are comprised of 60 to 80 individuals who all know each other individually. There are alliances, rivalries, and social hierarchies headed by an alpha female.
Using a regression equation on data for 38 primate genera, Dunbar predicted a human "mean group size" of 148 (casually rounded to 150 and today called the Dunbar number).[40] Dunbar then compared this prediction with observable group sizes for humans. Beginning with the assumption that the current mean size of the human neocortex had developed about 250,000 years ago, i.e., during the Pleistocene, Dunbar searched the anthropological and ethnographical literature for census-like group size information for various hunter-gatherer societies, the closest existing approximations to how anthropology reconstructs the Pleistocene societies. Dunbar noted that the groups fell into three categories — small, medium and large, equivalent to bands, cultural lineage groups and tribes — with respective size ranges of 30-50, 100-200 and 500-2500 members each.
Dunbar's surveys of village and tribe sizes also appeared to approximate this predicted value, including 150 as the estimated size of a neolithic farming village; 150 as the splitting point of Hutterite settlements; 200 as the upper bound on the number of academics in a discipline's sub-specialization; 150 as the basic unit size of professional armies in Roman antiquity and in modern times since the 16th century.
Capacity for cooperation requires social learning. However, the large brain of humans does not develop unless it is nurtured in the group. The human brain begins forming very early in prenatal life (just three weeks after conception) and does not complete its growth until adolescence. The brain is far more impressionable (neuroscientists use the term plastic) in early life than in maturity. This plasticity has both a positive and a negative side. On the positive side, it means that young children's brains are more open to learning and enriching influences. On the negative side, it also means that young children's brains are more vulnerable to developmental problems should their environment prove especially impoverished or un-nurturing.
Just as newborn babies are born with a set of very useful instincts for surviving and orienting to their new environment, parents are equally programmed to love and respond to our babies' cues. Most adults (and children) find infants irresistible, and instinctively want to nurture and protect them. It is certainly no accident that the affection most parents feel towards their babies and the kind of attention we most want to shower them with—touching, holding, comforting, rocking, singing and talking to—provide precisely the best kind of stimulation for their growing brains. Because brain development is so heavily dependent on early experience, most babies will receive the right kind of nurturing from their earliest days, through our loving urges and parenting instincts.
Beyond basic development, other stimulation is crucial for developing brain complexity: infants and children who are conversed with, read to, and otherwise engaged in lots of verbal interaction show somewhat more advanced linguistic skills than children who are not as verbally engaged by their caregivers. Because language is fundamental to most of the rest of cognitive development, this simple action—talking and listening to your child—is one of the best ways to make the most of his or her critical brain-building years.
The critical period for learning how to discriminate phonemes in language and process facial emotions is less than 3 years. (A phoneme is the smallest distinct unit of language, such as the “m” of “mat” and the “b” of “bat” in English.) At the beginning of life, babies can hear phonemes from all languages; by year 1, they can only hear phonemes from their own language. By 6-12 months, babies prefer social stimuli (faces, voices, and people) to objects. If the child doesn’t gain experience during this time, or enjoy interacting verbally or nonverbally with others, that can affect his or her social skills later. Basic social skills are acquired early in life that provide the building blocks for more complex social abilities later.[41]
The Bucharest Early Intervention Project allocated a group of two year old children randomly, so that some remained in institutions while others were placed in foster care. Several rounds of studies have been done on these children, who are now in their late teens. Comparing the images of the brains of the children at the ages of two and eight, those who spent their childhoods in orphanages had significantly less developed white matter in at least four parts of the brain. Unsurprisingly, brain regions responsible for emotion are particularly heavily affected, but so are those associated with maintaining attention, executive function and even sensory processing. At the age of eight, children who had once been in the orphanage but were then placed in foster care fell between the other two groups in the state of their white matter. The researchers concluded that their brains more closely resembled those of the children raised by their parents.[42]
It takes a family—and a village and a tribe. Increasingly research in many fields shows that the connections which result in resilience are built on interactions in the family and the group around the family (village, tribe, etc.). Evolutionarily, the unit of selection is not the individual, but the population—or tribe, if you will. No long term resilience is possible without community. The lone individual creating the most ecologically sound farm will see it perish when he leaves. Not only is community required for resilience, man was built for community.
Measuring the modular connectivity factor of resilience. According to results of our case studies, questions such as the following appear to distinguish between resilient and non-resilient systems.
- Do you share labor or equipment with neighbors?
- Do you market with neighbors?
- Are you a member of any cooperative?
- Marketing cooperative
- Input supply cooperative
- Do you use several marketing venues?
- Are you a regular internet user?
- Are you dependent on a single market outlet?
- Do you buy from several suppliers?
- Do you hire others to do your planting and harvest?
- Do you generate any of your inputs on your farm?
- If necessary, could you replace some inputs with inputs produced on-farm?
The farmer ranking high on connectivity and modularity will answer yes to all but 6 and 8. The last three address modularity specifically.
Secondary databases to measure modular connectivity in the 13 Southern States.
The only available county-level measure of the modular connectivity (MC) quality of resilience is percent of operations with internet access. The following box shows the rankings of states on connectivity along with their overall SRI ranking.
|
States ranked by % of counties in highest quartile on the use of internet (modular connectivity) |
|||
|
Modular connect. |
Overall SRI |
State |
% |
|
1 |
5 |
Florida |
46.3 |
|
2 |
1 |
Virginia |
42.9 |
|
3 |
9 |
Georgia |
40.3 |
|
4 |
2 |
North Carolina |
40.0 |
|
5 |
6 |
Louisiana |
28.1 |
|
6 |
11 |
Texas |
23.2 |
|
7 |
10 |
Oklahoma |
18.2 |
|
8 |
8 |
Arkansas |
16.0 |
|
9 |
3 |
Kentucky |
15.8 |
|
10 |
4 |
South Carolina |
15.2 |
|
11 |
12 |
Alabama |
9.0 |
|
12 |
7 |
Tennessee |
8.4 |
|
13 |
13 |
Mississippi |
7.3 |
The states with the highest overall SRI rankings (Virginia and North Carolina) also ranked in the top tier on this measure, however, the other members of the top four on SRI (Kentucky and South Carolina) fell down toward the bottom of the state rankings on this measure.
The two lowest SRI states are also at the bottom of rankings on this measure, however, Texas and Oklahoma both rose from the bottom to mid-tier on this measure.
The following map shows county level information on our sole measure of modular connectivity, showing the regions of each state which most need increases in this quality.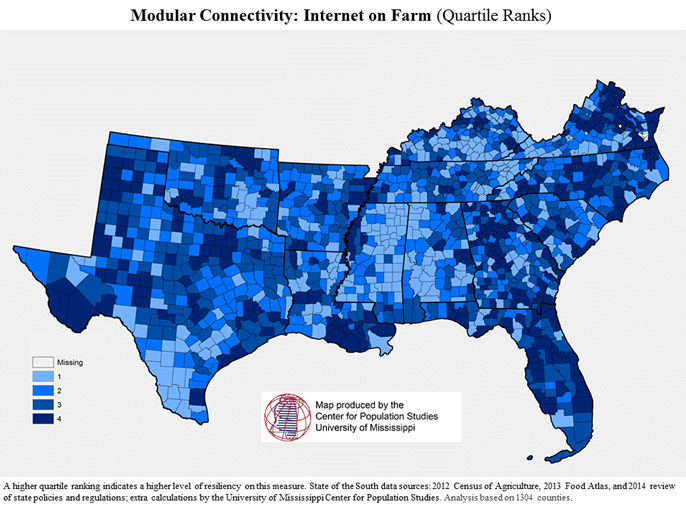
Summary of modular connectivity. Our ability to connect to one another and our surroundings is the foundation for organizing into tribes, villages and communities and even world networks and multinational corporations. Combining our collective knowledge and strengths, we effect huge changes in our surroundings.
These have included some remarkably destructive patterns throughout history. War, tyranny, and exploitation of resources and people, mass extinction and climate change are all examples of phenomena that require the support of a community.
How, then, can we leverage connectivity in a way that is less destructive to our natural environment yet supports productivity. A monumental task to be sure, but one worth considering on a local, regional scale.
Each of us lives in a unique microcosm of people, abilities and resources that are unlike our neighbors—giving us an opportunity to reach out for help while also offering something in return. It is this use of modular connectivity which provides the opportunity for the next and crucial quality of resilience: ecological integration.
Citations on Modular Connectivity
[1] Stockholm Resilience Centre, 2015. Principles for building resilience. Cambridge.
[2] Lovins, Amory B. Soft Energy Paths: Toward a Durable Peace. New York: Harper Colophon Books, 1977.
[3] Scarborough, V. L., 2003. The Flow of Power: Ancient Water System and Landscapes. Santa Fe: School of American Research Press.
[4] Montoya et al., 2006. Ecological networks and their fragility. Nature. 442:20; Pocock, MJO, Evans, DM & Memmott, J. (2012) The robustness and restoration of a network of ecological networks. Science 335:973-977.
[5] Adam et al., 2011. Herbivory, Connectivity and Ecosystem Resilience. PLOS/One DOI: 10.1371/journal.pone.0023717
[6] Frankenburger et al., 2013. Community Resilience. USAID, Westat; Flora, C. B., Flora, J. L., & Gasteyer, S. P., 2016. Rural Communities: Legacy + Change (5th edition). Boulder, CO: Westview Press.
[7] Carpenter et al., 2012 General resilience to cope with extreme events. Sustainability, 4:3248-3259.
[8] Levin, M., 1993. Creating networks for rural economic development in Norway. Human Relations, 46: 193-218; Organisation for Economic Cooperation and Development, 1999. Social Enterprise. Paris: OECD.
[9] Whyte, W.F., and K.K.Whyte, 1991. Making Mondragon: the growth and dynamics of the worker cooperative complex, Ithaca: Cornell University Press.
[10] Blim, M.L., 1992. Small-scale industrialization in a rapidly changing world market. In F. Rothstein and M.L. Blim (Eds.) Anthropology and the global factory: studies of the new industrialization in the late twentieth century, New York: Greenwood Publishing.
[11] Kenworthy, L., 1995, In search of national economic success: Balancing competition and cooperation. Thousand Oaks, CA: Sage; Kenworthy, L., 1997. Civic Engagement, Social Capital, and Economic Cooperation. American Behavioral Scientist, 40:645-656.
[12] Mottiar, Z. and S. Ingle, 2007. Broadening the Entrepreneurial Perspective: Interpreneurship in an Irish Furniture Region. International Small Business Journal. 25: 667-680.
[13] Storper, M., 1995; The Resurgence of Regional Economies, Ten Years Later: The Region as a Nexus of Untraded Interdependencies. European Urban and Regional Studies, 2:191-221.
[14] European Foundation for the Improvement of Living and Working Conditions, 2005. Regional Social Capital in Europe. Dublin: EFILWC, accessed at: www.eurofound.net.
[15] Brown, D.S., J. C. Brown and S. W. Desposato, 2002. Left Turn on Green?: The Unintended Consequences of International Funding for Sustainable Development in Brazil, Comparative Political Studies, 35: 814-838.
[16] Sarkar, A.N. and J. Singh, 2006. Savings-led Micro-finance to Bank the Unbankables: Sharing of Global Experience. Global Business Review, 7: 271-295.
[17] Flora, Flora and Gasteyer, ibid; Greenfield, S.M., and A. Strickon, 1981. A new paradigm for the study of entrepreneurship and social change. Economic Development and Cultural Change, 29: 467-499.
[18] Kenworthy, 1997, ibid.
[19] Frank, K. and Wellman, B. (1998) ‘Network Capital in a Multi-Level World: How Individuals, Ties and Networks Provide Social Support in Contemporary Communities’, paper presented at the Social Networks and Social Capital Conference, Duke University.
[20] Flap, H. D. and Boxman, E., 2001. Getting Started: The Influence of Social Capital on the Start of the Occupational Career. In N. Lin, K. S. Cook and R. S. Burt (eds) Social Capital:Theory and Research. New York: Aldine de Gruyter.
[21] Bian, Y. ,1998. Guanxi Capital and Social Eating in Chinese Cities: Theoretical Models and Empirical Analyses, paper presented at the Social Networks and Social Capital Conference, Duke University, 30 October–1 November; Lin, N., 1999. Social Networks and Status Attainment. Annual Review of Sociology, 25: 467–87; Smart, A., 1993.Gifts, Bribes, and Guanxi: A Reconsideration of Bourdieu’s Social Capital, Cultural Anthropology, 8: 388–408.
[22] Burt, R. S. 1997. The Contingent Value of Social Capital, Administrative Science Quarterly, 42: 339–65.
Burt, R. S., 1999. Trust and Gossip on the Path to Equilibrium. In A. Casella and J. E. Rauch (eds) Network and Market Models of the Economy. New York: Russell Sage Foundation.
[23] Putman, R., 2000. Bowling Alone: The Collapse and Revival of American Community. Simon & Schuster.
[24] Flora et al, ibid.
[25] Loewen, J. 1988. The Mississippi Chinese: Between Black and White. Waveland Press.
[26] Pieterse, J.N., 2003. Social capital and migration: Beyond ethnic economies, Ethnicities , 2003; 3: 29-58.
[27] Satyanath et al., 2014. Bowling for fascism. http://www.anderson.ucla.edu/faculty/nico.v/Research/Bowling_for_Fascism.pdf
[28] Michailova, S, Worm, V 2003. Personal networking in Russia and China: Blat and Guanxi. European Management Journal, 21: 509-19.
[29] Frankenberger et al., ibid.
[30] Walker, J., and M. Cooper. 2011. Genealogies of resilience from systems ecology to the political economy of crisis adaptation. Security Dialogue 42(2):143–160. http://dx.doi.org/10.1177/0967010611399616
[31] Carlisle, L. 2014 Diversity, flexibility and the resilience effect. Ecology and Society 19:45.
[32] Carlisle, ibid.
[33] Reflecting the modular connectivity principle, participation must be limited. Some potential participants will undermine the process toward resilience. In pursuit of resilience, one must embrace contradictory approaches. However, most resilience researchers would stress the general principle of broadening participation for public consumption. See Stockholm Resilience Center, ibid.
[34] Adam et al., ibid.
[35] Goleman, D. (1995). Emotional intelligence. Bantam.
[36] Riggio, R., 2006. Nonverbal skills and abilities. SAGE Handbook of Nonverbal Communication Ed. Manusov and Patterson. Sage.
[37] Though controversial and outside the mainstream of evolutionary research, increasingly many contend that ecological communities are the units which survive extinction events and recover from them. More detail is available at Roopnarine, P. and Angielczyk, 2015. Community stability and selective extinction during Earth’s greatest mass extinction doi: http://dx.doi.org/10.1101/014688 .
[38] Nedelcu, A. and Michod, R., 2006. The evolutionary origin of an altruistic gene. Molecular Biology and Evolution, 23: 1460-1464.
[39] Warneken F, Tomasello M (2006) Altruistic helping in human infants and young chimpanzees. Science 311: 1301-1303.
[40] Dunbar, R., 1992. Neocortex size as a constraint on group size in primates. Journal of Human Evolution, 22: 469–493; Dunbar, R., 1998. The social brain hypothesis. Evolutionary Anthropology, 6: 178–190.
[41] http://www.edpsycinteractive.org/papers/socdev.pdf
[42] http://www.iflscience.com/brain/neglect-childhood-leaves-marks-brain
Individual qualities of resilient systems
III: Working with Nature: Towards Ecological Integration
Throughout this chapter we will review methods of resilient farmers using natural ecological processes to increase productivity and decrease external inputs. Our aim is to help you integrate relevant practices and provide references to practical literature which goes into more depth. As you read through this chapter, consider your own property and have a piece of paper handy for inspiration and new ideas.
Ecosystems integrate and build subsystems that are crucial to resilience. The foremost subsystem of a resilient ecosystem is healthy, living soil. Man can mine the soil and other resources and create wealth and power. Such extraction is tempting, but transitory. In the US, we have recognized the importance of maintaining our soils and preventing their erosion since the 1930s.[1] This is not true in many other countries we have visited. Huge areas of deep soils in Ethiopia, for example, are being eroded away every year. Even in the US, we have yet to fully control erosion. Attempts to deal with erosion illustrate how farmers can work with nature.
Reduced tillage is an example of moving toward ecological integration. Since the dawn of agriculture, tillage of every field has been a standard practice before planting. Reduced tillage not only reduces erosion, it also leads to increased soil organic matter. Increased soil organic matter results in greater water holding capacity and drought resistance. The farmer who reduces tillage is letting natural processes help him achieve higher and more reliable yields. Eliminating tillage (no-till) maximizes soil health but can result in weed and insect problems. Strip-till, mulch-till, ridge-till and other reduced tillage methods are options which fit specific crops and systems and let natural processes maintain and improve soil fertility and reduce need for costly fertilizer.
Similarly, integrated pest management allows natural predators to control pests until they reach a threshold where pesticides use is required. This reduces pollution and costs of pesticides for the farmer.
These two examples illustrate how working with nature can benefit farmers by decreasing reliance on high cost pesticides and fertilizers. However, the problem is much deeper rooted. Nearly all human cultures have shared this mindset: “Be fruitful and multiply, fill the earth and subdue it; and have dominion over the fish of the sea and over the birds of the air and over every living thing that moves upon the earth”. The word “subdue,” in the original Hebrew, is kabash. Its meaning is irrefutable; it does mean “subdue” or “enslave”, and even connotes “molest” or “rape.”[2]
This mindset is rooted in the brutal past experience of man learning to work with nature. In the search for food, our ancestor’s plight was sometimes starvation and scrounging for anything edible. Our mastery of nature means that today’s corn and melons are thousands of times more productive than those of prehistoric man. Today it is easier to farm and our yields are greater thanks to those who came before us and their desire to subdue nature.
From subduing to working with Nature. The attitude of dominating or subduing Nature has had the unintended side effect of creating pollution and destruction of entire ecosystems. This chapter is focused on methods and examples based on integration with ecological systems—working with Nature. All living systems can be understood as complex adaptive systems made up of successive scales of complex adaptive systems both above and below any particular scale. Within those infinitely complex systems are consistent and recurring opportunities for symbiosis, or mutualism. In order to manage a common threat, many systems of nature can and have become willing accomplices. They have and will always join with us in goals which also help them achieve their goals of reproducing, growing and maturing—e.g., fulfilling the adaptive cycle. We can unite with other species to create better, more powerful systems. When we enlist other systems, their resilience become ours, just as ours become theirs. In natural systems, as shown in the adjacent figure, the symbioses between species seem almost unlimited. Man can use those connections to let nature perform some of the tasks of producing food.
It is our opportunity as stewards of the land to use our collective creativity, ingenuity and problem solving to build systems that work together and adapt to change with less and less input from us.
Some would suggest that the best thing to do for soil in a natural ecosystem is to “leave it alone!” and that with time nature will do a better job. Nature does not want to be left alone any more than it wants to be subdued and conquered. As we come to understand natural processes, we see that nature is not an enemy to be fought, rather a partner to work with. Humanity is a part of Nature and we influence it with everything we do. We can fight Nature and lose. Or we can help Nature become more productive and resilient and supportive of our own productivity and resilience.
Mimicking natural processes. For thousands of years in Russia and Ukraine, natural predators herded large grazing animals (e.g., elk and deer) across barren lands of poor soils and created the richest soils in the world—several feet deep. American Indians created similar soils in the wetter Midwest by using fire to manage the forest and, like a predator, keep animals in herds to build up soils and create the second best soils in the world. Management-intensive grazing is, in 10 years or less, creating similar soils by understanding the processes which enable large grazing animals, grasses and soils to grow and thrive.[4]
Ecological systems are made up of many relationships between organisms and environments. Some organisms are adapted to certain environments, like the cactus to the desert. When we force something, say a plant or animal, into an environment that is not suited for it, it fails--unless we are willing or able to exert excessive resources to upkeep by buying shade cloth, large greenhouses or potentially costly lighting systems.
Remember how the ecological resilience concept arose: researchers noticed that natural forests withstood disturbance, cycled through stages of reorganization, rapid growth and matured into basically the same forest. Before man introduced artificial inputs and eliminated many of the natural players, natural systems were resilient. The systems cycled through stages, never reaching an equilibrium.
All natural systems, including our own, are always changing and coevolving to be better adapted. We see this with bacteria becoming resistant to drugs, weeds becoming resistant to herbicides. The technological fixes of man are overcome again and again as organisms adapt – often through a single gene change. A weed problem can definitely be taken care of through herbicides. But unless we understand why we have a weed problem and use systems such as cover crops to turn Nature into a cooperator, we will forever fight weeds. Herbicide resistance will inevitably result in the demise of every herbicides and the requirement for a new herbicide for those fighting Nature.
DDT did a great job destroying malarial insects and making vast areas of the United States free of the disease. Today’s excessive dependence on insecticides has resulted in a technology treadmill where insects develop resistance to a particular insecticide and a new one is required—unless we understand why they bother us and our crops. Then we can turn insects into cooperators.
There are insects and plants that have been bred and cultivated by humans for thousands of years to work with us. It’s up to you to find out which of those will work on your property, in your system.
Symbiosis, mutualism, parasitism
Let’s take a closer look at what it means to work with adaptive systems that fuel and manage natural environments. Some of the more common adaptive systems are bacteria and fungi that break down tree trunks in a forest, or, bats that manage insect populations as they flit about the night sky. These adaptive systems are radically diverse and express themselves in a myriad of forms through nature and it is our most noble pursuit to include them in our own agricultural systems.
So, if ecology is, “the relationship between an organism and its environment”[5], what is your relationship to your environment? Mankind’s relationship with other species takes a variety of forms. Symbiosis is the general term for species which together (sym) live (biosis). Mutualism is symbiosis where both organisms benefit. In commensalism, one organism receives benefit while neither harming nor helping the other in any significant way. In parasitism one organism, called a parasite, benefits at the expense of the other.
Lichens, the firm green grey “moss” found on many stones, are fungi and algae (or cyanobacteria) working together in a mutualistic relationship. Plants and animals also require each other to survive. Many fruits require bats for pollination and bats require the resulting fruit for food. Parasites can even balance population levels through infections and viruses.
Mutualism is shown most powerfully in the relationship of bacteria and plants resulting in nitrogen fixation. This reaction is performed exclusively by prokaryotes (the bacteria and related organisms), using an enzyme complex termed nitrogenase. The plant gains nitrogen compounds, the bacterium gains carbohydrate and a preferred environment of reduced oxygen.
Man and nature: parasitism? Since industrial agriculture developed, man has considered the earth and its many ecosystems a resource to be mined and used. Be it soil for food and fiber, or the depths of the earth for fuel we have been working in a paradigm focused on the mining of resources. We have been parasites of the earth. This paradigm has led to numerous aftershocks, some of which we’re only beginning to see. Other effects have been marked in history, such as the dust bowl of the 1930’s brought on by a drastic mismanagement of the soil.
When the relationship of man to nature is parasitic, the host (nature) is destroyed. The United States recognized the mistakes which led to the dust bowl and began successful conservation programs such as the Soil Conservation Service, now the Natural Resources Conservation Service. Though these agencies make a dent, there is work to be done all around the world.
The SCS sponsored Lowdermilk’s classic work Conquest of the Land through Seven Thousand Years. Lowdermilk documented the collapse of civilization after civilization, including a hundred dead cities in Syria alone, due to the destruction of the ecosystems which made the civilization possible—soil, water and air.[6]
Today a thousand Lowdermilks are writing of the destruction of ecological systems throughout the world, but few read and comprehend. Those who take a parasitic, conquering approach to nature are increasingly destroying the ecosystems and species preserved by thousands of generations of ecologically resilient societies. Rapacious Chinese colluding with local elites in Africa and Asia are perhaps the most egregious examples.[7]
A resilient species doesn’t go extinct. A resilient civilization doesn’t allow its cities to disappear under the sands of erosion. We can collectively avoid such massive recoils by working with the environment and nature’s processes instead of controlling or fighting nature. It begins with a mindset of collaboration with the subtle, and not so subtle, actors in nature like beneficial insects, nitrogen fixing plant varieties and regenerative, naturally occurring fertilizers. So let us again ask the question, “What is your relationship with your ecosystem?”
Coevolution
We are only beginning to discover the ways we are coevolving with other organisms. Some of the more recent coevolution has been with domestic animals. Some populations of people have developed the ability to digest milk as adults while cows have evolved to produce much more milk than their offspring need. Some populations have developed the ability to digest wheat gluten while wheat has evolved to produce copious amounts of seed which adhere to the stalk so we can harvest them. Similarly beef cattle have evolved with man to become gentle and produce tenderer meat as man has adapted to eat more meat.
One form of coevolution is a unique property called bio-mimicry. Researchers can see that over time certain insects and birds alter their appearance to mimic others of their species that are deadly to their predators. How this occurs is still a mystery to researchers, though there is today a butterfly that looks very similar to a monarch. The difference is that the monarch, eating milkweed all day, is poisonous to the bird that eats the monarch look alike.
Humans use bio-mimicry all the time, building habitats, water catchments and microclimates like hugelkulture[8] to mimic nature. It is important to remember that in designing for nature, there are always things we have to learn from nature. The planet’s ecosystems are resilient enough to survive for millennia, largely if not totally because of coevolution. Species and organisms forming bonds and partnerships to share nutrients and shelter.
In ecologically integrated agricultural systems, we work with a multitude of species. All of us work together to achieve increased productivity, fertility and adaptability.
Secondary databases to measure ecological integration in the 13 Southern States. At this point in our study of resilience in the 13 Southern states, we have identified several variables which appear consistent with the factor of ecological resilience and have available county-level data bases. The box below shows state by state comparisons of measures of the ecological integration (EI) quality of resilience. Four county-level indicators were available for this quality: percent crop acres not treated with herbicide, percent crop acres not treated with herbicide, counties with USDA certified organic acres and percent of counties with rotational or management-intensive grazing (MIG). The first two measures were combined into a pesticide use index.
|
States ranked by % of counties in highest quartile on the production diversity index |
||||
|
Certified organic |
MIG |
SRI |
State |
% |
|
1 |
9 |
5 |
Florida |
55.2 |
|
2 |
6 |
2 |
North Carolina |
53.0 |
|
3 |
10 |
4 |
South Carolina |
39.1 |
|
4 |
1 |
1 |
Virginia |
36.7 |
|
5 |
2 |
3 |
Kentucky |
25.0 |
|
6 |
8 |
9 |
Georgia |
21.4 |
|
7 |
11 |
10 |
Oklahoma |
20.8 |
|
8 |
4 |
11 |
Texas |
20.5 |
|
9 |
3 |
7 |
Tennessee |
20.0 |
|
10 |
5 |
8 |
Arkansas |
16.0 |
|
11 |
13 |
12 |
Alabama |
11.9 |
|
12 |
7 |
6 |
Louisiana |
9.4 |
|
13 |
12 |
13 |
Mississippi |
6.1 |
MIG rankings were highly consistent with overall SRI with some exceptions. High SRI scoring states of Virginia and Kentucky were top ranked. Low SRI states of Oklahoma, Mississippi and Alabama ranked at the bottom of counties with high percent of MIG.
Two anomalies were the drop in relative ranking of North Carolina and, especially, South Carolina and the rise in relative ranking of Texas.
The map below shows graphically county level rankings for MIG.
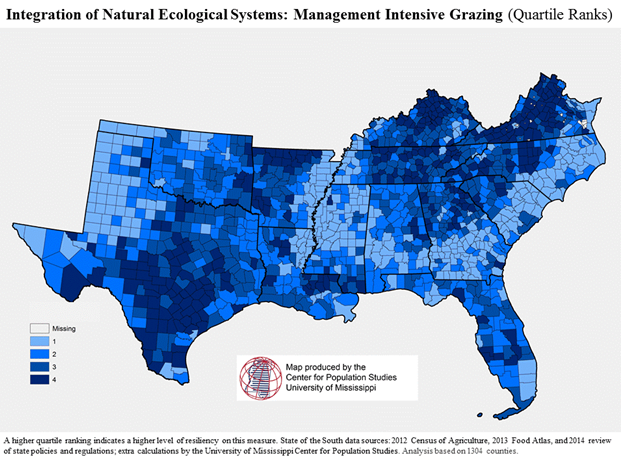
Ranking of states for certified organic acres is shown compared to rotational grazing (MIG) and overall SRI in the above box. Presence of certified organic acreage in a county is very consistent with overall SRI scores. The top five states on SRI were also the top five or organic acres. The two lowest states on SRI are among the three lowest or organic acres.
Louisiana is an outlier in that its high ranks on MIG and SRI are not reflected in its ranking on organic acres. Other SRI rankings are roughly parallel to certified organic rankings.
The map below shows graphically county level scores on certified organic acreage.
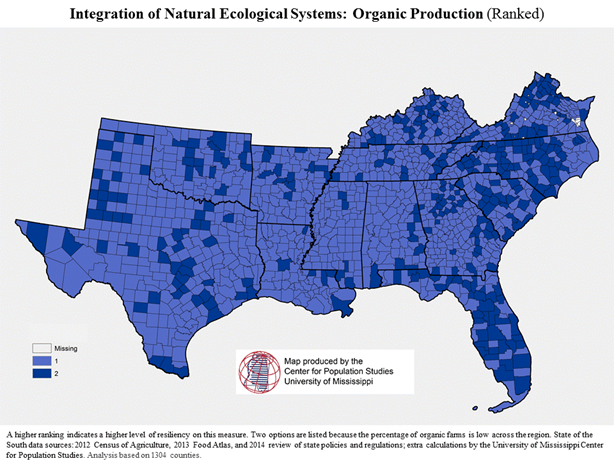
The following box shows the ranking of states on use of pesticide, certified organic acres and SRI. The top three states on SRI (Virginia, North Carolina and Kentucky) are all among the top four in not using pesticide.
Lowest ranking states on the overall SRI are largely in the lower tier of the pesticide use measure of ecological integration with the exception of Texas.
Also noteworthy are the high scores on the low pesticide use indicator of three states (Tennessee, Virginia and Kentucky) compared to all other states and the low score of Florida even though Florida ranked highest on the organic indicator and in the top five on overall SRI.
|
States ranked by % of counties in highest quartile on the lack of use of pesticides. |
||||
|
No use Pesticide |
Certified organic |
SRI |
State |
% |
|
1 |
9 |
7 |
Tennessee |
55.8 |
|
2 |
4 |
1 |
Virginia |
48.4 |
|
3 |
5 |
3 |
Kentucky |
42.5 |
|
4 |
2 |
2 |
North Carolina |
25.0 |
|
5 |
8 |
11 |
Texas |
22.8 |
|
6 |
12 |
6 |
Louisiana |
18.8 |
|
7 |
3 |
4 |
South Carolina |
15.2 |
|
8 |
6 |
9 |
Georgia |
14.5 |
|
9 |
11 |
12 |
Alabama |
13.4 |
|
10 |
10 |
8 |
Arkansas |
13.3 |
|
11 |
1 |
5 |
Florida |
11.9 |
|
12 |
7 |
10 |
Oklahoma |
6.5 |
|
13 |
13 |
13 |
Mississippi |
6.1 |
The following map shows graphically the rankings of counties across the South on use of herbicides and pesticides.
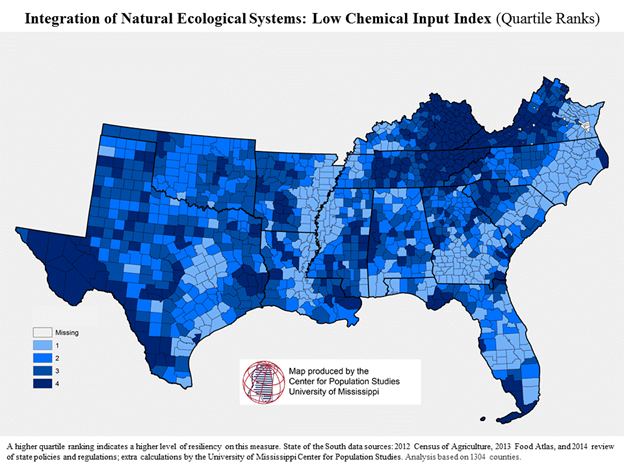
Citations on Ecological Integration
[1] Helms, D. 2010. Hugh Hammond Bennett and the Creation of the Soil Conservation Service. Journal of Soil and Water Conservation, 65:37A-47A
[2] Stong’s Concordance. http://biblehub.com/hebrew/3533.htm
[3] http://www.pnas.org/content/104/43/16976.full “Structure of the balsam fir source food web. (A) Total food web from all samples collected throughout entire study in all plot-years (1983–1993) and in all field experiments.”
[4] Hancock, D., 2015. The impacts of management intensive grazing on soil organic matter. http://www.caes.uga.edu/commodities/fieldcrops/forages/events/GS15/03SFNC/150512%20Hoard's%20H&F%20Grower%20article.pdf
[5] The term was invented by Ernst Haeckel in 1866 in his General Morphology of Organisms.
[6] http://www.soilandhealth.org/01aglibrary/010119lowdermilk.usda/cls.html--
[7] Just a few news articles from the end of 2014: http://www.washingtontimes.com/news/2014/dec/9/illegal-ivory-trade-out-of-control/; http://nationalinterest.org/blog/the-buzz/beware-chinese-hegemony-11896; http://www.bignewsnetwork.com/index.php/sid/228998671
[8] Decomposing organic matter, as in Hugelkulture. can generate enough heat to change the effective microclimate in the vicinity of the decomposing material
Individual qualities of resilient systems
IV: The necessary give and take of complementary diversity
Does your farm, county or state have diverse enterprises, markets and sources of inputs? Are those enterprises working together, or against one another? Do your own enterprises complement each other? Are you burdened by the waste your enterprise creates? Do you feel like you’re stretched too far managing your businesses? This chapter is meant to help you determine the right amount and types of diversity for your unique system.
In nature, diversity is not valued for its own sake as we see in some politically correct sectors of Western societies. In nature we see a myriad of autonomous species that are competing with each other but, in effect, working together to create a resilient ecological system. A species survives in an ecosystem because it fits well within the systems’ network of subsystems, both producing and breaking down nutrients within the system. However, ecological resilience requires limits to diversity—all diversity must be complementary.
We begin this chapter by exploring how complementary diversity exists in nature. In the complex relationships and networks that arise out of these self-organizing systems, resilience emerges as the interaction of local species and systems, sheltering the system from disturbances natural to any landscape. Through this understanding of how complementary diversity manifests in ecological systems we can begin to build a framework for thinking about how those principles apply to agricultural systems.
The second half of this chapter will look at applying complementary diversity to the farm, field and greater networks that comprise our food systems. We’ll look at how to think about diversity and how to seek out complementary relationships and enterprises. For now, let us step into the forest, meadow and field to see how nature has, for billions of years, been generating the resilient and robust ecosystems that we enjoy today.
Diversity often seems to be an unalloyed good. Beginning with Darwin and shown experimentally by Tilman[1], many have shown that increased species richness is associated with increases in efficiency and stability of some ecosystems. Removal of species or addition of missing species support this observation. When all species that can perform a function are wiped out, big problems result. The extinction of mega herbivores by aboriginal hunters caused a switch from grassland to tundra in the Northern latitudes.[2] Man can recreate this diversity of function by managing large grass-eating animals just as predators managed the large herbivores before man developed the capacity to create the extinction.
However, observing the correlation between diversity and resilience can give an incomplete picture. A more complete picture requires understanding that all species must eat and be eaten.
All species consume and are consumed by others. In ecological systems, everything is consumed and transformed into alternate materials for alternate uses. It is this recycling process that manages to construct huge redwood trees with solar energy and soil minerals as the only external output. How does a forest manage to build such great structures with seemingly so little input, particularly when we consider the vast inputs required for modern agriculture?
Ecological diversity exists only because one species uses waste products it receives from other species and provides useful nutrients to others. A species which only takes and never gives will destroy the system. Even the parasite in nature is also food for another species. Why don’t we see ecosystems with selfish species who take and never give? Because those systems die. Only the complementarily diverse systems survive. Take the asteroid that destroyed the majority of life on the planet, wiping out the dinosaurs and much of the plant life of the time. In the wake of the impact, light from the sun hardly penetrated the layers of ash and debris held in the atmosphere. The only life forms capable of handling such a unique challenge were the fungal kingdom[3]. Before the atmosphere cleared and the dust settled, the fungus continued to decompose dead plants, clearing the way for seed ferns that survived in the soils below. What would have become of the surface of the planet without the fungi covering the surface, perpetuating the decay of plant matter?
The second and equally important thing to realize about the fungal/fauna partnership is that the fungi also needed the plants to survive. Though the mushrooms could survive without direct sun, they needed continual plant decay and the sugars produced. Therefore, we see that selfish or non-complementary systems die, and often young, because they don’t realize that giving builds up the system which can then provide the inputs it needs. Whenever a selfish species arises, its lifecycle eventually decays because it destroys the system supporting it. Appreciating that sort of relationship is what we intend to help you develop over the course of this chapter, those complementary systems that keep you and your systems thriving and prospering even in the wake of a metaphorical asteroid.
Stable ecosystems such as a tract of mature oak hickory forest are often see as sustainable, lasting or self-managing. These forests are in fact in the K phase, having converted and stored nutrients into trees, and have low and decreasing diversity. A contiguous tract of mature forest has much less diversity than a patchy landscape composed of dense woods and meadows, shrubby areas and young trees. These patchy landscapes provide habitat for animals and plants at every stage of forest succession from new growth after a forest fire to long standing trees that harbor particular species. Traditional forest management tends to produce more homogeneous growth than those forests disturbed naturally and increases the likelihood of unexpected catastrophic change.
Make no mistake though, there are limits to beneficial diversity. Many see the high diversity of resilient systems and conclude that increasing diversity will increase resilience. In fact, the opposite is often true over the long term.
Short term diversity can destroy long term diversity. In today’s modern societies diversity is about inclusion. In ecosystems, resilience requires exclusion as well. Before we explore the immense diversity of ecosystems and the value of diversity for agricultural resilience, we must address one myth of diversity: more diversity is always good.
Increasing diversity by adding new species to an existing ecosystem can destroy multiple species and thus reduce diversity. Species which don’t complement existing life can destroy systems where they are introduced. For instance, when the rabbit was introduced in Australia[4] it certainly increased diversity of species—momentarily. Then, because there were no natural predators for rabbits, they began to expand exponentially. Rabbits are very good at finding the seedlings of shrubs when they are very small and grazing them out to the extent where the native shrubs are completely unable to regenerate. Rabbits also threaten some of the native burrowing animals, such as the bilby and the burrowing bettong, by moving into their existing burrows and competing for food. Rabbits are responsible for serious erosion problems, as they eat native plants, leaving the topsoil exposed and vulnerable to sheet, gully, and wind erosion.
When the Asian chestnut blight fungus virtually eliminated American chestnut from over 180 million acres of eastern United States forests in the first half of the 20th century, it was a disaster for many animals that were highly adapted to live in forests dominated by this tree species. For example, ten moth species that could live only on chestnut trees became extinct.
Aquatic plants such as South American water hyacinth now in Texas and Louisiana and marine algae from Australia in the Mediterranean Sea have decreased diversity in vast areas by replacing formerly dominant native plants.
Other examples of increased diversity leading to decreased diversity[5]:
- Man migrated to North America and wiped out megafauna, after he had done the same in Eurasia.
- The predatory brown tree snake, introduced in cargo from the Admiralty Islands, has eliminated ten of the eleven native bird species from the forests of Guam.
- The Nile perch, a voracious predator introduced to Lake Victoria as a food fish, has already extinguished over one hundred species of native cichlid fish there.
- The sea lamprey reached the Great Lakes through a series of canals and, in combination with overfishing, led to the extinction of three endemic fishes.
- The first sailors to land on the remote Atlantic island of St. Helena in the 16th century introduced goats, which quickly extinguished over half the endemic plant species.
Of all 1,880 imperiled species in the United States, 49% are endangered because of introduced species alone or because of their impact combined with other forces.[6]
It’s important to realize that it is the addition of non-complementary diversity which creates destruction of diversity. Without these alien additions, high levels of diversity are invariably associated with resilience of ecosystems.
Before America was colonized by Europeans, the Eastern forests and Deep South were prime examples of how one species, humans, could live in complement with natural ecosystems. The native people worked for generations with the forest[7], developing clearings using slash and burn techniques to create savannahs and open prairies around the old growth forests where deer and other creatures found shelter. This provided them with ample hunting ground and a diverse food supply due to the varied nature of their forests. By creating every level of forest succession they developed vitally healthy, diverse forests and prairies. To develop a better sense of working with nature be sure to read the chapter on working with nature (ecological integration) filled with practical techniques and guidelines.
The pre-colonization forests of America (and some pristine forests such as ours at Meadowcreek) were a network of species in different stages of succession. Dense old growth forests were paired with shade tolerant plants and herbs colonizing the forest floor with a few seedlings waiting for light to emerge with the death of an older tree. As you inspect the forest floor, digging your hand into the dirt, you would find salamanders, worms, and a variety of other insects churning through the last year’s leaves, breaking down the layer of nuts and dead twigs. The herbs and flowers would be prolific as many of them were as older, or older, than the trees they surrounded, sometimes 100’s of years old growing roots underground to generate new stems. Moving on you would find a small patch of white pine, an indicator of where an old prairie used to be as this tree is sun loving, growing in clumps as a colonizing species in open clearing. Further, a new savannah with large trees surrounded by charred ground, new seedlings of grasses and other shade tolerant species peeking through the dark surface. Finally, an opening revealing a prairie with tall grasses, a few shrubs and wildlife abounding in the open area.
All along your forest walk, if you looked carefully, you would have seen a variety of birds and large mammals, each in their own unique habitat. These creatures need the diversity of shelter as well as the diverse plant life that supports them. Moreover these forests maintain a stock of seeds, unique to each section of the forest acting as a reserve in the face of inevitable forest fires or floods.
On a larger scale, this diverse forest acted to slow down high winds and absorb intense flooding, mitigating the damage from these disruptions. With a little imagination and adaptation this complementary diversity is applicable to your own systems as you mimic what this once great forest was able to accomplish. What, then, does that look like?
Two models of complementary diversity. Two models from ecology help us relate these large scale, forest ecosystems to our fields, farms and gardens.
Rivet model. Ehrlich and Ehrlich’s[8] rivet hypothesis, which is similar to Frost and colleagues’ model of compensating complementarity,[9] likens the ecological function of species to the rivets that attach a wing to a plane. Several rivets can be lost before the wing falls off. This model proposes that the ecological functions of different species overlap, so that even if a species is removed, ecological function may persist because of the compensation of other species with similar functions.
In the rivet model, an ecological function will not disappear until all the species performing that function are removed from an ecosystem. Overlap of ecological function enables an ecosystem to persist. Unfortunately, compensation masks ecosystem degradation, because while a degraded system may function similarly to an intact system, the loss of redundancy of species decreases the system’s ability to withstand disturbance or further species removal. The same way that as rivets attaching a wing to a plane breaks it is necessary to replace, or repair, the broken ones. Unless these rivets are repaired, the safety and long term structure of the plane is sabotaged.
Though an ecosystem can decrease in its species diversity and still survive, its overall ability to recover from disasters is greatly hindered over the long term.
Drivers and Passengers model. Walker’s ‘‘drivers and passengers’’ hypothesis accepts the notion of species complementarity and extends it by proposing that ecological function resides in ‘‘driver’’ species or in functional groups of such species.[10] It is similar to Holling’s ‘‘extended keystone hypothesis.’’[11] Walker defines a driver as a species that has a strong ecological function. Such species significantly structure the ecosystems in which they and passenger species exist. Passenger species are those that have minor ecological impact. Driver species can take many forms. They may be ‘‘ecological engineers’’[12] such as beavers or gopher tortoises, which physically structure their environments. Or drivers may be ‘‘keystone species.”
What is the driver of your business that forms the way you operate and the decisions you make? What passenger projects can you create that bolster the whole business by aiding and supporting the function of the driver? Moreover how can those passenger projects work together, overlapping in their functions to mitigate waste products from the driver? This is how we can begin to develop an agricultural system that is ecologically resilient. For an ecosystem to be resilient, each component species feeds back into the others. The “waste” of one is the resource of another. Fossil fuels, the waste of dead dinosaurs, are a resource to us. What resources can you create for yourself?
Everything eats and is eaten. To develop a clearer depiction of how biological systems work together and form nutrient supply systems, let us look briefly at how food or resources are created across living systems. Plants and algae do not usually eat other organisms, but eat other predigested organisms as nutrients pulled from the soil or the ocean and manufacture their own food using photosynthesis. For this reason, they are called primary producers or autotrophs. It is energy from the sun that usually powers this base of the food chain. An exception occurs in deep-sea hydrothermal ecosystems, where there is no sunlight. Here primary producers manufacture food through a process called chemosynthesis.
What we call consumers eat other organisms more directly. In the adjacent diagram: green shades feed on living species of plants, brown shades on dead plants; those which consume live animals are in red shades, purple shades consume dead animals are dead; those species in grey shades provide nutrients from all species for primary producers. Feeding strategy is illustrated as: gatherer in lighter shade of each color and miners in darker shade of each color.
Consumers (heterotrophs) are species that cannot manufacture their own food and need to consume other organisms. Animals that eat primary producers (like plants) are called herbivores. Animals that eat other animals are called carnivores, and animals that eat both plant and other animals are called omnivores.
Decomposers (detritivores) break down dead plant and animal material and waste to then release it again as energy and nutrients into the ecosystem for recycling. Decomposers, such as bacteria and fungi (mushrooms), feed on waste and dead matter, converting it into organic chemicals that can be recycled as mineral nutrients for plants to use again.
Decomposers are often left off food webs, but if included, they make the food chain into a cycle. Thus food chains can be seen to start with primary producers and end with decay and decomposers. Since decomposers recycle nutrients, leaving them so they can be reused by primary producers, in the cycle they are neither beginning nor end. A resilient system has no end products, and no waste—due to complementary diversity.
These broad categories are functional categories to help us see how we can close the loop of waste and redefine these materials as what they are: products or outputs. Every organism within biological systems is working to develop fuel for the next stage of decomposition. How can your own enterprises anticipate the outputs, complementing them with ample need?
Ecosystems are resilient when ecological interactions reinforce one another and dampen disruptions. Such situations may arise when a species with an ecological function similar to another species increases in abundance as the other declines,[13] or as one species reduces the impact of a disruption on other species. However, different species operate at different temporal and spatial scales, as is clearly demonstrated by the scaling relationships that relate body size to ecological function.[14]
A scale is a range of spatial and temporal frequencies. Species that operate at the same scale interact strongly with one another, but the organization and context of these interactions are determined by the cross-scale organization of an ecosystem. Consequently, understanding interactions among species requires understanding how species interact within and across scales.
Many disturbances provide an ecological connection across scales. Contagious disturbances such as fire, disease, and insect outbreaks have the ability to propagate themselves across a landscape, which allows small-scale changes to drive larger-scale changes. For example, the lightning ignition of a single tree can produce a fire that spreads across thousands of square kilometers. Such disturbances are not external to ecological organization, but rather form integral parts of ecological organization. The disturbances are as much determinants of ecological resilience as are interactions among species.
Current models of the relationship between species richness and stability only model species and their ecological functions at the same scale; however, ecological systems are not scale dependent. A growing body of empirical evidence suggests that ecological structure and dynamics are primarily regulated by a small set of plant, animal, and abiotic processes.[15] Small and fast scales are dominated by biophysical processes that control plant physiology and morphology. At the larger and slower scale of patch dynamics, interspecific plant competition for nutrients, light, and water influences local species composition and regeneration. At a still larger scale of stands in a forest, processes of fire, storm, insect outbreak, and large mammal herbivory determine structure and successional dynamics from tens of meters to kilometers, and from years to decades. At the largest landscape scales, climate, geomorphological, and biogeographical processes alter ecological structure and dynamics across hundreds of kilometers and over millennia. These processes produce patterns and are in turn reinforced by those patterns; that is, they are self-organized.
Ecological processes produce a scale-specific template of ecological structures that are available to species. Ecological structure and patterns vary across landscapes and across scales. Many species may inhabit a given area, but if they live at different scales they will experience that area quite differently. For example, a wetland may be inhabited by both a mouse and a moose, but these species perceive and experience the wetland differently. A mouse may spend its entire life within a patch of land smaller than a hectare, while a moose may move among wetlands over more than a thousand hectares. This scale separation reduces the strength of interactions between mice and moose relative to interactions among animals that operate at similar scales.
This concept is reflected in the drivers and passengers model we visited earlier in the chapter. The drivers exist at an often larger scale, changing more slowly but generating larger and broader outcomes. The passengers are often working at a smaller scale, moving faster and generating outcomes more quickly.
These metaphors and examples of biological processes are meant to help you reflect on your own agricultural system. It requires us to consider what aspects of our business are moving fast, needing more consistent attention and change versus those attributes that are slower and more consistent. How can you then leverage that knowledge to operate your own business with more awareness to develop action plans and consistent outcomes in the face of outside changes?
Complimentary Diversity increase resilience to disturbance. Most important to resilience is coping with disruption, an inevitable occurrence. None of the Northern hemisphere mega-herbivores could cope with man and his new tools and social organization, so the entire ecosystem changed. Species such as American bison expanded into the niche and proved more resilient--until man came up with even better tools.
The variability in responses of species within functional groups to environmental change is critical to ecosystem resilience and known as “response diversity.” It is defined as the diversity of responses to environmental change among species that contribute to the same ecosystem function.[16]
Nearly all ecosystems are subject to disturbances that operate across a range of temporal and spatial scales. Natural disturbances tend to be pulse disturbances with characteristic magnitudes and the frequency of disturbance is distributed. Human activities tend to create chronic disturbances stressing many aspects of the ecosystem often for prolonged periods. The role of biological diversity is to provide the capacity for renewal and reorganization of desirable ecosystems following change by providing a series of backups of species and plant varieties that can move in to recover freshly disturbed areas.
Many, beginning with Darwin, reiterated by MacArthur, modeled by May, and shown experimentally by Tilman and colleagues[17] show that increased species richness increases the efficiency and stability of some ecosystems. Removal of species or addition of missing species support this observation. When all species that can perform a function are wiped out, big problems result. The extinction of mega herbivores by aboriginal hunters caused a switch from grassland to tundra in the Northern latitudes.[18] Man can recreate this diversity of function by managing large grass-eating animals just as predators managed the large herbivores before man developed the capacity to create the extinction.
Over and over again through history we can see that the loss of specialist species that perform certain functions means those functions may not be carried out at all – for example, the decomposition of particular substrates or the pollination of certain species. Systems where whole functional groups go extinct or become ecologically insignificant as a result of environmental change usually decreases resilience. The consequences of species loss may not be immediately visible, but is likely to appear with loss of ecological resilience upon disturbance or disruption. Species loss reduces the variety of possible alternative ecological organizations. Ecological resilience must be understood if humanity is to anticipate and cope with the ecological crises and surprises that accelerating global change will bring.[19]
Ecosystems can be strikingly conservative in their organization and function, despite differing histories and species compositions. For example, lake studies have demonstrated that similar ecological functions can be maintained over a wide mix of species and population densities.[20] Mediterranean climate regions are similar in ecological structure and function, despite the geographic and evolutionary isolation that has produced radically different floras and faunas.[21] Other work has shown that an ecosystem’s patterns of function, diversity, and body mass can be conserved despite considerable species turnover.[22]
Thinking like an ecosystem. The first half of this chapter should have introduced you to the concepts of complementary diversity in forest, meadows and other naturally occurring landscapes and ecosystems. So, how does all of that relate to the organized, systematic realm of modern agriculture? How do we apply the principles outlined above into a meaningful strategy for building greater resilience in our agricultural systems to develop ecologically resilient agricultural systems? In this second half of the chapter we’ll look at precisely that, in theory as well as application.
Today there is much talk of diversity on the farm: diversity of plants, income streams, livestock, etc. But the quality of diversity is often overlooked. We must ensure that diversity is also complementary, building upon itself to become more robust, flexible, and resilient. In agricultural systems, one aspect of complementarity is evaluating our waste streams to develop added income and savings, Complementary diversity can be the key and it starts with thinking like an organism, a system, a forest or a community of microbes.
Your system, if at maximum ecological resilience, should support you based on the interacting agents within it. Whether it’s a balance between livestock and crops, herbs and cheese, cotton and compost, there is a dynamic system within your grasp given some planning, imagination and a willingness to try something new. So many farmers today, perhaps yourself, are either considering or have already taken off farm jobs to support their families, receive healthcare or any number of reasons. The problem is that when we consider it from an ecological perspective, the ecosystem of the farm is effectively invaded by such actions. A farmer getting an off-farm job is much like introducing an alien species. Certainly it increases diversity of income streams, but usually in a non-complementary way. The increased income may help the farm stay alive, but decreases likelihood that the farm will last beyond the current generation. Loughrey[23] with Glauben[24], have concluded that working part time and building on-farm diversification lead to resilience in the current generation, but only diversification lead to trans generational resilience. Why is this?
Often it is the amount of work required to work both off and on the farm full time. Any child or fellow witnessing this balancing act is prone to wonder, what’s the real payoff? Why would anyone work so hard? The bottom line is that choosing to working off the farm permanently divides your attention while sapping emotional, physical and mental resources over the long run. It’s much like an invasive species in an ecosystem, forcing local organisms to work harder, stressing the nutrient reserves and eventually strangling out the once thriving and diverse ecosystem.
Of course, this is all too simple to just say “find complementary diverse enterprises on your farm. Good luck!” So let’s lay down a few suggested guidelines and practices that have been shown to produce results.
First, it’s true that too much diversity can also decrease resilience on the farm. Too much diversity of enterprises can be less efficient, consuming just as much time and energy as an off farm occupation. Hyper-diverse farms tend only to last because they are supported by off farm income. On the other hand, America relies on only 82 crop species to provide 90 % of the energy consumed by humans. This is equally unwise, and certainly unnecessary given that the world has at least 12,650 edible plant species and about 7,000 species that have been used to a significant extent by humans at some point in time.[25]
How it works on the ground. Let’s take our first example from the rangelands of Australia where the significance of both functional diversity and response diversity in grass species were recognized.[26] The species distribution was typical, with the bulk of the biomass accounted for by a few dominant species and a long “tail” of minor species with low abundances.
Five functional attributes of each of the 22 perennial grass species in the rangeland – height, biomass, specific leaf area, longevity, and leaf litter quality – were measured or estimated. These attributes were involved in water and nutrient cycling and for which there were data or estimates. The species were plotted in a five-dimensional space using a similarity index, such that species close together were very similar in terms of these particular attributes.
The dominant grass species were functionally dissimilar and therefore complementary; this is functional diversity. Most of these dominant species had one or more minor species that were very similar to them in terms of the function they performed. At a heavily grazed site, a number of the species that were dominant in the un-grazed community had been lost or substantially reduced. In four out of five cases, the minor species that replaced these lost ones were their functional analogues. Therefore, despite the fact that grazing reduced the populations of dominant grazing-sensitive species, formerly less dominant but functionally analogous grazing-tolerant species increased in abundance and contributed to the maintenance of ecosystem functions; this is response diversity.
Both functional and response diversity are important in the rangeland. Functional diversity increases the performance of the plant community as a whole, bringing together species that take water from different depths, grow at different speeds, store different amounts of carbon and nutrients, and thus complement each other. Response diversity enables the community to keep performing in the same complementary way in the face of stresses and disturbances such as grazing and drought.
This is something to bear in mind as you cover crop or choose grasses for your livestock to feed on. In the face of drought conditions and ever limited water resources we need to consider diversifying our grasslands. Consider including grasses that penetrate deep into the soil, pulling water up for use by other grasses that create more biomass or store nitrogen. These kind of diverse functions can, and do, develop soils that maintain moisture and biological life in the face of intense heat and lack of rainfall.
Lack of diversity underlies success of modern agriculture. A few species have small edge over other species. Farmers and later breeders selected the most productive genotypes. Then farmers and scientists created optimal conditions for those species and genotypes. Other regions saw the success and adapted the system to their conditions. So the ancestors of maize (Central America), potatoes (South America), wheat (Middle East), rice (Asia), sorghum and sweet potatoes (Africa) all gradually were selected and came to dominate and displace other species.
Farmers can counter this lack of diversity by increasing diversity within this limited group of crop species. Plant communities comprised of regional varieties that are responsive to various regional climates and conditions can be created. This ensures, or safeguards, against numerous crop failures from climate to cultural issues like pests and disease. Moreover having multiple types of similar, though distinctly different, plants develops a kind of competitive interaction that can develop into more robust responses to disturbance. Competitive interactions are strongest among species that have similar functions and operate at similar scales. These interactions encourage functional diversity within a scale, and the distribution of ecological function across scales, enhancing cross scale resilience. This is true among plants and other biological networks as well as marketing and distribution networks. One thing that capitalism has shown us over the years is the value of having market competition, a diverse array of competitors pushing the envelope on development and quality. Moreover, as more businesses, farms, markets and distribution channels join the market, a division of labor can develop with a net of complementary contributors to the overall system.
Self-assessment of diversity. Explore the following questions to determine the complementary diversity of your system.
- Do your crop and animal enterprises require work at different times in your yearly schedule?
- Do you have a variety of enterprises which each contributes to the others?
- Do you have back-up markets for all your products?
- Do you use many varieties of seed?
- Are you producing a greater variety of products than when you began managing the farm?
- Is the quality of your products increasing?
- Do you hold another job? If so, is it related to agriculture?
Assessment of complementary diversity from secondary databases. We have identified several variables with available county-level data which shed light on levels of complementary diversity in the thirteen Southern states.
The following chart shows state by state comparisons of the three county-level measures of complementary diversity and the combination of these measures in a diversity index.
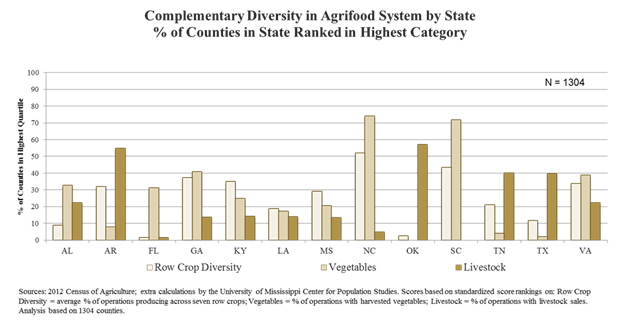
The following box show the rankings by state on the diversity index. Most striking is that that top four states on SRI are also the top four on diversity.
Also striking are the similarity of low scores on the overall SRI and low production diversity index scores for Oklahoma, Texas and Mississippi. Of those states with the lowest SRI rankings, only Alabama manages to rise to nearer the middle tier on diversity.
Florida is distinctive in being among the top five in overall SRI, but in the lowest three states in diversity, according to this index which compares extent of row crop, animal and vegetable diversities.
The lack of any counties in Oklahoma to rank in the top quartile and the 83% of North Carolina counties in the top quartile also point to a vast disparity between Southern states in production diversity.
|
States ranked by % of counties in highest quartile on the production diversity index |
|||
|
Production diversity |
Overall SRI |
State |
% |
|
1 |
2 |
North Carolina |
83.0 |
|
2 |
1 |
Virginia |
52.0 |
|
3 |
3 |
Kentucky |
44.2 |
|
4 |
4 |
South Carolina |
26.1 |
|
5 |
9 |
Georgia |
25.2 |
|
6 |
8 |
Arkansas |
22.7 |
|
7 |
7 |
Tennessee |
21.0 |
|
8 |
12 |
Alabama |
19.4 |
|
9 |
6 |
Louisiana |
14.0 |
|
10 |
13 |
Mississippi |
13.4 |
|
11 |
5 |
Florida |
5.9 |
|
12 |
11 |
Texas |
5.1 |
|
13 |
10 |
Oklahoma |
0.0 |
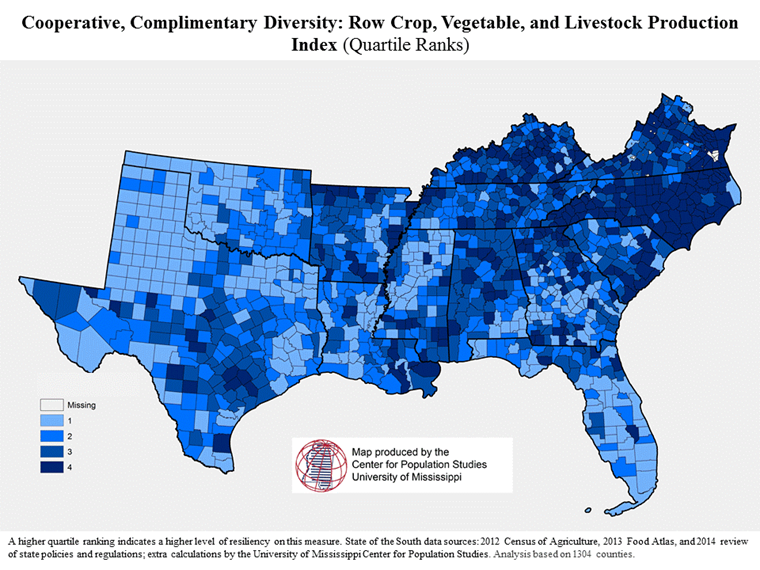
Summary
As everywhere in ecology, contradictory concepts must be embraced and united if resilience is to be born. Ecological diversity is born of conflict, though it also arises out of cooperative relationships. As life on this planet has morphed and changed and as ecological niches are made or filled, it is often through complementary diverse relationships that ecosystems are built. Looking at the soil system we see an amazing network of individual components (e.g. microorganisms, worms, ants, fungi, etc.) finding opportunities to aid one another by providing otherwise unavailable nutrients, aeration or soil moisture. Above the ground shade loving plants are complemented by large trees. Squirrels, birds and may other animals both feed on and transplant the nuts and fruit therefor propagating trees into new territories. Woodpeckers in their pursuit of bugs create dwellings for beneficial insects.
Though conflicting goals can result in diversity in resilient systems, cooperative or complementary goals achieve the same and often greater results!
It is up to you to look for those opportunities to build something greater than the sum of its parts. To find those connections on and off the farm that yield results that keep building on themselves, closing the real and metaphorical loop to eliminate wasted time, energy and inputs.
Though diversity can be a destructive force, when concepts, ideas, and systems are paired with complementary ones, the magnitude of the results can be truly remarkable yielding greater income, time and opportunities.
Citations for complementary diversity
[1] Darwin C. 1859. On the origin of species by means of natural selection or the preservation of favoured races in the struggle for life [reprinted 1964]. Cambridge (MA): Harvard University. Tilman D, Wedin D, Knops J. 1996. Productivity and sustainability influenced by biodiversity in grasslands ecosystems. Nature, 379:718–20.
[2]Zimov SA, Chuprynin VI, Oreshko AP, et al. 1995. Steppe–tundra transition: an herbivore-driven biome shift at the end of the Pleistocene. Am Nat 146: 765–94.
[3] http://www.sciencemag.org/content/303/5663/1489.citation
[4] http://www.columbia.edu/itc/cerc/danoff-burg/invasion_bio/inv_spp_summ/Oryctolagus_cuniculus.htm
[5] McGinley, M. (2011). Invasive species. Retrieved from http://www.eoearth.org/view/article/153902/
[6] http://www.actionbioscience.org/biodiversity/simberloff.html
[7] http://www.wildlandfire.com/docs/biblio_indianfire.htm , http://whyfiles.org/2012/farming-native-american-style/
[8] Ehrlich, P.R. & Ehrlich, A.H. 1981: Extinction: the causes and consequences of the disappearance of species. Random House, New York, New York, USA.
[9] Frost, T.M., Carpenter, S.R., Ives, A.R. & Kratz, T.K. 1995: Species compensation and complementarity in ecosystem function. In: Jones, C.G. & Lawton, J.H. (Eds.); Linking species and ecosystems. Chapman and Hall, New York, New York, USA, pp. 224–239.
[10] Walker B. 1992. Biological diversity and ecological redundancy. Conserv Biol 6:18–23; Walker B. 1995. Conserving biological diversity through ecosystem resilience. Conserv Biol 9:747–52
[11] Holling, C.S. 1992. Cross-scale morphology, geometry and dynamics of ecosystems. Ecol Monogr 62:447–502
[12] Jones, C. G., Lawton, J. H. and Shachak, M. 1994. Organisms as ecosystem engineers. Oikos 69: 373-386
[13] Holling CS, Schindler DW, Walker BW, Roughgarden J. 1995. Biodiversity in the functioning of ecosystems: an ecological synthesis. In: Perrings C, Ma¨ler K-G, Folke C, Holling CS, Jansson B-O, editors. Biodiversity loss: economic and ecological issues. New York: Cambridge University. p 44–83
[14] Peters RH. 1983. The ecological implications of body size. Cambridge (UK): Cambridge University.
[15] Holling et al., ibid.
[16] Elmqvist, T., C. Folke, M. Nystrom, G. Peterson, J. Bengtsson, B. Walker, and J. Norberg. 2003. Response diversity, ecosystem change, and resilience. Frontiers of Ecology and Environment 1(9):488-494.
[17] Darwin (1859), MacArthur (1955), May (1973) Tilman 1996; Tilman and others 1996)
[18] Zimov SA, Chuprynin VI, Oreshko AP, et al. 1995. Steppe–tundra transition: an herbivore-driven biome shift at the end of the Pleistocene. Am Nat 146: 765–94.
[19] Peterson et al. 1998. Ecological resilience, biodiversity and scale. Ecosystems 1:6-18.
[20] Schindler DW. 1990. Experimental perturbations of whole lakes as tests of hypotheses concerning ecosystem structure and function. Oikos 57:25–41.
[21] Kalin Arroyo MT, Zedler PH, Fox MD. 1995. Ecology and biogeography of Mediterranean ecosystems in Chile, California, and Australia. New York: Springer-Verlag.
[22] Forys, E.A. & Allen, C.R. 2002: Functional group change within and across scales following invasions and extinctions in the Everglades ecosystem. Ecosystems 5: 339–347; Allen et al., 2011. Managing for resilience. Wildlife Biology, 17: 337-349.
[23] Loughrey, Jason Thia Hennessy, Kevin Hanrahan, Trevor Donnellan, 2013, Agricultural Labour Market Flexibility in the EU and Candidate Countries. Working Paper 49. Centre for European Policy Studies, Brussels, Belgium.
[24] Glauben, T., Tietje, H. and Weiss, C.R., (2003), Farm Exits: Evidence from German Census Data. Paper presented at 77th AES Annual Conference, April 2003, University of Plymouth, Seale-Hayne Campus, Newton Abbot.
[25] Prescott-Allen, R. and C. Prescott-Allen, 1990. How Many Plants Feed the World. Conservation Biology, 4:365-374; Kunkel, G. 1984. Plants for Human consumption. Koeltz Scientific Books. Koenigstein, Germany; Hammer, K. 1999. Species diversity of wild relatives to crop plants. Bot. Lithuan. Suppl. 2:31-35.
[26] Walker, B., A. Kinzig, and J. Langridge. 1999. Plant attribute diversity, resilience, and ecosystem function: the nature and significance of dominant and minor species. Ecosystems 2:95–113
Individual qualities of resilient systems
V: Who’s got your back? Responsive redundancy
Everything has back-ups in resilient systems. Who will manage your farm or business if you get sick? Do you rely on just one supplier or one market? What if they disappear? Will anyone take over your farm or business when you retire or enter the Ω phase? Are you so focused on efficiency that you’ve forgotten about back-ups to get you through a crisis? Do you find it easier to just do the job yourself, rather than train someone else to do it?
Two central aspects of redundant systems. Resilient ecosystems reproduce themselves and have overlapping subsystems which perform the same functions in multiple different ways. These are the two central aspects of what ecologists call redundancy. As managers of social ecosystems, how do we create systems which back each other up, bolstering our businesses? How do we build redundancy into agriculture and what does that look like? In creating an ecologically resilient system we must create designs similar to living ecosystems—which all contain myriad redundant systems. We discuss in other chapters the interconnectedness and interdependence of nature through symbiotic relationships and partnerships, trading nutrients and moisture to ensure that the whole system is resilient.
We see this redundancy in the overlapping functions of different insects and other species. Many different agents in the resilient ecosystem perform the same function, but are so dissimilar in other respects that disappearance of both simultaneously is improbable. Woodpeckers and carpenter bees alike drill holes into wood for either food or shelter and as the wood deteriorates those holes are steadily filled with mushroom spores and other bacteria that colonize the wood. All these different species all perform the function, in their own way of deteriorating the wood and continuing the adaptive cycle of the forest. The power of backups in ecological systems is that if the woodpecker becomes extinct, the carpenter bees will still fulfill the same purpose, developing holes in the wood for mushrooms and bacteria to colonize the old trunk.
The key element to redundancy in these natural systems is the ability for the process to continue without one, or more, individuals or species present. This is due to the amount of different ways that one task is achieved by many different species in the forest, farm or other system. There are many ways to skin a cat, what’s important is that the redundancy is accomplished.
In our own systems we can look for ways to build this kind of multipurpose function into our projects and our processes. Take the average apple orchard worker, how many ways can we build redundancy into the work that is done? If all the orchard workers, regardless of their primary tasks, are looking for pests and disease, water line damage, or deer damage, you have increased resilience by increasing redundancy. Moreover encouraging people to fix those issues as they arise by supplying the tools for the job further enhances resilience through redundancy. The more functions that one person or piece of equipment can perform, the higher your redundancy; just as in the forest.
This kind of multi-angle approach lends opportunities for ingenuity and adaptation as people become more adept problem solvers. Adaptation is key to ecological resilience in times of disturbance and it is up to you, as the manager, to leave room for innovation and inclusion of new and more effective systems. Nature does the same thing every time a certain insect or species is removed, creating a disturbance. The system adapts to fill the void with existing species all performing the function, in slightly different ways. This approach echoes the principals of complementary diversity and conservative flexibility, urging us to look for ways to diversify our knowledge with complementary concepts and accumulate tools to construct flexible systems that are also field tested.
As manager you must move past the notion that backups are extra or somehow fundamentally unnecessary to ensuring the continued life of our systems. As we build backups of tools, equipment, people and partnerships we create a buffer around ourselves to absorb unexpected shocks. Those unexpected shocks like illness, natural disaster, market collapse or equipment failure represent the disturbances that require us to innovate, be flexible and change--to reorganize and grow from our experiences.
The only way that nature recovers in the wake of a forest fire or flood is due to backups of seeds, deep dwelling microorganisms, trees and external inputs from birds and other creatures depositing new seeds and fertilizer back into the soil. The seeds in the forest analogy are like your tools, equipment and physical infrastructure, while the transitory birds, wind, sun and other creatures are more like your community partnerships that aid in your recovery from the outside.
What is your perception of backups? Do you consider yourself to have ample backups? What do they look like? What items can you replace easily? What people would you call if you faced something unexpected?
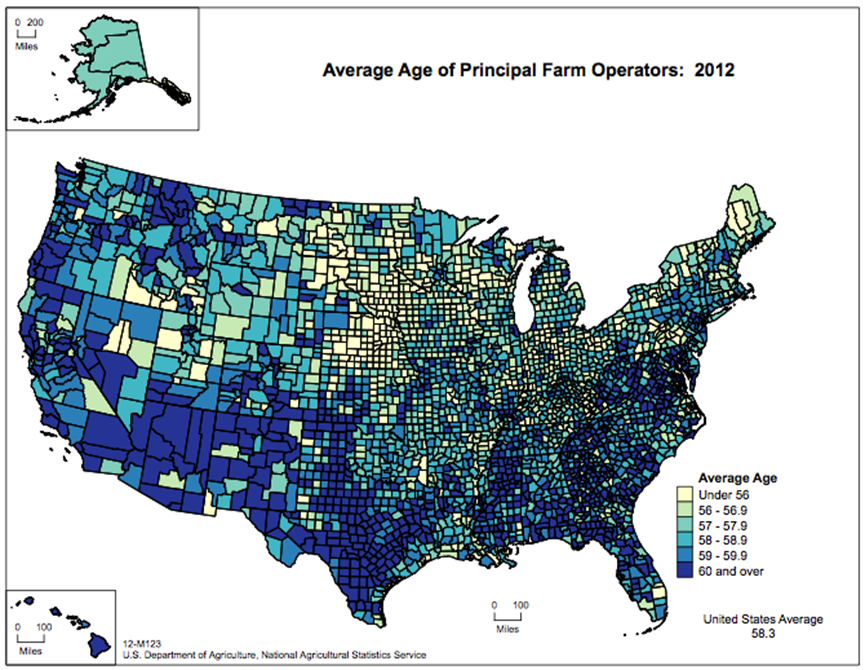
|
Average age of principal operators by county acccording to 2012 Agricultural Census. |
Redundancy at larger scales. Societies with low fertility rates will be replaced by societies with high fertility rates as we’ve seeing in North America, Europe and Australia today. At a slightly less expansive scale, if there are no new farmers coming into a particular area, the agricultural system cannot last. As the accompanying graphic shows, in much of the country, especially the South, the average age is amazingly high. Even worse, the number of beginning farmers seems to be dropping in nearly every state. Twenty percent fewer beginning farmers (those farmers who have been farming for ten years or less) were tallied in the 2012 Ag Census than in 2007.
The South had highest declines in new farmers from 2007 to 2012 as illustrated in the map below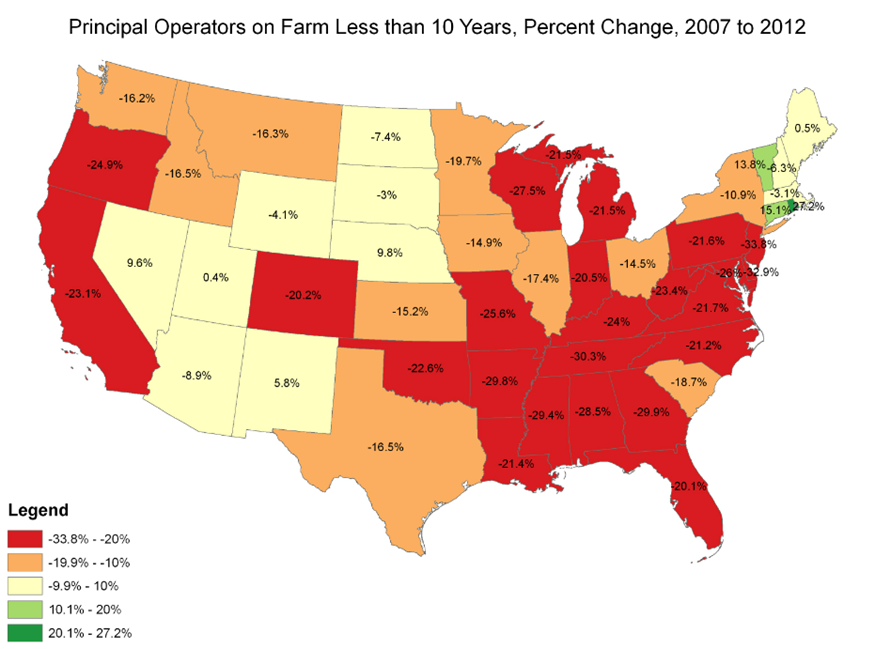
Change in beginning farmers by state according to USDA Agricultural Census 2007 and 2012.
There are pockets of young farmers near major urban areas. The counties surrounding New York City (NY), Boston (MA), and Ithaca (NY) have some of the youngest farmers across the nation, including an average age as low as 37.4 years. The average in most Southern states is close to 60. Our case studies and other anecdotal evidence indicates similar pockets of new and younger farmers exist in the South, but are not large enough to move the state averages significantly.
The lack of redundancy at the state and national scale is being addressed by various Beginning Farmer programs which are well-documented and will not be explored in this chapter, though some links and organizations have been listed in the building physical infrastructure chapter. Instead we will focus on aspects of redundancy that can improve as a manager in your farm or business. We’ll begin at a very basic level.
Consider physical items like tools, equipment, scrap metal or replacement parts. Do you have just one of everything? Are you a minimalist in your tool and equipment sheds? Though this minimizing can help decrease clutter and wasted space, it is important to weigh the benefits of having some extra tools on hand and replacements for common tractor parts.
As with every factor of ecological resilience, you can take this philosophy as far as you care to; horses and carts in case your tractor fails to hand pumps on your well in case of a power outage. Though as we discussed in Building Physical infrastructure, it helps to be aware of our scale and what that scale requires. If we build physical infrastructure that are ill suited or clutter our spaces to a point of deteriorating function, they are no longer physical infrastructure. It is similar with backups, that for them to be of use to us, we must consider how many we have and whether they encumber or support.
Our goal is not to suggest that you should have 2 or more tractors, 5 shovels and rakes, 10 children growing up to be farmers and an absurd amount of screws and nails lying around. Though, if that’s reasonable and appropriate for you given your scale, skills and situation, do it! Ecological resilience is case specific, custom made and always adaptable.
Now, consider a broader definition that is less definable that encompasses yourself, your organization, your neighborhood and your community. These are all examples of redundant systems around you that can offer a perceptible amount of support. You yourself are a dynamic human being that is prone to innovation through your ability to plan for the future. Your system, whether it is a farm, marketing system, distribution center, or any other layer of agricultural business must have redundancy built into its management scheme.
Redundancy is a term common in many other professions, though its application is often different depending on the task at hand. Ask any computer programmer about redundant systems, and they’re very familiar with the term because they build computing systems that must not fail. In order to assure continued performance from their programs, they build in back up functions and latent programs that are dormant until something else fails. For programmers, failure is expected and accounted for in the original design.
Similarly in engineering, parts and processes are provided with a ready duplicate as fail-safes in case of equipment failures or errors. The difference between the redundancy common to programmers and engineers versus ecological redundancy is the nature of replacements. In ecological systems that are resilient, the backups and redundant systems are often similar but are never the same. In the wake of a forest fire, the forest will often mature to the same types of trees, shrubs and herbaceous layers, but the layout and exact proportions will never be the same. Innovation and expansion are the keys to redundancy in ecological systems, including you own.
Do you have any back up plans for your business? As our economy, planet and culture continues to shift and change, it behooves businesses to be able to respond to those changes with speed and efficiency. In times of unexpected change, do you have time to think of a new plan? It’s quite stressful to manage the passing of a failing system while coupled with the need to design a new one.
These backup systems can be simple, or complex, ranging from keeping bees as a source of potential income, keeping an array of different seed varieties that you can use in case of crop failure, to having a few different business plans in the filing cabinet that you know you’re good at and can launch in a timely manner given the physical infrastructure that you have.
Planning for the future
“The world is right when the old man plants a
young tree knowing that he will never sit in its shade”- Unknown
Whatever you’re building, what’s the plan for the future? How large to do you want to grow? How fast do you need to get there? What considerations can you make now that will support the future? This kind of long term planning, insinuated in the quote at the beginning of this section, suggests that we need to think beyond our own short life span if we really want to build a resilient system. Consider this stance as you build the infrastructure around you. Succession occurs in stages over a period of time and it is up to you as the innovator to create a road map for success. Also consider that future conditions will certainly not be as they are today. Insure you have alternate routes built in, ready to go.
In the standard model of ecological resilience, there are many cross overs between factors, one factor relating to many others. This is still the case with backups in that the most resilient models we saw in our study of the South boasted strongly diversified markets that developed multiple tiers of production that were complementary. In complementary systems, redundancy is implicit in the design, as redundant systems are made of complementary processes. Let’s say you want to start, or currently operate, a dairy farm. What else can you do besides sell milk directly to an outlet or to consumers? What about your “waste” products, can they be turned around into a useful and marketable product? Whether it is excess manure from your cattle, the cream from your milk, or the occasional bull that is born to your breeding heifer, there are opportunities for alternate markets throughout the operation. The same can be said for any kind of product, though some things like honey are more prone to multiple value added products than others.
Consider Your Scale
How large is your operation and what are your goals for the future? Scale begins now and into the future with consideration for how and what you want to produce. If you intend to produce 2, 3, or 4 times more than you do now, it would be wise to plan on building to suit your future needs, rather than present. While you are planning for the needs of the future, how can you build in redundancy and backups? Perhaps you think you need 10 stalls for your livestock, consider building 15 or more. The last thing you want to do is to limit your growth by building too small.
On multiple occasions with our interviewees we saw that the structures and systems they built for their businesses soon became too small for their growing demands. Consider L. C. Ratchford in the Searcy case study. This buffalo producer in Arkansas constantly felt the barn he was building was too large and he would never use the space. Just a few short years later as his business has grown, he has run out of space. This happened over and over again during our study across the Southern states.
The same applies for hiring employees, consider how many hands and people you will need to complete a harvest or certain task on your farm in the future. Take that amount and consider the amount of time needed for each employee; are you going to produce enough to cover the cost? If your crops have issues do you have any alternate opportunities backing up your operation to make money to pay your staff and continue to build your business?
Moreover, as you are organizing people to work with you consider who you can call in an emergency. When we begin to work with others we are presented with opportunities to grow our businesses and networks, at the added expense of the chaos of other people’s lives. Whether its children, illness or the need to get away for vacation, everyone –including yourself– needs to be able to figuratively and literally call in sick. The ability to step away from the farm is perhaps one of the most critical components of redundancy in today’s agricultural climate. Everyone is susceptible to issues outside of their control that require them to leave their property. Do you have the capacity to leave for a day? What if you are required to leave for a week? Who knows what needs to be done at your farm and how quickly can you train someone? Even without an emergency, it is healthy and necessary to be away from the farm to attend social gatherings and celebrations that enliven the spirit. It is clear from research that everyone needs that ability to step away and have a different experience from their work from long vacations to sporadic weekend getaways and seeing close friends. Perhaps the most critical issue today is the aging populous of farmers in America and around the world who are at a higher risk for injury or illness requiring them to leave their farms.
If you look around farms across the United States, almost half of farmers are over the age of 60 with some well into their 70’s[1]. Many don’t have anyone to take over their farms and no exit strategy. With accumulated debt from purchasing tractors, fertilizer and pesticides every year, many large scale farmers are in debt. Older farmers are by nature at a higher risk of injury or fatality than their younger counterparts. It is imperative that a farm, especially if it is run by an aging operator, to have trained staff to manage duties that may become too challenging physically or mentally.
Another way to think of this future disturbance is building in accessibility and operational ease to your system at the get-go. What small ways can you make tasks easier on yourself during day to day tasks?
Integrate Handicap Accessibility
Let’s say your business is up and running, you’re generating products and getting them to market to develop an income. What happens when and if you break your leg, develop a debilitating flu, or pull a muscle in your back? Will you still be able to operate the critical processes that keep your business going? Organizations exist[2] to help farmers get back to work from debilitating accidents like paralysis and amputation when they become disabled. The principles that these organizations use to make their work possible are often simple, ease of access adjustments to existing infrastructure. Whether it is a lift to get you into your tractor, raising your gardening beds or using dolly’s to move heavy feed, how can you make your operation more physically accessible?
As you walk around your operation, or as you are planning for one in the future, consider what things you feasibly could do with a broken leg. If you find that there is no way you could do a certain task, how could you plan for the possibility? Is there a 4 wheeled cart that you could use instead of your more maneuverable wheel barrow? Do you strain yourself every time you open a certain gate? If so, is there a way you could make that one motion easier for the future?
The Tightrope of Efficiency
As you begin streamlining your operation to be more accessible in case of injury or unknown circumstance keep an eye out for the tight rope of efficiency. You want to build something that is physically more efficient while maintaining alternative approaches.
This also applies to your social and marketing networks. It may be easier to keep track of only one supplier but the risk is greater of shortages and problems in the future. In recent years in the wake of a tsunami in Japan a product supplier was wiped out causing massive shortages in one industry across the world.[3] Though production, distribution and marketing were extremely efficient, the supply chain totally failed to account for challenges of the future. It could be a tsunami, tornado, drought or problem with management that depletes your supply of feed, fertilizer, equipment or anything else. It is imperative to have some backups in your supply chain and avoid efficiency for the sake of efficiency.
Community and Social Backups
When you think of the word community, what images come to mind? Your business partners, friends, social organizations, community gathering spots like the town community center, local churches, maybe the leader of your local 4-H group? These are some examples of outlets within your community that you can reach out to for support. Whether you need products, services, a helping hand or some emotional support in tough times your community can offer you a safety net when you yourself have run out of options.
So often in rural areas, and cities alike, we can become isolated, working by ourselves, potentially suffering creatively for it. When we gather and work with others we increase our capacity for adaptation and innovation based on the knowledge, physical infrastructure and accumulated skills of your community. This community can be local or distant, made up of close connection or a loose ties, and as large as you can reasonable manage.
We cover community and networking in our modular connectivity chapter, but we must mention some specific aspects here because redundancy relies so completely on connectivity, community, and networking.
Developing Marketing and Distribution Opportunities
When we’re developing markets it’s important to remember the value of having backups in our clientele. Just as it is important to keep backups in our supply chain, we need to ensure that there is always a client to provide for. In agriculture if you don’t have a supply chain coming to and from your farm, what kind of value are you generating? These alternate markets can be small or large, maybe it’s a few business cards that you keep in your desk to call on in hard times.
No matter how much you secure those backup markets, it’s important to ensure that your products can make it into the market no matter what your current purchaser does. Too often large amounts of produce end up rotting on distribution floors because the market has shifted and the demand has been reduced[4]. It’s not a formality to take business cards from potential partners, it’s an integral practice to ensure the viability of your operation.
More broadly, you may find opportunities you hadn’t considered before that can add value to your existing products. Consider canning and preservation groups that can take your excess produce to develop salsas, sauces, or pickled items; Groups and businesses that primarily juice vegetables and are often less concerned with appearance; Bakeries that may be interested in lard from animals.
You may find that as you open yourself to more market opportunities that you can start developing competitive price markets with some purchasers offering more for your products than others. These networks take time and creativity to develop but it’s worth bearing in mind as your business develops.
Interns, open houses and workshops. Tools for inspiring and engaging the next generation.
While you’re acquiring business cards to develop extra market opportunities, consider what other civic opportunities exist. Within most communities there are organizations that bring farms together with the community, like Slow Food International or Farm to School programs. Consider your goals for the future while asking yourself how you could open your farm to others? Some businesses go so far as to have farm days where people can come by in tour buses to view there operation, others host workshops where people learn to build a barn or plant trees. Depending on how open you are to having numerous people on your farm can determine how much you can achieve with the volunteer labor of your community.
In another light, consider also what kind of economic opportunities you can provide through your farm to ensure the next generation of farmers. With farm land dwindling, the average age of farmers increasing and general lack of capital sufficient to start a farm, many young people are looking for opportunities to develop their skills and work the land in creative ways.
Today, beginning farmers and ageing landowners are looking for unique ways to make the land transition from one generation to the next, especially for aging farmers that don’t have a retirement savings, plan, or heir to their land. This presents most farmers with seemingly insurmountable challenges for passing on their land. Nonetheless, with some creativity and a willingness to share skills and resources people are coming together to develop land transfer plans that benefit the aging operator and the oncoming farmer.
In some cases landholders will essentially lease their land to new farmers while remaining in their home thereby generating a retirement income. This is most economical if housing is very close to the farm or if there is a home on the property for the oncoming farmer. Overall it is agreed that housing new farmers in the existing home with the current landowner often doesn’t work out. Whether its personality issues or a difference in housekeeping it is highly suggested to live separately.
One organization working diligently on land transfer is the Land Stewardship Project based in Minneapolis, Minnesota. They work independently on projects like the Farm Transition Toolkit[5] as well as collaborating and supporting statewide efforts like the Farm Beginnings Collaborative[6]. Their efforts are inspired by the recognition that over the next 20 years (2015-2035) 70% of land will transfer hands in the United States alone[7]. If nothing is done to effectively aid the land transfer movement it is likely that many corporate farms will simply buy up more land, expanding their mono-crop, soil mining practices.
By offering real toolkits to aid farmers in creating the financial plans, and legal backing to transfer their land, real opportunities are being created. The internet itself has opened the doors for countless aspiring farmers by offering technical training though satellite internships like what you can receive from The Virtual Grange[8], a program sponsored through the Stone Barns Center in New Jersey. Through online forums, videos, articles and listings for real apprenticeships, new farmers are learning about the field before they ever enter a real one.
If you’re considering offering internship opportunities like those that WWOOF[9] or WorkAway[10] offer, consider this housing issue very seriously. It will be best for you and the incoming intern(s) to have adequate accommodation. These two programs can offer a great service of helping to supply a workforce for your farm. These 2 services require you to supply room and board to oncoming interns which, depending on your productivity, may be easy to supply.
Interning doesn’t actively pass land onto coming generations but it does offer a way for growers to pass on their knowledge and skills. The more people who critically know how to farm the more resilient our cultural and world food supply becomes.
What internships, volunteer opportunities, workshops and open houses all have in common is the capacity to share information and raise cultural awareness of our food supply. Many children, particularly in city centers are largely ignorant of where their food comes from and how it is produced. When shown a carrot, potato or peanuts many inner city and some rural children don’t know that they’re all grown underground. They know even less about healthy soil, clear air or the importance of microorganisms and fungus. On the other hand, you as a business owner have the capacity to share what agriculture is with oncoming generations.
To list just a few organizations that can spur your interest and bolster your know how, take a look at these organizations: The Land Stewardship Project, The Stone Barns Center, National Young Farmers Coalition, the Agrarian Trust, Land for Good and countless other organizations like local Extension Agencies who are doing their part to fill in the gaps. Take some time online to research these and other organizations who are all making land transfer their top priority.
Consider seriously how you can pass your land on to the next generation of land stewards. It takes a willingness to develop relationships and spend the time to create a real plan for retiring land. It is easier to work with a realtor and simply sell your property to the highest bidder, but the long term view that ecological resilience requires shows us that it is imperative to ensure continued stewardship and development of rural farmland. Either physical or informational, your business contains knowledge that is critical to the development of our food system into a resilient and robust one.
Building redundancy also builds innovation. Redundancy builds out of networks. The resilient system is always using modular connectivity to build redundancy. A side benefit of these networks is often an increase in innovation which leads to increased success for members of the network. A vast literature exists on the success of networks of small and medium-sized enterprises in coordinating manufacturing and marketing to increase profitability. This literature is discussed in the modular connectivity chapter, noting that prominent examples of transformation of regional economies through such networks are the Mondragon region of Spain, north central Italy, the dense social networks of East Asian economies such as Japan, Korea, Taiwan, China, Silicon Valley, Route 128 in Boston, Toulouse, Baden-Wurtemberg, Bavaria, Jutland, and many others.[11]
Such observations have led to a significant increase in policy strategies which seek to build such networks. The political impact on regional rural development policies extends far beyond the marketing, processing, or credit ventures which were the original goals of the networks.
Where rural networks of small enterprises have transformed local economies, consistently present is an atmosphere encouraging competition of ideas and innovation and cooperation between entrepreneurs. The social atmosphere which encourages innovation, competition of ideas, and cooperation between entrepreneurs requires is seen to explain success of various ethnic groups including Chinese in the Mississippi Delta, Lebanese in West Africa, Armenians in Europe and US, Koreans in US inner cities, Indians in New Zealand, Palestinians in California and many others.[12]
Beginning farmers can produce redundancy and innovation. The system redundancy which results when older farmers mentor younger farmers also leads to innovation on both sides. The older farmer often changes his practices through the lens of life long experiences, weeding out tactics that the farmer knows unequivocally won’t work. Meanwhile the young farmer necessarily learns much from the practical experience of the older farmer while bringing sometimes revolutionary ideas and practices to the table. Our case of the Hardins[13] shows this clearly with the father gradually adopting many new organic practices from the son who fully respects the experience and wisdom of his families practices. The father now does things he would never have conceived of without the input from his son, a much younger farmer.
It is important to value our ability to support a new generation of farmers as well as their coming knowledge. Much has been, and continues to be, discovered over the last 50 years about organic practices that were largely forgotten and disregarded during the age of chemical fertilizers. What many older famers don’t immediately understand is that the practices that many “new age” farmers are bringing to the farm are in fact “age old” practices with a bit more research and perhaps a new name. We cover this topic more thoroughly in the chapter on conservative innovation, but it is worth noting the value that a new generation can provide by bringing both new versions of old practices and revolutionary ideas to the table.
Physical Backups
What items are critical to your operation? Are those items in working condition? How often do they break or fail? Can you rely on them indefinitely? Of course no tool or piece of equipment will last forever of its own accord but can you repair it? What is your plan for upkeep on those tools?
What if you can’t repair them? All your handles and tools are plastic or your machines are such that you don’t know how to troubleshoot problems. These are some of the reasons to weight the value of keeping backups. In agriculture it is imperative to have the right tool when you need it at peak harvest and throughout the growing season.
Consider what is easily replicable locally and regionally. Wood is something that you can harvest easily and can be used in diverse ways such as tool handles or wedge construction requiring no nails or fasteners. Though, not appropriate for all purposes, wood construction and tools can offer relatively easy replacement that is highly renewable.
What fails to be renewable is often repairable though, with the right skills and tools. Whether it’s taking welding classes, woodworking, or getting to know your local machinist and mechanic, it’s a valuable physical infrastructure to know how to work with your equipment. Companies that offer lifetime replacement make their tools to last a lifetime rather than many other companies that, though significantly cheaper, will have you buying their products again and again as they continue to break due to wear.
As you acquire tools also keep in mind the advantage of having another shovel, a few extra pairs of gloves, or a straw hat for the sun. These extras not only increase your ability to keep farming in case your tool handles break, they also open the door for more help and more hands on your farm. You want to back up your production with tools and your whole operation with minds and bodies that can do the work. We cover this topic more extensively in the building physical infrastructure chapter and wish here to provide a mindset and perspective to help you choose tools, equipment and people with a greater willingness to invest time and money into the long term.
Agroecological Backups
Earlier in this chapter we discussed the notion that nature produces backups by having multiple species that are all performing the same tasks. Your agroecological system will again benefit from the principle as you begin to integrate different aspects into your farm, looking for opportunities of cross over and mutual benefit.
Take waste as an example, an issue for many farmers producing vegetable and commercial products alike. How many ways can you handle waste? Say you grow watermelons that require companion planting like many seedless varieties do. Could you turn around and feed those companion plants to hogs that you sell later at market? Perhaps you could operate a mid-sized composting business using the waste? Maybe you produce cotton or rice and you’re left with the waste from processing; that can be used as bedding for a poultry business or industrial mushroom cultivation.
Redundant systems can resemble what are referred to as “closed loop systems” where operations feed into one another, the waste of one becoming fuel for another. Therefore your agricultural products and by products become part of the ecology of your business helping foster growth and productivity.
Self-assessment of redundancy. Following are questions which our research shows are good indicator of farmers high on the redundancy factor of resilience. How do you score on these questions?
- Do you farm with relatives or alone?
- Are your children interested in farming?
- Do you have someone to take over your farm or business if you get hurt and can’t run it?
- Do you have a plan for passing on your farm to another farmer?
- Are there other farms like yours close to you?
- Do you have ready access to replacement parts and equipment?
Secondary databases illuminating redundancy. Two indicators of redundancy are available in county level databases. These variables, from the National Agricultural Census are farmer age and decline in number of farms. The inverse of each indicates resilience. The rankings by state are show in the following chart.
One measure of the responsive redundancy quality of resilient systems is age of farmers. More resilient systems will have younger farmers. Non-resilience is indicated if age of farmers is extremely high. Without young farmers coming into agriculture, agricultural systems cannot last.
|
|
States ranked by % of counties in highest quartile for youth of farmers across South |
||
|
Youth Rank |
Overall SRI |
State |
% |
|
1 |
3 |
Kentucky |
65.0 |
|
2 |
8 |
Arkansas |
52.0 |
|
3 |
10 |
Oklahoma |
45.5 |
|
4 |
6 |
Louisiana |
42.2 |
|
5 |
2 |
North Carolina |
27.0 |
|
6 |
1 |
Virginia |
23.5 |
|
7 |
7 |
Tennessee |
23.2 |
|
8 |
9 |
Georgia |
19.5 |
|
9 |
12 |
Alabama |
16.4 |
|
10 |
5 |
Florida |
14.9 |
|
11 |
11 |
Texas |
13.4 |
|
12 |
4 |
South Carolina |
13.0 |
|
13 |
13 |
Mississippi |
11.0 |
As shown in the above box, Kentucky counties had higher scores than any other Southern State. 65% of Kentucky counties scored in the top quartile of all Southern counties. Arkansas, Oklahoma and Louisiana comprised a second tier. A high proportion of counties in these states have younger farmers than other counties across the South. Oklahoma and Arkansas scored much better on this measure than on the overall SRI, both entering the top three states.
In contrast to their overall SRI, dropping out of the top tier on this measure were Virginia, North Carolina, South Carolina and Florida. South Carolina dropped the furthest, from 4th in SRI rank to 12th on this youth measure.
Mississippi and Texas remained in the lowest three, while Alabama moved up a few notches.
States with counties most in need of improvement on this measure of resilience are Georgia, Mississippi, Texas and Virginia. All had more than 30% of counties scoring in the lowest quartile across the South.
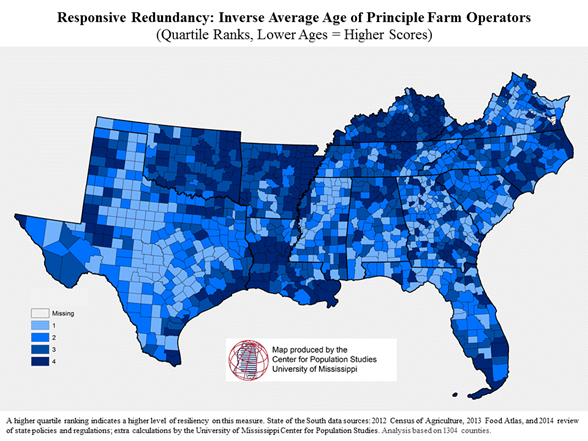
The above map shows graphically the county level data on this measure of responsive redundancy. Counties which are darker show more resilience on this indicator.
The box below shows the change in number of farm operations (states saving farms) as well as the youth measure and the overall SRI. More resilient counties and states are not losing farms, but gaining them.
The top three states on this measure of responsive redundancy (South Carolina, Florida and Texas) ranked near the bottom of our other measure of RR as shown in the adjacent box.
They were joined in the top tier by Virginia, Louisiana and North Carolina. Five of the top six states on this measure were also in the top six for overall resilience.
However, Kentucky, ranked 3 overall and 1 on the youth measure of RR, fell to near the bottom on this indicator. Loss of farms is highest in Kentucky, Alabama, Tennessee and Oklahoma. These four states are losing farms much more quickly than other Southern states.
|
States ranked by % of counties in highest quartile saving farms across South |
||||
|
Saving Rank |
Youth Rank |
Overall SRI |
State |
% |
|
1 |
12 |
4 |
South Carolina |
52.2 |
|
2 |
10 |
5 |
Florida |
46.3 |
|
3 |
11 |
11 |
Texas |
40.2 |
|
4 |
6 |
1 |
Virginia |
35.7 |
|
5 |
4 |
6 |
Louisiana |
34.4 |
|
6 |
5 |
2 |
North Carolina |
31.0 |
|
7 |
2 |
8 |
Arkansas |
17.3 |
|
8 |
8 |
9 |
Georgia |
16.4 |
|
9 |
13 |
13 |
Mississippi |
13.4 |
|
10 |
1 |
3 |
Kentucky |
9.2 |
|
11 |
9 |
12 |
Alabama |
9.0 |
|
12 |
7 |
7 |
Tennessee |
8.4 |
|
13 |
3 |
10 |
Oklahoma |
7.8 |
The map below shows graphically the county level scores on this measure of responsive redundancy. Counties which are darker show more resilience on this indicator.
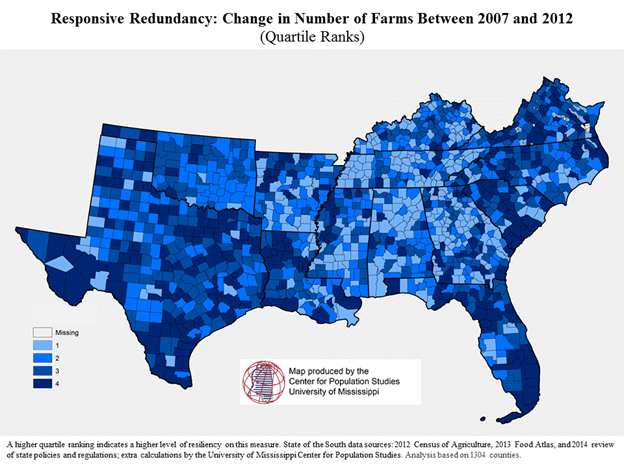
Citations on responsive redundancy
[1] USDA, National Agricultural Statistics Service, Average Age of Principal Farm Operators, 12-M123.
[2] Handicap farming resources: http://nasdonline.org/browse/194/farming-with-disabilities.html
http://agrability.org/
[3] http://www.fmglobalreason.com/article/pardon-interruption
[4] Refer to “Little Rock in a Large System: A Case Study on Resilience in Little Rock, AR”
[5] http://landstewardshipproject.org/morefarmers/farmtransitiontools
[6] http://landstewardshipproject.org/morefarmers/fbotherregions
[7] http://www.law.drake.edu/clinicsCenters/agLaw/docs/forumRoundUp-TheFarmLASTSProjectFarmLandAccessSuccessionTenureStewardship.pdf
[8] http://www.virtualgrange.org/
[10] http://www.workaway.info/
[11] See section above on local self-organization for details.
[12] See section above on local self-organization for details.
[13] Case Study “The Glue that Can’t Unglue: The Hardin Family”
Individual qualities of resilient systems
VI: Increasing Physical Infrastructure
Is your soil quality increasing? Is your on-farm storage capacity increasing? Is your irrigation capacity increasing? Are you gradually accumulating more processing equipment?
Introduction and caveat
Ecologically resilient systems accumulate physical infrastructure. All such systems encourage the growth of individual plants and animals and development of deeper soils with more organic matter. All this growth, crucial to a resilient farm, result from a quality of resilient systems which always seeks to increase physical infrastructure. However, the system is also continuously recycling used infrastructure and sometimes disposing of nearly all physical infrastructure in the release or omega phase of the adaptive cycle. As with the other qualities of resilience, this quality had dual natures. Each counteracts the other to enable resilience. However, this quality is unique because the release, recycling or disposing of physical infrastructure is accomplished by the growth of physical infrastructure of other systems. A resilient forest depends on the growth of trees, but it also depends on the recycling of dead trees. When a tree dies, fungi colonize the corpse, grow and eventually turn the entire physical infrastructure of the tree into soil. The physical infrastructure of the tree is transformed into the physical infrastructure of the fungi and then into the physical infrastructure of the soil, enabling growth of more trees in the future.
So, we can refer to this quality as “increasing physical infrastructure” as long as we keep in mind that a particular infrastructure is disposable when warranted by the needs of the larger system. Resilient systems are not hoarders and do not become attached to transient physical structures. With those caveats, let’s explore this unique quality of resilient systems
First and always remember: all your physical infrastructure is filtered through and effected by you. A particular piece of physical infrastructure for one person is a burden for another. A processing facility, irrigation reservoir, ax, computer or draft horse can be a valuable tool if you know how to use and maintain it, but just costly and useless if you do not. Increasing resilience requires first understanding, maintaining and improving your most important asset: yourself.
Psychological researchers, independent of ecological resilience research, have generated many useful insights on how to improve your personal resilience. They have studied it under a variety of terms including psychological resilience, emotional resilience, resourcefulness, grit, and mental toughness.
The foundation of all personal resilience is adaptability. We are all susceptible to the opposite: locking into particular states. For instance, we can become locked into depression, a quite stable condition, impervious to all attempts to change it. On a more subtle level, the mind has a tendency to lock into one of several alternative interpretations of reality. Optical illusions are well-known examples. In the adjacent image, seeing a  young woman or older lady simultaneously is virtually impossible. Instead, we snap to one of several interpretations. Unfortunately this happens not just in interpretation of pictures, but in more much more complex theories and world views. Scientists are often faced with this problem in their work. They have a tendency to unconsciously select and magnify phenomena that fall into harmony with the theory while unconsciously neglecting and ignoring contradictory phenomena. The same mechanism may play a role in ideology of all kinds, from political to religious beliefs.
Locking into a particular mode, from which it may be difficult to break free, serves a valuable purpose when faced with a predator or enemy where your options are limited to fight or flight. Whichever you choose, you should go for it completely. Don’t fight half-heartedly or flee slowly. Hormonal (adrenocortical) stress response leads to a positive feedback mechanism which escalates fight or flight behavior and offers a better chance of survival than hesitating between different modes of action.[1] Resilience outside fight or flight situations is enhanced by the ability to resist being locked into any standard mode of reaction.
Emmy Werner was one of the first psychologists to use the term resilience. She studied a cohort of children from Kauai, Hawaii. Kauai was quite poor and many of the children in the study grew up with alcoholic or mentally ill parents. Many of the parents were also out of work. Werner noted that of the children who grew up in these very bad situations, two-thirds exhibited destructive behaviors in their later teen years, such as chronic unemployment, substance abuse, and teenage pregnancies. However one-third of these youngsters did not exhibit destructive behaviors. Werner called the latter group 'resilient'. In contrast to their peers, these resilient children were bright, outgoing, had positive self-concepts; had close bonds with an emotionally stable parent; and received support from their peers. [2]
Personal resilience has been intensively studied in children. Numerous studies have shown that some practices that parents utilized help promote resilience within families. These include frequent displays of warmth, affection, emotional support; reasonable expectations for children combined with straightforward, not overly harsh discipline; family routines and celebrations; and the maintenance of common values regarding money and leisure.[3] The primary factor conditioning personal resilience is having positive relationships inside or outside one’s family. These positive relationships include traits such as mutual, reciprocal support and caring.
Positive emotions and resilience are highly related. Maintaining positive emotions while facing adversity promotes flexibility in thinking and problem solving. Positive emotions serve an important function in their ability to help an individual recover from stressful experiences and encounters. It also facilitates adaptive coping, builds enduring social resources, and increases personal well-being.[4]
Grit is the aspect of personal resilience which refers to the perseverance and passion for long term goals. People with high levels of grit work persistently towards challenges and maintain effort and interest over years despite negative feedback, adversity, plateaus in progress, or failure. High grit people view accomplishments as a marathon rather than an immediate goal.[5]
10 Ways to Build Resilience. A summary of the research on achieving personal resilience is provided by the American Psychological Association as "10 Ways to Build Resilience":
- Make connections. Good relationships with close family members, friends or others are important. Accepting help and support from those who care about you and will listen to you strengthens resilience. Some people find that being active in civic groups, faith-based organizations, or other local groups provides social support and can help with reclaiming hope. Assisting others in their time of need also can benefit the helper.
- Avoid seeing crises as insurmountable problems. You can't change the fact that highly stressful events happen, but you can change how you interpret and respond to these events. Try looking beyond the present to how future circumstances may be a little better. Note any subtle ways in which you might already feel somewhat better as you deal with difficult situations.
- Accept that change is a part of living. Certain goals may no longer be attainable as a result of adverse situations. Accepting circumstances that cannot be changed can help you focus on circumstances that you can alter.
- Move toward your goals. Develop some realistic goals. Do something regularly — even if it seems like a small accomplishment — that enables you to move toward your goals. Instead of focusing on tasks that seem unachievable, ask yourself, "What's one thing I know I can accomplish today that helps me move in the direction I want to go?"
- Take decisive actions, rather than detaching completely from problems and stresses and wishing they would just go away. Act on adverse situations as much as you can.
- Look for opportunities for self-discovery. People often learn something about themselves and may find that they have grown in some respect as a result of their struggle with loss. Many people who have experienced tragedies and hardship have reported better relationships, greater sense of strength even while feeling vulnerable, increased sense of self-worth, a more developed spirituality and heightened appreciation for life.
- Nurture a positive view of yourself. Developing confidence in your ability to solve problems and trusting your instincts helps build resilience.
- Keep things in perspective. Even when facing very painful events, try to consider the stressful situation in a broader context and keep a long-term perspective. Avoid blowing the event out of proportion.
- Maintain a hopeful outlook. An optimistic outlook enables you to expect that good things will happen in your life. Try visualizing what you want, rather than worrying about what you fear.
- Take care of yourself. Pay attention to your own needs and feelings. Engage in activities that you enjoy and find relaxing. Exercise regularly. Taking care of yourself helps to keep your mind and body primed to deal with situations that require resilience.[6]
By enhancing your personal resilience you become the central infrastructure needed to enhance the resilience of your system. But like all infrastructure which contributes to resilience, you are not static, you continually accumulate and refine new skills. You are adaptive and flexible, able to see opportunities you didn’t see before, and opportunities which didn’t exist earlier. By leveraging your imagination and willingness to remain flexible depending on what you discover to be your best options, you are more empowered to reach out to your community to bring them in as key infrastructural components in your evolving systems. No enterprise, whether a farm, an empire or a thriving business has ever been created in isolation by one person. The stereotypical image of the independent farmer, doing all the work on their land is flat wrong. (See the discussion on modular connectivity for details.)
Developing a strategy for increasing physical infrastructure. To help you strategize your approach and determine some of your first steps in building your physical infrastructure, it is helpful to know what stage of development your system is in. In Chapter 1 we covered the adaptive cycle that governs ecological systems and stimulates growth and renewal. The cycle urges us to be dynamic and strategize our systems so we can thrive from where we are, leveraging our current condition. There are four stages within this cycle and in order to determine how to build your physical infrastructure, we must consider which of those four stages you’re currently in. To better build your physical infrastructure, consider to following question(s) and suggestions as you assess your own stage of development:
What stage of the adaptive cycle is my system in?
K Phase (Conservation) - Are you inheriting an old farm with lots of equipment, land and tools? Are you entering into a working agreement with others who have accumulated equipment, land and tools?
If you’re in this phase, you may be burdened by your physical infrastructure and would benefit more from selling some and reorganizing with the infusion of cash. Or, you have the opportunity to organize your farm plan around your existing physical infrastructure.
The biggest rule of thumb for those in the K phase is not to be limited by existing physical infrastructure. If you inherit a dairy farm but only have experience and interest in vegetables, consider selling your equipment and investing in appropriate tools for that instead. Similarly, if you inherit 1000 acres but only plan to develop 500, the existing equipment may be larger than you need. There can be long learning curbs to operating a new business, do you have the time and resources to make the required mistakes?
Ω Phase (Omega, or, Release) – Are you starting from the figurative “square one”? Do you consider yourself a kind of “army of one”? Are you pretty confident that the only physical infrastructure you have is, perhaps, this book?
If you’re in the Omega phase, don’t fret! The world is your oyster and you’re free to choose your path to development. There are many paths to building physical infrastructure in the form of loans, grants, donations, cooperative purchasing and so on.
The biggest rule of thumb for this phase is to be imaginative. If you think there is only one way to accumulate physical infrastructure, you’re simply wrong. You will benefit greatly from the sections on Modular Connectivity and Local Organizing as guides to building your network and subsequently your resources and opportunities.
α Phase (Reorganization) - Are you established in your community with lots of valuable, though diverse, connections? Have you developed a few ideas or plans for new enterprises but haven’t chosen which to pursue yet? Do you have access to a variety of valuable, though largely unrelated, tools and opportunities?
If you find yourself in this phase, your biggest obstacle and opportunity is to narrow your options. To develop thriving systems we encourage you to build in complementary diversity, but at this stage it will benefit you most to choose what you’re most passionate about and most prepared for.
It is easy to say “I can do it all! I have all these great connections and opportunities!” This approach, though noble and theoretically possible, can lead to burn out and slow development of your ideal business model. When we narrow our options down to one, or just a few, we increase the amount of time and energy we can direct towards developing those plans.
The biggest rule of thumb for this phase is to choose passion and feasibility over idealism and grandiosity. As exciting as it may be to build an empire, it begins with a single structure, built with great intention.
r Phase (Growth) – Do you have your business plan developed? Is that plan being shared with financial advisors or members of your community? Have you received either financial or community support for your plan? Are you seeing the first stages of growth in your business?
If you are in this phase it is important to be specific about your investments, taking adequate time for research and inquiry about the best tools for your current capacity. This is a vital stage where your investments can be well suited, or a burden. Whether you’re taking out loans, receiving grant money, channeling donations from your community or however you’re making your investments it is up to you to make your choices scale appropriate at this stage.
The biggest rule of thumb for this phase is to research, research, and research! And remember, if you make an investment and you find that it is not suited to your scale, you can likely re-sell your equipment and reinvest.
The key here is that every stage of the adaptive cycle has obstacles and opportunities directly linked to them. Depending on what stage you’re in will influence which infrastructure to develop.
Maintenance of infrastructure is crucial no matter what phase a system is in. Following is an example from our experience with successes and failure of water infrastructure in rural Africa.
Resilient food systems all depend on the key physical infrastructure of resilient water supply systems. In poor rural areas of Africa donor agencies and NGOs have spent hundreds of millions of dollars digging wells that become useless because they are not maintained or fixed when they break down. As a result, 150,000 water supply points are not functioning across rural Africa. Only one third of water points built by NGOs in Senegal's Kaolack region are working and 58% of water points in northern Ghana are in disrepair.[7]
The charity members feel good about leaving a fine physical infrastructure of a pump and a deep well for a rural community who had no water. However, unless they also invested in developing local capacity to maintain the pump they have not increased the resilience of the community.
Where NGOs train local people in well and pump maintenance and the local community pays modest water fees which go to the well maintenance person, water supply systems are much more likely to be maintained.
In Lubango, Angola, a small town water utility maintains handpumps in surrounding villages for a fee. The company has maintained handpumps in the rural and peri-urban areas surrounding the town since 1990. Each family pays US$0.40 per month to the pump caretaker, half of which was for the caretaker's salary and the rest to the company. The estimated annual revenue per handpump was $240 versus annual costs of $150 for salary, spare parts, unforeseen repairs, and future investment.[8] A number of other system designs have also worked. The commonality is rewarding local maintenance with income from water usage.
Land
How can you improve your land’s abilities and vitality? The fields and furrows that make up your land are filled to the brim with communities of organisms, large and small, that have been building soils and developing the plant and animal diversity all around us. Due to genetic adaptation generation after generation, through changing ecosystems and climates, species have developed beneficial relationships and unique qualities that are key to growing your soil infrastructure. These organisms ought to be your first choice as co-workers in developing vital and resilient soils as discussed in the complementary diversity and ecological integration sections.
Heightened water retention of soils leads to drought resistance. Greater plant and animal diversity can help to lower overall management demands as the flora and fauna naturally manage their own populations and pests. Soil erosion is better managed as plant roots and mycorrhizal root systems with incredible tensile strength per square inch literally hold soil together. Avoid degradation of resource by, for example, decreasing pollutants from accidental or intentional pesticide use by filtering irrigation water before it reaches the water table.
Simple tests are available to evaluate soils of land you have or may want to acquire. The following box give is a seven dimension soil test you can do to rank the quality of any soil.[9] The only tool you need for this test is a shovel. Just turn over a shovel full of soil about 8 inches deep. Observe the soil you turn over and adjacent ground for these seven indicators.
|
|
Poor soil quality |
Good soil quality |
|
Soil workability |
Waxiness, water puddling, slow drying after rain, cloddy, compacted |
Workable under wide range of moisture levels, flaky and crumbly |
|
Compaction |
Hardpan at less than 8 in. |
No or deep hardpan |
|
Cracking |
Wide cracks (2-3 in.) |
No cracks |
|
Topsoil depth |
2-3 inches |
12 inches and up |
|
Texture |
High clay or high sand |
Clay loam, silt loam |
|
Color |
Gray or light colored |
Brownish black |
|
Roots |
No roots in top 6 inches |
Many roots extended below tillage layer, many feeder roots |
To better understand the state of your soils, some benefits can result from soil tests available by sending soil samples to University or private laboratories. When choosing a laboratory you want to make sure that it covers all the items you intend to measure and whether or not they are prepared to give you any recommendations for soil amendment.
Here are some sample questions that will help guide you in asking the right questions to yield the answers you’re looking for:
- What analysis does your laboratory offer?
- What does it cost?
- How long will it take to get my results?
- This can be important depending on when you’re planning to plant your crops as applied fertilizer will need time to integrate into the soil.
- Does the company participate in the North American Laboratory Proficiency Program? If so, how has your performance been?
- Though you may have resistance to asking the question, it is worth your time to do it. The program sets standards for testing and quality assurance aiding in consistency and quality products. Depending on where the recommendation comes from for a laboratory that doesn’t participate, don’t let this be a deal breaker.
Soil testing can give useful data, but don’t take it for gospel and don’t blindly follow the advice of any laboratory. The best test of soil quality are the response of plants. As you get to know how plants grow on a particular plot, you will be able to deduce what the soil needs.
If you are working with a limited budget, do what you can and make your amendments balanced. Instead of forgoing or partially spreading the most expensive, take your recommendations and reduce them equally.
To distribute your recommended fertilizers, the ideal method is to first evenly distribute them into compost which is then spread over the fields. This helps to hold the nutrients and minerals in the soil as the humus that comprises compost, made of microorganisms and mycelia, attract and bond to the positively and negatively charged fertilizers.
By remineralizing your soil, crops will have greater pest resistance, longer shelf life due to lower moisture retention and for edible crops they will attain a more complex flavor that reflects the heightened nutrients and trace minerals in your soil. This is better for profits, as well as for the health of those who consume your products. Over the past 60 years our fruits and vegetables have delivered less and less nutrient to consumers resulting in higher health care costs and the necessity to eat more fruits and vegetables to receive the same health benefits.
Carbon sequestration, soil organic matter and carbon markets.
The quality of your soil which makes it most resilient—the levels of carbon (or organic matter) stored or sequestered in the soil—only occurs when carbon dioxide is taken out of the air. No soils start out with much organic matter. This is because soil parent materials come from rock. Little organic matter survives the temperatures, pressures, and other disturbances which turn rock into soil parent material. Once a parent material comes to rest and plants begin to grow, by photosynthesis of carbon dioxide, organic matter starts to accumulate.
The two major natural variables which affect how much organic matter accumulates in a soil are temperature and moisture. Temperature affects organic matter accumulation in two ways. First, plants tend to grow faster and produce more total mass as temperatures increase. Everybody’s mental image of a tropical rain forest involves lush, thick vegetation. Secondly, however, and usually overcoming the first point is that, as temperatures increase, microbial activity, including the activity of decomposing microorganisms, also increases. Given your mental picture of a tropical rain forest, you might be surprised to find relatively little organic matter persisting in the soils of the forest floor. Microbial activity is just too intense to allow organic matter to accumulate.
Moisture is more straightforward in its effect on soil organic matter. As rainfall increases, total plant production of organic matter increases, and so soil organic matter increases. In the continental United States, east of the Rocky Mountains, the general trend is that soil organic matter content increases from west to east (low rainfall to high rainfall) and from south to north (high temperatures to low temperatures).
There are many factors which modify these trends. When water accumulates to a degree that the soil is flooded for long periods of the year, as in swamps or bogs, the excess water produces a shortage of oxygen which the decomposing bacteria need for their work. As a consequence, organic matter builds up regardless of the temperature, until the swamp is drained by natural or human causes. These locations are the source of peat available in garden stores.
Humans have been changing soil organic matter long before modern agriculture began. American Indians and other aboriginals set fires to decrease forests and increase grasslands for the animals they hunted. These huge herds eating, manuring, trampling manure into the soil and then rotating to new pastures led to prairie soils as high as 6% organic matter. Then came the plow. Tillage opens up more of the soil to oxygen and increases microorganism breakdown of organic matter, at least temporarily. Within just a few years, organic matter content of a tilled soil can decrease to half of what it was in its previous prairie state. Managing a cropped soil with less disturbance, by reducing tillage or using perennial crops, will allow the organic matter content to rise. Returning the land to pasture and recreating large herds of rotationally grazing animals can bring it back to or above the level of a native grassland.
It may surprise you to learn that forest nearly always has less soil organic material than grasslands in a similar climactic zone. As the following graphic shows, grassland soil profiles contain about twice as much organic matter more uniformly distributed through the profile than forest soils under similar environmental conditions. Of course the forest also has carbon fixed as part of its roots and trunks.
Worldwide about 1500 Gigatons (Gt) of carbon are stored in the soil, while Earth’s plants store about 560 Gt, with wood in trees being the largest faction. The atmosphere holds about 750 Gt of carbon, mostly as carbon dioxide.
Increasing organic matter in soils by developing grasslands and then developing forests on the grasslands gradually through silvopasture (grazing livestock under trees, see ecological integration section) sequesters the most carbon of any agricultural system.
Increasing organic matter in your soil makes your soil asset more valuable. Some are trying to help farmers get paid for sequestering that carbon. Sequestering carbon in the soil has the potential to offset all the carbon being released by industries as carbon dioxide. Carbon markets have developed so that those sequestering carbon can be paid by those producing it. The most well-known are the cap and trade systems. In these, a cap is placed on emissions and companies given permits to produce only a set amount which decreases yearly. If they don’t meet the requirement, they must buy permits (called carbon financial instruments or CFIs in the US).[10] If approved, farmers can be issued CFIs for sequestering carbon and industries may buy them. The program depends on a huge non-locally controlled infrastructure to operate, so making the case for its resilience is difficult. However, if you’re interested in resilience, we’re sure you’ve heard about carbon markets and now you know what they are.
This section is meant to impress upon you the value of your land, and particularly your soil assets while providing methods for measuring the condition of your soil and land assets. We encourage you to explore the following chapter on Working with Nature to take a closer look at how to build your soils and your ecosystem with a summary of practices and additional resources.
|
The top 10 states losing farmland between 2007 and 2012: |
|
1. Kentucky, 6.7 percent |
|
2. Alaska 5.4 percent |
|
3. Georgia 5.2 percent |
|
4. Mississippi 4.6 percent |
|
5. Wisconsin 4.1 percent |
|
6. Minnesota 3.2 percent |
|
7. Montana 2.65 percent |
|
8. Missouri 2.61 percent |
|
9. Louisiana 2.57 percent |
|
10. New Jersey 2.5 percent |
|
Source: 2012 Census of Agriculture |
On Land Transfer: Good agricultural land is a basic asset for healthy food production. A resilient agriculture and food system insures that farmland is saved and maintained. Collapsing systems let farmland become degraded or convert it to other uses. Many extremely rural states are experiencing losses of farmland as shown in the table. Some of them have programs to counter this trend. The first farmland preservation program was enacted in Suffolk County, Long Island, NY in 1974. In the 40 years since, 18 states[11] and scores of counties and cities have begun programs. The links below[12] will help you how you can help in farmland preservation. We hope you contribute to resilience on a larger scale by becoming active in such efforts in your area.
Simply preserving farmland is not sufficient to make this asset available to farmers. More resilient systems will ensure that farmland is transferred to new farmers who will maintain and enhance the land. The age of farmers in the US (averaging close to 60 years old), the lack of interest of many of their children in farming, and the extremely high value of farmland has made land transfer to new farmers crucial to resilient systems.
If you are searching for land, have land you’d like to make available or are interested in assisting in land transfer in other ways, become familiar with the many innovative strategies for land transfer.[13]
One commonality among successful land transfers is a strong and positive relationship between the owner and the new farmer. Whether the transfer is between relatives or friends, good will, a shared mission, or common faith in a solid business plan, these are the foundations for successful land transfer. Below we highlight two of the innumerable examples of innovative land transfer to illustrate the breadth of systems which can contribute to this aspect of resilience:
One couple in Washington State didn’t want their farm to become yet another residential development but didn’t have children who wanted to farm. They gave a former intern the opportunity to farm their land. They retained rights to live on the land and carried the note on the property themselves. The former intern is making monthly payments which pay for the former owners’ retirement.
Cuyahoga Valley National Park (CVNP) in Ohio leases public land to new farmers. The farmer is competitively awarded a long-term lease of a proposed site only after powerfully articulating his or her plan to manage and farm that site through the entire term of the lease. These farms are expected to be managed with only sustainable farming practices and the farmers are required to positively interact with CVNP visitors. To date there are 10 farms with two more to be leased in 2015. A farmers market helps facilitate their success. The farms range in size from 5-60 acres and include production of eggs, vegetables, intensive grazing and integrated crop-livestock operations. Farming practices are monitored for sustainability. Leases are granted for 60 years.
We’ve seen dozens of successful transfers of land to new farmers. They all begin with networking by new farmers and retiring farmers, feature the development of mutual respect, progress through good lawyers and end up with results which meet the goals of both sides.
The asset of land is not unattainable. Older people all across the country have land they would like to pass on to a younger farmer. They just need to meet the right young farmer.
Water Infrastructure. Every farmer knows what an asset water is to successful production. The common factor in all living organisms, water is perhaps our greatest asset and is often abused, overlooked, or used in excess. In agriculture there are many approaches to maintaining water quantity and quality through harvesting methods, capture, and soil composition. A farmer in one of our case studies in Tennessee[14] doesn’t irrigate his fields at all. His crops, surrounded by forest, and primarily on Tennessee mountain tops have such diversity of microorganisms and density of organic matter that he simply doesn’t need to irrigate. True, during the driest part of the summer his yields may be lower than his irrigating neighbors but his infrastructure costs and demands on the water table are remarkably lower. Similarly, a farmer in Texas[15] relies solely on water catchment to operate a dry gardening CSA, devising methods for both capturing, holding and distributing efficiently.
Water Catchment Systems. Coming in a variety of forms, water catchment can be as simple or complex as you’re willing to make it. For some it may be most practical to dig a pond, serving both as a mini ecosystem and a large pool of water with its own nutrient cycles that feed your plants. For others the construction or installation of a water cistern for rainwater catchment may be most economical.
Pond Construction: If you’re considering constructing a pond, look at your land and consider your existing soil structure. If your soil is mostly sandy, or loam, with will be challenging to simply dig a pond that will hold water effectively and you may be forced to line the pond with costly rubber liner. Though effective it is an additional cost to consider. There are vendors[16] that can help you determine pricing help you with pond pumps and other equipment you’ll need to maintain moving water in the pond.
If, rather, your soil is more clay the odds are good that your pond will successfully hold water in a short time. Whether it’s red or gray clay as excavators dig your pond they should compact the clay before they’re done, helping to seal up any holes that may remain. For a few days after you will likely see bubbles form as air pockets below fill with water.
Overflow from heavy rains must be dealt with. An overflow pump, more passive gravel or cement overflow, or a combination drain and overflow pipe with emergency spillway are all options for good management. If possible, place the drainpipe on the pond bottom so you can completely drain the pond. Controlling the water level is important for weed control and fisheries management. A drain is necessary to manage the pond efficiently. The overflow pipe is the outlet for normal water flow through the pond. The emergency spillway is an area lower than the top of the dam on one side of the dam to safely release excessive runoff from heavy rainfall.
Determine pond size by your needs and desires. Bigger is not always better. Small ponds (1 to 3 acres) provide irrigation and fishing if you follow good planning and management guidelines. Larger ponds and lakes are more suited to water supply for irrigation, and they are less susceptible to water level changes. For surface runoff ponds, use the area of land that flows into the pond to determine the pond’s size. In general, 5 to 10 acres of drainage area is required for each surface acre of pond water.
For more information on pond building reach out to your local extension agent or contact local excavators. The capabilities of your land for holding water can be tricky to determine, so get input from those experienced with land similar to yours.
Rainwater Catchment: Whether you use a cisterns, terracing or the increase of soil organic matter as a method for rainwater catchment, each has its strengths and weaknesses. Cistern use is mostly seen in urban areas with expansive rooftops and high grey water needs from city dwellers. Around the world aid organizations have been working to harvest rainwater for landscaping, grey water and emergency drinking water. On small to mid-scale agriculture rainwater can play a role for animals and plants alike, depending on how much roof space you have for catchment.
Different approaches have been taken to water cisterns==from pre-formed plastic containers to the construction of cement cisterns. They can be simple or complex, large or small depending on your needs and desires. This tactic has been used in arid regions of the world for thousands of years and many of those cisterns are still in use today.
Lancaster[17] suggests 8 principles for successful rainwater harvesting. He suggests that it takes the inclusion of all 8 principles to develop a successful and long lasting system that will generate the kind of results you’re looking for.
- Begin with long and thoughtful observation.
Use all your senses to see where the water flows and how. What is working, what is not? Build on what works. - Start at the top (highpoint) of your watershed and work your way down.
Water travels downhill, so collect water at your high points for more immediate infiltration and easy gravity-fed distribution. Start at the top where there is less volume and velocity of water. - Start small and simple.
Work at the human scale so you can build and repair everything. Many small strategies are far more effective than one big one when you are trying to infiltrate water into the soil. - Slow, spread, and infiltrate the flow of water.
Rather than having water run erosively off the land’s surface, encourage it to stick around, “walk” around, and infiltrate into the soil. Slow it, spread it, sink it. - Always plan an overflow route, and manage that overflow as a resource.
Always have an overflow route for the water in times of extra heavy rains, and where possible, use the overflow as a resource. - Maximize living and organic groundcover.
Create a living sponge so the harvested water is used to create more resources, while the soil’s ability to infiltrate and hold water steadily improves. - Maximize beneficial relationships and efficiency by “stacking functions.”
Get your water harvesting strategies to do more than hold water. Berms can double as high-and-dry raised paths. Plantings can be placed to cool buildings in summer. Vegetation can be selected to provide food.
8. Continually reassess your system: the “feedback loop.”
Observe how your work affects the site, beginning again with the first principle. Make any needed changes, using the principles to guide you.
Building are crucial infrastructure. Perhaps you have an old barn on your property that 100 years ago was a fantastic asset serving multiple functions. Maybe it even appears to be structurally sound. Consider though, are you using that space? Is it actually structurally sound? Would you be better off selling the wood to one of many companies that reclaim aged barn wood for art and other purposes? Would be better off investing into a new space that serves the needs and functions of your growing business, like a clean room for mushroom cultivation, or a milking area for dairy cattle. Sometimes retrofitting and renovation is a viable option and sometimes it’s not.
Machines and Equipment. The size of your operation, intentions for the future and available funding will inevitably be the biggest contributor to your machine and equipment infrastructure.
Self-assessment of the increasing physical infrastructure quality of resilience. If you’ve read this chapter, we’re sure you can generate numerous questions to assess the strength of this factor on your farm. They should be similar to the following:
- Is your soil quality increasing?
- ↑Organic matter, ↓erosion
- Is your on-farm storage capacity increasing?
- grain bins
- coolers
- Is your irrigation capacity increasing?
- reservoirs, equipment
- Are you gradually accumulating more processing equipment?
- grain dryers,
- vegetable graders
- grain mills
- packaging lines
Secondary database analysis of increasing physical infrastructure quality. Based on one single appropriate variable available at a county-level (change in farm machinery value from 2007 to 2012 according to the USDA Agricultural Census, we made the estimates of strength of this factor in all Southern states.
|
States ranked by % of counties in highest quartile on increase in farm machinery value (Infrastructure) |
|||
|
Infrastructure |
Overall SRI |
State |
% |
|
1 |
6 |
Louisiana |
45.2 |
|
2 |
2 |
North Carolina |
33.0 |
|
3 |
5 |
Florida |
32.8 |
|
4 |
11 |
Texas |
28.7 |
|
5 |
13 |
Mississippi |
26.8 |
|
6 |
9 |
Georgia |
23.3 |
|
7 |
8 |
Arkansas |
22.7 |
|
8 |
10 |
Oklahoma |
22.1 |
|
9 |
1 |
Virginia |
21.4 |
|
10 |
12 |
Alabama |
20.9 |
|
11 |
4 |
South Carolina |
19.6 |
|
12 |
3 |
Kentucky |
16.7 |
|
13 |
7 |
Tennessee |
12.6 |
The box above shows state by state comparison of the only available county-level measure of increasing physical infrastructure (ISI). This measure differentiates little between the states. Louisiana does stand out with a much higher percentage of counties in the highest quartile compared to any other state.
The ranking of Tennessee, Kentucky, Virginia and South Carolina in the lowest tier is also noteworthy, since their overall SRI scores are much nearer the top. Of the top ranked states on overall SRI, only North Carolina and Florida ranked highly on this measure of ISI.
Summary
One of the most important aspects that defines physical infrastructure or an asset is its ability to maintain value into the future. In ecosystems, which we aim to mimic in our designs, assets are built year by year in the form of trees, soil and biological activity all holding onto nutrients and moisture. Trees and soil composition don’t arrive all at once and neither should all your assets. It is through the slow, progressive and persistent accumulation of truly valuable assets that we become more resilient.
As the best speaker we’ve ever heard on farm equipment said: “bootstrap it as long as you can so that you can find out what you really need instead of buying a lot of things you think you need.”
What will remain truly valuable to you in the future? What investments (like tractors or processing machines) will hold their market value in the event you need to sell your equipment and scale up? Similarly, if you decide to build a structure on your property, say a barn or utility shed, bear in mind that you may sell that property in the future to move onto something bigger. Design not only for the now, design for the future and for those that come after you. It is our ability to plan for the future, building structures that last, that we move towards securing the kind of lasting systems that resilience demands.
Though this topic is covered in depth in the locally self-organized and modular connectivity sections, we should note here that community is invaluable infrastructure, whether it’s your local community of friends and neighbors who share equipment and labor, a regional network of marketing contacts or a national community of practitioners from whom you get inspiration and ideas. It’s important to realize too that your community also contains you. How can you become an asset to your community? What can you contribute in return? Communities are made up of people with feelings, schedules, limitations and opinions, to increase the value of this asset, we must be sensitive and generous while not hesitating to ask for help in return.
Citations on increasing physical infrastructure
[1] Scheffer, M., F. Westley and W. Brock. 2003. Slow response of societies to new problems, causes and costs. Ecosystems 6:493–502.
[2] Eerner, E., & Smith, R. S., 1992. Overcoming the odds: high risk children from birth to adulthood. Ithaca, NY: Cornell University Press.
[3] Cauce, Ana Mari; Stewart, Angela; Rodriguez, Melanie D.; Cochran, Bryan; Ginzler, Joshua, 2003. Overcoming the Odds? Adolescent Development in the Context of Urban Poverty, pp. 343–391 in Suniya S. Luthar (ed.), Resilience and Vulnerability: Adaptation in the Context of Childhood Adversities. Cambridge: Cambridge University Press, ISBN 0521001617.
[4] Tugade, M.M, Fredrickson, B.L. Resilient individuals use positive emotions to bounce back from negative emotional experiences. Journal of Personality and Social Psychology. 2004; 86:320–333.
[5] Duckworth, A.L.; Peterson, C.; Matthews, M.D.; Kelly, D.R., 2007.Grit: perseverance and passion for long-term goals. J Pers Soc Psychol 92: 11087–1101. doi:10.1037/0022-3514.92.6.1087.
[6] http://www.apa.org/helpcenter/road-resilience.aspx
[7] Ffor details see http://pubs.iied.org/pdfs/17055IIED.pdf.
[8] For details see http://www.ircwash.org/sites/default/files/Beers-2001-Leasing.pdf.
[9] This method was developed by University of Missouri Extension and is widely used.
[10] https://www.theice.com/publicdocs/ccx/CCX_Offset_Registry_Program_Manual.pdf
[11] DE, MD, PA, VT, NY, NJ, CA, MA, CT, RI, VA, WV, OH, MI, NC, ME, NM & WI.
[12] http://ageconsearch.umn.edu/bitstream/19102/1/co98co01.pdf; http://www.farmlandpreservationreport.com/; http://www.farmland.org/actioncenter/no-farms-no-food/7-ways-to-save-farmland.asp; http://www.farmlandinfo.org/sites/default/files/fp_toolbox_02-2008_1.pdf
[13] http://farmlink.cascadeharvest.org/sites/default/files/u15/Farmland%20Changing%20Hands.pdf and http://www.youngfarmers.org/reports/conservation2.0.pdf
[14] Jeff Poppen, AKA, The Barefoot Farmer : http://barefootfarmer.org/
[15] Tim Miller of Millberg Farms, http://www.texasyoungfarmers.org/tim-miller-teaches-dry-gardening-all-around-excellence/
[16] Pond Accessories Vendor: http://www.conservationtechnology.com/pond.html
[17] Lancaster, B. 2015. Harvesting Rainwater for Drylands and Beyond. http://www.harvestingrainwater.com/
Individual qualities of resilient systems
VII: The Edge of Chaos--Conservative Innovation
Creativity is the ability to introduce order into the randomness of nature.[1]
Evolution is like a game, but a distinctive one in which the only payoff is to stay in the game. Persistence comes from flexibility, not maximizing efficiency or a particular output.[2]
In times of drastic change, it is the learners who inherit the future. The learned usually find themselves beautifully equipped to live in a world that no longer exists.[3]
Do you take advice from more than one source? Do you test out new practices to see how valuable they are? Do you ask others about your time tested practices? Do you look to the experts of the past as well as those in the present? Do you take time to weigh novel suggestions against practices you know work well?
Introduction
Artists, writers, and visionaries have said that creativity is a profound expression of humanity.[4] While that may be, creativity isn’t limited to humanity alone. Innovation is at the root of ecological processes. In the non-human natural world, we know innovation under the name of evolution.
One parable of evolution is known as the gene for gene hypothesis. In 1956, Flor observed that when flax developed a resistance to the agricultural rust Malampsora lini, the rust in turn evolved and overcame flax’s resistance. Flor theorized that a host organism has a gene controlling its resistance to a pathogen. A pathogen has a corresponding gene that controls its ability to overcome a host organism’s resistance. When a host organism’s genes evolve, the dependent pathogen’s genes evolve in response to survive.[5] This is coevolution. In co-evolution, organisms that are mutually dependent on each other also mutually shape each other as they adapt to changes in their environment. [6]
However, innovation travels hand-in-hand with its complement, conservation. Conservation is maintaining the established knowledge of past traditions. If innovation is incorporating new ideas and practices into a system, then conservation is what tempers those ideas and makes them applicable to the situation. For example, a farmer might decide to grow a crop that her peers aren’t growing in order to tap into a new market. However, the farmer’s success depends on his or her knowledge of the plant itself, on how well-suited the crop is to the area, and whether the demand for the crop is enough to support the cost of its production. In order to be beneficial, the farmer’s creativity must be informed by practical knowledge. Like innovation, conservation is a law of nature. In the case of the gene for gene hypothesis, the rust gene for pathogenicity co-evolved with the flax gene. Through evolution, organisms tailor themselves to their specific environments and situations. In a nutshell, co-evolution is informed innovation.
Conservation and innovation can contribute to a system or farm’s resilience. But without the presence of both, the two can also cause trouble. The key questions of conservative innovation in resilience are: How can innovation and conservation complement each other? How does an innovation spread? And how is conservative innovation shaping the resilience of local food systems today?
To look at conservative innovation in Southern local food systems, we conducted both quantitative and qualitative research. In our qualitative research, we interviewed over 30 farmers, vendors, processors, and farmer’s market managers. This helped us define conservative innovation and develop an in-depth understanding of how it affects local food enterprises. Throughout this section, we use examples from these interviews to illustrate how conservative innovation might look in practice.
As a farmer, food vendor, chef, or consumer reading this chapter, consider how conservative innovation applies in your enterprise, community, and food sources.
Adaptation in Complex Systems. An important distinction here is the difference between innovation and transformation. In the ecological resilience literature, innovation is also known as adaptation. Adaptation is here defined as “the capacity of actors in a system to influence resilience.” [7] An adaptation is an incremental change. Its effects can be important, but ultimately its reach is limited. In a later chapter we discuss transformation. Transformation is a system-wide reaction to a strong disturbance.[8] The line between adaptation and transformation isn’t always clear cut. Some changes may be adaptations at some scales and transformational at others.[9] We separate the two to differentiate between the mild adjustments used to make a system more flexible and the overarching, ground-shaking transformations that come after a wave of system-wide disturbance. However, both disturbance and adaptation take place within complex adaptive systems.
Complex adaptive systems are not deterministic. No one can predict the trajectory of any particular system. As a result, it is impossible to predict the future or even the past of a complex adaptive system.[10] This is because such systems flirt with chaos. Chaos (multiple, conflicting, uncontrolled impulses) helps generate innovation, which in turn shape the course of a system. Usually the word “system” brings to mind organization and repetition. However, systems resort to chaos when they face a problem that their normal processes can’t solve. Or, more elegantly put, “the edge of chaos is actually where complex systems go in order to solve a complex task.”[11]
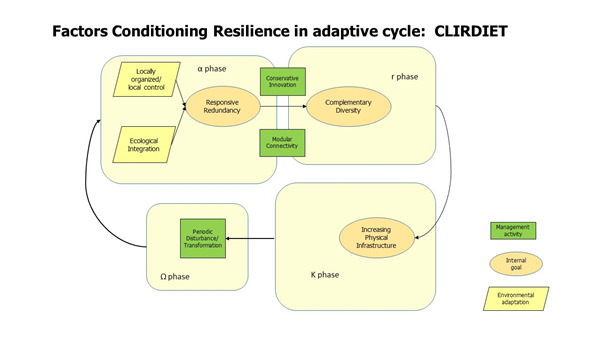
Relationships of the eight qualities of resilient systems. Note that innovation causes the alpha phase to transition to the r phase and system wide innovation (transformation) causes the omega or release phase which is required for the system to enter the alpha or reorganization phase.
Innovation isn’t usually a goal in and of itself. Instead, it’s used as a tool in the face of new challenges. The chart in figure 1 depicts the relationship between conservative innovation and other aspects of resilience. Conservative innovation is a “management activity” used to achieve desired outcomes. As the chart shows, conservative innovation is perhaps most heavily used between the α (reorganization) and r (growth) phases. Although arguably conservative innovation is present at all stages of the adaptive cycle, it is primarily in times of crisis that a complex system will turn to the fringes of chaos for answers. When the system experiences disturbances, its usual patterns and technologies are no longer the best fit for the situation. In order to create a new “normal,” the system will need to adapt.
Adaptation requires flexibility. When we first drafted the hypothesis of the eight causal factors of resilience, the original name for this factor was conservative flexibility. While “innovation” trumped “flexibility” as the more intuitive name in the end, flexibility is perhaps most apt to describe how appropriate adaptation occurs. In order for an innovation to become widespread, it must be relatively easy to re-invent in ways that adapt it to differing circumstances.[12] In other words, the innovation must be flexible. Genrich S. Altschuller, in a 1960s Soviet Navy patent, discovered something similar when he compiled his own theory of innovation (known as TRIZ) after sorting through thousands of patents. He categorized solution-oriented innovations into four levels. What he found was that the vast majority of innovations are actually adaptations (Levels 1-3, 95 percent) made to existing systems and technologies.[13] [14] That is, the innovations were flexible enough to adapt to new situations and problems.
|
Level |
Description |
Percent of Innovations (%) |
|
1 |
Common design flaws addressed by well-known methods. No innovation. |
32 |
|
2 |
Small improvements to existing technologies/systems addressed by well-known methods. |
45 |
|
3 |
Major improvements to existing technologies/systems addressed by lesser-known methods. |
18 |
|
4 |
Development of new technologies/systems to replace problematic old technologies/systems. |
4 |
|
5 |
Discovery of new phenomena or creation of a new system. |
1 |
Anshultz's categorization of patents regarding innovation.
Lessons from ecology show how different innovations are better suited to different environments. Plants largely propagate themselves in one of two ways: by resprouting from existing tissue (perennials) and by sending out seeds (annuals). Although both types might be present in any given climate, resprouting is especially prevalent in moist and fertile areas that are less prone to forest fire, such as rainforests and colder climates. Resprouting has advantages over seedlings in these areas because the aboveground portion of the plant can regenerate more rapidly. Seedlings, on the other hand, tend to survive better than resprouting plants in areas with a lot of disturbance, such as forest fires. Though it is difficult for both types of plants to survive arid climates, seeding plants tend to endure better, especially considering reduced competition from resprouting stems. Though each method of reproduction has a complex evolutionary history, and both are often present in an ecosystem. However, in each case plants adopted one of these two types of reproduction in response to their environments.[15]
In one of our case studies on socio-ecological resilience and local food systems, we came across a group of young urban farmers who launched a community garden:
Their initial goal was to improve fresh food access in “food deserts,” or places that “lack access to affordable fruits, vegetables, whole grains, low-fat milk, and other foods that make up the full range of a healthy diet.” [16] One innovation that has become a popular approach to addressing food deserts is community gardening.[17] The young farmers found a plot of unused land nestled in the middle of one of the city’s poorer neighborhoods and obtained permission to turn it into a community garden.
The results of the garden are mixed. The farmers hoped that the neighborhood’s inhabitants would see their work, become interested, and eventually take over. Though a few from the community have shown interest in the produce, very few have asked to help out in the garden. As time went on, most of the young farmers that started the project lost interest, and now only one member does most of the labor and managing of the garden. This does not, however, mean that the surrounding community doesn’t benefit from the produce. In fact, much of the harvestable produce is taken by passersby. On the one hand, then, the garden is succeeding in improving fresh food access in the neighborhood.
On the other hand, the garden work has not been taken on by the community as the young farmers initially planned. As a result, the one farmer who the bulk of the work has fallen to is discouraged by the disappearance of its harvest. The garden is now essentially run as a non-profit urban farm. The lone young farmer managing it sells the remaining produce at a weekly farmer’s market, and he is considering putting a fence around the garden to prevent loss and damage. Though community gardens are being applied in cities across the country as a way to ease food deserts, not all are fully successful. In this particular case, none of the young farmers who started the garden lived in the neighborhood where the garden was started. Though the last farmer standing has developed some relationships with the passersby he sees daily, he is not a part of the community. Having leadership from within the neighborhood itself can increase the chances of a garden’s success and sense of community.[18] Although most of the young farmers are from the same city as the neighborhood’s inhabitants, they occupy a different demographic and have limited ties to the neighborhood itself. This is an example of innovation applied without full understanding of the surrounding (social) ecology. When talking about socio-ecological systems, the spread and success of an innovation is a largely social process.
In this case the farmers who constructed the garden missed out on the conservative value of innovation, acting without sufficient consultation or understanding of the area. How often are solutions made by outsiders who don’t fully understand the local problems? When it comes to conservation, or innovation, it requires parts of local self-organization as well to harbor local sensitivity and feedback for the future. How would you have addressed this city garden differently?
The Spread of Innovation. Innovation and its spread has been looked at in many ways. In his influential work on innovation, E.M. Rodgers talks about the “diffusion,” or spread, of innovations.[19] Whether or not a technology qualifies as an innovation depends on how recently it has been introduced and how widely it has been adopted. The success of an innovation’s diffusion is a social question. It depends on whether it has ultimately been accepted or rejected by a community. According to diffusion theory, there are four main stages a successful innovation goes through. Each stage is defined by the portion of the population in a given place that have adopted the innovation.
The theory divides any group of people adopting an innovation into innovators, early adopters, early majority, and late majority.
Innovators are the very first adopters. They are in the first lines of testing out a new idea or technology—and as such, they usually take big risks. Aside from the financial, ecological, or material risks of trying something new, innovators also take a big social risk by venturing outside of the norm. Some of these risks pay off—and many don’t. Due to the risk innovators accept, we might categorize this first group as extremely high on innovation, but low on conservation.
The second group of adopters is known as early adopters. The early adopters often achieve optimal conservative innovation for resilience. Ideally, an early adopter will watch and observe as the innovator introduces a new idea or technology and deals with its consequences. Having witnessed the first trials, the early adopter can then apply lessons learned by the innovator. Early adopters take on an innovation while it’s still new enough to give an advantage over competition, but temper it with the lessons learned from the innovator’s risks.
The last two groups to adopt an innovation are the late adopters and the “laggards.” In classical diffusion theory, the line between early adopters and late adopters marks a shift in the majority of the population. When over 50 percent of a population has adopted an innovation, the next most recent adopters are on the late side. Late adopters and laggards are potentially high on conservation, but failed to take advantage of the incoming innovation while it could still provide fresh edge.
Early Adoption: A Case Study. One case of an early adopter we came across in our research is Laughing Stock Farms of Sheridan, Arkansas. Though the farm is both small and young, it succeeds by applying relatively new ideas in geographically appropriate ways. It draws on traditional farming knowledge to enhance the success of adopted innovations and to mold them to the region.
Laughing Stock is an example of conservative innovation applied. Josh Hardin, Laughing Stock’s founder and manager, is a fifth-generation farmer. He grew up working on his father’s farm and from there has gone on to higher education in agriculture. While studying in California, Josh met farmers who were growing new crops in new ways. He became interested in sustainable and organic agriculture. Now on his own single acre in rural Arkansas, Josh is applying lessons he learned from innovators in California to make a living as a small farmer. Laughing Stock Farms, though small and young, is a very early adopter of sustainable agriculture practices in Central Arkansas. It is also an early adopter of smaller practices under the umbrella of sustainable agriculture.
Josh combines his knowledge of Arkansas’s agriculture, ecology, and market with innovations he witnessed on the West Coast. Many of the innovations Laughing Stock adopts are tailored to its small scale. With such limited time, labor, and land, Josh makes sure that the crops produced have a high value. He invested in organic certification for his land and sells locally to high-end chefs and grocery outlets. Many of the crops are in and of themselves high value, such as turmeric, goji berries, and heritage breeds. Though Josh sells some conventional items, like tomatoes, he has found that using hoops houses allows him to start growing and harvesting tomatoes earlier in the year than neighboring farms, raising the value of the product. In order to cope with organic practices and limited labor, Josh has made other innovations to his farm as well, such as an irrigation pump that draws out of a nearby pond, tying tomato plants up with strings instead of stakes, and intercropping. Though Josh gets creative with his farm, his knowledge of the land and the market are forms of conservation.
The Hardin family is well-known throughout Arkansas as an exemplary farm family. Josh, a fifth-generation farmer, moved to his father Randy’s farm when he was a teenager and began learning the trade. Although Randy Hardin’s many enterprises have often focused on selling locally, he uses conventional agriculture practices, such as the application of pesticides and growing GM crops. This farm is where Josh learned about agriculture, and he continues to devote part of each week to his father’s farm. Though Josh supports the principles of sustainable agriculture and thinks it’s a financially smart route for Laughing Stock, he believes that conventional agriculture has been the backbone of modern society, and that it will have an important role to play until we are able to figure out how to feed whole populations on local and sustainable models.
Josh also continues to seek agricultural knowledge. While managing Laughing Stock and working on his father’s farm, Josh is finishing up a degree in agroecology in order to teach agriculture down the road. He also keeps in touch with friends on the West Coast, where new trends in health and food hit the market sooner than they do in Arkansas. Maintaining connections to other farmers, both locally and nationally, has been crucial to Laughing Stock’s success.
Laughing Stock uses social networks to spur on innovation. Through local connections, Josh is able to keep an eye on what the market needs are in his area and develop relationship with other farmers, vendors, and restaurateurs. In maintaining connections on the West Coast, Josh is also able to see new trends before they hit the market and be ready to supply as demand hits Arkansas. Though Josh is one of the first in his immediate area to adopt new innovations, he usually does not play the role of innovator himself. By watching innovations succeed or fail on the West Coast, Josh gets a feel for how it might play out in Arkansas without taking on as much risk. For this reason, we categorize Josh as an early adopter. By maintaining strong local connections, Josh also minimizes his chances of being ostracized, a social risk most innovators take. Laughing Stock requires both conventional knowledge of the region and some creativity. However, applying moderation to the “edge of chaos” can be difficult—especially in agriculture.
Conservative Innovation in Agriculture
There has been an enormous amount of past research on innovation in agriculture. The introduction of new agricultural technologies initiated several revolutions in the way societies operate, from the initial displacement of hunting and gathering through the cotton gin to genetically modified organisms. Agricultural innovation is a “combined technological, social, economic and institutional change.”[20] New innovations in agriculture profoundly affect society at large.
Like ecological innovation, agricultural innovation is a co-evolutionary process. It shapes not only food supply, but land change, technological demands, and society itself. These things, in turn, shape agriculture—sometimes for the worse.[21] In the twentieth century, agricultural innovations walked hand-in-hand with a decrease in crop diversity. Up until recently, practices like seed saving and seed exchanges ensured genetic diversity in crop production. However, in the 1980s and 1990s, intellectual property instruments grew stricter. Seed saving and exchanging nearly disappeared. Studies in the Midwest showed that the loss of diversity over time was linked to lowered productivity. [22] Only recently have farmers in the Midwest and Great Plains area turned back to crop diversification as a method of mitigating the effects of climate change.[23]
In the face of wicked problems like climate change, there is more need than ever for “a concept of innovation backed by an incentive system that yields agricultural sustainability.”[24] To make an agricultural system resilient, then, any innovation (or conservation) should be weighed by both its long-term and far-reaching effects. This is easier said than done. Research on agricultural innovation has suggested some new methods for problem-solving with agricultural innovations. In the past, most agricultural innovation studies focused almost exclusively on the latest technological fix. However, applying the latest technology without thinking through its effects on the broader system often just generates new problems.[25]
More recently, scholars have started to use system-based approaches to think about agricultural innovation. As the name implies, systems-based thinking considers how a new innovation affects not only the farm it’s introduced to, but also how it affects the ecology of the land, the nearby community, and the broader agricultural system. Though this approach is still less popular, it continues to garner more attention.[26] One such approach to system-based assessment of agricultural innovations is System Dynamics Modeling (SDM). SDM takes five steps to approach systemic livelihood issues:
- Articulate the problem.
- Develop a “dynamic hypothesis” about what might be causing problems.
- Create a simulation model of the situation.
- Test the hypothesis on the model.
- Use the validated model to assess the potential impacts of intervention possibilities.[27]
SDM was successfully tested on agricultural livelihood issues of small farmers in the Harar Highlands of Ethiopia. This model is a practical approach for solving problems on a farm system because it lets the examiner look the situation in all of its complexity. SDM assumes a complex, non-linear system that is not in a state of equilibrium.
As systems approaches emphasize, “new” is not always good. Often the revolutions that agricultural innovations bring have a mix of positive and negative consequences. Some scholars have argued that sedentary sustenance agriculture led to social stratification.[28] Eli Whitney’s invention of the cotton gin set the stage for increased social division between the North and South, and eventually the Civil War.[29] GMOs are at the heart of the raging modern controversy over agriculture.[30] [31] On a smaller scale, individual farms and food enterprises consistently fail or harm their surroundings by adopting innovations inappropriate to their situation. The key to a successful innovation is making the existing system interact more successfully with the complex adaptive systems which determine whether it survives and prospers.[32]
Failed Conservation, Failed Innovation
Though innovation poses many risks, pure conservation can have equally bad consequences. However, conservation itself is necessary for resilience. The main purpose of conservation is the efficient use of resources. A farmer, for example, is limited in time, money, workers, and land. By sticking to tried and true traditions, the farmer has a pretty reliable estimate as to what he can produce given those constraints. Introducing a new technology or a new way of doing things on the farm puts the farmer’s limited and precious resources at risk. People become locked into doing things a certain way over and over again for the sake of efficiency. [33] Efficiency, overall, is a positive and necessary trait for an enterprise with limited resources.
For example, many species have adopted innate survival mechanisms for the sake of efficiency. Our “innate” behaviors, such as eating, chewing, breathing, and crying when distressed, are unconscious motions that allow us to move through life with a much higher chance of survival. If we had to learn how to do these things, or think about them every time we did them, the daily task of survival would become a whole lot harder. Efficiency, or keeping up what you already know works, is a critical practice.
That being said, when efficiency stands in the way of flexibility, it can hurt our ability to be resilient in the face of new challenges. Efficiency only equips us to deal with situations we’ve already encountered. In agriculture, we are facing a slew of new challenges arising from climate change and globalization. Economic and ecological structures are changing. Efficiency is no longer enough.
When the desire for efficiency stops us from adapting to new situations, it becomes a “rigidity trap.” [34] Practices that used to be efficient may not fit the new situation. The rigidity trap can lure farmers, entrepreneurs, and even whole organizations into using up all of their potential resources when going about “business as usual.”
Even systems that are stuck in a rigidity trap are able to get out, but it takes some extra effort. Although individuals within a system may be able to change a properly functioning system, when a system becomes stuck in a rigidity trap, individuals alone are too weak to completely fix it. It will take strong, innovative leaders to rally individual strength together and break the rigidity trap.[35] Since smaller systems are more malleable than large, steady systems, it will be easier to leave the rigidity trap on your own farm than to overhaul all the rigidity traps of our current agricultural system. However, every farm that escapes the rigidity trap moves the general population forward. In terms of adopting innovations, we could also say that every early adopter of a new way of thinking about agriculture contributes to winning over the early majority, the late majority, and even the laggards. The emergence of a thought shift in Oxford, Mississippi illustrates the relationship between conservation and innovation, and the perils of conservation without innovation and lack of conservation in innovation.
The Peril of Conservation without Innovation: A Case Study. Oxford is a college town, and like many college towns, it has a thriving food scene. The city also prides itself as a cultural hub of the South, and as such it draws food connoisseurs and top chefs. The result is an expensive, sophisticated culture where food is a luxury to be invested in. However, Oxford has another face, one less visible to the outside world. It harbors immense poverty. The local middle school has a 50 percent poverty rate. In order to serve the diverse populace of Oxford, two separate farmer’s markets have appeared.
The first of the two was Mid-Town Farmer’s Market. The Mid-Town Farmer’s Market has more or less held the same group of farmers for the better part of its existence. It generally does not accept new vendors, and it sticks to a very traditional model. For instance, it has turned down vendors who hoped to sell shares in a Community Supported Agriculture (CSA) model rather than directly selling produce. In 2011, when the City of Oxford accepted a grant of $61,258 from the U.S. Department of Agriculture, the money was supposed to transform Mid-Town’s vending system into one that could accept EBT and WIC. Allegedly, Mid-Town turned down the money and the changes. However, the grant still needed to go toward a farmer’s market, and so Oxford City Market was born.
For all the ways that Mid-Town has remained loyal to its original model and vendors, Oxford City Market (OCM) tries new approaches. OCM is a city-run farmer’s market, which means that its main organizer is a city employee. The market aspires to generate enough revenue to pay for its own organizer, but it’s still a young enterprise. The main goal of OCM is inclusion. OCM accepts as many farmers as it can make space for, even ones that sell the same goods. It also used additional grant money to create an alternative way of paying farmers. Instead of customers paying farmers directly, customers buy wooden tokens worth varying amounts of money at the main desk, and then spend the tokens at each booth. This allows all farmers to accept payment from customers using WIC and EBT, even though not every farmer has the capacity to process EBT and WIC cards at their stand. OCM also reaches out in multiple venues with multiple languages to attract new customers. The whole philosophy that OCM takes—that farmer’s markets should actively work toward inclusion—inspires a new, innovative approach to selling fresh food.
There are some benefits and pitfalls to each approach. Mid-Town is consistent and self-sufficient. The famers allowed to sell there are not allowed to sell competing goods, which helps their own profits. However, the market does not serve most farmers in the area, and customers only have one price option for each good since farmers can’t compete with each other. OCM, on the other hand, is trying to serve as many farmers and customers as possible. Farmers in this market can compete with each other by selling the same good, but not all farmers are in favor of that. Due to both its youth and its quest for inclusivity, OCM is a lot less stable than Mid-Town. It does not yet have its own land to use each week and it also isn’t financially self-sustaining yet.
The two markets illustrate what we mean by innovation and conservation. OCM embraces all of the latest innovations in farmer’s market-style vending. It tries to incorporate many farmers with unique products, it reaches out to customer that traditionally weren’t wealthy enough to spend their money at the farmer’s market, and it’s designed a method of payment where all farmers can accept payment from EBT- and WIC-using customers. However, it struggles to find stability, and some of its experiments have failed. Mid-Town, on the other hand, takes an ultra-conservative approach. It is extremely stable, but it is also resistant to change. It relies on a small group of farmers and a small, though wealthy, base of customers. Should any one of these things change (as they are bound to), the whole market will suffer.
OCM is certainly taking a lot of risks, but it would also appear that Mid-Town Market has fallen into a rigidity trap. Its system is extremely financially predictable, which has enabled Mid-Town Market to become its own independent entity with a consistent location. However, this “efficiency” may be preventing the market from considering new approaches. Rigidity prevents it from expanding its base of vendors or customers. As the dynamics of Oxford inevitably shift, Mid-Town may struggle to adapt to its new environment.
How can we tell the difference between efficiency and a “rigidity trap”? Where do conservation and innovation meet? We define successful conservative innovation as a trait that doesn’t hamper any of the other components of socio-ecological resilience—connectivity, local organization, asset building, backups, complementary diversity, ecological integration, and periodic transformation. Making sure both conservation and innovation are allowing for the other seven components to flourish, however, is a task in and of itself. It requires feedback. [36]
Feedback: What’s really going on in the system? Feedback is when one part of a system talks to another part of the system. It allows farmers, entrepreneurs, farmer’s market managers, etcetera to see how well their business or system is working. Ecological and social systems alike use feedback to test which of its innovations are the best for the system. [37] Feedback is most accurate when multiple pieces of the system are involved in the communication process.[38] Innovation is almost always a learning process, explored by trial and error. With any new innovation, there are bound to be errors. Feedback mechanisms are an efficient way to explore those errors and correct them.
Critically, feedback is characteristic of a non-linear, complex system. As shown by the complex adaptive systems model, socio-ecological systems are anything but simple. Non-linear systems occur when information from different steps in the process are looped back to earlier parts. Though they may reduce efficiency in the short term, when information channels double back they increase the long-term likelihood of the innovation to be beneficial on a wide scale. Feedback is a cooperative social process.[39]
Social Networks: The Spread of Ideas
The spread of ideas—old and new—is a social phenomenon. The social and cultural context in which an idea takes place heavily shapes whether the idea is adopted. [40] Actually, whether or not an idea is an “innovation or not depends on its context. According to classic diffusion theory, “if an innovation is an idea that is perceived as new, this boundary between innovations ought to be determined by the potential adopters who do the perceiving.”[41] That is to say, what might be considered an “innovation” in rural Arkansas might be old hat on the West Coast.
Ideas use people as a mode of transport. In our case study with Josh Hardin, many of the ideas he’s attempting in Arkansas come from his connections on the West Coast. We saw this illustrated again in another case study we conducted with Sequatchie Cove Farm just outside of Chattanooga, Tennessee. Bill Keener, Sequatchie Cove’s founder, is widely credited as one of the pioneers of Chattanooga’s thriving local food movement. However, when he began farming, he became acquainted with cutting-edge sustainable farming thinkers like Joel Salatin. He implemented ideas that the leaders of the movement had already done and brought them to Chattanooga. What might not be news to Joel Salatin may well be news to a small city in Tennessee. In ecology, innovation spreads physically, through genetics and reproduction. However, people don’t necessarily have to wait generations to adapt. It’s a question of being connected in the right ways.
Some types of social connections contribute to a flexible mindset, and others detract from it. There’s a difference between how “bonding capital” (strong ties) and “bridging capital” (new social ties) affect the diffusion on idea. A tightly-knit small town where everyone knows each other is a good example of strong ties. Strong ties create a web of support that makes the risk-taking of innovation less dangerous.[42] On the other hand, it may also create an environment where there is a greater penalty for stepping outside what’s considered normal or traditional. There’s more social risk in innovation when strong ties are at stake. [43] Weak ties are also a mixed bag. Weak ties usually refer to loose connections, such as meeting several new people at a conference from different places. Finding new weak ties allows people with different backgrounds to swap ideas (innovations) freely.[44] The down side is that weak ties may also result in miscommunication. [45] Social networks are probably best set up for conservative innovation when there’s a mixture of strong and weak ties present. Innovations travel more fluidly on weak ties, but strong ties are necessary to give them the support they need to take root.
Thanks to this, pushing an innovation past the elusive “tipping point” relies on the art of persuasion. In Rodgers’s original model, the tipping point is the line on the graph between early majority and late majority (each comprised of 34 percent of the population).[46] As an innovation gains the momentum of the majority, some of the initial barriers can be overcome and it can diffuse more rapidly. To make something diffuse rapidly and successfully is the goal of all marketing strategy. It’s no mystery why Malcom Gladwell’s 2000 book “The Tipping Point”, which claims that making an innovation widespread depends on three key principles, sold over 2 million copies. Successful innovation involves some social psychology savvy.
But it isn’t enough for innovations to travel between individual farmers (although that’s certainly a good place to start). In order for substantial agricultural innovations to succeed on a large scale, they also need to have support at an institutional level. [47] Horizontal diffusion, or “scaling out”, is what happens when peers communicate ideas and innovations to others working at the same levels as them. Vertical diffusion, or “scaling up”, refers to how innovations can spread through different levels of hierarchy within a system. Both are important to the success of an innovation. [48] Scaling out is seen when farmers from different places and social groups make connections. This allows an idea or innovation to cross over social and geographic boundaries. Scaling up requires the pioneers on the ground (in this case, farmers) to communicate their ideas to overarching agencies and policymakers that affect them. For example, a farmer might communicate his/her idea to extension agents, who then share their ideas with university researchers, who in turn influence policymakers. Ideally, the result is small changes in infrastructure that help the farmer’s innovation succeed.
Some farmers take scaling up into their own hands when existing policy becomes frustrating. A group of small farmers in Mississippi is frustrated that Mississippi policy only allows independent farmers to have a thousand fowls at a time, though most states have a limit of 20,000. Beaver Dam Farms, in Starkville, is spearheading farmer advocacy to change the law. Beaver Dam finds its own innovation limited by the current policy. The farm primarily produces chickens and tomatoes, using the chicken manure as fertilizer for the tomatoes. They produce at a very small scale and without chemicals or manufactured fertilizers. However, the current fowl limit restricts their ability to grow the operation, which may be necessary to help the farm keep turning a profit. While advocacy is a root many innovative farmers turn to, a good system will actively provide venues for farmers to give feedback.
One of the main agents providing feedback will be institutional entrepreneurs. Many studies examine how entrepreneurship is related to creativity. There is less research on the impact entrepreneurs have on the broader system(s) they live in. Institutional entrepreneurs are people who use their social networks to spread innovations across scales. One of their key abilities is using social ties to move ideas upward in the hierarchy. [49] If systems change their policies to support an innovation, then it will be less socially and financially risky for independent farmer to adopt that innovation. The more boundaries and layers an innovation is able to cross, the more likely it is to succeed, and the greater its impact will be. [50]
Successful conservative innovation demands attention to many intricate components. One scholar boiled the recipe for conservative innovation in agriculture down to three key ingredients:
- That the innovation is compatible with the rest of a farm’s goals, equipment, and practices;
- That the innovation and its implementation is supported by social networks, cultural norms, and support networks; and
- That the innovation is appropriately supported by regulations from regional institutions.[51]
These guidelines address innovation occurring at multiple scales. The first addresses the farm scale, the second the broader community scale, and the final addresses the overarching institutional scale. Whichever scale you participate in, conservative innovation can be a lived practice.
Conservative Innovation as a Practice: Honing Your Skills
Conservative innovation is a critical trait of a resilient enterprise or system. The questions we posed at the beginning of the chapter can help you gauge how your farm stacks up on conservative innovation and decide where improvements can be made.
Have you made major innovations on your farm in the last year?
Is creativity important on your farm?
Do you regularly try new things to make your farm work better?
The above questions get at the heart of innovation. If you say yes to these questions, you’re probably one of the more innovative members of your community. Think back on which innovations have failed and which have succeeded. What were the consequences, positive and negative? What would you have done differently, if anything?
Do you maintain tried and true traditional practices?
Are you willing to alter your practices in the face of unforeseen challenges? If you aren’t willing to change your practices, why?
Options: finances, organic standards, tradition, unsure of other options
Innovation can be a very positive thing, but it must be tempered by conservation in order to be practical. Even if you ultimately choose an innovation over “tried and true” practices, traditional methods usually have a valuable lesson to teach about the local ecology and culture. Answering yes to the first question probably means you’re (also) practicing conservation. The second question is more ambiguous. Ultimately, staying flexible in the face of challenges is a mark of resilience. However, some farmers are very loyal to the values that inspire them to farm in the first place. For instance, many organic farmers we interviewed said that if they couldn’t grow without manufactured chemicals, they’d rather no farm at all. Consider your own values. At what point does flexibility stop for you?
Do you have lots of options for pest control?
Do you have lots of options for fertility of crops?
Keeping your options open is ideal for flexibility. If you’re saying yes to these questions, then you’re able to keep both innovative methods and conservative methods on hand as necessary. A farm can use multiple methods to manage factors like pests and fertility. Just because a new method may work for now doesn’t mean it will always work effectively. Having conservative methods available as well is a reliable backup.
Do you go to at least 4 trainings or seminars a year?
Seminars and trainings help farmers learn about innovations in their field. Perhaps even more importantly, they give farmers the opportunity to meet and exchange ideas, techniques, and tips. They also build connections between farmers who otherwise might not have met. “Weak” ties, or meeting new people, is crucial to the spread of ideas.
Have you changed your marketing strategy in the past year?
Do you use creative marketing strategies to promote your products?
Which of the following do you use for marketing?
Options: Facebook, Twitter, website, other internet resource
Marketing is a good way to incorporate more innovation into a business. Thanks to the Internet, trying out new ways of marketing can be very financially low-risk. Social media accounts and even websites can be cheap or free, and dramatically effective.
Do you look for ways to add value to your products?
Do you look for alternative markets for lower-grade or damaged products?
Do you look for holes in the market to fill?
Do you try to bring unusual things to the market?
Are you creating your own market?
Trying out new products involves a little more risk, but it can also be extremely rewarding. A small-scale farmer in Arkansas discovered that he could sell amaranth, which grows abundantly on his farm, by calling it “hot-weather quinoa.” He noticed both the local demand for quinoa and how well amaranth grows in the area, and combined the two. The unusual item he brings to market has been an asset to the farm. There are endless ways to get creative with the type of products you could grow, or even with the products you are already growing by getting resourceful.
Have you ever felt stifled by regulations? If so, how did you respond?
Options: Changed tracks, stopped activity, used creativity to work around regulations
While most of the above questions deal with changes you can make directly to your farm, this one asks how the agricultural system and policies where you live affect your ability to innovate. Most innovators and early adopters, since they are culturally ahead of the curve, run into regulations that haven’t yet made room for a new idea or technology. How can you give feedback to your local representatives? What changes would better support you as a resilient farmer?
Conclusion
As social ecosystems composed of competing and cooperating complex adaptive systems, every farm, community, and institution will need to make unique adjustments to ensure that conservative innovation is successful on all scales. No innovation is “one size fits all”; it can be molded to every unique situation based on traditional local knowledge.
Policy is one area where innovation is often stifled, but you can be conservatively innovative and change policy. Get active in changing policy to make it more conducive to resilience. In order for policy to be supportive of adaptations, it must provide room for flexibility. Talk to your local National Resource Conservation Service agent and other USDA employees, submit comments on emerging agricultural policies, engage with farm advocacy organizations, and make sure to contribute to the policymaking process. Conservative innovation is a social process which operates all at scales in resilient systems.
Citations on conservative innovation
[1] Eric Hoffer, 1973, Reflections on the Human Condition
[2] Slobodkin, L.B., 1964. The strategy of evolution. American Scientist, 52:342-357.
[3] Eric Hoffer, ibid.
[4] http://worldbooksdownloads.com/it/Explaining-Creativity-The-Science-of-Human-Innovation/p1295300958/
[5] http://www.annualreviews.org/doi/abs/10.1146/annurev.py.09.090171.001423?journalCode=phyto
[6] http://www.annualreviews.org/doi/abs/10.1146/annurev.py.09.090171.001423?journalCode=phyto
[7] p. 2, ftp://131.252.97.79/Transfer/WetlandsES/Articles/walker_04_socio-ecology_resilience.pdf
[8] http://www.pnas.org/content/109/19/7156.full
[9] http://www.pnas.org/content/109/19/7156.full
[10] https://www.innovation.cc/peer-reviewed/rogers-adaptivesystem7finalv10i3a3.pdf
[11] P. 313, http://www.researchbooks.org/0671872346/COMPLEXITY-EMERGING-SCIENCE-EDGE-ORDER/
[12] P. 7, https://www.innovation.cc/peer-reviewed/rogers-adaptivesystem7finalv10i3a3.pdf
[13] http://www.triz.org/triz/levels
[14] http://ir.uiowa.edu/etd/233/
[15] http://www.uv.es/jgpausas/papers/Pausas-Keeley-2014-NewPhytol_resprouting-seeding-model.pdf
[16] http://www.cdc.gov/Features/FoodDeserts/
[18] http://www.sciencedirect.com/science/article/pii/S1353829209000598
[19] http://books.google.com/books/about/Diffusion_of_Innovations_5th_Edition.html?id=9U1K5LjUOwEC
[20] http://www.cascape.info/phocadownload/2014/2012_klerkxetal.pdf , p. 458.
[21] http://www.cascape.info/phocadownload/2014/2012_klerkxetal.pdf , p. 458.
[22] http://www.tandfonline.com/doi/full/10.1080/14735903.2013.806408
[23] http://www.ecologyandsociety.org/vol19/iss3/art45/
[24] P. 74, http://www.tandfonline.com/doi/full/10.1080/14735903.2013.806408
[25] http://www.sciencedirect.com/science/article/pii/S0261219413002950
[26] http://www.sciencedirect.com/science/article/pii/S0261219413002950
[27] Kassa, H., & Gibbon, D. (2006, May). Does The Sustainable Livelihood Approach Need A More Explicit Systems Perspective? Systems Dynamics Modeling To Facilitate Entry Points To Smallholder Farming Systems. In 17th International Farming Systems Association Symposium (17-20, November, 2002), Lake Buena Vista, Florida.
[28] http://isite.lps.org/cmorgan/web/documents/WorstMistake_000.pdf
[29] http://dash.harvard.edu/bitstream/handle/1/3207344/Beckert_EmancipationEmpire.pdf?sequence=2
[30] http://www.environmentandsociety.org/sites/default/files/key_docs/ev_17no.1_carolan_michael_s.pdf
[31] http://www.tandfonline.com/doi/full/10.1080/14735903.2013.806408
[32] http://www.cascape.info/phocadownload/2014/2012_klerkxetal.pdf
[33] http://www.pmss2012.dei.polimi.it/materials/Sheffer_Westley_2008.pdf
[35] http://www.pmss2012.dei.polimi.it/materials/Sheffer_Westley_2008.pdf
[36] http://www.cascape.info/phocadownload/2014/2012_klerkxetal.pdf
[37] http://www.santafe.edu/media/workingpapers/98-01-014.pdf
[38] ftp://ftp.ige.unicamp.br/pub/CT010/aula%202/KlineRosenberg%281986%29.pdf
[39] ftp://ftp.ige.unicamp.br/pub/CT010/aula%202/KlineRosenberg%281986%29.pdf
[40] http://lib.dr.iastate.edu/cgi/viewcontent.cgi?article=1010&context=nrem_pubs&sei-redir=1&referer=http%3A%2F%2Fscholar.google.com%2Fscholar%3Fhl%3Den%26q%3Datwell%2B2008%2Binnovation%26btnG%3D%26as_sdt%3D1%252C4%26as_sdtp%3D#search=%22atwell%202008%20innovation%22
[41] p. 14, http://books.google.com/books/about/Diffusion_of_Innovations_5th_Edition.html?id=9U1K5LjUOwEC
[42] http://www.nature.com/nature/journal/v457/n7228/full/nature07532.html
[43] http://c.ymcdn.com/sites/www.plexusinstitute.org/resource/collection/5FD4ACEF-7B50-4388-A93E-109B0988049F/Moore-Westley-SurmountableChasms-2011.pdf
[44] http://www.nature.com/nature/journal/v457/n7228/full/nature07532.html
[45] http://pubs.cogs.indiana.edu/pubspdf/24837/24837_innovationnetworks.pdf
[46] http://books.google.com/books/about/Diffusion_of_Innovations_5th_Edition.html?id=9U1K5LjUOwEC
[47] http://c.ymcdn.com/sites/www.plexusinstitute.org/resource/collection/5FD4ACEF-7B50-4388-A93E-109B0988049F/Moore-Westley-SurmountableChasms-2011.pdf
[48] http://c.ymcdn.com/sites/www.plexusinstitute.org/resource/collection/5FD4ACEF-7B50-4388-A93E-109B0988049F/Moore-Westley-SurmountableChasms-2011.pdf
[49] http://c.ymcdn.com/sites/www.plexusinstitute.org/resource/collection/5FD4ACEF-7B50-4388-A93E-109B0988049F/Moore-Westley-SurmountableChasms-2011.pdf
[50] http://lib.dr.iastate.edu/cgi/viewcontent.cgi?article=1010&context=nrem_pubs&sei-redir=1&referer=http%3A%2F%2Fscholar.google.com%2Fscholar%3Fhl%3Den%26q%3Datwell%2B2008%2Binnovation%26btnG%3D%26as_sdt%3D1%252C4%26as_sdtp%3D#search=%22atwell%202008%20innovation%22
[51] http://lib.dr.iastate.edu/cgi/viewcontent.cgi?article=1010&context=nrem_pubs&sei-redir=1&referer=http%3A%2F%2Fscholar.google.com%2Fscholar%3Fhl%3Den%26q%3Datwell%2B2008%2Binnovation%26btnG%3D%26as_sdt%3D1%252C4%26as_sdtp%3D#search=%22atwell%202008%20innovation%22
Individual qualities of resilient systems
VIII: Embracing Disturbance for Periodic Transformation
Sometimes brick walls need to be torn down and turned into foundations.
After any man has been the boss for ten years he should fire himself, no matter how good he is at his job.
It is the very nature of life to strive to continue in being. Since this continuance can be secured only by constant renewals, life is a self-renewing process.[1]
Practice resurrection.[2]
Where did life come from? No one knows, but all indications are that the astounding diversity of life on our planet arose through a series of transformations as organisms adapted and innovated to respond to the living and nonliving forces around them. Punctuated equilibrium researchers [3] have amassed an amazing amount of evidence showing that all living systems arose through emergent transformation.
It’s easy to see how adaptation and innovation are crucial to survival and resilience. Less obvious is that an innovation at one scale is a vast transformation at a lower scale. Transformation at a lower scale is often required for any system to be resilient. At any given scale, however, transformation can be required for resilience. Our task here is to explore the quality of resilient systems which enable them to transform themselves: “the capacity to create a fundamentally new system when ecological, economic, or social structures make the existing system untenable.”[4]
In learning the crucial factors conditioning resilience, you have probably noticed how integral transformation is to resilient systems. The change and adaptation needed to meet disturbances from weather to disease to new predators will often have emergent and transformative qualities. In fact, within every factor of resilience lies transformation as a subtle or predominant force. Transformation is key to developing new relationships when exercising modular connectivity. Transformation is the result of the unique organizations that emerges from locally self-organized systems as individuals determine what the greater whole will look like. To become ecologically integrated, working with nature, requires a monumental transformation in our conception of agriculture, a massive transformation of practices and ideas. When practicing conservative innovation, systems can create radical innovations which transform their entire systems. When building infrastructure, redundancy and backups, the system is building enough reserves to weather most disturbances and provides the foundation for transformation in the face of others.
This chapter will illustrate the transformation process in both Nature and man’s social ecological systems and how we can harness this piece of the resilience puzzle.
In all resilient systems, death is renewal
So often we perceive change as a kind of death or end, something to be mourned and prevented for as long as possible. What does this mean for resilience as we delay our transformations? We can take lessons from natural systems in the butterfly, the mushroom and fungi, as well as seeing what happens when a thicket is left to mature for too long without interruption from fire or flood.
In this case the thicket that has never been thinned by a disturbance develops into a thick, dense stand of small trees all combating for light, stunted in their growth. Many smaller trees perish in the struggle to reach light and find nutrients. One day in the heat of summer as all the moisture has been wicked up by these hungry trees, a fire erupts in a neighboring prairie. Soon this fire reaches the edge of the thicket, quickly bursting into a massive forest fire as the small trees are quick to ignite. What trees remain are surrounded by extreme decimation, many seeds latent in the ground have been destroyed due to the extreme heat from such dense growth. This extreme disturbance triggered by a lack of transformation results in the exposed soil eroding in the next rainfall, potentially leaving only stone and clay behind. It will take a long time to recover these areas, if ever, into lush growth and tall healthy trees.
If, on the other hand, the forest had regularly been subjected to forest fires the ticket would have been thinned earlier, more species would inhabit the areas between juvenile trees meaning a larger seed bank, the heat from each fire would be less extreme causing less damage. The longer we allow our systems to similarly clog up without managed transformation, ours will similarly collapse under the intensity of the unmanageable excess of resources that erupt will be wasted in the rush to find solutions.
The butterfly effect in resilience.[5] One of Nature’s most spectacular transformations (butterfly metamorphosis) illuminates transformation throughout living systems. Around 280 million years, some insects began to hatch from their eggs not as minuscule adults, but as wormlike critters with plump bodies and many tiny legs. After forming a chrysalis or cocoon, these larvae release enzymes which dissolve nearly all of its tissues. However, some organized groups of cells survive. These clusters of cells called imaginal discs, first form when an insect embryo develops in its egg. The imaginal discs remain dormant until the larva has been destroyed, then they rapidly proliferate and grow into adult legs, wings and eyes, using dissolved larval cells as fuel and building blocks.[6]
Similarly all resilient systems carry the equivalents of imaginal discs (such as seeds or new inventions or new social organization) which enable the system to transform as it uses the resources generated in previous stages.
A mushroom analogy for resilience. The fungal structure we call a mushroom is the very transitory fruiting body of an organism which can live for centuries and occupy acres of soil. The mushroom only appears when the organism (as mycelia underground, in decaying logs, or in plastic bags) has colonized all the available territory. Only then does it produce the fruiting body of the sexual phase which produces innovative offspring which can colonize new territories.[7]
All resilient systems follow this path. Most of life is spent in the growth and maturation phases. But when needed, the alpha phase is begun to create the transformation and innovation which leads to more fit, evolved and productive systems.
Other ecosystems show how species can embrace disturbance to increase their own resilience. Some chaparral species don’t re-sprout from the base after a fire, but reproduce only when fire stimulates germination of seed. The regular clearing away of old growth leads to innovative chaparral plants. By losing the re-sprouting ability and acquiring the post-fire seeding strategy, plants greatly increase their fitness in ecosystems with predictable fire recurrence, and thus access new ecological conditions causing rapid and sometimes spectacular adaptive radiations.[8] In a similar fashion our ability to build redundant, backed up systems means we can be as responsive to disturbance as these species. By accepting and integrating disturbance and planning for it, we can not only overcome disturbance but also then thrive in the aftermath.
Stability can undermine ecological resilience. A stable, mature forest in which fires are suppressed will eventually become a raging inferno which scours the landscape. The result is often massive erosion and destruction of seeds and roots. The stability of the forest results in reduced capacity of the system to regenerate. An unstable ecosystem, with small fires and other disturbances occurring every year, maintains a variety of systems from meadow, to savanna, to forest. Disturbance is required to maintain the diversity needed for resilience.
What we can take from this example is the realization that regular, systematic changes in any system will encourage new growth, mitigate losses and bring in new talent and ideas. As the title suggests, death and change are opportunities for renewal providing us with unique opportunities for growth every time. Just as the forest will never reorganize in exactly the same way it was before, neither should our systems. It behooves us to engender in our organizations and businesses with a willingness to change and accept new practices and ideas to fit our changing world and culture.
Approaches to disturbance before ecological resilience
Before resilience theory emerged, many ecologists saw dissolution or breakdown as the final stage of an ecological system. Ecological resilience does not. Before the concepts of balance of nature and climax communities were demonstrated to be inadequate in ecology, some eminent ecologists such as Howard Odum viewed the mature climax community, e.g. an oak-hickory forest in the American Midwest, as a steady-state system which is far more sustainable than a growth-oriented ecosystem.[9] Many modern agroecologists seem to also see the most sustainable system as a well-developed, stable, mature system which recovers from disturbance and adapts to change.[10]
The conventional wisdom in many sustainability circles that “stability and balance are good and growth is problematic” should be leavened with the reality of ecosystems. In fact, trying to maintain stability within a climax community may actually erode resilience. By keeping one particular system stable, the resilience of the larger system may crash. U.S. agricultural commodity policy--promoting stability while decreasing diversity, redundancy and flexibility—is widely believed to undermine ecological resilience of our agricultural system.
Approaches to adversity in psychological resilience
Similarly, in psychology, the resilience concept emerged as a competitor to a deficit model of child development. The latter approach views child development as a linear process; deviations from this process, resulting in deficits, are, through empirical studies related to certain adversities. This model provides a simple mandate when addressing those subject to a high risk of adversity, such as children in poverty: decrease the risk of adversity; when it strikes, try to rectify it.
Those few who faced significant adversity and did not show deficits were rarely studied; no one had asked if anything contributed to their resilience. They were thought to be anomalies. Studies beginning in the 1970s turned their attention to these supposed outliers. Significant relationships were established between high-risk children who were resilient — showed few or no deficits as adults — and family functioning, school environment, and community services. Studying resilience in individuals identifies protective factors in addition to risk factors.
Stressing returning to normal undermines resilience. A significant limitation with the engineering approach to resilience is the idea of “restoring conditions” or “returning to normal.” Children in poverty who overcome adversities do not stay the same, but they can still be seen as resilient. Cities subject to disastrous events that are notably different afterwards can still be seen as resilient. Crises can even generate increased resilience to future adversity, though not necessarily.
One slogan of resilience thinking is “Embracing Change.” One part of this is accepting that change in response to adversity is itself normal. Fighting against it, as well, can actually cause a decrease in resilience
Sustainability is about preservation of some thing or some function, implying the desirability of what is preserved. Sustainability may be promoted in ways that don’t involve basic change: risk aversion, crisis recovery, and increased efficiency. When we realize disruptive events of a certain magnitude cannot be avoided, however, then sustainability over time cannot be accomplished without transformation.
Destruction of societies by managing to minimize disruption. Many researchers have[11] illustrated how societies which focus on stability can undermine resilience. Agriculture replaces hunting and gathering making societies more resilient to changes in wild resource base. Human population rise is accompanied by irrigation and other technological changes which makes the system more resilient to drought.
These shifts in the agricultural system developed into more reliance on irrigated agriculture, setting into motion a loop of soil degradation and increased agricultural intensity. This process can then lock the system into a degraded state (soil degradation) with high dependence on irrigated agriculture. Hundreds of societies have disappeared around the world—all due to a single-minded focus on sustaining food supply by decreasing effects of disruptions.
Innovation, self-organizing, creative destruction and transformation
Conservative innovation was previously discussed in the context of adaptation to disturbance. Innovation can also create a disturbance which transforms the system. Technological innovations often are such powerful innovations that they transform nearly every aspect of our lives as humans and the lives of other creatures around us. The automobile replaced the horse and buggy, the smart phone has largely replaced land line phone, the calculator, alarm clock, the point and shoot camera, video player and recorder, audio recorder, photo album, watch, and even flashlight. Creation of new industries results in destruction of old industries.
Creative destruction is a process through which something new brings about the demise of whatever existed before it. The term is used in a variety of areas including economics, corporate governance, product development, technology and marketing. In product development, for example, creative destruction is roughly synonymous with disruptive technology.[12]
Creative destruction allows an innovation to induce a release and dissolution (omega) phase for some subsystems. When moderated by the other aspects of resilience the larger system becomes more adapted.
The dark side of creative destruction occurs when the conservative forces pushing the systems toward survival and reproduction are subverted. Unpredictable self-organization, the foundation of all innovation, in human societies is often divorced from the conservatism which insures that innovations contribute to the survival and reproduction of the society. Societies in the mature or K phase often have so many assets that they support innovations which undermine their foundations. Such innovations don’t survive long in any ecosystems whose assets are continually under attack by competing adaptive systems. But if the system has accumulated assets which enable it to sustain itself in the short run, it can destroy creative destruction, the foundations for long term resilience.
Complex adaptive, self-organized systems also generate new questions: if certain parts or subsystems can fail, which parts do we want to continue to operate? And in the event of which sort of crisis? The simpler view of ecosystems before ecological resilience arose obviated both questions, because the resilient system maintains all of its subsystems and interactions between them, and disturbances were assumed to be external.
Resilient systems thrive on disturbance by using it for creative destruction. In resilient systems, in contrast to the standard course of human societies, dissolution of the old is a precursor to a more powerful system.
System identity and cycles
Ecological resilience research itself transforms our concept of system identity and cycles. Ecosystems do not tend toward single, stable identities, but rather have the potential to exhibit multiple identities (or equilibria), and can rapidly shift between them. Further, all ecosystems move through cycles of change. No ecosystem is static; for instance, ecological communities do not tend toward a stable distribution of species, but are always changing.
Management of ecosystem requires transformative shifts in identities. Agricultural systems must be managed to embrace change, transformation and reformation if they are to be resilient. Throughout history when agricultural systems were forced to conform to the standards and expectations without adjusting to changes in weather and resource base and other disturbances, destruction of agricultural systems ensued.[13] As we discussed earlier, as cultures became reliant on irrigation and kept using it despite droughts and shortages, systems inevitably collapsed. Our own system is overdue for the kinds of innovations not seen since the introduction of the tractor and heavy equipment. Innovations are required that are diverse and unique to each bioregion, sensitive to the ecosystem they affect. One of the most publicized systems in need of transformation is the extensive use of water from the Colorado River and the Central Valley to irrigate New Mexico, Arizona and California. Unless we embrace the change that is called for in these states to mitigate water consumption and planting crops suited to the environment, we are inevitably headed for a system collapse which will affect millions of acres of farmland as well as millions of households who also rely on the waters of these rivers.
Ecologists who use the complex adaptive systems approach understand management is itself part of the system in question. One doesn’t just study ecosystems, but social-ecological systems, which includes the actions of the managers of the ecosystems, the users, the advocacy groups that seek preservation, and anyone who has some interest in the ecosystem. Management, then, must also foster diversity, modularity, connectivity and redundancy. In addition, it must foster innovation and novelty, experiment, innovate, and encourage endogenous self-organization and novelty.
One example of a current project that embraces new concept and new tactics is one from Colorado. There is the Crystal River basin where in the early 1900s, and again starting in the 1950s, miners pried coal from these mountains, easing 100-ton loads down the switchbacks. Now the mineshafts are closed, but the tangle of roads, along with 100 acres of waste-rock piles, remain major erosion problems. On this site a unique merger is occurring between the Forest Service, local cattlemen and environmental groups. This marks a new age of cooperation for the greater good, “The real issue here is taking care of environment, doing it in a unique manner, and doing it with unusual partners.”[14] With a 3-year plan to halt, or significantly slow down the erosion of the landscape. Already in the Coal Basin after using a three-year “cow stomp” to integrate biochar, compost and rotational grazing, results are becoming evident in new grasses, and decreased erosion in the 1-acre test plots of the 50-acre site.
Through mindful and inclusive management we can work together to solve larger problems with innovative solutions. It is up to the individual as well as organizations and governments to embrace this network and employ those ideas that bolster resilience of a landscape, as the Cow Stomp project seeks to achieve through unique, overlapping solutions to a common problem.
Management flips system between states. Management of rangeland and savanna systems[15] illustrates how management determines ecosystem state. Consider a system with two states: one with a balance between grass and shrubs with periodic fires and one with little or no grass, dominated by shrubs.
A flip can be induced by overgrazing or fire suppression or by controlling grazing and prescribed burns. Increased grazing and fire suppression can reduce the resilience of the desirable basin (the one with plentiful grass and few shrubs) to a drought.
By embracing disturbance, managers increase resilience of desirable systems. The system is exposed to discrete, low-level events that cause disruptions without pushing the system beyond a critical threshold. Such frequent, small-scale disturbances can increase system resilience and adaptability in the long term by promoting natural selection and novel configurations during the phase of renewal.
Disturbance regimes, defined as the repeated exposure to certain shocks over time, push the processes of evolution and adaptation in ecosystems and build ecosystems’ capacity to recover from future disturbance. As long as the disturbance does not push the ecosystem too close to or beyond a critical threshold, the system can recover and may even be stronger upon reorganization. Disturbance initiates the release of resources that have become sequestered or bound up so that other components can take advantage of them while forming novel configurations; disturbance loosens rigidity.
However, for exposure to disturbance to achieve the desired effect of building resilience, and not the consequence of pushing the system beyond a threshold, the system must be robust, with a strong foundation of ecosystem services and governance. Managed (or unmanaged) properly, disturbance contributes to agroecosystems’ resilience in two ways. First, it facilitates diversity as described above. Disturbance regimes affect the landscape irregularly, creating a mosaic of plant and animal communities in various stages of succession. Second, it sets into motion the phase of renewal and reorganization. Resources are then redistributed and reorganized into novel configurations that are more adapted to the changing conditions.
One analogy for how the careful introduction of disturbance can build resilience is from the technique of breeding horizontal resistance in crops. In the first round of the breeding process, a crop is exposed to a pathogen for which breeder’s desire resistance. Individual plants that show full resistance are discarded, and plants that are highly susceptible die. Only plants that show partial resistance are bred for the next generation, and the population exhibits a range of resistance to that particular pathogen. With horizontal resistance, some damage and loss is accepted, but overall crop resistance is preserved by the genetic variability of the overall population. In breeding for vertical resistance, on the other hand, only plants with full resistance are selected and back-bred until the population is genetically uniform. No amount of loss or damage is accepted. Resistance, in this case, is either on or off, with no variability. Defense mechanisms function as long as the pathogen does not evolve, but once it does, it can lead to total crop loss. The difference between building horizontal and vertical resistance in crops parallels the long-term benefits gained from carefully introducing disturbance into the agroecosystems.
Governance of social ecological systems
Resilient societies have instituted regular and orderly disturbance by changing those who are in power. At least every eight years the U.S. President is replaced. This embrace of disruption is hardly the norm in the world’s societies. Robert Mugabe’s continuous rule in Zimbabwe since 1980 has eliminated productive businesses and farms and stimulated perhaps “the most rapid disintegration yet of a modern nation-state.”[16] There is a remarkably high correlation between length of time in office of a country’s leader and stagnation or decline in living standards in a country.[17] No matter how benevolent a dictator, he is limited by his own experience and networks. In ecological resilience this is an example of rigidity or poverty trap: the governance of a system insures that the system does not move into more adapted state.[18] The system does not change and may appear resilient in the short run, but undermines any long-term resilience of the system.
Governance of systems may maintain a system in a poverty trap not only through the perpetuation of one particular leader. In fact, more pernicious influences on resilience are rigid cultural mindsets[19] and other controllers of governance structures (such as well-heeled lobbyists).[20]
Following are a number of illustrations of innovations which could lead to transformations to ecological resilience, but have thus far been stymied by such mindsets and gatekeepers.
Transforming Practices. There are many new and innovative ideas circulating in the world of business related to ecological resilience. Depending on what field you specialize in, from production to distribution, there are new models coming out nearly annually that are alternatives to standard management structures and operational guidelines.
These changes can be implemented intentionally, though more often than not it is due to extra-ordinary circumstances that force us to reorganize and restructure our business models.
Take Randy Hardin, our case study from Central Arkansas as a prime example. His farm was highly diversified and fed into a larger business that housed a pumpkin patch, corn maze, restaurant and educational opportunities for children all over the property including replicas of American Indian and colonial homes on site. Business was going great, he employed a tremendous staff generating wealth in the local economy and his business model was built on providing enjoyment and education to all ages. As luck would have it, a highway was constructed right through the center of his property, effectively cutting off the vegetable fields that fed into his restaurant and creating too much liability to have children around with the new highway looming nearby. Rather than packing up and taking a job in the city, he transformed his model choosing to reopen a new store in a nearby town that specialized in locally grown food and culinary products as well as a successful BBQ and ready-made meals for the ageing populace around him. It was his willingness to transform the model to something new, choosing not to maintain the old business in the face of game changing disturbance.
Another example is a model termed Innovative democracy[21], a term made coined by the manufacturing company W.L. Gore and Associates which makes Gore-Tex and a number of other products for uses from space travel to sports arenas. Their management model has no managers, bosses, or subordinates. Rather, everyone is an associate working in small teams. In this way Gore is a network of individual units all working separately though contributing to the greater whole. The underling philosophies within Gore celebrate innovation, self-motivation and transparency in leadership and decision making. This concept came about when Bill Gore left a previous company he felt stifled in his work. Moreover he felt like the benefits of what is now Gore-Tex weren’t being fully realized within his previous corporate environment. He chose then to leave with the right to Gore-Tex and start his own company with totally transformed ideas about how to manage people. His model, though time consuming due to the time it takes to make decisions in such a democratic fashion, lends itself to highly motivated, committed people working on multiple projects simultaneously. Moreover these individuals get to choose what they work on lending the ability for people to use their strengths and propel projects forward faster.
In agriculture another way to look at new management schemes of profit-sharing based on total transparency for farm costs and profits. The cost of seed, fertilizer, labor and all other expenses that are normally kept from the laborer. When this information is on the table, many laborers feel more integrated into the whole and therefore are more enthused and engaged in the entire production process. Some farmers have even taken the approach of using this transparency to develop harvest time incentives. One farmer used this model because he didn’t have the money to pay a living wage until harvest time and because of his transparency on the matter laborers agreed to wait for full payout until harvest. The result was that laborers would come out on their days off, pruning, paying careful attention to the plants because they had a unique buy in. At harvest they had the best crop on record generating more profit than was expected, providing the farmer and the workers with a bonus.[22]
It’s important to look around at different models for inspiration as to how to change your own system for the better. Through our willingness to acknowledge our systems’ shortcomings, we find opportunities to change not only our practices but our models and the implicit theories of management.
Willingness to transform. The heart of conservative innovation is the ability to recognize good ideas and move forward with them! If you’re not able to recognize the power of a truly great idea, transformation will be stifled. Moreover if you’re resistant to embracing an inevitable change, like the transition to agriculture that generates healthy soil rather than destroying life through the application of pesticides with reckless abandon, your business will eventually be outdone by competing producers.
It comes down to a willingness to be wrong just long enough to find out what’s “right” and acting on that information. Pride and prejudice are degenerative forces when it comes to making real and substantial changes for the better. Throughout history, cultures have shifted their ideals and practices to encompass the winds of change, bending to make space for new and improved ideas. We will look now at a few examples of how human cultures of the past have made these transitions to help illustrate not only that drastic change is possible, it is inevitable.
Transforming History – Landmark examples of transformation to a new age
Throughout history we can find remarkable examples of new systems that changed the way we live dramatically. Innovations that have led us to where we are now in our cultural practices. Here we will take a look at just a few examples of transformations that have taken place to inspire you, illustrate possibilities and lend insights for where humanity may, or may not go.
From Forest to Field – The Transition to Agriculture
The most profound transformation of ecological systems occurred with the transition from hunting and gathering to agriculture. Beginning with domestication of plants and animals in many different locations around the world, the agricultural revolution transformed small, mobile small groups into villages, towns and cities. Innovations in individual species have made them unrecognizably different. The few tough, small kernels on the ear of the wild progenitor of maize has become today’s sweet corn that makes a whole meal on a hot summer’s day. The transition resulted in radical alternations of the local ecosystems.
Though it took eons to create the vast array of high yielding herbs and vegetables we have today, it was a change in mindset, and culture that allowed people to settle down and transform the ways of their ancestors. Agriculture matured differently on each continent as Europeans noted when they came to the Americas. The American Indians grew their produce in clumps, grouping plants together in guild planting. When Europeans came to the continent for the first time, they had a hard time distinguishing between an overgrown field and the agricultural plots of the Indians.
Another practice alien to the Europeans was the Aztec use of chinampas. In this innovation, swampy areas were turned into fertile farmland by piling mud from drainage ditches onto mats secured by posts. The woven mats covered with rich soil both enabled them to grow in more areas, while the water underneath the woven mats supplied much of the irrigation needed for their crops. This was much unlike the models of the Spanish who grew their crops on dry land.[23]
Even further South, tribes used biochar to build up fertile islands in the Amazonian swamps and jungles. Even today, these areas remain with vastly elevated organic matter compared to surrounding lands.[24]
All of these regions generated self-organized, totally unique approaches to make the transition from hunting and gathering. Unfortunately these innovations were ignored by the European settlers since they fell outside the scope of European farming practices.
European settlement of America and global transformation. Some contend that the biggest transformation in the planet’s history happened in the early 1600s as a result of European settlement.
Two global signatures appear in about 1610. Pollen from imported New World crops begins to appear in Europe, and a massive dip in carbon dioxide levels can be seen in Antarctic ice cores dating to that time. Both of these events are a direct result of increased trade and transport of animals and plants across the Atlantic Ocean — a barrier which had previously kept the New and Old Worlds separated for millions of years. Today nearly all the crops grown in some parts of the Old World (maize, sweet potatoes, Irish potatoes, cassava, beans) originated in the New World and helped transform societies worldwide.
In the case of the global dip in carbon dioxide, this appears to be the result of the deaths of millions of indigenous people in the aftermath of European colonization. As many as 50 million Native Americans died in the aftermath of European expansion into the New World, mostly as a result of infectious diseases such as smallpox. As their numbers dwindled, the resultant loss in agriculture allowed for forests to re-grow throughout the Americas. These expanded forests scrubbed the atmosphere of carbon dioxide.[25]
The destruction of the previous system enabled the rise of a new system.
The Industrial Revolution
Before the industrial revolution people spent either much of, or their whole lives in small villages, producing for their region on a small scale. A stable system, it was fast disrupted by the innovations that ensued with changes in working conditions and capabilities. What happened over the 150 years commonly associated with the industrial revolution are paramount to the changes that can and are happening today with the inclusion of new technologies and strategies.
The battery, lightbulb, large scale manufacturing, locomotive and personal vehicle are just a small selection of the inventions that were realized over that period. We’ve discussed the effects of creative destruction by specific technological innovations. However, a broader shift is even more transformative. The industrial revolution caused great leaps and bounds in productivity but it also saw many social, environmental and economic issues arise. This mix of results is one reason for bearing in mind the element of conservation in our innovations. In our rush to transform our culture (for example into a more inclusive and environmentally conscious one) we must consider what effects our decisions will and do have on those around us, from other humans to plants, animals and our atmosphere.
As we continue in our industrialized world we have reached a climax, entered into the conservation period of our adaptive cycle. Now is the time to develop an ecological approach to technology, integrating the earth’s tried and true ecological processes into our vision for productivity and efficiency.
Transformation today
In today’s world, innovations are emerging are an exponential rate. With such innovation occurring in so many sectors and with so many minds working on wicked problems like energy production, poverty and climate change, there should be plenty of potential solutions to test and evaluate.
Are these innovations being stifled by powerful interests or impersonal market forces? Or are they occurring all around us and we don’t see them because we are blinded by our non-resilient view of the world?
Stephen Hawking suggests the emergence of the silent revolution, one that is emerging out of the millions of non for profit and humanitarian agencies across the globe all working independently on these monumental issues of our day and age. Each one working on issues that are local as well as global finding solutions that work in a range of settings and climates. Though their successes are often shunned or disregarded by mass media their effects are relevant nonetheless. The Pachamama Alliance[26] offering support to indigenous tribes in the Amazon rainforest and beyond, Homeboy Industries[27] in Los Angeles, CA helping Latino gangs in Los Angeles and El Salvador. These are just two of the innumerable government, religious and independent organizations transforming local systems around the world.
Just a few statistics to help illustrate the changes:
Amount of global investments in renewable energy in 2004: $40 Billion
Amount of global investments in renewable energy in 2013: $214 Billion[28]
Number of protests worldwide in 2006: 59
Number of protests worldwide in 2012: 159[29]
Number of cell phone users in 1990[30]: 12.4 Million
Number of cell phone users in 2011: Over 6 Billion
Total world capacity for production of solar power in 2004: 3.7 Gigawatts
Total world capacity for production of solar power in 2013: 139 Gigawatts[31]
Approximate change in Earths freshwater wildlife population 1970-2010: -76%
Approximate change in Earths terrestrial Wildlife population 1970-2010: -39%
Approximate change in Earths human population, 1970-2010: +185%[32]
These highlights offer a few different perspectives on the fast changes that are occurring on this planet and how humanity has changed and transformed the planet. Sometimes for the better, sometimes for the worse. As our damage becomes greater, so our solutions must adapt. Today there are inventors looking to develop sea based energy, harnessing the wave energy just off our coast line. Similarly, young inventor Boyan Slat,[33] age 19, has devised a technique wherein he and his colleagues suggest they could clean up the ocean in roughly 5 years’ time and make a profit doing it by building a grid of solar and ocean powered buffers that would collect plastics and separate them from lifeforms like plankton.
These are large scale solution to fit large scale problems, much larger in fact than even the largest single mono-crop, pesticide rich farms dominating many of the landscapes across the U.S. Midwest. There are large scale problems present in agriculture that likewise are in desperate need of these large scale solutions. Whether its pesticide run-off into estuaries, erosion causing loss of top soil, depletion of water in the western United States and around the world, or the decimation of natural biota in the soil, we need to be open to creative solutions that mitigate and eventually eliminate the damages reaped by these systems.
Within this need to transform, however, how are we balancing the knowledge of the past with our need and desire to innovate and change? Are we respecting and valuing the time tested models that built soils, cleansed water ways and grew magnificent oxygen-generating forest for centuries and millennia?
Embracing Tradition in the Transition. Author Hassan Fathy, mentioned in an earlier chapter talks extensively in his book Architecture for the Poor[34] about how to ensure that we embrace tradition as we innovate and develop modern technology and building styles. Though his beliefs could be perceives as stunting growth or stifling progress it is worth noting the immeasurable value of tradition and culture.
Much commentary has been made about the lack of concern for traditional culture within, particularly, American society. More and more as countries become more “developed” it is often at the expense of local traditions. Why is this? In our pursuit of the newest design theme and the most modern cities we have systematically removed the unique, totally original manifestations of art and architecture that have marked cultures, some for thousands of years. In Hassan’s book he talks about the beauty of original Egyptian designs, the unique domes, drawings, pillars and statues that in times past pervaded Egypt. He suggests that with this loss of traditional design local people lose something that is somewhat undefinable and that once lost is hard, if not impossible, to reaffirm. It is something like pride that is reflected in local crafts, specialty foods, regional tastes and styles.
We risk losing something that is invaluable, largely intangible and wholly unique to every locality. Whether it is cheese from Wisconsin, wild herbs from the Ozarks or Chinese provinces suited to the micro-climates, New York pizza, or the mud brick buildings so well suited to arid climates in Egypt, these particular signatures mean more than one might suggest. These foods, designs and crafts encompass generations of development, selection and taste that is irreplaceable.
This uniqueness and originality are possible if we choose to transform our systems through the lens and practices of resilience. It is only through locally self-organized systems that we stand to engender the same kind of constructive selection that develops into regional options.
Once there was an unmistakable flavor and view to the rural towns of the world and as we rush to “develop” and “grow” in the shadow of modern design and commercial interest, we steadily lose a piece of ourselves at the same time. The shadow cast by progress can shade out even the most resilient designs unless we understand the virtues and values of our cultures, our traditions.
What is your area’s local specialty? How can you grow to support it? If there is no recognizable flavor or taste in your region, can you create one? What would that look like? How can you harness this time in our society that is asking for something local and original? We live in a unique time where the people of the world are poised for change, awaiting with a desire for something that feels and tastes like a home they often don’t remember.
Using the Omega Phase of the Adaptive Cycle to harness Transformation constructively
Earlier in this book we looked at the adaptive cycle, the movement from conserved resources, to disturbance, to reorganization of resources, to growth, eventually returning to a conservation of resources. Many who understand the adaptive cycle would suggest we are in the conservation phase, at risk of a societal disturbance that is akin to the ecological impact of a rampant forest fire. The resources we have accumulated are astonishing, and we continue to accumulate through mining, production and accumulation of finite materials.
The encouraging aspect is our ability to harness where we are to manage our social, economic and environmental disturbances; if we are willing to adapt.
In agricultural systems we have many opportunities to see the coming change and adapt with both innovative and time tested methods. We cover many practices in the Working with Nature chapter of this book, here we strive primarily to further inspire you to action with the knowledge that you are empowered to create change on your scale. As more farmers, ranchers, mycologists and gardener’s transition to more ecologically integrated practices, the seemingly small changes amount to something greater.
Predicting the future. Emergence and transformation are by nature unpredictable. Our minds can see present trends and make projections based on them, but we cannot predict something which is unpredictable. However, we can be sure that society will evolve in one of an archetypal triad of directions—evolution, decline, or progression.
Progression assumes that economic interdependence deepens, dominant values spread, and developing regions converge toward rich-country patterns of production and consumption. Structural continuity is assumed. Core institutions are able to absorb disturbances and adapt to changing conditions. This view was widespread as the Soviet Union disintegrated. “The triumph of the West, of the Western idea, is evident first of all in the total exhaustion of viable systematic alternatives to Western liberalism.”[35] Such gradualism makes the risky wager that stepwise responses will not be overwhelmed by any external disturbance or internal transformation. Progression is a near cousin of the discredited climax community and balance of nature concepts. The many conflicting impulses created by competing complex adaptive systems which composed the climax community have an inherent capacity to transform by as they embrace disturbance. In the progressive world-view, where progress is associated with economic growth and the good life with material consumption, it would take massive political will to counter the momentum of dangerous trends. Where would it come from? It’s nowhere in sight. Perhaps it will come from a realization that this world in not a desirable vision. Do we really want the world to resemble a well-engineered mall, where the environment continues to deliver services and few people starve, but not a place where people and nature thrive?
If the world does not experience enough technological transformations to be able to achieve the “well-engineered mall,” we are left with the bleak future of unattended crises and a deluge of instability swamping society’s adaptive capacity, leading to a general global crisis and the erosion of civilized norms. Again, many different scenarios could unfold—enough to stimulate the creative juices today of an army of apocalyptic screenwriters and novelists. In one version, powerful international forces are able to impose social order and environmental controls, leaving elites in protected enclaves and an impoverished majority outside. In various breakdown scenarios, authoritarian interventions fail, chaos spirals out of control, and institutions collapse.
By contrast, the ecological resilience approach seeks to build at a local level the foundations of resilience we have discussed in this book: modular connectivity, local self-organizing, building assets, redundancy, complementary diversity, conservative innovation, and ecological integration. When these foundations are in place, the system can embrace disturbance and create transformation.
Managing the future: interactive adaptation and emergence. The interactive adaptation of all living organisms—often overwhelming in human social interaction--and the unpredictability of emergence, insures we cannot predict the transformations of the future. And higher the scale, the less likely we are to be able to predict how systems will adapt to each other and what new systems will emerge.
So let’s come down to a level where you have a better chance of managing the future of a system: your farm or business or the land you work on.
The Back-ups/Redundancy chapter discussed how resilient systems must have a means of reproducing themselves. Systems which don’t reproduce themselves, by definition, die. The transformation which is also a foundation of resilient systems conflicts, however, with our human urge to sustain the present system. We build a farm or a business and we want to see it continue. Often, however, we are less likely to welcome the change which is necessary for it to continue.
This is especially true on farms. A new manager always brings in new ideas. The son or daughter has different ideas and lots of energy to implement them while their father does not want to let go of the reins. When no offspring want to farm, the farmer faces an even less certain transition. We’ve discussed means turning this dilemma into a resilient system in the redundancy chapter.
Facilitating the foundations of resilience by transformation. Passing on the farm is just one example of facilitating resilience through transformation. All systems enter an omega phase eventually, transforming to something new. Our task is to insure that we build up the foundations of resilience so something we don’t expect doesn’t destroy the system as a whole. Perhaps it’s extreme weather destroying factories or power lines causing disruption in the supply of oil, or electricity. Maybe it’s a market fallout of a certain type of equipment or crop that you rely on.
Escaping poverty traps. A great number of vicious cycles exist in which transformation is especially desired. Intensive irrigated agriculture leading to population increase which leads to more intense irrigated agriculture until all resources are outstripped and system collapsed is an example of positive feedback leading to what is termed a poverty trap. Government control of economy leading to a worse economy leading to more need for government control is another.
In resilient societies, innovators will bring in a disturbance instead of letting the vicious cycle rule.
Anderies[36] and Lowdermilk (ibid.) have illustrated how societies which focus on sustainability can undermine resilience. Agriculture replaces hunting and gathering making societies more resilient to changes in wild resource base. Human population rises is accompanied by irrigation and other technological changes which makes the system more resilient to drought.
These shifts in the agricultural system induce more reliance on irrigated agriculture, setting into motion a positive feedback loop of soil degradation and increased agricultural intensity. This process can then lock the system into a degraded state (soil degradation) with high reliance on irrigated agriculture. Hundreds of societies have disappeared around the world—all due to a single-minded focus on sustaining food supply by decreasing effects of disruptions.
Management to maintain, not transform, decreases resilience. Some types of adaptation are undertaken by governments on behalf of society, sometimes in anticipation of change but often in response to individual events. Such responses are short-sighted, and can even contribute to a worsening of the threat: droughts and water shortages in Melbourne, Victoria have, for instance, spurred the building of an energy-intensive desalination plant and creation of a pipeline to divert water from upstate.[37] Increased energy usage, along with a new dependency on a pipeline, certainly don’t work to increase resilience
Forces resisting transformation. Transformation may mean that a forest burns, a business fails, or an innovation or social policy isn’t successful. An attempt at transformation, by risking these events, may promote resilience over a larger scale. Their failure or destruction seems a reasonable cost to bear in promoting a sustainable forest, a market economy, and better social policy, respectively. But when we consider people, alone or within families and communities, immediate ethical obligations may overrule the longer-term, or higher-level, view.
Faced with famine, an epidemic of acutely fatal infectious disease, or a natural disaster, the humanitarian response is geared towards preventing death or permanent disability. Yet to prevent this, one might need to overexploit resources to provide food and shelter, or to use antibiotics in a way that might increase the chance of resistant infections in the future. Until resilience has been built up enough, such difficult choices between present urgency and long-term sustainability still need to be made.
Low level transformation can forestall catastrophe. Resilient systems are often exposed to discrete, low-level events that cause disruptions without pushing the system beyond a critical threshold. Such frequent, small-scale disturbances can increase system resilience and adaptability in the long term by promoting natural selection and novel configurations during the phase of renewal; described as “creative destruction.” An example is selection of crop varieties by exposing populations to pests and disease followed by selection of plants that fared well and exhibit signs of resistance
Disturbance regimes, defined as the repeated exposure to certain shocks over time, push the processes of evolution and adaptation in ecosystems and build ecosystems’ capacity to recover from future disturbance.[38] As long as the disturbance does not push the ecosystem too close to or beyond a critical threshold, the system can recover and may even be stronger upon reorganization. Disturbance initiates the release of resources that have become sequestered or bound up so that other components can take advantage of them while forming novel configurations; disturbance loosens rigidity.
However, for exposure to disturbance to achieve the desired effect of building resilience, and not the consequence of pushing the system beyond a threshold, the system must be robust, with a strong foundation of ecosystem services and governance. Managed (or unmanaged) properly, disturbance contributes to agroecosystem resilience in two ways. First, it facilitates heterogeneity as described above. Disturbance regimes affect the landscape irregularly, creating a mosaic of plant and animal communities in various stages of succession. Second, it sets into motion the phase of renewal and reorganization. Resources are then redistributed and reorganized into novel configurations that are more adapted to the changing conditions.
One analogy for how the careful introduction of disturbance can build resilience is from the technique of breeding horizontal resistance in crops. In the first round of the breeding process, a crop is exposed to a pathogen for which breeders desire resistance. Individual plants that show full resistance are discarded, and plants that are highly susceptible die. Only plants that show partial resistance are bred for the next generation, and the population exhibits a range of resistance to that particular pathogen. With horizontal resistance, some damage and loss is accepted, but overall crop resistance is preserved by the genetic variability of the overall population. In breeding for vertical resistance, on the other hand, only plants with full resistance are selected and back-bred until the population is genetically uniform. No amount of loss or damage is accepted. Resistance, in this case, is either on or off, with no variability. Defense mechanisms function as long as the pathogen does not evolve, but once it does, it can lead to total crop loss. The difference between building horizontal and vertical resistance in crops parallels the long-term benefits gained from carefully introducing disturbance into the agroecosystem.
How does you system rate on the periodic transformation quality of resilience? Contemplate these questions:
Have you changed management structure in the last five years?
Have you changed your marketing strategy in the past year?
Are you willing to alter your practices in the face of unforeseen challenges?
Have you changed management structure in last five years?
Have you changed who’s in charge of various enterprises lately?
Do you like to shake things up now and then?
Are you hesitant to make changes in your farm?
Conclusions. Before the concepts of balance of nature and climax communities were discredited in ecology, some eminent ecologists such as Howard Odum viewed the mature climax community, e.g. an oak-hickory forest in the American Midwest, as a steady-state system which is far more sustainable than a growth-oriented ecosystem.[39] Many modern agroecologists seem to also see the most sustainable system as a well-developed, stable, mature system which recovers from disturbance and adapts to change.[40]
This maintaining equilibrium approach to ecosystems often leads to management failures. Disturbance can cause a system to dissolve or breakdown. Many see this as the final stage of an ecological system. Ecological resilience does not. Instead it is just once phase in the adaptive cycle. And it is a required phase all systems go through in order to evolve. The mammals could only take over when the age of the dinosaurs was over. Transformation or reformation is the stage which follows dissolution in a resilient system.
The conventional wisdom in many sustainability circles that stability and balance are good and growth is problematic should be leavened with the reality of ecosystems. In fact, trying to maintain stability and a climax community may actually erode resilience. By keeping one particular system stable, the resilience of the larger system may crash. U.S. agricultural commodity policy--promoting stability while decreasing diversity, redundancy and flexibility—is widely believed to undermine ecological resilience of our agricultural system.
Agricultural systems must be managed to embrace change, transformation and reformation if they are to be resilient.
Ecosystems are complex adaptive systems changing over time with changing environmental conditions. If management aims to keep a given system by enhancing its resilience, the system might become mal-adapted but still persist for a long time. Management must consider resilience as dynamic and changing in order to go beyond mere persistence.
Resilience is high during the pioneer stage α and growth or r phases. So establishing highly resilient ecosystems is facilitated by maintaining the system to these stages and circumventing the natural cycle.
Citations on periodic transformation
[1] Dewey, J. 1922. Democracy and Education: An Introduction to the Philosophy of Education. New York: Macmillan.
[2] Berry, W., 1973. Manifesto: The Mad Farmer Liberation Front. The Country of Marriage, Harcourt Brace Jovanovich.
[3] Gould, S.J. and N. Eldredge, 1977. The Tempo and Mode of Evolution Reconsidered, Paleobiology, 3: 115-151.
[4] Walker, B., C. S. Holling, S. R. Carpenter, and A. Kinzig. 2004. Resilience, adaptability and transformability in social–ecological systems. Ecology and Society 9(2): 5. http://www.ecologyandsociety.org/vol9/iss2/art5/
[5] Not to be confused with the butterfly effect in chaos theory where a small change (symbolized by the flap of a butterfly’s wings) can lead to self-organization of a powerful force (such as a typhoon).
[6] Jabr, F., 2012. How does a caterpillar turn into a butterfly? Scientific American, http://www.scientificamerican.com/article/caterpillar-butterfly-metamorphosis-explainer/
[7] Some mushrooms and fungi have lost the innovation-inducing sexual phase. They are known as fungi imperfecti or Basidiomycetes. Not to be confused with the mushroom theory of management where employees are kept in the dark and fed unsavory material. http://www.urbandictionary.com/define.php?term=mushroom+management
[8] Pausas, J.G. and Keeley, J.E., 2014. Evolutionary ecology of resprouting and seeding in fire-prone ecosystems. New Phytologist, 204: 55–65
[9] Odum, H., 1974. Energy, Ecology, & Economics, http://www.sustainabletucson.org/2007/01/energy-ecology-economics-by-howard-t-odum-intro-by-bob-cook/
[10] Gliessman, S., 2004. Agroecology and Agroecosystems. In Agroecosystems Analysis, http://www.canunite.org/sites/default/files/agroecology%20and%20agroecosystems2004.pdf
[11] See, for example: Anderies, J. (2006). Robustness, institutions, and large-scale change in social-ecological systems: the Hohokam of the Phoenix Basin. Journal of Institutional Economics, 2(02):133–155; Lowdermilk, 1953. Conquest of the Land Through Seven Thousand Years. United States Department of Agriculture.
[12] Joseph Schumpeter, an Austrian-American economist, developed the concept of creative destruction in his 1942 work, Capitalism, Socialism, and Democracy.
[13] As an example, let’s look at the fall of the Roman Empire. It has been cited consistently as a comparison that is similar to our own global situation today: http://www.edwardgoldsmith.org/28/the-fall-of-the-roman-empire/
[14] Commission Chairman John Martin in an interview with Post Independent - http://www.postindependent.com/news/8432996-113/project-county-support-crystal
[15] Anderies, J., Janssen, M., and Walker, B. (2002). Grazing management, resilience, and the dynamics of a fire-driven rangeland system. Ecosystems, 5(1):23–44; Janssen, M., Bodin, Ö., Anderies, J., Elmqvist, T., Ernstson, H., McAllister, R., Olsson, P., and Ryan, P. (2006). Toward a network perspective of the study of resilience in social-ecological systems. Ecology and Society, 11(1):15; Walker, B., Ludwig, D., Holling, C., and Peterman, R. (1981). Stability of semi-arid savanna grazing systems. Journal of Ecology, 69(2):473–498.
[16] http://www.latimes.com/opinion/la-op-kirchick30sep30-story.html#page=1
[17] http://en.wikipedia.org/wiki/List_of_longest-ruling_non-royal_national_leaders_since_1900
[18] Carpenter, S. and W. Brock, 2008. Adaptive capacity and traps. Ecology and Society, http://www.ecologyandsociety.org/vol13/iss2/art40/
[19] Diamond, J. 2005. Collapse: How Societies Choose to Fail or Succeed. Viking.
[20] Gunderson, L., et al. Escaping a rigidity trap: governance and adaptive capacity to climate change in the Everglades social ecological system. Idaho Law Review, 51:127-156.
[21] http://www.managementexchange.com/story/innovation-democracy-wl-gores-original-management-model
[22] https://attra.ncat.org/attra-pub/viewhtml.php?id=330
[23] http://www.aztec-indians.com/aztec-farming.html
[24] http://www.biochar.org/joomla/index.php?option=com_content&task=view&id=114&Itemid=7
[25] Lewis, S.L., and M. A. Maslin, 2015. Defining the Anthropocene. Nature, 519:171–180.
[26] The Pachamama Alliance http://www.pachamama.org/
[27] Homeboy Industries http://homeboyindustries.org/
[28] Originally cited from YES magazine, issue #__
[29] As defined in a study by the Initiative for Policy Dialogue and the Friedrich-Ebert-Stiftung New York Office
[30] Bridget Borgobello 2013 - http://www.gizmag.com/mobile-pnone-40-year-anniversary-photos/25677/
[31] International Renewable Energy Agency, 2014. Rethinking Energy. http://www.irena.org/rethinking/Rethinking_FullReport_web.pdf#page=33.
[32] World Wildlife Fund, 2014. Living Planet Report. http://www.worldwildlife.org/pages/living-planet-report-2014
[33] http://vr-zone.com/articles/19-year-old-inventor-finds-way-to-clean-up-the-worlds-oceans-in-under-5-years-time/19381.html
[34] http://www.abebooks.com/9780226239163/Architecture-Poor-Experiment-Rural-Egypt-0226239160/plp
[35] Fukuyama, F. 1989. The End of History? The National Interest, (Summer 1989): 3-18; Fukuyama, F., 2006. .The End of History and the Last Man. New York: Free Press, 2006.
[36] Anderies, J. (2006). Robustness, institutions, and large-scale change in social-ecological systems: the Hohokam of the Phoenix Basin. Journal of Institutional Economics, 2(02):133–155.
[37] Barnett, J. and O’Neill, S. (2010). Maladaptation. Global Environmental Change, 20(2):211–213.
[38] Gunderson, L. and Holling, C. (2002). Panarchy: understanding transformations in human and natural systems. Island Press; Berkes, F., Colding, J., and Folke, C. (2003). Navigating social-ecological systems: building resilience for complexity and change. Cambridge Univ Press.
[39] Odum, H., 1974. Energy, Ecology, & Economics, http://www.sustainabletucson.org/2007/01/energy-ecology-economics-by-howard-t-odum-intro-by-bob-cook/
[40] Gliessman, S., 2004. Agroecology and Agroecosystems. In Agroecosystems Analysis, http://www.canunite.org/sites/default/files/agroecology%20and%20agroecosystems2004.pdf
Survey results
As detailed in the Methods section, an on-line survey was conducted with extension agents and other managers of food and agricultural systems. One of the goals of this survey was to revisit a survey conducted 20 years ago to see how opinions of expert practitioners have changed over 20 years. In the below discussions at the state level, we explore those historical differences. We also included a few more questions to explore indicators of resilience for which county level databases were not available. Tables 1-7 at the end of this section present the 2015 survey data in more depth. Results from SOS1995 are available at: https://projects.sare.org/media/pdf/4/8/3/483southern-futures.pdf
Overall results at region level paint priorities with a very broad brush. Please look at least at the state level data and preferably in relation to county level data presented in previous sections.
Attitudes about sustainable agriculture. As shown in the box below, most states increased regarding percent of respondents feeling farmers were practicing sustainable agriculture in their counties,. Only AL, TN, TX and VA showed decreases, with KY and OK remaining virtually the same. In both 1995 and 2015, NC, SC, and Virginia, consistent with SRI rankings, ranked highest on this measure. The two lowest states in 1995, AR and FL increased the most. TX decreased the most followed by TN.
|
Do you think farmers/ranchers in your county are practicing sustainable ag? (% answering yes) |
|||||||||||||
|
|
AL |
AR |
FL |
GA |
KY |
LA |
MS |
NC |
OK |
SC |
TN |
TX |
VA |
|
2015 |
61 |
61 |
48 |
67 |
63 |
63 |
58 |
80 |
56 |
77 |
59 |
40 |
72 |
|
1995 |
73 |
36 |
34 |
45 |
63 |
54 |
48 |
76 |
56 |
57 |
71 |
60 |
81 |
As shown in the box below, respondents in 2015 were much more optimistic about whether farmers can produce enough food without synthetic chemicals. All states were in the single digits answering yes in 1995, but in 2015 more than 20% of three states’ respondents answered yes. Only LA remained in below 10%.
|
Can farmers/ranchers produce enough food and fiber without using synthetic chemicals? (% answering yes) |
|||||||||||||
|
|
AL |
AR |
FL |
GA |
KY |
LA |
MS |
NC |
OK |
SC |
TN |
TX |
VA |
|
2015 |
41.9 |
18.8 |
16.7 |
15.8 |
12.6 |
5.3 |
12.7 |
11.4 |
12.5 |
16.7 |
21.4 |
31.1 |
15.9 |
|
1995 |
7 |
9 |
6 |
3 |
4 |
3 |
1 |
5 |
7 |
7 |
6 |
6 |
7 |
Similarly, nearly all states showed increases in whether respondents thought sustainable agriculture was economical, as shown in the following box. Nearly every state rose at least ten percent, with GA, LA, OK, SC and TX all increasing more than 20%. Only MS, TN and VA had slight decreases.
|
Do you think sustainable agriculture is economical? (% answering yes) |
|||||||||||||
|
|
AL |
AR |
FL |
GA |
KY |
LA |
MS |
NC |
OK |
SC |
TN |
TX |
VA |
|
2015 |
71 |
55 |
52 |
51 |
54 |
58 |
34 |
53 |
56 |
67 |
43 |
53 |
44.2 |
|
1995 |
57 |
36 |
42 |
28 |
40 |
19 |
40 |
49 |
20 |
32 |
45 |
22 |
47 |
Problems faced in helping farmers/ranchers implement sustainable practices.
As shown in Table 2 lack of farmer/rancher interest was ranked as the worst constraint across the region. Consistent with SRI scores, NC, VA, SC, GA, and FL all saw lack of farmer interest as less a constraint in 2015 than in 1995 as shown in the box below. Also consistent with SRI scores, AR, LA, MS and TN each saw farmer interest in sustainable agriculture practices as more of a problem in 2015 than in 1995.
|
What problems do you face in helping farmers/ranchers implement sustainable agriculture practices? (% checking “lack of farmer/rancher interest”) |
|||||||||||||
|
|
AL |
AR |
FL |
GA |
KY |
LA |
MS |
NC |
OK |
SC |
TN |
TX |
VA |
|
2015 |
53 |
79 |
60 |
46 |
67 |
74 |
70 |
61 |
69 |
57 |
81 |
67 |
49 |
|
1995 |
55 |
77 |
71 |
63 |
65 |
68 |
69 |
77 |
75 |
68 |
63 |
69 |
57 |
Lack of support for sustainable agriculture from their organizations was the lowest ranking constraint in 2015, as shown in Table 2. Compared to 1995, organization support for sustainable agriculture is perceived as less a constraint in most states with AR, FL, GA, and MS all decreasing by 10 percent or more, as shown in the box below. TX and KY were outliers with increases of 8% and 6% respectively.
|
What problems do you face in helping farmers/ranchers implement sustainable agriculture practices? (% checking “organization priorities do not stress sustainable agriculture”) |
|||||||||||||
|
|
AL |
AR |
FL |
GA |
KY |
LA |
MS |
NC |
OK |
SC |
TN |
TX |
VA |
|
2015 |
23 |
24 |
20 |
16 |
22 |
26 |
21 |
21 |
6 |
26 |
12 |
27 |
12 |
|
1995 |
23 |
35 |
45 |
26 |
16 |
21 |
40 |
17 |
13 |
23 |
17 |
19 |
17 |
Sustainable agriculture education needs (Table 3). Beyond the obvious need for education which will increase profitability, the top five highest ranking education priority areas were alternative markets, total sustainable farming systems, consumer education, integrated pest management and regional marketing systems and infrastructure.
The highest ranking research priorities, as shown in Table 4, were similar to education priorities: alternative markets, regional marketing systems and infrastructure, total sustainable farming systems, consumer attitudes and behavior, crop and livestock diversification, and integrated pest management.
The key differences between research and education priorities across the region are that regional marketing systems and infrastructure research moved to near the top of research needs and crop and livestock diversification entered the top tier of research needs. This may indicate that, though education is needed, more research is especially required in these areas for education to be effective. In other areas, research may be a little less pressing, though still high priority.
Problems facing farmers and ranchers.
The survey asked respondents to rate whether each of 26 problems faced by farmers in their county was No Problem, Minor Problem, Moderate Problem or Serious Problems. As Table 2 and the following box shows, the percentages of those ranking a problem as a serious problem were fairly consistent across the Southern State with a few noteworthy exceptions.
|
What are the problems facing farmers/ranchers in your county? (% that selected a threat as a major problem) |
||||||||||||||
|
What are the problems facing farmers/ranchers in your county? |
AL |
AR |
FL |
GA |
KY |
LA |
MS |
NC |
OK |
SC |
TN |
TX |
VA |
Total |
|
Farm labor |
34.5 |
31.3 |
28.0 |
17.9 |
55.8 |
26.3 |
31.0 |
41.8 |
43.8 |
37.1 |
28.6 |
20.0 |
46.5 |
35.6 |
|
Susceptibility to plant pests and diseases |
30.0 |
25.8 |
56.0 |
30.4 |
16.3 |
36.8 |
34.8 |
26.9 |
12.5 |
31.4 |
19.0 |
24.4 |
30.2 |
27.7 |
|
Adequacy of markets |
40.0 |
15.6 |
21.7 |
19.3 |
32.6 |
15.8 |
15.9 |
23.1 |
31.3 |
14.3 |
9.5 |
16.3 |
26.2 |
21.9 |
|
Population/development pressure |
31.0 |
12.5 |
47.8 |
29.1 |
20.9 |
10.5 |
10.0 |
44.9 |
18.8 |
31.4 |
26.2 |
25.6 |
39.5 |
27.1 |
|
Negative public opinion about farmchemical usage |
17.2 |
18.8 |
30.4 |
25.9 |
14.0 |
21.1 |
11.6 |
34.2 |
37.5 |
22.9 |
14.3 |
13.3 |
28.6 |
21.2 |
State specific differences occurred for problems such as “depletion of ground water” with TX and OK rating the problem much more seriously than other states and population/development pressure rated more seriously in FL, VA and NC.
Following are details from each state.
Alabama
How can Alabama agricultural research and extension be improved?
Tables 1-7 presents the 2015 survey data in more depth. Results from SOS1995 are available at: https://projects.sare.org/media/pdf/4/8/3/483southern-futures.pdf.
What is the state of Alabama in sustainable agriculture?
The surveys show the extent of various sustainable agriculture practices, current education programs and current research programs in Alabama.
Attitudes about sustainable agriculture. Table 1 shows the attitudes of Alabama respondents toward sustainable agriculture in comparison with other states.
Do you think farmers/ranchers in your county are practicing sustainable agriculture?
Alabama respondents ranked near the mean of all states with 61.3% saying yes.
Can farmer/ranchers produce enough food and fiber without using synthetic chemicals?
Alabama respondents answered yes more often than any other state with 41.9% saying yes.
Do you think sustainable agriculture is economical?
Alabama respondents answered yes more often than any other state at 71%.
Problems faced in helping farmers/ranchers implement sustainable practices. Table 2 shows the relative rankings of Alabama in comparison to other states regarding problems faced in helping farmers implement sustainable practices.
Alabama respondents ranked two areas as bigger problems than all others: national agricultural policy and lack of adequate funds. Lack of adequate funds was seen as the third biggest problem across all states, but no other state ranked national agricultural policy nearly as crucial a problem as Alabama respondents. Mean for all states was 23.9% while Alabama had 60% agreement.
Consistent with other states, the problems ranked lowest by Alabama respondents were that organizational priorities do not stress sustainable agriculture projects and lack of personal interest or disagreement with the sustainable agriculture concept.
Compared to 1995 results, more Alabama respondents in 2015 rated as more problematic national policy, state policy, and lack of opportunities to attend training in sustainable agriculture.
What education programs will be needed in the future? Table 3 shows the relative rankings of Alabama to other states on areas in need of additional education.
Alternative markets in 2015 ranked the highest in Alabama educational priorities (44.8%) just as it did in 1995 (52%). However, total sustainable farming systems, though in the middle of the pack in 1995, increased to virtually match (at 41.4%) alternative markets. Consumer education rose of from a low rank in 1995 (11%) to near the top in 2015 (31%). Expert computer systems for farm management continued to rank highly (27% in 1995 and 31% in 2015).
Increasing biological diversity was cited by 24% of participants in 2015 but ranked extremely low (only 5%) in 1995. Integrated pest management increased as an educational need from 27 to 34.5%. However, biological pest control, sank from 35% to just 6.9% in 2015.
Also sinking out of the top-ranked educational needs was improved animal waste management which scored only 3.4% in 2015 after being 25% in 1995.
Forest stewardship was cited as a need by 20.7%, increasing from 11% in 1995. Cover cropping and green manuring also ranked 20.7% in 2015, with an even bigger rise from 2% in 1995.
All other educational practices continued to be cited as a top educational priority by low percentages of respondents from Alabama.
What research is needed in the future in Alabama? Table 4 shows the relative rankings of Alabama to other states on areas in need of additional research.
Research needed matches closely with educational needs. In addition to the general need for profitability research, top specific priorities were alternative markets, total sustainable farming systems consumer education, and integrated pest management. These differed from 1995 when the top research priorities were alternative markets, integrated pest management, improved water management, manure distribution as fertilizer and expert computer systems for farm management.
The top two research priorities remained the same in Alabama from 1995 to 2015. The increased interest in consumer attitudes and behavior is seen across all states as is less interest in research in expert computer systems for farm management and manure distribution as fertilizer and improved water management.
Problems facing farmers and ranchers. Table 5 shows the percentage of respondents from Alabama who marked a problem as a major problem and compares the responses across states.
Adequacy of markets was the highest ranked problem facing Alabama farmers (40% of respondents chose it as a major problem). Farm labor was the second most serious problem (34.5%) with susceptibility to plant pests and disease (30%) rounding out the top three. Population/development pressure, farm profitability, overgrazing and reduced biological diversity were also in the top tier.
The top problems in 1995 were seen as adequacy of markets, susceptibility to plant pests and disease, and farm profitability.
Indicators of resilience. Table 6 shows the responses by state to various questions related to resilience not covered in previous question.
Across the South, processing commodities into products for sale was seen has having no or minimal participation by more than 87% of respondents. Only 3.1 percent felt participation was widespread in their county. Alabama had 6.7% of respondents in the widespread category. Only Florida was higher at 8%.
Adding value through on-farm processing, across the South, was thought widespread in only 2.2% of respondents with 86.9% marking minimal or no participation. Alabama has only 2% of counties with widespread participation, equaling the highest scores in any state.
Using direct marketing was perceived as widespread in 7% of counties with 63.9% having no or little participation. Alabama had 5% of counties in the widespread category, surpassed only by North Carolina and Mississippi.
Using multiple venues to market their goods was widespread in 10.3% of counties and had low or minimal participation in 59.3%. Alabama had 5% of counties in the widespread category, surpassed only by Kentucky and Mississippi.
Selling value-added products within 100 miles of the farm had no or minimal participation in71.8% of counties with 7% having widespread participation. Alabama had 5% of counties in the widespread category, surpassed only by Tennessee.
Participate in collaborative marketing with other farmers. Region-wide 4.3% see widespread participation in their counties while 75.9% saw no or minimal participation. Florida had 1% of respondents seeing widespread participation in their counties.
Sell only raw commodities. Region-wide 53.3% of respondents saw this nonresilient activity as widespread in their counties. In Alabama, only 29% saw this activity as widespread, making Alabama the most resilient state on this measure.
Increases in assets in the last 5 years was seen as widespread in 27.1% of counties. Alabama had 14.8% respondents seeing widespread occurrence in their counties. Only Florida registered fewer seeing widespread increase in assets.
Decreases in assets were seen as widespread in 5.2% of counties. Consistent with the previous question, only Florida registered more widespread decrease in assets than Alabama (7.1%).
Buying supplies and equipment from independent suppliers was widespread in 28.7% of counties and 27.7 had no or minimal participation. Widespread participation in this resilient activity was seen by only 16.7% of Alabama respondents, the lowest in all Southern States.
Detailed plans to ensure operation viability were widespread in 9.6% of counties and had no or minimal participation in 55.5%. Widespread participation in this resilient activity was seen by only 6.9 percent of Alabama respondents, well below the mean in the region and far below the 33.3% claimed in Oklahoma and the 20% in Mississippi
Growing the same crops or crop rotations was seen as widespread in 47.7% of counties and had no or minimal participation in 20.5% of counties. Widespread participation in this non-resilient activity was reported in 34.5% of Alabama respondents, which is lower than any other state in the South.
Changes in management practices in the past 5 years was seen as widespread in 8.6% of counties and no or minimal in 56.9%. This resilient practice was seen as widespread only by 3.3% of Alabama respondents. Only Florida was lower, with 0% seeing widespread participation in their counties.
Change in management structure in the past 5 years was seen as widespread in 3.7% of counties with no or minimal participation in 75.7%. Only 3.6% of Alabama respondents was this resilient activity as widespread in their counties.
Fate of farms after retirement: the redundancy quality of resilience. A crucial quality of resilience is the ability of the system to last when management changes. As the average age of farmers nears 60 across the South, many farms are facing the retirement of long-time operators. Table 7 presents the percentages from each state who thought a particular option was widespread in their county.
Alabama respondents overwhelmingly felt that “The farms will be broken up or sold for a non-agricultural use” was the mostly likely occurrence at 34.5%. Other choices ranged from 10.3 to 13.8%. Alabama had the most respondents of any state on this measure which reflects a highly non-resilient system on the redundancy quality. In addition, when conversion of farms to a hobby farm away from commercial use is included, the percentage rose to nearly half: 46.3%. Only 30.9 percent of farms were seen as continuing to operate as commercial farms.
Arkansas
How can Arkansas agricultural research and extension be improved?
Tables 1-7 presents the 2015 survey data in more depth. Results from SOS1995 are available at: https://projects.sare.org/media/pdf/4/8/3/483southern-futures.pdf.
What is the state of Arkansas in sustainable agriculture?
The surveys show the extent of various sustainable agriculture practices, current education programs and current research programs in Arkansas.
Attitudes about sustainable agriculture. Table 1 shows the attitudes of Arkansas respondents toward sustainable agriculture in comparison with other states.
Do you think farmers/ranchers in your county are practicing sustainable agriculture?
Arkansas respondents ranked near the mean of all states with 60.6% saying yes.
Can farmer/ranchers produce enough food and fiber without using synthetic chemicals?
Arkansas respondents ranked near the mean of all states with 18.8% answering yes.
Do you think sustainable agriculture is economical?
Arkansas respondents ranked near the mean of all states with 54.5% answering yes.
Problems faced in helping farmers/ranchers implement sustainable practices. Table 2 shows the relative rankings of Arkansas in comparison to other states regarding problems faced in helping farmers implement sustainable practices.
Arkansas respondents ranked one area as a bigger problems than respondents in any other state: lack of farmer/rancher interest (78.8%). The average for all states was 63.4%. Consistent with other states, lack of adequate funds was also seen as an important problem.
Also consistent with other states, the problems ranked lowest by Arkansas respondents were that organizational priorities do not stress sustainable agriculture projects and lack of personal interest or disagreement with the sustainable agriculture concept.
Compared to 1995 results, more Arkansas respondents in 2015 rated as more problematic national policy, state policy, and farmer/rancher interest.
Less problematic in 2015 than in 1995 were: organizational priorities, lack of time, lack of opportunities, and lack of knowledge of sustainable agriculture practices.
What education programs will be needed in the future? Table 3 shows the relative rankings of Arkansas to other states on areas in need of additional education.
The top specific priority in Arkansas in 2015 was consumer education (37.5%--up from 11% in 1995). Regional marketing systems and infrastructure (34.4%) ranked second. Respondents ranked it higher than in any other state. Alternative markets, on the other hand, was cited by 52% in 1995, but sank to 28.1% in 2015, still a top priority.
However, total sustainable farming systems, though lowly ranked (17%) in 1995, increased to match alternative markets at 28.1%.
Integrated pest management increased as an educational need from 13% to 25%. However, biological pest control, sank from 24% to just 6.3% in 2015. Also sinking out of the top-ranked educational needs was improved animal waste management which scored only 12.5% in 2015 after being 45% in 1995.
Cover cropping and green manuring showed an opposite trend, increasing to 21.9% in 2015, after being cited by only 16% in 1995.
Unique among the Southern states, Arkansas respondents ranked sprayer calibration and application highly in 2015 (28.1%) after being 15% in 1995. Arkansas ranked controlled grazing higher than any other state (21.9%) in 2015, though levels were reduced from the 24% of 1995.
Improved water management (draining and irrigation) also moved into the top tier (25%) with a slight improvement over 1995 (when it was 23%).
Reduced synthetic fertilizer and pesticide use had much reduced priority for Arkansas respondents in 2015.
All other educational practices continued to be cited as a top educational priority by low percentages of respondents from Arkansas.
What research is needed in the future in Arkansas? Table 4 shows the relative rankings of Arkansas to other states on areas in need of additional research. Research needed matches closely with educational needs. In addition to the general need for profitability research, the top eight specific priorities were alternative markets, total sustainable farming systems, integrated pest management, regional marketing systems and infrastructure, consumer education, controlled grazing, crop and livestock diversification, and cover cropping or green manuring.
These differed from 1995 when the top research priorities did not include the last five priorities and did include manure distribution for fertilizer, controlled grazing, improved water management, improved animal waste management and reduced synthetic fertilizer use.
The top two research priorities remained the same in Arkansas from 1995 to 2015.
Problems facing farmers and ranchers. Table 5 shows the percentage of respondents from Arkansas who marked a problem as a major problem and compares the responses across states.
Farm profitability was the highest ranked problem facing Arkansas farmers with farm labor and susceptibility to plant pests and disease also in the top tier.
The top problems in 1995 were seen as adequacy of markets, farm labor, susceptibility to plant pests and disease, and farm profitability.
Indicators of resilience. Table 6 shows the responses by state to various questions related to resilience not covered in previous question.
Across the South, processing commodities into products for sale was seen has having no or minimal participation by more than 87% of respondents. Only 3.1 percent felt participation was widespread in their county. Arkansas had 0% of respondents in the widespread category.
Adding value through on-farm processing, across the South, was thought widespread in only 2.2% of respondents with 86.9% marking minimal or no participation. Arkansas has 0% of counties with widespread participation.
Using direct marketing was perceived as widespread in 7% of counties with 63.9% having no or little participation. Arkansas had 2% of counties in the widespread category, which was both the median and mode for the region.
Using multiple venues to market their goods was widespread in 10.3% of counties and had low or minimal participation in 59.3%. Arkansas had 5% of counties in the widespread category, surpassed only by Kentucky and Mississippi.
Selling value-added products within 100 miles of the farm had no or minimal participation in71.8% of counties with 7% having widespread participation. Arkansas had 0% of counties in the widespread category, surpassed only by Tennessee.
Participate in collaborative marketing with other farmers. Region-wide 4.3% see widespread participation in their counties while 75.9% saw no or minimal participation. Arkansas had 1% of respondents seeing widespread participation in this resilient activity.
Sell only raw commodities. Region-wide 53.3% of respondents saw this nonresilient activity as widespread in their counties. Florida saw only 59.4% in the widespread category, higher than any states except Tennessee and Virginia.
Increases in assets in the last 5 years was seen as widespread in 27.1% of counties. Arkansas had 18.8% of respondents seeing widespread occurrence in their counties. Only Florida and Alabama registered fewer seeing widespread increase in assets.
Decreases in assets were seen as widespread in 5.2% of counties. About half the Southern states registered more widespread decrease in assets than Arkansas (6.3%).
Buying supplies and equipment from independent supplies was widespread in 28.7% of counties and 27.7 had no or minimal participation. Widespread participation in this resilient activity was seen by only 21.9% of Arkansas respondents, putting Arkansas below 6 Southern states.
Detailed plans to ensure operation viability were widespread in 9.6% of counties and had no or minimal participation in 55.5%. Widespread participation in this resilient activity was seen by only 12.5% percent of Arkansas respondents, well below the mean in the region and far below the 33.3% claimed in Oklahoma and the 20% in Mississippi
Growing the same crops or crop rotations was seen as widespread in 47.7% of counties and had no or minimal participation in 20.5% of counties. Widespread participation in this non-resilient activity was reported in 46.9% of Arkansas respondents, which is about average for Southern states.
Changes in management practices in the past 5 years was seen as widespread in 8.6% of counties and no or minimal in 56.9%. This resilient practice was seen as widespread only by 9.4% of Arkansas respondents, putting Arkansas in the top five of all Southern states.
Change in management structure in the past 5 years was seen as widespread in 3.7% of counties with no or minimal participation in 75.7%. Only 3.2% of Arkansas respondents was this resilient activity as widespread in their counties.
Fate of farms after retirement: the redundancy quality of resilience. A crucial quality of resilience is the ability of the system to last when management changes. As the average age of farmers nears 60 across the South, many farms are facing the retirement of long-time operators. Table 7 presents the percentages from each state who thought a particular fate was widespread in their county.
The highest ranked category for Arkansas respondents was “the farm will be leased to a neighboring farmer or rancher” at 21.2%. Percentage were roughly equal for farms which would continue of commercial operation and those which would leave commercial operation. So nearly half of Arkansas farms are seen as very non-resilient on this measure.
Florida
How can Florida agricultural research and extension be improved?
Tables 1-7 presents the 2015 survey data in more depth. Results from SOS1995 are available at: https://projects.sare.org/media/pdf/4/8/3/483southern-futures.pdf.
What is the state of Florida in sustainable agriculture?
The surveys show the extent of various sustainable agriculture practices, current education programs and current research programs in Florida.
Attitudes about sustainable agriculture. Table 1 shows the attitudes of Florida respondents toward sustainable agriculture in comparison with other states.
Do you think farmers/ranchers in your county are practicing sustainable agriculture?
Florida respondents were more than 15% below the mean of all states with 47.8% saying yes.
Can farmer/ranchers produce enough food and fiber without using synthetic chemicals?
Florida respondents ranked near the mean of all states with 16.7% answering yes.
Do you think sustainable agriculture is economical?
Florida respondents ranked near the mean of all states with 52.5% answering yes.
Problems faced in helping farmers/ranchers implement sustainable practices. Table 2 shows the relative rankings of Florida in comparison to other states regarding problems faced in helping farmers implement sustainable practices.
Florida respondents felt the biggest problem was lack of adequate funds (68% compared to region mean of 53.4%) and they ranked this area as more problematic than any other state, though all states rated it as one of the biggest constraints. The second worst problem according to Florida respondents was lack of farmer rancher interest (60%, region mean of 63.4%).
Also consistent with other states, the problems ranked lowest by Florida respondents were that organizational priorities do not stress sustainable agriculture projects and lack of personal interest or disagreement with the sustainable agriculture concept.
Compared to 1995 results, more Florida respondents in 2015 rated as more problematic only one area: lack of personal knowledge and experience.
What education programs will be needed in the future? Table 8 shows the relative rankings of Florida to other states on areas in need of additional education.
The top specific priority in Florida in 2015 was integrated pest management with a score of 47.8% (virtually unchanged from 48% in 1995). Next was total sustainable farming systems (34.8%), though ranked higher at 58% in 1995.
Reduced synthetic fertilizer and pesticide use had much reduced priority for Florida respondents in 2015 (moving from 53 and 45% respectively in 1995 to 26.1 and 17.4% in 2015).
Also sinking out of the top-ranked educational needs was biological pest control which sank from 53% in 1995 to 13% in 2015.
Cover cropping and green manuring showed an opposite trend, increasing to 21.7% in 2015, after being cited by only 8% in 1995.
Improved water management (draining and irrigation) also was in the top tier (21.7%) though with a big decline from 1995 (when it was 44%).
Aggregation, distribution and marketing system were also a highly ranked priority with 21.7%.
All other educational practices continued to be cited as a top educational priority by low percentages of respondents from Florida.
What research is needed in the future in Florida? Table 8 shows the relative rankings of Florida to other states on areas in need of additional research.
The top specific research areas were alternative markets, total sustainable farming systems, integrated pest management, regional marketing systems and infrastructure, and reduced synthetic pesticide use, reduced synthetic fertilizer use, improved water management techniques, biological pest control, and cover cropping and green manures.
Compared to twenty years ago, research priorities have remained much the same, though crop and livestock diversification, manure distribution as fertilizer and consumer behavior have dropped out of the top priorities since 1995.
Consistent with other states is the emphasis on research in alternative markets, total sustainable agricultural systems research, regional marketing systems and infrastructure, and integrated pest management. However, reduced synthetic pesticide use and reduced synthetic fertilizer use were only high priorities in one other state (South Carolina) and biological pest control only in Louisiana. Florida ranks water management as a higher research need than any other state.
Problems facing farmers and ranchers. Table 5 shows the percentage of respondents from Florida who marked a problem as a major problem and compares the responses across states.
Susceptibility to plant pests and disease was the highest ranked problem facing Florida farmers with population/development pressure a close second. Profitability and negative public opinion about farm chemical usage were also in the top tier of Florida problems.
The top problems in 1995 were seen as farm labor, susceptibility to plant pests and disease, and farm profitability.
Indicators of resilience. Table 6 shows the responses by state to various questions related to resilience not covered in previous question.
Across the South, processing commodities into products for sale was seen has having no or minimal participation by more than 87% of respondents. Only 3.1 percent felt participation was widespread in their county. Florida had 8% of respondents in the widespread category, leading all Southern states in this indicator of resilience.
Adding value through on-farm processing, across the South, was thought widespread in only 2.2% of respondents with 86.9% marking minimal or no participation. Florida has 2% of counties with widespread participation in this indicator of resilience.
Using direct marketing was perceived as widespread in 7% of counties with 63.9% having no or little participation. Florida had 1% of counties in the widespread category, which was the lowest score in all Southern states.
Using multiple venues to market their goods was widespread in 10.3% of counties and had low or minimal participation in 59.3%. Florida had 2% of counties in the widespread category, among the lowest of all Southern states.
Selling value-added products within 100 miles of the farm had no or minimal participation in71.8% of counties with 7% having widespread participation. Florida had 2% of counties in the widespread category, among the lowest of all Southern states.
Participate in collaborative marketing with other farmers. Region-wide 4.3% see widespread participation in their counties while 75.9% saw no or minimal participation. Florida had 0% of respondents seeing widespread participation in their counties.
Sell only raw commodities. Region-wide 53.3% of respondents saw this non-resilient activity as widespread in their counties. Florida saw only 37.5 in the widespread category, lower than any state except Alabama.
Increases in assets in the last 5 years was seen as widespread in 27.1% of counties. Florida had 14.3% of respondents seeing widespread occurrence in their counties. Only Alabama registered fewer seeing widespread increase in assets, an indicator of resilience.
Decreases in assets were seen as widespread in 5.2% of counties. No other Southern state registered more widespread decrease in assets than Florida (9.5%), an indicator of lack of resilience.
Buying supplies and equipment from independent supplies was widespread in 28.7% of counties and 27.7 had no or minimal participation. Widespread participation in this resilient activity was seen by only 22.7% of Florida respondents, putting Florida below about half of Southern states on this measure of resilience.
Detailed plans to ensure operation viability were widespread in 9.6% of counties and had no or minimal participation in 55.5%. Widespread participation in this resilient activity was seen by only 17.4% percent of Florida respondents, below only the 33.3% claimed in Oklahoma and the 20% in Mississippi on this measure of resilience.
Growing the same crops or crop rotations was seen as widespread in 47.7% of counties and had no or minimal participation in 20.5% of counties. Widespread participation in this non-resilient activity was reported by 48% of Florida respondents, which is about average for Southern states.
Changes in management practices in the past 5 years was seen as widespread in 8.6% of counties and no or minimal in 56.9%. This resilient practice was seen as widespread only by 8.7% of Florida respondents, putting Florida in the middle of all Southern states.
Change in management structure in the past 5 years was seen as widespread in 3.7% of counties with no or minimal participation in 75.7%. None of Florida respondents felt this resilient activity was widespread in their counties.
Fate of farms after retirement: the redundancy quality of resilience. A crucial quality of resilience is the ability of the system to last when management changes. As the average age of farmers nears 60 across the South, many farms are facing the retirement of long-time operators. Table 7 presents the percentages from each state who thought a particular fate was widespread in their county.
The highest ranked category for Florida respondents was “the farms will be broken up or sold for a non-agricultural use at 24%. Percentages were roughly equal for farms which would continue of commercial operation and those which would leave commercial operation. So nearly half of Florida farms are seen as very non-resilient on this measure.
Georgia
How can Georgia agricultural research and extension be improved?
Tables 1-7 presents the 2015 survey data in more depth. Results from SOS1995 are available at: https://projects.sare.org/media/pdf/4/8/3/483southern-futures.pdf.
What is the state of Georgia in sustainable agriculture?
The surveys show the extent of various sustainable agriculture practices, current education programs and current research programs in Georgia.
Attitudes about sustainable agriculture. Table 1 shows the attitudes of Georgia respondents toward sustainable agriculture in comparison with other states.
Do you think farmers/ranchers in your county are practicing sustainable agriculture?
Georgia respondents ranked near the mean of all states with 66.7% answering yes.
Can farmer/ranchers produce enough food and fiber without using synthetic chemicals?
Georgia respondents ranked near the mean of all states with 15.8% answering yes.
Do you think sustainable agriculture is economical?
Georgia respondents ranked near the mean of all states with 50.9% answering yes.
Problems faced in helping farmers/ranchers implement sustainable practices. Table 2 shows the relative rankings of Georgia in comparison to other states regarding problems faced in helping farmers implement sustainable practices.
Georgia respondents felt the biggest problem was lack of adequate funds which all states rated it as one of the biggest constraints. The second worst problem according to Georgia respondents was lack of a clear definition of sustainable agriculture (49.1%), followed closely by lack of farmer rancher interest (45.6%).
Also consistent with other states, the problems ranked lowest by Georgia respondents were that organizational priorities do not stress sustainable agriculture projects and lack of personal interest or disagreement with the sustainable agriculture concept.
Compared to 1995 results, more Georgia respondents in 2015 rated as more problematic two areas: state agricultural policy (31.6% in 2015 vs. 26% in 1995) and lack of personal knowledge and experience (38.6% in 2015 compared to 14% in 1995).
What education programs will be needed in the future? Table 3
The top specific priority in Georgia in 2015 was alternative markets with a score of 40.4% (though a bit lower from 57% in 1995). Next was total sustainable farming systems (38.6%), which also ranked higher at 42% in 1995.
Integrated pest management was also very highly ranked at 33.3%, virtually unchanged from 35% in 1995.
Aggregation, distribution and marketing systems, regional marketing systems and infrastructure, and consumer education were also highly ranked priorities in Georgia with 28.1, 28.1 and 26.3% respectively. Consumer education was also highly ranked in 1995 at 24%.
Improved animal waste management, improved water management, expert computer systems for farm management and biological pest control were highly ranked in 1995, but ranked near the bottom in 2015.
All other educational practices continued to be cited as a top educational priority by low percentages of respondents from Georgia.
What research is needed in the future in Georgia? Table 4 shows the relative rankings of Georgia to other states on areas in need of additional research.
Top specific research priorities in Georgia are largely consistent with educational priorities. Alternative markets, total sustainable farming systems, integrated pest management, consumer behavior, aggregation, distribution and marketing systems and regional marketing systems and highly ranked in both research and education.
However, crop and livestock diversification, polyculture farming and controlled grazing are high research priorities and not high education priorities.
In comparison to 1995, manure distribution as fertilizer, reduced synthetic pesticide use and conservation tillage have dropped out of the top research priorities.
Problems facing farmers and ranchers. Table 5 shows the percentage of respondents from Georgia who marked a problem as a major problem and compares the responses across states.
Profitability and susceptibility to plant pests and disease were the highest ranked problems facing Georgia farmers with population/development pressure and negative public opinion about farm chemical usage also in the top tier of Georgia problems.
The top problems in 1995 were seen as adequacy of markets, farm labor, susceptibility to plant pests and disease, and farm profitability.
Indicators of resilience. Table 6 shows the responses by state to various questions related to resilience not covered in previous question.
Across the South, processing commodities into products for sale was seen has having no or minimal participation by more than 87% of respondents. Only 3.1 percent felt participation was widespread in their county. Georgia had 0% of respondents in the widespread category of this indicator of resilience.
Adding value through on-farm processing, across the South, was thought widespread in only 2.2% of respondents with 86.9% marking minimal or no participation. Georgia had 0% of counties with widespread participation in this indicator of resilience.
Using direct marketing was perceived as widespread in 7% of counties with 63.9% having no or little participation. Georgia had 2% of counties in the widespread category, which was the among the lowest scores in all Southern states.
Using multiple venues to market their goods was widespread in 10.3% of counties and had low or minimal participation in 59.3%. Georgia had 3% of counties in the widespread category, near the median of all Southern states.
Selling value-added products within 100 miles of the farm had no or minimal participation in71.8% of counties with 7% having widespread participation. Georgia had 3% of counties in the widespread category, near the median of all Southern states.
Participate in collaborative marketing with other farmers. Region-wide 4.3% see widespread participation in their counties while 75.9% saw no or minimal participation. Georgia had 1% of respondents seeing widespread participation in their counties on this measure of resilience.
Sell only raw commodities. Region-wide 53.3% of respondents saw this non-resilient activity as widespread in their counties. Georgia saw 54.4% in the widespread category, near the median of Southern counties.
Increases in assets in the last 5 years was seen as widespread in 27.1% of counties. Georgia had 25% of respondents seeing widespread occurrence in their counties, near the median of Southern counties on this indicator of resilience.
Decreases in assets were seen as widespread in 5.2% of counties. Georgia had 3.5% of respondents seeing widespread occurrence in their counties, the second lowest of Southern states on this indicator of lack of resilience.
Buying supplies and equipment from independent supplies was widespread in 28.7% of counties and 27.7 had no or minimal participation. Widespread participation in this resilient activity was seen by only 21.1% of Georgia respondents, putting Georgia below about half of Southern states on this measure of resilience.
Detailed plans to ensure operation viability were widespread in 9.6% of counties and had no or minimal participation in 55.5%. Widespread participation in this resilient activity was seen by only 10.5% percent of Georgia respondents, below only the 33.3% claimed in Oklahoma and the 20% in Mississippi on this measure of resilience.
Growing the same crops or crop rotations was seen as widespread in 47.7% of counties and had no or minimal participation in 20.5% of counties. Widespread participation in this non-resilient activity was reported by 54.5% of Georgia respondents, which is a bit above average for Southern states.
Changes in management practices in the past 5 years was seen as widespread in 8.6% of counties and no or minimal in 56.9%. This resilient practice was seen as widespread only by 5.3% of Georgia respondents, putting Georgia in the lower third of all Southern states.
Change in management structure in the past 5 years was seen as widespread in 3.7% of counties with no or minimal participation in 75.7%. 3.5% Georgia respondents felt this resilient activity was widespread in their counties.
Fate of farms after retirement: the redundancy quality of resilience. A crucial quality of resilience is the ability of the system to last when management changes. As the average age of farmers nears 60 across the South, many farms are facing the retirement of long-time operators. Table 7 presents the percentages from each state who thought a particular fate was widespread in their county.
The highest ranked category for Georgia respondents was “the farms will be broken up or sold for a non-agricultural use at 24%. Percentages were roughly equal for farms which would continue of commercial operation and those which would leave commercial operation. So nearly half of Georgia farms are seen as very non-resilient on this measure.
Kentucky
How can Kentucky agricultural research and extension be improved?
Tables 1-7 presents the 2015 survey data in more depth. Results from SOS1995 are available at: https://projects.sare.org/media/pdf/4/8/3/483southern-futures.pdf.
What is the state of Kentucky in sustainable agriculture?
The surveys show the extent of various sustainable agriculture practices, current education programs and current research programs in Kentucky.
Attitudes about sustainable agriculture. Table 1 shows the attitudes of Kentucky respondents toward sustainable agriculture in comparison with other states.
Do you think farmers/ranchers in your county are practicing sustainable agriculture?
Kentucky respondents ranked near the mean of all states with 63.2% answering yes.
Can farmer/ranchers produce enough food and fiber without using synthetic chemicals?
Kentucky respondents ranked near the mean of all states with 15.8% answering yes.
Do you think sustainable agriculture is economical?
Kentucky respondents ranked near the mean of all states with 54% answering yes.
Problems faced in helping farmers/ranchers implement sustainable practices. Table 2 shows the relative rankings of Kentucky in comparison to other states regarding problems faced in helping farmers implement sustainable practices.
Kentucky respondents felt the biggest problem was lack of farmer rancher interest (67.4%) followed closely by lack of a clear definition of sustainable agriculture (62.8%). Lack of adequate funds, though rated as third worst constraint in Kentucky was not as seen as as big a problem in Kentucky (43%) as in other states (regional mean: 53.4%). Only South Carolina ranked adequate funds as less a problem than Kentucky.
Also consistent with other states, the problems ranked lowest by Kentucky respondents were that organizational priorities do not stress sustainable agriculture projects and lack of personal interest or disagreement with the sustainable agriculture concept.
Compared to 1995 results, more Kentucky respondents in 2015 rated as more problematic two areas: national agricultural policy (22.1% in 2015 vs. 15% in 1995), state agricultural policy (26.7% in 2015 vs. 11% in 1995), and lack of personal knowledge and experience (27.9% in 2015 compared to 17% in 1995).
What education programs will be needed in the future? Table 3 shows the relative rankings of Kentucky to other states on areas in need of additional education.
The top specific priority in Kentucky in 2015 was alternative markets with a score of 50.6% (though a bit lower from 53% in 1995). Next was total sustainable farming systems (42.4%), which was an increase from 28% in 1995.
Consumer education was also highly ranked in Kentucky with 38.8% up from 22% in 1995.
Crop and livestock diversification (25.9%, slightly reduced from 28% in 1995)), regional marketing systems and infrastructure (22.4%). controlled grazing (21.2%, slightly reduced from 26% in 1995) and cover cropping and green manuring (20%, up from 5% in 1995) were also highly ranked.
Improved animal waste management, improved water management, expert computer systems for farm management and biological pest control were highly ranked in 1995, but ranked near the bottom in 2015.
All other educational practices continued to be cited as a top educational priority by lower percentages of respondents from Kentucky.
What research is needed in the future in Kentucky? Table 4 shows the relative rankings of Kentucky to other states on areas in need of additional research.
Top specific research priorities in Kentucky are largely consistent with educational priorities. Alternative markets, total sustainable farming systems, consumer behavior, controlled grazing and regional marketing systems and crop and livestock diversification are all highly ranked in both research and education.
In comparison to 1995, research priorities were largely the same, though biological pest control dropped out of the top tier in research priority and controlled grazing has moved up in priority.
Problems facing farmers and ranchers. Table 5 shows the percentage of respondents from Kentucky who marked a problem as a major problem and compares the responses across states.
Farm labor was seen as near twice as serious as any other problem in Kentucky with a score above all other states. Profitability, overgrazing and population/development pressure made up the rest of the top tier in Kentucky Unlike most states, susceptibility to plant pests and disease was not seen as being in the top rank of problems.
As in most states, the top problems in Kentucky in 1995 were seen as adequacy of markets, farm labor, susceptibility to plant pests and disease, and farm profitability.
Indicators of resilience. Table 6 shows the responses by state to various questions related to resilience not covered in previous question.
Across the South, processing commodities into products for sale was seen has having no or minimal participation by more than 87% of respondents. Only 3.1 percent felt participation was widespread in their county. Kentucky had 3.5% of respondents in the widespread category of this indicator of resilience.
Adding value through on-farm processing, across the South, was thought widespread in only 2.2% of respondents with 86.9% marking minimal or no participation. Kentucky had 1% of counties with widespread participation in this indicator of resilience.
Using direct marketing was perceived as widespread in 7% of counties with 63.9% having no or little participation. Kentucky had 1% of counties in the widespread category, which was the among the lowest scores in all Southern states.
Using multiple venues to market their goods was widespread in 10.3% of counties and had low or minimal participation in 59.3%. Kentucky had 11% of counties in the widespread category, tied with North Carolina at the top of this indicator of resilience.
Selling value-added products within 100 miles of the farm had no or minimal participation in71.8% of counties with 7% having widespread participation. Kentucky had 1% of counties in the widespread category, the lowest score on this measure of resilience in the Southern states.
Participate in collaborative marketing with other farmers. Region-wide 4.3% see widespread participation in their counties while 75.9% saw no or minimal participation. Kentucky had 0% of respondents seeing widespread participation in their counties on this measure of resilience.
Sell only raw commodities. Region-wide 53.3% of respondents saw this non-resilient activity as widespread in their counties. Kentucky saw 58.8% in the widespread category, near the median of Southern counties.
Increases in assets in the last 5 years was seen as widespread in 27.1% of counties. Kentucky had 51.8% of respondents seeing widespread occurrence in their counties, the highest of all Southern states on this indicator of resilience.
Decreases in assets were seen as widespread in 5.2% of counties. Kentucky had 3.6% of respondents seeing widespread occurrence in their counties, near the lowest of Southern states on this indicator of lack of resilience.
Buying supplies and equipment from independent supplies was widespread in 28.7% of counties and 27.7 had no or minimal participation. Widespread participation in this resilient activity was seen by only 36% of Kentucky respondents, putting Kentucky in the top third of Southern states on this measure of resilience.
Detailed plans to ensure operation viability were widespread in 9.6% of counties and had no or minimal participation in 55.5%. Widespread participation in this resilient activity was seen by only 3.5% percent of Kentucky respondents, the lowest of all Southern states and far below the 33.3% claimed in Oklahoma and the 20% in Mississippi on this measure of resilience.
Growing the same crops or crop rotations was seen as widespread in 47.7% of counties and had no or minimal participation in 20.5% of counties. Widespread participation in this non-resilient activity was reported by 50% of Kentucky respondents, which is a bit above average for Southern states.
Changes in management practices in the past 5 years was seen as widespread in 8.6% of counties and no or minimal in 56.9%. This resilient practice was seen as widespread only by 13.1% of Kentucky respondents, putting Kentucky the second highest of all Southern states.
Change in management structure in the past 5 years was seen as widespread in 3.7% of counties with no or minimal participation in 75.7%. 3.5% Kentucky respondents felt this resilient activity was widespread in their counties.
Fate of farms after retirement: the redundancy quality of resilience. A crucial quality of resilience is the ability of the system to last when management changes. As the average age of farmers nears 60 across the South, many farms are facing the retirement of long-time operators. Table 7 presents the percentages from each state who thought a particular fate was widespread in their county.
The highest ranked category for Kentucky respondents was “the farms will be broken up or sold for a non-agricultural use at 28.7%. Percentages were roughly equal for farms which would continue of commercial operation and those which would leave commercial operation. So nearly half of Kentucky farms are seen as very non-resilient on this measure.
Louisiana
How can Louisiana agricultural research and extension be improved?
Tables 1-7 presents the 2015 survey data in more depth. Results from SOS1995 are available at: https://projects.sare.org/media/pdf/4/8/3/483southern-futures.pdf.
What is the state of Louisiana in sustainable agriculture?
The surveys show the extent of various sustainable agriculture practices, current education programs and current research programs in Louisiana.
Attitudes about sustainable agriculture. Table 1 shows the attitudes of Louisiana respondents toward sustainable agriculture in comparison with other states.
Do you think farmers/ranchers in your county are practicing sustainable agriculture?
Louisiana respondents ranked near the mean of all states with 63.2% answering yes.
Can farmer/ranchers produce enough food and fiber without using synthetic chemicals?
Louisiana respondents had the lowest percentage of all states responding yes with 5.3%.
Do you think sustainable agriculture is economical?
Louisiana respondents ranked above the mean of all states with 57.9% answering yes.
Problems faced in helping farmers/ranchers implement sustainable practices. Table 2 shows the relative rankings of Louisiana in comparison to other states regarding problems faced in helping farmers implement sustainable practices.
Louisiana respondents felt the biggest problem was lack of farmer rancher interest (73.7%). Only Arkansas and Tennessee rated this as a bigger problem. This problem outdistanced all other by nearly 30 percentage points. Lack of funds and lack of opportunity for training (both 47.4%) were the second highest ranking problems, followed closely by lack of a clear definition of sustainable agriculture (42.1%).
Also consistent with other states, the problems ranked lowest by Louisiana respondents were that organizational priorities do not stress sustainable agriculture and lack of personal interest or disagreement with the sustainable agriculture concept.
Compared to 1995 results, more Louisiana respondents in 2015 rated as more problematic two areas: national agricultural policy (31.6% in 2015 vs. 19% in 1995), state agricultural policy (31.6% in 2015 vs. 14% in 1995), lack of farmer interest (73.7% in 2015 vs.68% in 1995) and lack of opportunities to attend sustainable agriculture training (47.4% in 2015 compared to 35% in 1995).
What education programs will be needed in the future? Table 3 shows the relative rankings of Louisiana to other states on areas in need of additional education.
The top specific priority in Louisiana in 2015 was aggregation, distribution and marketing systems with a score of 42.1%. Next was total sustainable farming systems (42.1%), which was an increase from 41% in 1995.
Consumer education was also highly ranked in Louisiana with 31.6% up from 14% in 1995.
Regional marketing systems and infrastructure (26.3%), integrated pest management (also 26.3%, but reduced from 41% in 1995) and cultural pest control (21.1% in 2015 up from 14% in 1995) were also cited by more than 20% of respondents.
Those dropping out of the top tier in Louisiana included: expert computers systems for farm management (dropped from 22% in 1995 to 10.5% in 2015), conservation tillage (dropped from 24% to 5.3%) and reduced synthetic pesticide use (from 22% to 0%).
All other educational practices continued to be cited as a top educational priority by lower percentages of respondents from Louisiana.
What research is needed in the future in Louisiana? Table 4 shows the relative rankings of Louisiana to other states on areas in need of additional research.
Research priorities are largely consistent with education priorities with the top tier including aggregation, distribution and marketing systems, total sustainable farming systems, consumer attitudes and behavior, regional marketing systems and infrastructure, and integrated pest management.
Manure distribution as fertilizer, improved water management techniques and biological pest control, however, are seen as top research priorities but not in education.
The 1995 top research priorities included all the 2015 priorities except manure distribution as fertilizer and the new research areas (aggregation, distribution and marketing systems, and regional marketing systems and infrastructure) added in the 2015 survey. The 1995 research priorities also included conservation tillage which ranked at the bottom of Louisiana research priorities in 2015.
Problems facing farmers and ranchers. Table 5 shows the percentage of respondents from Louisiana who marked a problem as a major problem and compares the responses across states.
Susceptibility to plant pests and disease, farm labor, profitability, and negative public opinion about farm chemical usage were seen as the most serious problems in Louisiana.
As in most states, the top problems in Louisiana in 1995 were seen as adequacy of markets, farm labor, susceptibility to plant pests and disease, and farm profitability.
Indicators of resilience. Table 6 shows the responses by state to various questions related to resilience not covered in previous question.
Across the South, processing commodities into products for sale was seen has having no or minimal participation by more than 87% of respondents. Only 3.1 percent felt participation was widespread in their county. Louisiana had 0% of respondents in the widespread category of this indicator of resilience.
Adding value through on-farm processing, across the South, was thought widespread in only 2.2% of respondents with 86.9% marking minimal or no participation. Louisiana had 0% of counties with widespread participation in this indicator of resilience.
Using direct marketing was perceived as widespread in 7% of counties with 63.9% having no or little participation. Louisiana had 2% of counties in the widespread category, which was the among the lowest scores in all Southern states.
Using multiple venues to market their goods was widespread in 10.3% of counties and had low or minimal participation in 59.3%. Louisiana had 0% of counties in the widespread category for this indicator of resilience.
Selling value-added products within 100 miles of the farm had no or minimal participation in71.8% of counties with 7% having widespread participation. Louisiana had 4% of counties in the widespread category, near the average score on this measure of resilience in the Southern states.
Participate in collaborative marketing with other farmers. Region-wide 4.3% see widespread participation in their counties while 75.9% saw no or minimal participation. Louisiana had 2% of respondents seeing widespread participation in their counties on this measure of resilience.
Sell only raw commodities. Region-wide 53.3% of respondents saw this non-resilient activity as widespread in their counties. Louisiana saw 42.1% in the widespread category, more resilient than all states except Alabama and Florida.
Increases in assets in the last 5 years was seen as widespread in 27.1% of counties. Louisiana had 10.5% of respondents seeing widespread occurrence in their counties, the lowest of all Southern states on this indicator of resilience.
Decreases in assets were seen as widespread in 5.2% of counties. Louisiana had 5.6% of respondents seeing widespread occurrence in their counties, among the worst four Southern states on this indicator of lack of resilience.
Buying supplies and equipment from independent supplies was widespread in 28.7% of counties and 27.7 had no or minimal participation. Widespread participation in this resilient activity was seen by only 21.1% of Louisiana respondents, putting Louisiana among the three lowest of Southern states on this measure of resilience.
Detailed plans to ensure operation viability were widespread in 9.6% of counties and had no or minimal participation in 55.5%. Widespread participation in this resilient activity was seen by only 5.6% percent of Louisiana respondents, among the lowest of all Southern states and far below the 33.3% claimed in Oklahoma and the 20% in Mississippi on this measure of resilience.
Growing the same crops or crop rotations was seen as widespread in 47.7% of counties and had no or minimal participation in 20.5% of counties. Widespread participation in this non-resilient activity was reported by 52.6% of Louisiana respondents, which is a bit above average for Southern states.
Changes in management practices in the past 5 years was seen as widespread in 8.6% of counties and no or minimal in 56.9%. This resilient practice was seen as widespread only by 0% of Louisiana respondents, putting Louisiana at the bottom of all Southern states.
Change in management structure in the past 5 years was seen as widespread in 3.7% of counties with no or minimal participation in 75.7%. No Louisiana respondents felt this resilient activity was widespread in their counties.
Fate of farms after retirement: the redundancy quality of resilience. A crucial quality of resilience is the ability of the system to last when management changes. As the average age of farmers nears 60 across the South, many farms are facing the retirement of long-time operators. Table 7 presents the percentages from each state who thought a particular fate was widespread in their county.
The highest ranked category for Louisiana respondents was “the farm will be leased to a neighboring farmer or rancher” at 47.4%. This outcome was uniquely high among Southern states. Percentages were roughly three times higher that farms continue in commercial operation than leave commercial operation. So more than ¾ of Louisiana farms are seen as resilient on this measure.
Mississippi
How can Mississippi agricultural research and extension be improved?
Tables 1-7 presents the 2015 survey data in more depth. Results from SOS1995 are available at: https://projects.sare.org/media/pdf/4/8/3/483southern-futures.pdf.
What is the state of Mississippi in sustainable agriculture?
The surveys show the extent of various sustainable agriculture practices, current education programs and current research programs in Mississippi.
Attitudes about sustainable agriculture. Table 1 shows the attitudes of Mississippi respondents toward sustainable agriculture in comparison with other states.
Do you think farmers/ranchers in your county are practicing sustainable agriculture?
Mississippi respondents ranked slightly below the mean of all states (63.7%) with 57.7% answering yes.
Can farmer/ranchers produce enough food and fiber without using synthetic chemicals?
Mississippi respondents ranked below the mean of all states (17.2%) with 12.7 responding yes.
Do you think sustainable agriculture is economical?
Mississippi respondents were nearly 17 percentage points below the mean of all states (51.4%) with 33.8% answering yes.
Problems faced in helping farmers/ranchers implement sustainable practices. Table 2 shows the relative rankings of Mississippi in comparison to other states regarding problems faced in helping farmers implement sustainable practices.
Consistent with most other states, Mississippi respondents felt the biggest problem was lack of farmer rancher interest (70%). This problem outdistanced all other by nearly 30 percentage points. Lack of funds and lack of a clear definition of sustainable agriculture (both 52.9%) were also ranked highly as problems, also consistent with other states.
Also consistent with other states, the problems ranked lowest by Mississippi respondents were that organizational priorities do not stress sustainable agriculture and lack of personal interest or disagreement with the sustainable agriculture concept. In contrast to all other states, however, Mississippi respondents seed national agricultural policy as the least of all the problems.
Consistent with many other states, lack of personal knowledge/experience in sustainable agriculture increased as a problem for Mississippi respondents in 2015 (38.6%) compared to 1995 (13%).
What education programs will be needed in the future? Table 3 shows the relative rankings of Mississippi to other states on areas in need of additional education.
The top specific priority in Mississippi in 2015 was alternative markets at 38% (though lower than the 58% of 1995. Total sustainable agriculture farming systems continued to rank highly as an education priority with 31%, though also reduced from 1995 (40%). Consumer education was also highly ranked in Mississippi with 28.6% up from 12% in 1995.
Also cited as high priorities by more than 20% of Mississippi respondents were regional marketing systems and infrastructure (22.5%), integrated pest management and crop and livestock diversification (both 22.5% but both down from 30% and 27% respectively), forest stewardship at 21.1% (up from 19%) and improved water management (also 21.2% and up from 18%)
Dropping out of the top tier in Mississippi was expert computers systems for farm management (reduced from 25% in 1995 to 14.1% in 2015).
All other educational practices continued to be cited as a top educational priority by lower percentages of respondents from Mississippi.
What research is needed in the future in Mississippi? Table 4 shows the relative rankings of Mississippi to other states on areas in need of additional research.
As in most other Southern states, alternative markets is the top research priority with total sustainable farming systems, consumer attitudes and behavior and regional marketing systems also in the top tier. and infrastructure. Along with Florida, Texas, Arkansas and Mississippi, Mississippi also ranks improved water management as a research priority.
Of these 2015 priorities, only alternative markets has been a priority since 1995.
Three top education priorities, crop and livestock diversification, integrated pest management, forest stewardship have dropped out of the top tier of research priorities. Other priorities in 1995 which are no longer top priorities today are crop rotation and manure distribution as fertilizer.
Problems facing farmers and ranchers. Table 5 shows the percentage of respondents from Mississippi who marked a problem as a major problem and compares the responses across states.
Susceptibility to plant pests and disease and farm labor were seen as the most serious problems in Mississippi. However, in contrast to most states, soil acidity was seen in 2015 as belonging in the top tier of problems.
As in most states, the top problems in Mississippi in 1995 were seen as adequacy of markets, farm labor, susceptibility to plant pests and disease, and farm profitability.
Indicators of resilience. Table 6 shows the responses by state to various questions related to resilience not covered in previous question.
Across the South, processing commodities into products for sale was seen has having no or minimal participation by more than 87% of respondents. Only 3.1 percent felt participation was widespread in their county. Mississippi had 3% of respondents in the widespread category of this indicator of resilience.
Adding value through on-farm processing, across the South, was thought widespread in only 2.2% of respondents with 86.9% marking minimal or no participation. Mississippi had 2% of counties with widespread participation in this indicator of resilience.
Using direct marketing was perceived as widespread in 7% of counties with 63.9% having no or little participation. Mississippi had 6% of counties in the widespread category, which was second, below only North Carolina, on this measure of resilience.
Using multiple venues to market their goods was widespread in 10.3% of counties and had low or minimal participation in 59.3%. Mississippi had 8% of counties in the widespread category for this indicator of resilience, below only Kentucky and North Carolina.
Selling value-added products within 100 miles of the farm had no or minimal participation in71.8% of counties with 7% having widespread participation. Mississippi had 1% of counties in the widespread category, a low score on this measure of resilience in the Southern states.
Participate in collaborative marketing with other farmers. Region-wide 4.3% see widespread participation in their counties while 75.9% saw no or minimal participation. Mississippi had 2% of respondents seeing widespread participation in their counties on this measure of resilience.
Sell only raw commodities. Region-wide 53.3% of respondents saw this non-resilient activity as widespread in their counties. Mississippi saw 53.5% in the widespread category.
Increases in assets in the last 5 years was seen as widespread in 27.1% of counties. Mississippi had 29.6% of respondents seeing widespread occurrence in their counties.
Decreases in assets were seen as widespread in 5.2% of counties. Mississippi had 4.3% of respondents seeing widespread occurrence in their counties.
Buying supplies and equipment from independent supplies was widespread in 28.7% of counties and 27.7 had no or minimal participation. Widespread participation in this resilient activity was seen by only 22.5% of Mississippi respondents, putting Mississippi among the lowest half of Southern states on this measure of resilience.
Detailed plans to ensure operation viability were widespread in 9.6% of counties and had no or minimal participation in 55.5%. Widespread participation in this resilient activity was seen by 20% percent of Mississippi respondents, among the highest of all Southern states, below only the 33.3% claimed in Oklahoma on this measure of resilience.
Growing the same crops or crop rotations was seen as widespread in 47.7% of counties and had no or minimal participation in 20.5% of counties. Widespread participation in this non-resilient activity was reported by 37.1% of Mississippi respondents, which among the best scores on this measure of non-resilience. Only Alabama was better.
Changes in management practices in the past 5 years was seen as widespread in 8.6% of counties and no or minimal in 56.9%. This resilient practice was seen as widespread by 14.1% of Mississippi respondents, putting Mississippi as the highest of all Southern states.
Change in management structure in the past 5 years was seen as widespread in 3.7% of counties with no or minimal participation in 75.7%. Seven per cent of Mississippi respondents felt this resilient activity was widespread in their counties, giving Mississippi the highest score on this measure.
Fate of farms after retirement: the redundancy quality of resilience. A crucial quality of resilience is the ability of the system to last when management changes. As the average age of farmers nears 60 across the South, many farms are facing the retirement of long-time operators. Table 7 presents the percentages from each state who thought a particular fate was widespread in their county.
The highest ranked category for Mississippi respondents was “the farm will be leased to a neighboring farmer or rancher” at 23.9. More than twice as many respondents felt that the most widespread outcome in their county was that farms which would continue of commercial operation compared to which would leave commercial operation. So two thirds of Mississippi farms are seen as resilient on this factor.
North Carolina
How can North Carolina agricultural research and extension be improved?
Tables 1-7 presents the 2015 survey data in more depth. Results from SOS1995 are available at: https://projects.sare.org/media/pdf/4/8/3/483southern-futures.pdf.
What is the state of North Carolina in sustainable agriculture?
The surveys show the extent of various sustainable agriculture practices, current education programs and current research programs in North Carolina.
Attitudes about sustainable agriculture. Table 1 shows the attitudes of North Carolina respondents toward sustainable agriculture in comparison with other states.
Do you think farmers/ranchers in your county are practicing sustainable agriculture?
North Carolina respondents had the highest percentage of all states (80%) answering yes, with the mean of all states being 63.7%.
Can farmer/ranchers produce enough food and fiber without using synthetic chemicals?
North Carolina respondents had the lowest percentage of all states (11.4%) answering yes, while the average of all states was 17.2%.
Do you think sustainable agriculture is economical?
North Carolina respondents were very close to the mean of all states (51.4%) with 53.2% answering yes.
Problems faced in helping farmers/ranchers implement sustainable practices. Table 2 shows the relative rankings of North Carolina in comparison to other states regarding problems faced in helping farmers implement sustainable practices.
Consistent with most other states, North Carolina respondents felt the biggest problem was lack of farmer rancher interest (61%). Lack of funds (57.1%) and lack of a clear definition of sustainable agriculture (both 58.4%) were also ranked highly as problems, also consistent with other states.
Also consistent with other states, the problems ranked lowest by North Carolina respondents were that organizational priorities do not stress sustainable agriculture and lack of personal interest or disagreement with the sustainable agriculture concept.
Consistent with many other states, lack of personal knowledge/experience in sustainable agriculture increased as a problem for North Carolina respondents in 2015 (28.6%) compared to 1995 (6%). All other problems were felt to be declining or staying the same over the 20 years.
What education programs will be needed in the future? Table 3 shows the relative rankings of North Carolina to other states on areas in need of additional education.
The top specific priority in North Carolina in 2015 was alternative markets at 54.5% (increased from the 41% of 1995. Total sustainable agriculture farming systems continued to rank highly as an education priority with 32.5%, though also reduced from 1995 (43%).
Also cited as high priorities by more than 20% of North Carolina respondents were integrated pest management and consumer education each at 28.6%, up from 12 and 27% in 1995.
Regional marketing systems and infrastructure (38.6%) and aggregation, distribution and marketing systems (24.7) were also seen as high priorities by North Carolinians.
Dropping out of the top tier of North Carolina education priorities were reduced pesticide and fertilizer usage, cultural and biological pest control, conservation tillage and animal waste management.
All other educational practices continued to be cited as a top educational priority by lower percentages of respondents from North Carolina.
What research is needed in the future in North Carolina? Table 4 shows the relative rankings of North Carolina to other states on areas in need of additional research.
Consistent with other states, research on alternative markets it the top research priority at 44.3%, but nearly beaten by regional marketing systems and infrastructure at 40.5%. Aggregation, distribution and marketing systems (27.8%) and consumer attitudes and behavior (26.6%) followed. Total sustainable farming systems and integrated pest management were picked by 24.1%. Crop and livestock diversification rounded out the top tier with 20.3%
These research priorities for North Carolina are very consistent with education priorities.
In 1995, alternative markets was also the highest priority as it was in all Southern states. Consumer behavior also continues as a top priority from 1995. However, all other top priority research areas have changed. Those dropping out of the top tier of research priorities in North Carolina include conservation tillage, improved animal waste management, and controlled grazing.
Problems facing farmers and ranchers. Table 5 shows the percentage of respondents from North Carolina who marked a problem as a major problem and compares the responses across states.
Population/development pressure was the highest ranked problem facing North Carolina farmers with farm labor second. Susceptibility to plant pests, profitability, and negative public opinion about farm chemical usage were also in the top tier of North Carolina problems.
As in most states, the top problems in North Carolina in 1995 were seen as adequacy of markets, farm labor, susceptibility to plant pests and disease, and farm profitability.
Indicators of resilience. Table 6 shows the responses by state to various questions related to resilience not covered in previous questions.
Across the South, processing commodities into products for sale was seen has having no or minimal participation by more than 87% of respondents. Only 3.1 percent felt participation was widespread in their county. North Carolina had 1% of respondents in the widespread category of this indicator of resilience.
Adding value through on-farm processing, across the South, was thought widespread in only 2.2% of respondents with 86.9% marking minimal or no participation. North Carolina had 1% of counties with widespread participation in this indicator of resilience.
Using direct marketing was perceived as widespread in 7% of counties with 63.9% having no or little participation. North Carolina had 8% of counties in the widespread category, which the highest score of all states on this measure of resilience.
Using multiple venues to market their goods was widespread in 10.3% of counties and had low or minimal participation in 59.3%. North Carolina had 11% of counties in the widespread category for this indicator of resilience, tied for highest score with Kentucky and North Carolina.
Selling value-added products within 100 miles of the farm had no or minimal participation in71.8% of counties with 7% having widespread participation. North Carolina had 4% of counties in the widespread category, a median score on this measure of resilience in the Southern states.
Participate in collaborative marketing with other farmers. Region-wide 4.3% see widespread participation in their counties while 75.9% saw no or minimal participation. North Carolina had 1% of respondents seeing widespread participation in their counties on this measure of resilience.
Sell only raw commodities. Region-wide 53.3% of respondents saw this non-resilient activity as widespread in their counties. North Carolina saw 57.5% in the widespread category, indicating a slightly worse score on resilience than the average Southern state.
Increases in assets in the last 5 years was seen as widespread in 27.1% of counties. North Carolina had 15.2% of respondents seeing widespread occurrence in their counties, putting it in the bottom three states on this measure of resilience.
Decreases in assets were seen as widespread in 5.2% of counties. North Carolina had 5.1% of respondents seeing widespread occurrence in their counties.
Buying supplies and equipment from independent supplies was widespread in 28.7% of counties and 27.7 had no or minimal participation. Widespread participation in this resilient activity was seen by only 36.3% of North Carolina respondents, putting North Carolina in the highest four Southern states on this measure of resilience.
Detailed plans to ensure operation viability were widespread in 9.6% of counties and had no or minimal participation in 55.5%. Widespread participation in this resilient activity was seen by 5.8% percent of North Carolina respondents, second lowest of all states, far below the 33.3% claimed in Oklahoma on this measure of resilience.
Growing the same crops or crop rotations was seen as widespread in 47.7% of counties and had no or minimal participation in 20.5% of counties. Widespread participation in this non-resilient activity was reported by 47.5% of North Carolina respondents, which among the top half of scores on this measure of non-resilience.
Changes in management practices in the past 5 years was seen as widespread in 8.6% of counties and no or minimal in 56.9%. This resilient practice was seen as widespread only by 5.1% of North Carolina respondents, putting North Carolina in the bottom three of all Southern states.
Change in management structure in the past 5 years was seen as widespread in 3.7% of counties with no or minimal participation in 75.7%. 3.6% of North Carolina respondents felt this resilient activity was widespread in their counties, giving North Carolina an average score on this measure.
Fate of farms after retirement: the redundancy quality of resilience. A crucial quality of resilience is the ability of the system to last when management changes. As the average age of farmers nears 60 across the South, many farms are facing the retirement of long-time operators. Table 7 presents the percentages from each state who thought a particular option was widespread in their county.
North Carolina respondents overwhelmingly felt that “The farms will be broken up or sold for a non-agricultural use” was the mostly likely occurrence at 31.6%. Other choices ranged from 10.3 to 13.8%. North Carolina had the second most respondents of any state on this measure which reflects a highly non-resilient system on the redundancy quality. North Carolina respondents felt leaving commercial farming was just as widespread as any of the options which continue farming commercially.
Oklahoma
How can Oklahoma agricultural research and extension be improved?
Tables 1-7 presents the 2015 survey data in more depth. Results from SOS1995 are available at: https://projects.sare.org/media/pdf/4/8/3/483southern-futures.pdf.
What is the state of Oklahoma in sustainable agriculture?
The surveys show the extent of various sustainable agriculture practices, current education programs and current research programs in Oklahoma.
Attitudes about sustainable agriculture. Table 1 shows the attitudes of Oklahoma respondents toward sustainable agriculture in comparison with other states.
Do you think farmers/ranchers in your county are practicing sustainable agriculture?
Oklahoma respondents were more than 7% below the mean percentage of all states (63.7%) with 56.3% answering yes.
Can farmer/ranchers produce enough food and fiber without using synthetic chemicals?
Oklahoma respondents had the second lowest percentage of all states (12.54%) answering yes, while the average of all states was 17.2%. Only Texas had a lower percentage of yes responses.
Do you think sustainable agriculture is economical?
Oklahoma respondents were very close to the mean of all states (51.4%) with 56.3% answering yes.
Problems faced in helping farmers/ranchers implement sustainable practices. Table 2 shows the relative rankings of Oklahoma in comparison to other states regarding problems faced in helping farmers implement sustainable practices.
Consistent with most other states, Oklahoma respondents felt the biggest problem was lack of farmer rancher interest (68.8%). Lack of funds (56.3%) and lack of a clear definition of sustainable agriculture (50%) were also ranked highly as problems, as seen in most other states in the region.
Also consistent with other states, the problems ranked lowest by Oklahoma respondents were that organizational priorities do not stress sustainable agriculture and lack of personal interest or disagreement with the sustainable agriculture concept.
Consistent with many other states, lack of personal knowledge/experience in sustainable agriculture increased as a problem for Oklahoma respondents in 2015 (25%) compared to 1995 (21%). However, the increase was of lower magnitude than in other states. All other problems were felt to be declining or staying the same over the 20 years.
What education programs will be needed in the future? Table 3 shows the relative rankings of Oklahoma to other states on areas in need of additional education.
The top specific priorities in Oklahoma in 2015 were controlled grazing and consumer education (each at 43.8% compared to 23 and 21% in 1995) and crop and livestock diversification (37.5%, up from 25% in 1995). Aggregation, distribution and marketing systems (31.3) was also seen as high priorities.
Two educational programs not highly ranked in other states were multiple species grazing (25%, up from 5%) and expert computer systems for farm management (25%, up from 18%).
Dropping out of the top tier of Oklahoma education priorities were alternative markets (from 57 in 1995 to 18.8 in 2015), integrated pest management (down from 48 to 18.8%) and integration of crops and livestock (down from 26% to 12.5%).
All other educational practices continued to be cited as a top educational priority by lower percentages of respondents from Oklahoma.
What research is needed in the future in Oklahoma? Table 4 shows the relative rankings of Oklahoma to other states on areas in need of additional research.
In Oklahoma, alternative markets (picked by 25%), as in all other states, is a high research priority. However it is not the top ranked research area. Instead, controlling grazing (50%) is the top priority, unique to Oklahoma. Total farming systems (37.5%), crop and livestock diversification (31.3%) also rank above alternative markets. Unlike other states where it has dropped out of the top priorities, expert computer systems for farm management (31.2%) also ranks above alternative markets. Multiple species grazing (25%) ranks high in Oklahoma, though not in other states. Regional marketing systems and infrastructure also ranks highly at 25%.
Compared with 1995, alternative marketing has declined in priority, but the largest declines were in consumer behavior (which dropped from 26 to 6.3%) and integration of crop and livestock (dropping from 25 to 12.5%). The largest increase in priority was controlled grazing, up from 25% in 1995. Other priorities remained in the same range as in 1995.
Problems facing farmers and ranchers. Table 5 shows the percentage of respondents from Oklahoma who marked a problem as a major problem and compares the responses across states.
Oklahoma was unique in citing overgrazing as the top problem in the state and depletion of groundwater in the top problems. Only in Texas did the latter crack the top teir. Farm labor came in second. Profitability, negative public opinion about farm chemical usage, and farm labor were also in the top tier of Oklahoma problems.
As in most states, the top problems in Oklahoma in 1995 included adequacy of markets, susceptibility to plant pests and disease, and farm profitability. However, unlike other states, overgrazing was also in the top tier.
Indicators of resilience. Table 6 shows the responses by state to various questions related to resilience not covered in previous questions.
Across the South, processing commodities into products for sale was seen has having no or minimal participation by more than 87% of respondents. Only 3.1 percent felt participation was widespread in their county. Oklahoma had 1% of respondents in the widespread category of this indicator of resilience.
Adding value through on-farm processing, across the South, was thought widespread in only 2.2% of respondents with 86.9% marking minimal or no participation. Oklahoma had 1% of counties with widespread participation in this indicator of resilience.
Using direct marketing was perceived as widespread in 7% of counties with 63.9% having no or little participation. Oklahoma had 1% of counties in the widespread category, the lowest score of all states on this measure of resilience.
Using multiple venues to market their goods was widespread in 10.3% of counties and had low or minimal participation in 59.3%. Oklahoma had 1% of counties in the widespread category for this indicator of resilience, tied for the lowest score.
Selling value-added products within 100 miles of the farm had no or minimal participation in71.8% of counties with 7% having widespread participation. Oklahoma had 1% of counties in the widespread category, a low score on this measure of resilience in the Southern states.
Participate in collaborative marketing with other farmers. Region-wide 4.3% see widespread participation in their counties while 75.9% saw no or minimal participation. Oklahoma had 0% of respondents seeing widespread participation in their counties on this measure of resilience.
Sell only raw commodities. Region-wide 53.3% of respondents saw this non-resilient activity as widespread in their counties. Oklahoma saw 56.3% in the widespread category, indicating a slightly worse score on resilience than the average Southern state.
Increases in assets in the last 5 years was seen as widespread in 27.1% of counties. Oklahoma had 20% of respondents seeing widespread occurrence in their counties, putting it in the bottom half of states on this measure of resilience.
Decreases in assets were seen as widespread in 5.2% of counties. Oklahoma had 6.7% of respondents seeing widespread occurrence in their counties.
Buying supplies and equipment from independent supplies was widespread in 28.7% of counties and 27.7 had no or minimal participation. Widespread participation in this resilient activity was seen by only 43.8% of Oklahoma respondents, putting Oklahoma as the top Southern state on this measure of resilience.
Detailed plans to ensure operation viability were widespread in 9.6% of counties and had no or minimal participation in 55.5%. Widespread participation in this resilient activity was seen by 33.3% of Oklahoma respondents, making Oklahoma the top state on this measure of resilience.
Growing the same crops or crop rotations was seen as widespread in 47.7% of counties and had no or minimal participation in 20.5% of counties. Widespread participation in this non-resilient activity was reported by 50% of Oklahoma respondents, which among the least resilient half of states on this measure of non-resilience.
Changes in management practices in the past 5 years was seen as widespread in 8.6% of counties and no or minimal in 56.9%. This resilient practice was seen as widespread only by 6.3% of Oklahoma respondents, putting Oklahoma in the lower half of all Southern states.
Change in management structure in the past 5 years was seen as widespread in 3.7% of counties with no or minimal participation in 75.7%. None of Oklahoma respondents felt this resilient activity was widespread in their counties.
Fate of farms after retirement: the redundancy quality of resilience. A crucial quality of resilience is the ability of the system to last when management changes. As the average age of farmers nears 60 across the South, many farms are facing the retirement of long-time operators. Table 7 presents the percentages from each state who thought a particular option was widespread in their county.
Oklahoma respondents were evenly split among the various alternatives for farms after retimement. Slight more felt farms in their county would continue as commercial production operations compared to non-commercial outcomes. Thus, respondents in Oklahoma felt farms in their counties were slightly more resilient on this quality of resilience—redundancy.
South Carolina
How can South Carolina agricultural research and extension be improved?
Tables 1-7 presents the 2015 survey data in more depth. Results from SOS1995 are available at: https://projects.sare.org/media/pdf/4/8/3/483southern-futures.pdf.
What is the state of South Carolina in sustainable agriculture?
The surveys show the extent of various sustainable agriculture practices, current education programs and current research programs in South Carolina.
Attitudes about sustainable agriculture. Table 1 shows the attitudes of South Carolina respondents toward sustainable agriculture in comparison with other states.
Do you think farmers/ranchers in your county are practicing sustainable agriculture?
South Carolina respondents had the second highest percentage of all states with 77.8% answering yes compared to the state average of (63.7%). Only South Carolina was slightly higher.
Can farmer/ranchers produce enough food and fiber without using synthetic chemicals?
South Carolina’s percentage of yes responses (16.7%) was very close to the average of all states (17.2%).
Do you think sustainable agriculture is economical?
South Carolina’s percentage of yes responses (57.9%) was higher than that of all states except Alabama and Louisiana. The mean of all states was 51.4%.
Problems faced in helping farmers/ranchers implement sustainable practices. Table 2 shows the relative rankings of South Carolina in comparison to other states regarding problems faced in helping farmers implement sustainable practices.
Consistent with most other states, South Carolina respondents felt the biggest problem was lack of farmer rancher interest (57.1%). Lack of a clear definition of sustainable agriculture (51.4%) was the second worst problem. Lack of funds and time (both 42.9) were also ranked highly as problems, as seen in most other states in the region.
Also consistent with other states, the problem ranked lowest by South Carolina respondents were that organizational priorities was lack of personal interest or disagreement with the sustainable agriculture concept.
Inconsistent with many other states, state agricultural policy was seen as an increasing problem by South Carolina respondents in 2015 compared to 1995. All other problems were felt to be declining or staying the same over the 20 years.
What education programs will be needed in the future? Table 3 shows the relative rankings of South Carolina to other states on areas in need of additional education.
The top specific priorities in South Carolina in 2015 was alternative markets with 40% of respondents listing it as a priority for educational efforts. This was down from 1995’s figure of 51%.
Total sustainable farming systems ranked second at 34.3%, though also down from 1995’s figure of 42%
Cover cropping or green manure consumer education also ranked highly in South Carolina (each at 28.6% compared to 0 and 23% in 1995). Reduced synthetic pesticide use also rose to 25.7 from 17% and reduced synthetic fertilizer use to 22.9 from 21%. Regional marketing systems also scored in the top tier with 22.9%.
Rounding out the education programs with more than 20% of respondents favoring increased emphasis was crop rotation at 20%, up from 14%.
Dropping out of the top tier of South Carolina education priorities were improved water management, expert computer systems for farm management, crop and livestock diversification and integrated pest management.
All other educational practices continued to be cited as a top educational priority by lower percentages of respondents from South Carolina.
What research is needed in the future in South Carolina? Table 4 shows the relative rankings of South Carolina to other states on areas in need of additional research.
The top research priority, consistent with most Southern states, was alternative markets (33.3%).
Though most states saw an increase in priority for cover cropping and green manure research, South Carolina showed the highest relative ranking with 30.6% placing it second. Also highly ranked were consumer attitudes and behavior (27.8%), regional marketing systems and infrastructure, total sustainable farming systems and integrated pest management--all seen as a priority by 25% of respondents. Crop and livestock diversification and reduced synthetic pesticide use rounded out the top tier with 22.2%.
Educational priorities were very consistent with research priorities with the exception of reduced fertilizer and pesticide use and crop rotation not being top research priorities in South Carolina.
Since 1995, conservation tillage has dropped out of the top research priorities (from 21 to 8.3%), as has manure distribution as fertilizer (to 8.3 from 23%) and biological pest control (declining from 28% to 8.3%).
Those research areas with the largest increases in priority were cover cropping and green manures (which was only 9% in 1995) total sustainable farming systems (up from 13% in 1995) and consumer behavior (up from 16% in 1995).
Problems facing farmers and ranchers. Table 5 shows the percentage of respondents from South Carolina who marked a problem as a major problem and compares the responses across states.
Population/development pressure, farm labor, farm profitability, and susceptibility to plant pests and diseases were the top problems in South Carolina.
As in most states, the top problems in South Carolina in 1995 were adequacy of markets, susceptibility to plant pests and disease, farm labor, and farm profitability.
Indicators of resilience. Table 6 shows the responses by state to various questions related to resilience not covered in previous questions.
Across the South, processing commodities into products for sale was seen has having no or minimal participation by more than 87% of respondents. Only 3.1 percent felt participation was widespread in their county. South Carolina had 1% of respondents in the widespread category of this indicator of resilience.
Adding value through on-farm processing, across the South, was thought widespread in only 2.2% of respondents with 86.9% marking minimal or no participation. South Carolina had 1% of counties with widespread participation in this indicator of resilience.
Using direct marketing was perceived as widespread in 7% of counties with 63.9% having no or little participation. South Carolina had 4% of counties in the widespread category, which was an average score on this measure of resilience.
Using multiple venues to market their goods was widespread in 10.3% of counties and had low or minimal participation in 59.3%. South Carolina had 8% of counties in the widespread category for this indicator of resilience, putting it in the top four states.
Selling value-added products within 100 miles of the farm had no or minimal participation in71.8% of counties with 7% having widespread participation. South Carolina had 4% of counties in the widespread category, a median score on this measure of resilience in the Southern states.
Participate in collaborative marketing with other farmers. Region-wide 4.3% see widespread participation in their counties while 75.9% saw no or minimal participation. South Carolina had 1% of respondents seeing widespread participation in their counties on this measure of resilience.
Sell only raw commodities. Region-wide 53.3% of respondents saw this non-resilient activity as widespread in their counties. South Carolina saw 52.8% in the widespread category, indicating a better score on resilience than the average Southern state.
Increases in assets in the last 5 years was seen as widespread in 27.1% of counties. South Carolina had 33.3% of respondents seeing widespread occurrence in their counties, making South Carolina the top state on this measure of resilience.
Decreases in assets were seen as widespread in 5.2% of counties. South Carolina had 5.6% of respondents seeing widespread occurrence in their counties.
Buying supplies and equipment from independent supplies was widespread in 28.7% of counties and 27.7 had no or minimal participation. Widespread participation in this resilient activity was seen by 41.7% of South Carolina respondents, putting South Carolina as the second best of Southern states on this measure of resilience.
Detailed plans to ensure operation viability were widespread in 9.6% of counties and had no or minimal participation in 55.5%. Widespread participation in this resilient activity was seen by 5.6% percent of South Carolina respondents, among the lowest of all states, far below the 33.3% claimed in Oklahoma on this measure of resilience.
Growing the same crops or crop rotations was seen as widespread in 47.7% of counties and had no or minimal participation in 20.5% of counties. Widespread participation in this non-resilient activity was reported by 47.2% of South Carolina respondents, which among is the top half of scores on this measure of non-resilience.
Changes in management practices in the past 5 years was seen as widespread in 8.6% of counties and no or minimal in 56.9%. This resilient practice was seen as widespread only by 8.6% of South Carolina respondents, putting South Carolina at the middle of all Southern states.
Change in management structure in the past 5 years was seen as widespread in 3.7% of counties with no or minimal participation in 75.7%. 5.7% of South Carolina respondents felt this resilient activity was widespread in their counties, giving South Carolina the second highest average score on this measure.
Fate of farms after retirement: the redundancy quality of resilience. A crucial quality of resilience is the ability of the system to last when management changes. As the average age of farmers nears 60 across the South, many farms are facing the retirement of long-time operators. Table 7 presents the percentages from each state who thought a particular option was widespread in their county.
South Carolina respondents felt that “the farms will be broken up or sold for a non-agricultural use” was the mostly likely occurrence at 25.7%. However, because no one saw conversion to hobby farms as widespread in South Carolina, conversion to non-commercial uses was seen as less widespread than the various options for remaining in operation.
Tennessee
How can Tennessee agricultural research and extension be improved?
Tables 1-7 presents the 2015 survey data in more depth. Results from SOS1995 are available at: https://projects.sare.org/media/pdf/4/8/3/483southern-futures.pdf.
What is the state of Tennessee in sustainable agriculture?
The surveys show the extent of various sustainable agriculture practices, current education programs and current research programs in Tennessee.
Attitudes about sustainable agriculture. Table 1 shows the attitudes of Tennessee respondents toward sustainable agriculture.
Do you think farmers/ranchers in your county are practicing sustainable agriculture?
Tennessee’s percentage of yes responses (59.5%) was close to the average of all states (63.7%).
Can farmer/ranchers produce enough food and fiber without using synthetic chemicals?
Tennessee’s percentage of yes responses (21.4%) was slightly higher than the average of all states (17.2%).
Do you think sustainable agriculture is economical?
Tennessee’s percentage of yes responses (42.9%) was lower than that of all states except Mississippi. The mean of all states was 51.4%.
Problems faced in helping farmers/ranchers implement sustainable practices. Table 2 shows the relative rankings of Tennessee in comparison to other states regarding problems faced in helping farmers implement sustainable practices.
Consistent with most other states, Tennessee respondents felt the biggest problem was lack of farmer rancher interest (80.5%--the highest ranking of all the states). Lack of a clear definition of sustainable agriculture (68.3%) was the second worst problem. Lack of funds (65.9%) was also ranked highly as problems, as seen in most other states in the region.
Also consistent with other states, the problem ranked lowest by Tennessee respondents was lack of personal interest or disagreement with the sustainable agriculture concept.
Consistent with many other states, lack of knowledge/experience in sustainable agriculture was seen as an increasing problem by Tennessee respondents in 2015 (39%) compared to 1995 (13%). In contrast to other states, Tennessee respondents also saw several other problems increasing over the 20 years. Increasing the most were lack of clear definition, lack of farmer interest, and lack of adequate funds.
What education programs will be needed in the future? Table 3 shows the relative rankings of Tennessee to other states on areas in need of additional education.
The top specific priority in Tennessee in 2015 was total sustainable farming systems at 40.5%, though down from 1995’s figure of 44%. Alternative markets with 38.1% of respondents listing it as a priority was second in Tennesse for educational efforts. This was down from 1995’s figure of 49%.
Cover cropping or green manure rose to 31% from 13% in 1995. Regional marketing systems also scored in the top tier with 22.9%.
Improved water management and controlled grazing each scored 21.4, compared to 13 and 20% respectively in 1995.
Rounding out the education programs with more than 20% of respondents favoring increased emphasis was crop rotation at 20%, up from 11%.
Dropping out of the top tier of Tennessee education priorities were forest stewardship, crop and livestock diversification, reduced synthetic fertilizer use and conservation tillage.
All other educational practices continued to be cited as a top educational priority by lower percentages of respondents from Tennessee.
What research is needed in the future in Tennessee? Table 4 shows the relative rankings of Tennessee to other states on areas in need of additional research.
Total sustainable farming systems was the top research priority in Tennesse, with 31%. Cover cropping or green manures, controlled grazing, alternative markets tied for second at 28.6%. Regional marketing systems and infrastructure (26.2%), reduced synthetic fertilizer use (21.4%) and manure distribution as fertilizer (21.4%) completed those priorities in the top tier (above 20% of respondents choosing as priority research area).
Tennessee ranked only behind Arkansas in priority for cover crop and green manure research, though all states showed strong increases over 1995. In contrast, reduced synthetic pesticide use, biological pest control, integrated pest management, crop and livestock diversification, improved animal waste management, and consumer behavior all were in the top tier in 1995, but not in 2015.
Problems facing farmers and ranchers. Table 5 shows the percentage of respondents from Tennessee who marked a problem as a major problem and compares the responses across states.
Tennessee was unique in noting the same top four problems in 2015 as in 1995: adequacy of markets, susceptibility to plant pests and disease, farm labor, and farm profitability.
Indicators of resilience. Table 6 shows the responses by state to various questions related to resilience not covered in previous questions.
Across the South, processing commodities into products for sale was seen has having no or minimal participation by more than 87% of respondents. Only 3.1 percent felt participation was widespread in their county. Tennessee had 2% of respondents in the widespread category of this indicator of resilience.
Adding value through on-farm processing, across the South, was thought widespread in only 2.2% of respondents with 86.9% marking minimal or no participation. Tennessee had 1% of counties with widespread participation in this indicator of resilience.
Using direct marketing was perceived as widespread in 7% of counties with 63.9% having no or little participation. Tennessee had 2% of counties in the widespread category, which was a low score on this measure of resilience.
Using multiple venues to market their goods was widespread in 10.3% of counties and had low or minimal participation in 59.3%. Tennessee had 3% of counties in the widespread category for this indicator of resilience, putting it in the lowest Southern states.
Selling value-added products within 100 miles of the farm had no or minimal participation in71.8% of counties with 7% having widespread participation. Tennessee had 6% of counties in the widespread category, the highest score on this measure of resilience in the Southern states.
Participate in collaborative marketing with other farmers. Region-wide 4.3% see widespread participation in their counties while 75.9% saw no or minimal participation. Tennessee had 1% of respondents seeing widespread participation in their counties on this measure of resilience.
Sell only raw commodities. Region-wide 53.3% of respondents saw this non-resilient activity as widespread in their counties. Tennessee saw 66.7% in the widespread category, putting Tennessee in a tie with Virginia for the worst score on this resilience indicator in all Southern state.
Increases in assets in the last 5 years was seen as widespread in 27.1% of counties. Tennessee had 24.4% of respondents seeing widespread occurrence in their counties, making Tennessee among the top states on this measure of resilience.
Decreases in assets were seen as widespread in 5.2% of counties. Tennessee had 2.4% of respondents seeing widespread occurrence in their counties.
Buying supplies and equipment from independent supplies was widespread in 28.7% of counties and 27.7 had no or minimal participation. Widespread participation in this resilient activity was seen by 33.3% of Tennessee respondents, putting Tennessee among the top four Southern states on this measure of resilience.
Detailed plans to ensure operation viability were widespread in 9.6% of counties and had no or minimal participation in 55.5%. Widespread participation in this resilient activity was seen by 4.9% percent of Tennessee respondents, among the lowest of all states, far below the 33.3% claimed in Oklahoma on this measure of resilience.
Growing the same crops or crop rotations was seen as widespread in 47.7% of counties and had no or minimal participation in 20.5% of counties. Widespread participation in this non-resilient activity was reported by 61.9% of Tennessee respondents, which ties with Virginia as the least resilient on this measure.
Changes in management practices in the past 5 years was seen as widespread in 8.6% of counties and no or minimal in 56.9%. This resilient practice was seen as widespread by 11.9% of Tennessee respondents, putting Tennessee in the top three of all Southern states.
Change in management structure in the past 5 years was seen as widespread in 3.7% of counties with no or minimal participation in 75.7%. 4.9% of Tennessee respondents felt this resilient activity was widespread in their counties, giving Tennessee the third highest average score on this measure.
Fate of farms after retirement: the redundancy quality of resilience. A crucial quality of resilience is the ability of the system to last when management changes. As the average age of farmers nears 60 across the South, many farms are facing the retirement of long-time operators. Table 7 presents the percentages from each state who thought a particular fate was widespread in their county.
The highest ranked category for Tennessee respondents was “the farm will be leased to a neighboring farmer or rancher” at 34.1%. Tennessee was second highest for this outcome among Southern states. This high percentage contributed to Tennessee joining Mississippi and Louisiana as the states with the highest ration of farm continuing in commercial operation compared to those leaving commercial operation.
Texas
How can Texas agricultural research and extension be improved?
Tables 1-7 presents the 2015 survey data in more depth. Results from SOS1995 are available at: https://projects.sare.org/media/pdf/4/8/3/483southern-futures.pdf.
What is the state of Texas in sustainable agriculture?
The surveys show the extent of various sustainable agriculture practices, current education programs and current research programs in Texas.
Attitudes about sustainable agriculture. Table 1 shows the attitudes of Texas respondents toward sustainable agriculture.
Do you think farmers/ranchers in your county are practicing sustainable agriculture?
Texas’s percentage of yes responses (40%) was the lowest of all states. Mean of all states was 63.7%.
Can farmer/ranchers produce enough food and fiber without using synthetic chemicals?
Texas’s percentage of yes responses (31.1%) was higher than all states except Alabama. The average of all states was 17.2%.
Do you think sustainable agriculture is economical?
Texas’s percentage of yes responses (53.3%) near the mean of all states (51.4%).
Problems faced in helping farmers/ranchers implement sustainable practices. Table 2 shows the relative rankings of Texas in comparison to other states regarding problems faced in helping farmers implement sustainable practices.
Consistent with most other states, Texas respondents felt the biggest problem was lack of farmer rancher interest (66.7%). Lack of a clear definition of sustainable agriculture and lack of funds (both at 51.1%) were also ranked highly as problems, as seen in most other states in the region.
Also consistent with other states, the problem ranked lowest by Texas respondents was lack of personal interest or disagreement with the sustainable agriculture concept.
Consistent with many other states, lack of knowledge/experience in sustainable agriculture was seen as an increasing problem by Texas respondents in 2015 (26.7%) compared to 1995 (6%). Consistent with other states, Texas respondents’ perception of other areas as problems decreased or remained much the same over the 20 years.
What education programs will be needed in the future? Table 3 shows the relative rankings of Texas to other states on areas in need of additional education.
The top specific priority in Texas in 2015 was total sustainable farming systems at 46.7%, up from 1995’s figure of 44%. Alternative markets with 44.4% of respondents listing it as a priority was second in Texas for educational efforts. This was down from 1995’s figure of 49%.
Consumer education came in at 28.9 up from 16%.
Cover cropping or green manure rose to 24.4% from 13% in 1995. Integrated pest management and improved water management both scored 22.2, up from 19 and 18% respectively.
Dropping out of the top tier of Texas education priorities were crop and livestock diversification, forest stewardship, controlled grazing, reduced synthetic fertilizer use and conservation tillage.
All other educational practices continued to be cited as a top educational priority by lower percentages of respondents from Texas.
What research is needed in the future in Texas? Table 4 shows the relative rankings of Texas to other states on areas in need of additional research.
Similar to many other states, the top specific priority for research according to Texas respondents was alternative markets (42.2%) with total sustainable farming systems close behind at 40%.
Texas respondents ranked crop and livestock diversification (37.8%) much higher than other Southern states as a research priority. Both controlled grazing and consumer attitudes and behavior ranked at 26.7%. Also included in top priorities were regional marketing systems and infrastructure (24.4%) and improved water management (22.2%).
Twenty years earlier only the top two priorities of 2015 and improved water management were top rated. Dropping out of the top tier were integrated pest management and integration of crops and livestock.
Problems facing farmers and ranchers. Table 5 shows the percentage of respondents from Texas who marked a problem as a major problem and compares the responses across states.
Population/development pressure, farm profitability, depletion of groundwater, overgrazing and susceptibility to plant pests and diseases were the top problems in Texas. Soil salinity (only in the top tier in Texas) and farm labor were also in the top tier of Texas problems.
As in most states, the top problems in Texas in 1995 were adequacy of markets, susceptibility to plant pests and disease, farm labor, and farm profitability.
Indicators of resilience. Table 6 shows the responses by state to various questions related to resilience not covered in previous questions.
Across the South, processing commodities into products for sale was seen has having no or minimal participation by more than 87% of respondents. Only 3.1 percent felt participation was widespread in their county. Texas had 3% of respondents in the widespread category of this indicator of resilience.
Adding value through on-farm processing, across the South, was thought widespread in only 2.2% of respondents with 86.9% marking minimal or no participation. Texas had 2% of counties with widespread participation in this indicator of resilience.
Using direct marketing was perceived as widespread in 7% of counties with 63.9% having no or little participation. Texas had 2% of counties in the widespread category, which was a low score on this measure of resilience.
Using multiple venues to market their goods was widespread in 10.3% of counties and had low or minimal participation in 59.3%. Texas had 2% of counties in the widespread category for this indicator of resilience, putting it in the lowest Southern states.
Selling value-added products within 100 miles of the farm had no or minimal participation in71.8% of counties with 7% having widespread participation. Texas had 3% of counties in the widespread category, a low score on this measure of resilience in the Southern states.
Participate in collaborative marketing with other farmers. Region-wide 4.3% see widespread participation in their counties while 75.9% saw no or minimal participation. Texas had 7% of respondents seeing widespread participation in their counties on this measure of resilience—the highest score of all states.
Sell only raw commodities. Region-wide 53.3% of respondents saw this non-resilient activity as widespread in their counties. Texas saw 51.1% in the widespread category, putting Texas at about the mean on this resilience indicator in all Southern state.
Increases in assets in the last 5 years was seen as widespread in 27.1% of counties. Texas had 17.8% of respondents seeing widespread occurrence in their counties, making Texas among the bottom half of states on this measure of resilience.
Decreases in assets were seen as widespread in 5.2% of counties. Texas had 6.7% of respondents seeing widespread occurrence in their counties.
Buying supplies and equipment from independent supplies was widespread in 28.7% of counties and 27.7 had no or minimal participation. Widespread participation in this resilient activity was seen by 20% of Texas respondents, putting Texas among the bottom half of Southern states on this measure of resilience.
Detailed plans to ensure operation viability were widespread in 9.6% of counties and had no or minimal participation in 55.5%. Widespread participation in this resilient activity was seen by 8.9% percent of Texas respondents, far below the 33.3% claimed in Oklahoma on this measure of resilience.
Growing the same crops or crop rotations was seen as widespread in 47.7% of counties and had no or minimal participation in 20.5% of counties. Widespread participation in this non-resilient activity was reported by 48.9% of Texas respondents, a bit worse than most Southern states.
Changes in management practices in the past 5 years was seen as widespread in 8.6% of counties and no or minimal in 56.9%. This resilient practice was seen as widespread by 4.4% of Texas respondents, putting Texas in the bottom three of all Southern states.
Change in management structure in the past 5 years was seen as widespread in 3.7% of counties with no or minimal participation in 75.7%. 2.3% of Texas respondents felt this resilient activity was widespread in their counties, giving Texas the bottom half of scores on this measure.
Fate of farms after retirement: the redundancy quality of resilience. A crucial quality of resilience is the ability of the system to last when management changes. As the average age of farmers nears 60 across the South, many farms are facing the retirement of long-time operators. Table 7 presents the percentages from each state who thought a particular option was widespread in their county.
Texas respondents felt that “The farms will be broken up or sold for a non-agricultural use” was the mostly likely occurrence at 36.7%. Other choices ranged from 10.3 to 13.8%. However, when all potential outcomes were summed, remaining as a commercial farm was seen as more widespread than converting to a noncommercial use.
Virginia
How can Virginia agricultural research and extension be improved?
Tables 1-7 presents the 2015 survey data in more depth. Results from SOS1995 are available at: https://projects.sare.org/media/pdf/4/8/3/483southern-futures.pdf.
What is the state of Virginia in sustainable agriculture?
The surveys show the extent of various sustainable agriculture practices, current education programs and current research programs in Virginia.
Attitudes about sustainable agriculture. Table 1 shows the attitudes of Virginia respondents toward sustainable agriculture.
Do you think farmers/ranchers in your county are practicing sustainable agriculture?
Virginia’s percentage of yes responses (72.7%) was thehigher than all states except North Carolina and Virginia. Mean of all states was 63.7%.
Can farmer/ranchers produce enough food and fiber without using synthetic chemicals?
Virginia’s percentage of yes responses (15.9%) was slightly lower than the average of all states (17.2%).
Do you think sustainable agriculture is economical?
Virginia’s percentage of yes responses (44.2%) was in the lowest third of all states. The mean of all states was 51.4%.
Problems faced in helping farmers/ranchers implement sustainable practices. Table 2 shows the relative rankings of Virginia in comparison to other states regarding problems faced in helping farmers implement sustainable practices.
Though consistent with other states, in perception of the top three problems, Virginia respondents ordered the problems differently. Lack of a clear definition (65.1%) was by far seen as the worst problem. Lack of farmer rancher interest, which was seen as the biggest problem in most states, was second in Virginia (48.8%). Lack of funds (44.2%) was also ranked highly as a problem, as seen in most other states in the region.
Also consistent with other states, the problem ranked lowest by Virginia respondents was lack of personal interest or disagreement with the sustainable agriculture concept.
Inconsistent with many other states, lack of knowledge/experience in sustainable agriculture was seen as a decreasing problem by Virginia respondents in 2015 (17%) compared to 1995 (14%). Also nconsistent with other states, Virginia respondents’ perceptions of lack of clear definition, national agricultural policy and state agricultural policy as problems increased over the 20 years.
What education programs will be needed in the future? Table 3 shows the relative rankings of Virginia to other states on areas in need of additional education.
The top specific priority in Virginia in 2015 was consumer education at 38.1 up from 14%. Regional marketing systems at 33.3% and ggregation, distribution and marketing systems at 31% also scored in the highest tier.
Integrated pest management was next highest with 31% compared to 14% in 1995. Alternative markets also had 31% of respondents listing it as a priority in Virginia for educational efforts. This was down from 1995’s figure of 57%.
Total sustainable farming systems scored 28.6%, up from 1995’s figure of 18%.
Biological pest control at 23.8 was up from 11% in 1995.
Dropping out of the top tier of Virginia education priorities were expert computer systems for farm management, improved water management, and controlled grazing.
All other educational practices continued to be cited as a top educational priority by lower percentages of respondents from Virginia.
What research is needed in the future in Virginia? Table 4 shows the relative rankings of Virginia to other states on areas in need of additional research.
Regional marketing systems and infrastructure was the top research priority for Virginia respondents. At 47.6%, Virginia expressed higher support than any other state. Also highly ranked as in many other states were alternative markets (38.1%), aggregation, distribution, and marketing systems (33.3%) and total sustainable farming systems (28.6%). Integrated pest management ranked 28.6% in Virginia and biological pest control, which had dropped out of the top tier in all other states except Florida, remained top-ranked in Virginia at 21.4%.
Controlled grazing, reduced synthetic pesticide use, and crop and livestock diversification all dropped out of the top tier. The only research areas which remained in the top tier across the 20 years were alternative markets, total sustainable farming systems and integrated pest management.
Problems facing farmers and ranchers. Table 5 shows the percentage of respondents from Virginia who marked a problem as a major problem and compares the responses across states.
Virginia was unique in that farm labor was the top problem. Population/development pressure was not far behind. Farm profitability, susceptibility to plant pests and diseases, negative public opinion about farm chemical usage and adequacy of markets comprised the remainder of the top problems in Virginia in 2015.
As in most states, the top problems in Virginia in 1995 were adequacy of markets, susceptibility to plant pests and disease, farm labor, and farm profitability.
Indicators of resilience. Table 6 shows the responses by state to various questions related to resilience not covered in previous questions.
Across the South, processing commodities into products for sale was seen has having no or minimal participation by more than 87% of respondents. Only 3.1 percent felt participation was widespread in their county. Virginia had 0% of respondents in the widespread category of this indicator of resilience.
Adding value through on-farm processing, across the South, was thought widespread in only 2.2% of respondents with 86.9% marking minimal or no participation. Virginia had 0% of counties with widespread participation in this indicator of resilience.
Using direct marketing was perceived as widespread in 7% of counties with 63.9% having no or little participation. Virginia had 2% of counties in the widespread category, which was a low score on this measure of resilience.
Using multiple venues to market their goods was widespread in 10.3% of counties and had low or minimal participation in 59.3%. Virginia had 1% of counties in the widespread category for this indicator of resilience, putting it in the lowest Southern states.
Selling value-added products within 100 miles of the farm had no or minimal participation in71.8% of counties with 7% having widespread participation. Virginia had 3% of counties in the widespread category, a low score on this measure of resilience in the Southern states.
Participate in collaborative marketing with other farmers. Region-wide 4.3% see widespread participation in their counties while 75.9% saw no or minimal participation. Virginia had 6% of respondents seeing widespread participation in their counties on this measure of resilience—a higher score than all but one Southern states.
Sell only raw commodities. Region-wide 53.3% of respondents saw this non-resilient activity as widespread in their counties. Virginia saw 66.7% in the widespread category, putting Virginia tied for the lowest resilience on this measure.
Increases in assets in the last 5 years was seen as widespread in 27.1% of counties. Virginia had 47.6% of respondents seeing widespread occurrence in their counties, making Virginia second only to Kentucky as best of all states on this measure of resilience.
Decreases in assets were seen as widespread in 5.2% of counties. Virginia had 2.4% of respondents seeing widespread occurrence in their counties.
Buying supplies and equipment from independent supplies was widespread in 28.7% of counties and 27.7 had no or minimal participation. Widespread participation in this resilient activity was seen by 28.6% of Virginia respondents, putting Virginia among at the mean of Southern states on this measure of resilience.
Detailed plans to ensure operation viability were widespread in 9.6% of counties and had no or minimal participation in 55.5%. Widespread participation in this resilient activity was seen by 9.3% percent of Virginia respondents, far below the 33.3% claimed in Oklahoma on this measure of resilience.
Growing the same crops or crop rotations was seen as widespread in 47.7% of counties and had no or minimal participation in 20.5% of counties. Widespread participation in this non-resilient activity was reported by 61.9% which ties with Tennessee as the least resilient on this measure.
Changes in management practices in the past 5 years was seen as widespread in 8.6% of counties and no or minimal in 56.9%. This resilient practice was seen as widespread by 9.3% of Virginia respondents, putting Virginia in the top five of all Southern states.
Change in management structure in the past 5 years was seen as widespread in 3.7% of counties with no or minimal participation in 75.7%. None of Virginia respondents felt this resilient activity was widespread in their counties, putting Virginia at the bottom of scores on this measure.
Fate of farms after retirement: the redundancy quality of resilience. A crucial quality of resilience is the ability of the system to last when management changes. As the average age of farmers nears 60 across the South, many farms are facing the retirement of long-time operators. Table 7 presents the percentages from each state who thought a particular fate was widespread in their county.
The highest ranked category for Virginia respondents was “the farm will be leased to a neighboring farmer or rancher” at 18.6%. This high percentage contributed to Virginia joining Tennessee, Mississippi and Louisiana as the states with the highest ration of farm continuing in commercial operation compared to those leaving commercial operation.
|
Table 1: Attitudes about sustainable agriculture by state |
||||||||||||||
|
|
AL |
AR |
FL |
GA |
KY |
LA |
MS |
NC |
OK |
SC |
TN |
TX |
VA |
Total |
|
Do you think farmers/ranchers in your county are practicing sustainable agriculture? |
|
|
|
|
|
|
|
|
|
|
|
|
|
|
|
Yes |
61.3 |
60.6 |
47.8 |
66.7 |
63.2 |
63.2 |
57.7 |
80.0 |
56.3 |
77.8 |
59.5 |
40.0 |
72.7 |
63.7 |
|
No |
32.3 |
33.3 |
47.8 |
22.8 |
29.9 |
36.8 |
29.6 |
13.8 |
31.3 |
16.7 |
33.3 |
51.1 |
18.2 |
28.4 |
|
Don't know |
6.5 |
6.1 |
4.3 |
10.5 |
6.9 |
0.0 |
12.7 |
6.3 |
12.5 |
5.6 |
7.1 |
8.9 |
9.1 |
7.9 |
|
n |
31 |
33 |
23 |
57 |
87 |
19 |
71 |
80 |
16 |
36 |
42 |
42 |
44 |
584 |
|
Can farmers/ranchers produce enough food and fiber without using synthetic chemicals? |
|
|
|
|
|
|
|
|
|
|
|
|
|
|
|
Yes |
41.9 |
18.8 |
16.7 |
15.8 |
12.6 |
5.3 |
12.7 |
11.4 |
12.5 |
16.7 |
21.4 |
31.1 |
15.9 |
17.2 |
|
No |
41.9 |
68.8 |
58.3 |
68.4 |
55.2 |
63.2 |
70.4 |
68.4 |
68.8 |
61.1 |
64.3 |
48.9 |
70.5 |
62.6 |
|
Don't know |
16.1 |
12.5 |
25.0 |
15.8 |
32.2 |
31.6 |
16.9 |
20.3 |
18.8 |
22.2 |
14.3 |
20.0 |
13.6 |
20.2 |
|
n |
31 |
32 |
24 |
57 |
87 |
19 |
71 |
79 |
16 |
36 |
42 |
45 |
44 |
583 |
|
Do you think sustainable agriculture is economical? |
|
|
|
|
|
|
|
|
|
|
|
|
|
|
|
Yes |
71.0 |
54.5 |
52.2 |
50.9 |
54.0 |
57.9 |
33.8 |
53.2 |
56.3 |
66.7 |
42.9 |
53.3 |
44.2 |
51.4 |
|
No |
9.7 |
24.2 |
13.0 |
17.5 |
16.1 |
15.8 |
23.9 |
32.9 |
25.0 |
13.9 |
19.0 |
22.2 |
20.9 |
20.6 |
|
Don't know |
19.4 |
21.2 |
34.8 |
31.6 |
29.9 |
26.3 |
42.3 |
13.9 |
18.8 |
19.4 |
38.1 |
24.4 |
34.9 |
28.0 |
|
n |
31 |
33 |
23 |
57 |
87 |
19 |
71 |
79 |
16 |
36 |
42 |
45 |
43 |
582 |
|
Note: Valid responses are only shown for participants who answered the survey item and their state location. |
||||||||||||||
|
Table 2: Problems faced in helping farmers/ranchers implement sustainable agriculture practices |
||||||||||||||
|
What problems do you face in helping farmers/ranchers implement sustainable agriculture practices? (Respondents checked all that applied). |
AL |
AR |
FL |
GA |
KY |
LA |
MS |
NC |
OK |
SC |
TN |
TX |
VA |
Total |
|
Lack of a clear definition of sustainable agriculture |
50.0 |
57.6 |
44.0 |
49.1 |
62.8 |
42.1 |
52.9 |
58.4 |
50.0 |
51.4 |
68.3 |
51.1 |
65.1 |
55.8 |
|
National agriculture policy does not stress sustainable agriculture |
60.0 |
27.3 |
24.0 |
29.8 |
22.1 |
31.6 |
11.4 |
18.2 |
25.0 |
11.4 |
31.7 |
20.0 |
25.6 |
23.9 |
|
State agriculture policy does not stress sustainable agriculture |
50.0 |
42.4 |
28.0 |
31.6 |
26.7 |
31.6 |
15.7 |
14.3 |
31.3 |
31.4 |
29.3 |
22.2 |
25.6 |
26.7 |
|
Lack of farmer/rancher interest |
53.3 |
78.8 |
60.0 |
45.6 |
67.4 |
73.7 |
70.0 |
61.0 |
68.8 |
57.1 |
80.5 |
66.7 |
48.8 |
63.4 |
|
Lack of social acceptability for sustainable agriculture |
30.0 |
30.3 |
24.0 |
24.6 |
24.4 |
31.6 |
21.4 |
16.9 |
25.0 |
11.4 |
24.4 |
26.7 |
14.0 |
22.5 |
|
Organizational priorities do not stress sustainable agriculture |
23.3 |
24.2 |
20.0 |
15.8 |
22.1 |
26.3 |
21.4 |
20.8 |
6.3 |
25.7 |
12.2 |
26.7 |
11.6 |
20.1 |
|
Lack of time to work on sustainable agriculture projects |
56.7 |
42.4 |
32.0 |
38.6 |
24.4 |
36.8 |
38.6 |
35.1 |
31.3 |
42.9 |
41.5 |
33.3 |
20.9 |
35.4 |
|
Lack of adequate funds for sustainable agriculture projects |
60.0 |
69.7 |
68.0 |
52.6 |
43.0 |
47.4 |
52.9 |
57.1 |
56.3 |
42.9 |
65.9 |
51.1 |
44.2 |
53.4 |
|
Lack of opportunities for you to attend training in sustainable agriculture practices |
33.3 |
27.3 |
24.0 |
19.3 |
23.3 |
47.4 |
32.9 |
16.9 |
18.8 |
14.3 |
19.5 |
28.9 |
14.0 |
23.6 |
|
Your lack of knowledge/experience in sustainable agriculture |
46.7 |
42.4 |
44.0 |
38.6 |
27.9 |
26.3 |
38.6 |
28.6 |
25.0 |
14.3 |
39.0 |
26.7 |
14.0 |
31.5 |
|
Your lack of interest or disagreement with the sustainable agriculture concept |
16.7 |
15.2 |
16.0 |
12.3 |
12.8 |
15.8 |
10.0 |
16.9 |
12.5 |
8.6 |
9.8 |
11.1 |
9.3 |
12.7 |
|
Note: Valid responses are only shown for participants who answered the survey item and their state location. |
||||||||||||||
|
Table 3: Areas in need of additional education (% in top five options) by state |
||||||||||||||
|
Educational areas |
AL |
AR |
FL |
GA |
KY |
LA |
MS |
NC |
OK |
SC |
TN |
TX |
VA |
Total |
|
n |
29 |
32 |
23 |
57 |
85 |
19 |
71 |
77 |
16 |
35 |
42 |
45 |
42 |
573 |
|
Farm profitability |
69.0 |
65.6 |
60.0 |
70.2 |
61.2 |
52.6 |
73.2 |
71.4 |
44.8 |
77.1 |
57.1 |
55.6 |
57.1 |
64.7 |
|
Alternative markets |
44.8 |
28.1 |
21.7 |
40.4 |
50.6 |
21.1 |
38.0 |
54.5 |
18.8 |
40.0 |
38.1 |
44.4 |
31.0 |
40.5 |
|
Total sustainable farming systems |
41.4 |
28.1 |
34.8 |
38.6 |
42.4 |
42.1 |
31.0 |
32.5 |
12.5 |
34.3 |
40.5 |
46.7 |
28.6 |
36.0 |
|
Conservation tillage in cropping systems |
6.9 |
0.0 |
13.0 |
10.5 |
9.4 |
5.3 |
9.9 |
6.5 |
6.3 |
8.6 |
14.3 |
13.3 |
14.3 |
9.4 |
|
Reduced synthetic pesticide usage |
10.3 |
15.6 |
26.1 |
10.5 |
11.8 |
0.0 |
11.3 |
11.7 |
0.0 |
25.7 |
10.0 |
6.7 |
9.5 |
12.4 |
|
Reduced synthetic fertilizer usage |
6.9 |
9.4 |
17.4 |
10.5 |
15.3 |
5.3 |
12.7 |
11.7 |
0.0 |
22.9 |
19.0 |
4.4 |
7.1 |
11.9 |
|
Cover cropping or green manuring |
20.7 |
21.9 |
21.7 |
19.3 |
20.0 |
10.5 |
14.1 |
13.0 |
6.3 |
28.6 |
31.0 |
24.4 |
9.5 |
18.7 |
|
Crop rotation |
3.4 |
3.1 |
4.3 |
5.3 |
15.3 |
5.3 |
18.3 |
6.5 |
18.8 |
20.0 |
16.7 |
15.6 |
11.9 |
11.7 |
|
Integrated pest management |
34.5 |
25.0 |
47.8 |
33.3 |
15.3 |
26.3 |
22.5 |
31.2 |
18.8 |
17.1 |
11.9 |
22.2 |
31.0 |
25.0 |
|
Improved animal waste management techniques |
3.4 |
12.5 |
0.0 |
5.3 |
8.2 |
10.5 |
5.6 |
10.4 |
0.0 |
2.9 |
4.8 |
4.4 |
2.4 |
6.1 |
|
Crop and livestock diversification |
10.3 |
18.8 |
8.7 |
15.8 |
25.9 |
15.8 |
22.5 |
11.7 |
37.5 |
8.6 |
11.9 |
24.4 |
19.0 |
18.0 |
|
Land forming to reduce erosion (terracing, contour planting, grade stabilization, etc.) |
10.3 |
0.0 |
0.0 |
0.0 |
1.2 |
5.3 |
5.6 |
2.6 |
6.3 |
0.0 |
9.5 |
6.7 |
0.0 |
3.3 |
|
Improved water management techniques (drainage and irrigation) |
3.4 |
25.0 |
21.7 |
14.0 |
8.2 |
15.8 |
21.1 |
5.2 |
12.5 |
14.3 |
21.4 |
22.2 |
4.8 |
13.8 |
|
Biological pest control |
6.9 |
6.3 |
13.0 |
12.3 |
7.1 |
15.8 |
11.3 |
10.4 |
6.3 |
11.4 |
4.8 |
2.2 |
23.8 |
9.9 |
|
Cultural pest control |
3.4 |
18.8 |
4.3 |
7.0 |
4.7 |
21.1 |
1.4 |
7.8 |
6.3 |
8.6 |
9.5 |
6.7 |
14.3 |
7.7 |
|
Controlled grazing (rotational, intensive, etc.) |
0.0 |
21.9 |
8.7 |
15.8 |
21.2 |
15.8 |
16.9 |
7.8 |
43.8 |
11.4 |
21.4 |
17.8 |
7.1 |
15.4 |
|
Farm machinery adaptations to promote erosion control |
3.4 |
0.0 |
4.3 |
1.8 |
2.4 |
5.3 |
2.8 |
1.3 |
12.5 |
0.0 |
2.4 |
2.2 |
4.8 |
2.6 |
|
Composting |
0.0 |
3.1 |
8.7 |
5.3 |
5.9 |
15.8 |
1.4 |
3.9 |
0.0 |
8.6 |
2.4 |
6.7 |
4.8 |
4.7 |
|
Manure distribution as fertilizer |
13.8 |
9.4 |
8.7 |
1.8 |
10.6 |
5.3 |
5.6 |
2.6 |
0.0 |
8.6 |
11.9 |
6.7 |
0.0 |
6.5 |
|
Ridge till |
0.0 |
0.0 |
0.0 |
0.0 |
1.2 |
0.0 |
1.4 |
0.0 |
0.0 |
0.0 |
0.0 |
2.2 |
0.0 |
0.5 |
|
Expert computer systems for farm management |
31.0 |
15.6 |
13.0 |
5.3 |
9.4 |
10.5 |
14.1 |
10.4 |
25.0 |
14.3 |
9.5 |
2.2 |
14.3 |
11.9 |
|
Fallow management systems |
6.9 |
3.1 |
0.0 |
3.5 |
1.2 |
0.0 |
0.0 |
1.3 |
12.5 |
2.9 |
4.8 |
4.4 |
0.0 |
2.4 |
|
Mulching |
6.9 |
0.0 |
4.3 |
1.8 |
0.0 |
0.0 |
0.0 |
0.0 |
0.0 |
0.0 |
4.8 |
6.7 |
0.0 |
1.6 |
|
Complete organic operation |
6.9 |
9.4 |
4.3 |
8.8 |
9.4 |
10.5 |
8.5 |
9.1 |
6.3 |
8.6 |
7.1 |
4.4 |
4.8 |
7.9 |
|
Sprayer calibration and application adequacy |
13.8 |
28.1 |
4.3 |
8.8 |
5.9 |
15.8 |
15.5 |
3.9 |
18.8 |
2.9 |
9.5 |
4.4 |
4.8 |
9.2 |
|
Alley cropping (crops grown in alleys formed between trees or shrubs) |
0.0 |
0.0 |
0.0 |
5.3 |
0.0 |
0.0 |
1.4 |
2.6 |
6.3 |
2.9 |
0.0 |
0.0 |
4.8 |
1.7 |
|
Forest stewardship |
20.7 |
9.4 |
8.7 |
1.8 |
5.9 |
5.3 |
21.1 |
6.5 |
6.3 |
0.0 |
11.9 |
4.4 |
2.4 |
8.2 |
|
Windbreaks and/or shelterbelts |
0.0 |
3.1 |
0.0 |
0.0 |
0.0 |
0.0 |
2.8 |
1.3 |
6.3 |
0.0 |
0.0 |
0.0 |
0.0 |
0.9 |
|
Integration of crop and livestock production systems |
10.3 |
3.1 |
13.0 |
7.0 |
14.1 |
5.3 |
11.3 |
13.0 |
12.5 |
8.6 |
7.1 |
8.9 |
19.0 |
10.8 |
|
Variety of mixtures of single crops |
0.0 |
3.1 |
0.0 |
3.5 |
3.5 |
0.0 |
1.4 |
0.0 |
6.3 |
2.9 |
4.8 |
0.0 |
4.8 |
2.3 |
|
Native or “local” crops |
6.9 |
6.3 |
4.3 |
7.0 |
5.9 |
5.3 |
4.2 |
6.5 |
6.3 |
2.9 |
11.9 |
6.9 |
7.1 |
6.3 |
|
Polyculture farming (more than one crop grown in a field at the same time) |
6.9 |
0.0 |
13.0 |
17.5 |
3.5 |
5.3 |
2.8 |
13.0 |
6.3 |
11.4 |
7.1 |
6.7 |
7.1 |
7.9 |
|
Use of animals to control or eliminate brush for land reclamation |
3.4 |
0.0 |
4.3 |
3.5 |
2.4 |
10.5 |
4.2 |
2.6 |
12.5 |
0.0 |
4.8 |
8.9 |
0.0 |
3.7 |
|
Multiple species grazing |
3.4 |
12.5 |
0.0 |
1.8 |
3.5 |
5.3 |
2.8 |
1.3 |
25.0 |
2.9 |
4.8 |
11.1 |
7.1 |
4.9 |
|
Reforestation |
6.9 |
3.1 |
4.3 |
5.3 |
2.4 |
10.5 |
9.9 |
2.6 |
0.0 |
0.0 |
2.4 |
2.2 |
0.0 |
3.8 |
|
Increasing biological diversity |
24.1 |
3.1 |
13.0 |
3.5 |
2.4 |
10.5 |
2.8 |
3.9 |
6.3 |
5.7 |
4.8 |
15.6 |
9.5 |
6.6 |
|
Consumer education |
31.0 |
37.5 |
21.7 |
26.3 |
38.8 |
31.6 |
23.9 |
28.6 |
43.8 |
28.6 |
19.0 |
28.9 |
38.1 |
30.2 |
|
Aggregation, distribution, and marketing systems for multiple farms working together |
0.0 |
15.6 |
21.7 |
28.1 |
12.9 |
42.1 |
9.9 |
24.7 |
31.3 |
8.6 |
2.4 |
11.1 |
31.0 |
17.1 |
|
Regional marketing systems and infrastructure |
13.8 |
34.4 |
17.4 |
28.1 |
22.4 |
26.3 |
22.5 |
28.6 |
18.8 |
22.9 |
16.7 |
17.8 |
33.3 |
23.9 |
|
Note: Valid responses are only shown for participants who answered the survey item and their state location. |
||||||||||||||
|
Table 4: Areas in need of additional research (% in top five options) by state |
||||||||||||||
|
Research areas |
AL |
AR |
FL |
GA |
KY |
LA |
MS |
NC |
OK |
SC |
TN |
TX |
VA |
Total |
|
n |
30 |
32 |
25 |
57 |
86 |
19 |
71 |
79 |
16 |
36 |
42 |
45 |
42 |
580 |
|
Farm profitability |
66.7 |
53.1 |
72.0 |
59.6 |
61.6 |
57.9 |
74.6 |
68.4 |
50.0 |
66.7 |
54.8 |
55.6 |
50.0 |
62.2 |
|
Alternative markets |
33.3 |
34.4 |
44.0 |
49.1 |
44.2 |
21.1 |
46.1 |
44.3 |
25.0 |
33.3 |
28.6 |
42.2 |
38.1 |
40.0 |
|
Total sustainable farming systems |
23.3 |
21.9 |
40.0 |
29.8 |
30.4 |
31.6 |
31.0 |
24.1 |
37.5 |
25.0 |
31.0 |
40.0 |
28.6 |
29.8 |
|
Conservation tillage in cropping systems |
3.3 |
0.0 |
4.0 |
5.3 |
5.8 |
5.3 |
8.5 |
7.6 |
6.3 |
8.3 |
2.4 |
13.3 |
9.5 |
6.6 |
|
Reduced synthetic pesticide usage |
6.7 |
15.6 |
24.0 |
10.5 |
16.3 |
10.5 |
8.5 |
11.4 |
6.3 |
22.2 |
16.7 |
11.1 |
14.3 |
13.3 |
|
Reduced synthetic fertilizer usage |
3.3 |
9.4 |
20.0 |
7.0 |
15.1 |
5.3 |
5.6 |
10.1 |
6.3 |
16.7 |
21.4 |
8.9 |
11.9 |
11.0 |
|
Cover cropping or green manuring |
13.3 |
31.3 |
20.0 |
19.3 |
14.0 |
10.5 |
14.1 |
15.2 |
0.0 |
30.6 |
28.6 |
17.8 |
14.3 |
17.8 |
|
Crop rotation |
0.0 |
3.1 |
12.0 |
5.3 |
8.1 |
5.3 |
12.7 |
12.7 |
12.5 |
8.3 |
9.5 |
6.7 |
2.4 |
8.1 |
|
Integrated pest management |
26.7 |
34.4 |
28.0 |
31.6 |
17.4 |
21.1 |
22.5 |
24.1 |
25.0 |
25.0 |
11.9 |
11.1 |
28.6 |
22.9 |
|
Improved animal waste management techniques |
6.7 |
6.3 |
0.0 |
0.0 |
10.5 |
15.8 |
9.9 |
6.3 |
6.3 |
0.8 |
2.4 |
6.7 |
0.0 |
5.9 |
|
Crop and livestock diversification |
20.0 |
31.3 |
16.0 |
21.1 |
29.1 |
15.8 |
18.3 |
20.3 |
31.3 |
22.2 |
19.0 |
37.8 |
16.7 |
23.1 |
|
Land forming to reduce erosion (terracing, contour planting, grade stabilization, etc.) |
3.3 |
0.0 |
0.0 |
0.0 |
0.0 |
5.3 |
11.3 |
3.8 |
6.3 |
2.8 |
9.5 |
8.9 |
4.8 |
4.3 |
|
Improved water management techniques (drainage and irrigation) |
3.3 |
21.9 |
28.0 |
17.5 |
12.8 |
26.3 |
21.1 |
11.4 |
18.8 |
16.7 |
19.0 |
22.2 |
0.0 |
15.9 |
|
Biological pest control |
16.7 |
12.5 |
24.0 |
10.5 |
7.0 |
21.1 |
5.6 |
17.7 |
0.0 |
8.3 |
11.9 |
6.7 |
21.4 |
11.9 |
|
Cultural pest control |
10.0 |
6.3 |
4.0 |
7.0 |
4.7 |
10.5 |
1.4 |
5.1 |
0.0 |
2.8 |
9.5 |
6.7 |
7.1 |
5.5 |
|
Controlled grazing (rotational, intensive, etc.) |
3.3 |
34.4 |
8.0 |
21.1 |
22.1 |
15.8 |
15.5 |
10.1 |
50.0 |
5.6 |
28.6 |
26.7 |
9.5 |
18.1 |
|
Farm machinery adaptations to promote erosion control |
6.7 |
0.0 |
0.0 |
3.5 |
4.7 |
5.3 |
2.8 |
1.3 |
18.8 |
8.3 |
2.4 |
11.1 |
7.1 |
4.7 |
|
Composting |
6.7 |
0.0 |
12.0 |
3.5 |
4.7 |
5.3 |
0.0 |
3.8 |
6.3 |
2.8 |
2.4 |
4.4 |
4.8 |
3.8 |
|
Manure distribution as fertilizer |
10.0 |
9.4 |
0.0 |
3.5 |
7.0 |
21.1 |
8.5 |
2.5 |
0.0 |
8.3 |
21.4 |
2.2 |
4.8 |
7.1 |
|
Ridge till |
0.0 |
0.0 |
0.0 |
0.0 |
0.0 |
0.0 |
1.4 |
0.0 |
0.0 |
0.0 |
2.4 |
0.0 |
0.0 |
0.3 |
|
Expert computer systems for farm management |
20.0 |
15.6 |
8.0 |
10.5 |
8.1 |
10.5 |
12.7 |
12.7 |
31.2 |
13.9 |
11.9 |
8.9 |
9.5 |
12.1 |
|
Fallow management systems |
10.0 |
0.0 |
0.0 |
1.8 |
2.3 |
0.0 |
0.0 |
1.3 |
0.0 |
2.8 |
2.4 |
2.2 |
0.0 |
1.7 |
|
Mulching |
3.3 |
3.1 |
4.0 |
1.8 |
2.3 |
5.3 |
1.4 |
0.0 |
0.0 |
0.0 |
2.4 |
0.0 |
2.4 |
1.7 |
|
Complete organic operation |
6.7 |
6.3 |
4.0 |
7.0 |
4.7 |
15.8 |
4.2 |
7.6 |
0.0 |
19.4 |
11.9 |
4.4 |
4.8 |
7.1 |
|
Sprayer calibration and application adequacy |
6.7 |
9.4 |
0.0 |
3.5 |
5.8 |
10.5 |
11.3 |
0.0 |
18.8 |
2.8 |
7.1 |
2.2 |
0.0 |
5.2 |
|
Alley cropping (crops grown in alleys formed between trees or shrubs) |
0.0 |
0.0 |
0.0 |
7.0 |
0.0 |
0.0 |
0.0 |
2.5 |
0.0 |
0.0 |
0.0 |
2.2 |
4.8 |
1.6 |
|
Forest stewardship |
20.0 |
6.3 |
4.0 |
5.3 |
9.3 |
10.5 |
16.9 |
5.1 |
0.0 |
0.0 |
7.1 |
6.7 |
2.4 |
7.8 |
|
Windbreaks and/or shelterbelts |
3.3 |
3.1 |
0.0 |
0.0 |
2.3 |
0.0 |
0.0 |
1.3 |
6.3 |
0.0 |
0.0 |
0.0 |
0.0 |
1.0 |
|
Integration of crop and livestock production systems |
3.3 |
9.4 |
12.0 |
14.0 |
12.8 |
5.3 |
11.3 |
12.7 |
12.5 |
8.3 |
7.1 |
4.4 |
19.0 |
10.9 |
|
Variety of mixtures of single crops |
0.0 |
0.0 |
0.0 |
3.5 |
2.3 |
5.3 |
1.4 |
1.3 |
6.3 |
8.3 |
2.4 |
0.0 |
0.0 |
2.1 |
|
Native or “local” crops |
23.3 |
9.1 |
4.0 |
17.5 |
7.0 |
10.5 |
11.3 |
8.9 |
6.3 |
11.1 |
4.8 |
11.1 |
9.5 |
10.3 |
|
Polyculture farming (more than one crop grown in a field at the same time) |
13.3 |
3.1 |
12.0 |
21.1 |
10.5 |
5.3 |
12.7 |
11.4 |
6.3 |
2.8 |
9.5 |
2.2 |
11.9 |
10.3 |
|
Use of animals to control or eliminate brush for land reclamation |
6.7 |
6.3 |
0.0 |
1.8 |
5.8 |
0.0 |
0.0 |
0.0 |
12.5 |
2.8 |
9.5 |
11.1 |
4.8 |
4.1 |
|
Multiple species grazing |
6.7 |
12.5 |
0.0 |
1.8 |
7.0 |
0.0 |
8.5 |
5.1 |
25.0 |
8.3 |
9.5 |
6.7 |
4.8 |
6.7 |
|
Reforestation |
3.3 |
0.0 |
8.0 |
7.0 |
0.0 |
5.3 |
4.2 |
1.3 |
0.0 |
2.8 |
4.8 |
2.2 |
0.0 |
2.8 |
|
Increasing biological diversity |
20.0 |
3.1 |
8.0 |
1.8 |
2.3 |
15.8 |
1.4 |
7.6 |
6.3 |
8.3 |
7.1 |
4.4 |
19.0 |
6.7 |
|
Consumer attitudes and/or behavior |
26.7 |
28.1 |
12.0 |
31.6 |
25.6 |
21.1 |
26.8 |
26.6 |
6.3 |
27.8 |
14.3 |
26.7 |
19.0 |
24.3 |
|
Aggregation, distribution, and marketing systems for multiple farms working together |
6.7 |
12.5 |
20.0 |
24.6 |
19.8 |
21.1 |
15.5 |
27.8 |
18.8 |
11.1 |
4.8 |
11.1 |
33.3 |
18.4 |
|
Regional marketing systems and infrastructure |
23.3 |
34.4 |
32.0 |
21.1 |
39.5 |
31.6 |
21.1 |
40.5 |
25.0 |
25.0 |
26.2 |
24.4 |
47.6 |
31.0 |
|
Note: Valid responses are only shown for participants who answered the survey item and their state location. |
||||||||||||||
|
Table 5: Problems facing farmers/ranchers by state (% that selected a threat as a major problem) |
||||||||||||||
|
What are the problems facing farmers/ranchers in your county? |
AL |
AR |
FL |
GA |
KY |
LA |
MS |
NC |
OK |
SC |
TN |
TX |
VA |
Total |
|
Waterlogging |
10.3 |
6.3 |
0.0 |
1.9 |
1.2 |
0.0 |
2.9 |
1.3 |
0.0 |
2.9 |
4.9 |
8.9 |
0.0 |
3.0 |
|
n |
29 |
32 |
23 |
54 |
84 |
19 |
70 |
79 |
16 |
35 |
41 |
45 |
42 |
569 |
|
Soil salinity |
7.1 |
0.0 |
0.0 |
0.0 |
0.0 |
0.0 |
0.0 |
0.0 |
12.5 |
0.0 |
0.0 |
22.2 |
0.0 |
2.5 |
|
n |
28 |
32 |
24 |
55 |
85 |
18 |
69 |
77 |
16 |
35 |
40 |
45 |
41 |
565 |
|
Soil acidity |
17.9 |
12.5 |
0.0 |
7.3 |
8.2 |
5.6 |
21.4 |
17.9 |
25.0 |
17.1 |
5.0 |
15.9 |
11.6 |
13.1 |
|
n |
28 |
32 |
23 |
55 |
85 |
18 |
70 |
78 |
16 |
35 |
40 |
44 |
43 |
567 |
|
Soil alkalinity |
10.3 |
0.0 |
8.7 |
0.0 |
0.0 |
0.0 |
5.7 |
0.0 |
6.3 |
0.0 |
0.0 |
9.3 |
0.0 |
2.5 |
|
n |
29 |
32 |
23 |
55 |
84 |
18 |
70 |
77 |
16 |
35 |
40 |
43 |
42 |
564 |
|
Susceptibility to plant pests and diseases |
30.0 |
25.8 |
56.0 |
30.4 |
16.3 |
36.8 |
34.8 |
26.9 |
12.5 |
31.4 |
19.0 |
24.4 |
30.2 |
27.7 |
|
n |
30 |
31 |
25 |
56 |
86 |
19 |
69 |
78 |
16 |
35 |
42 |
45 |
43 |
575 |
|
Farm labor |
34.5 |
31.3 |
28.0 |
17.9 |
55.8 |
26.3 |
31.0 |
41.8 |
43.8 |
37.1 |
28.6 |
20.0 |
46.5 |
35.6 |
|
n |
29 |
32 |
25 |
56 |
86 |
19 |
71 |
79 |
16 |
35 |
42 |
45 |
43 |
578 |
|
Worker health and safety |
6.9 |
3.1 |
8.3 |
5.9 |
8.2 |
0.0 |
2.9 |
6.3 |
6.3 |
2.9 |
4.8 |
4.4 |
11.6 |
5.8 |
|
n |
29 |
32 |
24 |
51 |
85 |
19 |
70 |
79 |
16 |
35 |
42 |
45 |
43 |
570 |
|
Lack of quality assurance programs |
14.3 |
6.3 |
8.7 |
5.5 |
9.4 |
5.3 |
1.4 |
4.0 |
12.5 |
0.0 |
4.9 |
8.9 |
0.0 |
5.7 |
|
n |
28 |
32 |
23 |
55 |
85 |
19 |
70 |
75 |
16 |
34 |
41 |
45 |
43 |
566 |
|
Depletion of ground water resources |
17.9 |
15.6 |
25.0 |
5.4 |
1.2 |
0.0 |
2.9 |
3.8 |
40.0 |
0.0 |
2.4 |
46.7 |
2.3 |
9.4 |
|
n |
28 |
32 |
24 |
56 |
85 |
19 |
70 |
78 |
15 |
35 |
42 |
45 |
43 |
572 |
|
Excessive synthetic pesticide usage |
20.0 |
9.4 |
16.7 |
7.3 |
7.0 |
10.5 |
4.3 |
5.1 |
12.5 |
2.9 |
9.8 |
8.9 |
14.0 |
8.6 |
|
n |
30 |
32 |
24 |
55 |
86 |
19 |
69 |
78 |
16 |
34 |
41 |
45 |
43 |
572 |
|
Excessive synthetic fertilizer usage |
23.3 |
12.5 |
12.5 |
7.4 |
10.6 |
10.5 |
5.7 |
5.1 |
12.5 |
5.7 |
11.9 |
8.9 |
9.3 |
9.4 |
|
n |
30 |
32 |
24 |
54 |
85 |
19 |
70 |
78 |
16 |
35 |
42 |
45 |
43 |
573 |
|
Environmental problems from chemical usage |
21.4 |
3.1 |
13.0 |
3.6 |
3.5 |
10.5 |
2.9 |
5.1 |
6.7 |
0.0 |
7.1 |
4.4 |
4.7 |
5.4 |
|
n |
28 |
32 |
23 |
55 |
85 |
19 |
70 |
78 |
15 |
35 |
42 |
45 |
43 |
570 |
|
Public health problems from chemical usage |
10.7 |
0.0 |
0.0 |
3.6 |
4.7 |
5.3 |
1.4 |
2.6 |
18.8 |
0.0 |
4.8 |
2.2 |
2.4 |
3.5 |
|
n |
28 |
32 |
22 |
55 |
86 |
19 |
70 |
78 |
16 |
35 |
42 |
45 |
42 |
570 |
|
Environmental problems from manure mismanagement |
7.1 |
6.3 |
0.0 |
3.6 |
0.0 |
0.0 |
2.8 |
1.3 |
6.3 |
0.0 |
0.0 |
2.3 |
2.3 |
2.1 |
|
n |
28 |
32 |
23 |
56 |
86 |
19 |
71 |
78 |
16 |
35 |
42 |
44 |
43 |
573 |
|
Public health problems from manure mismanagement |
3.6 |
0.0 |
4.3 |
3.6 |
0.0 |
0.0 |
0.0 |
1.3 |
0.0 |
0.0 |
0.0 |
2.2 |
0.0 |
1.0 |
|
n |
28 |
32 |
23 |
56 |
86 |
19 |
70 |
78 |
16 |
35 |
41 |
45 |
43 |
572 |
|
Inefficiency of water usage |
10.3 |
3.1 |
12.5 |
3.6 |
0.0 |
0.0 |
5.7 |
3.8 |
12.5 |
2.9 |
7.1 |
11.1 |
2.3 |
4.9 |
|
n |
29 |
32 |
24 |
55 |
86 |
19 |
70 |
78 |
16 |
35 |
42 |
45 |
43 |
574 |
|
Soil erosion |
23.3 |
6.3 |
8.7 |
5.4 |
8.1 |
15.8 |
10.0 |
5.1 |
12.5 |
5.9 |
2.4 |
11.1 |
7.0 |
8.3 |
|
n |
30 |
32 |
23 |
56 |
86 |
19 |
70 |
79 |
16 |
34 |
42 |
45 |
43 |
575 |
|
Reduced biological diversity |
27.6 |
6.3 |
25.0 |
5.6 |
8.2 |
10.5 |
4.2 |
6.4 |
6.3 |
5.9 |
14.3 |
8.9 |
7.0 |
9.1 |
|
n |
29 |
32 |
24 |
54 |
85 |
19 |
71 |
78 |
16 |
34 |
42 |
45 |
43 |
572 |
|
Overgrazing |
28.6 |
12.5 |
13.0 |
3.6 |
20.9 |
0.0 |
12.7 |
11.5 |
62.5 |
2.9 |
14.3 |
24.4 |
16.3 |
15.4 |
|
n |
28 |
32 |
23 |
55 |
86 |
19 |
71 |
78 |
16 |
34 |
42 |
45 |
43 |
572 |
|
Deforestation |
18.5 |
3.1 |
8.7 |
7.4 |
4.7 |
0.0 |
2.9 |
3.9 |
12.5 |
2.9 |
2.4 |
2.2 |
0.0 |
4.6 |
|
n |
27 |
32 |
23 |
54 |
86 |
19 |
70 |
77 |
16 |
34 |
41 |
45 |
43 |
567 |
|
Fisheries depletion |
10.7 |
3.1 |
16.7 |
1.9 |
2.4 |
0.0 |
2.9 |
2.6 |
0.0 |
3.0 |
0.0 |
2.3 |
0.0 |
3.0 |
|
n |
28 |
32 |
24 |
54 |
84 |
19 |
69 |
77 |
16 |
33 |
41 |
44 |
43 |
564 |
|
Population/development pressure |
31.0 |
12.5 |
47.8 |
29.1 |
20.9 |
10.5 |
10.0 |
44.9 |
18.8 |
31.4 |
26.2 |
25.6 |
39.5 |
27.1 |
|
n |
29 |
32 |
23 |
55 |
86 |
19 |
70 |
78 |
16 |
35 |
42 |
43 |
43 |
571 |
|
Farm profitability |
32.1 |
28.1 |
34.8 |
35.1 |
28.2 |
26.3 |
12.7 |
34.2 |
37.5 |
31.4 |
19.0 |
28.9 |
27.9 |
28.0 |
|
n |
28 |
32 |
23 |
57 |
85 |
19 |
71 |
79 |
16 |
35 |
42 |
45 |
43 |
575 |
|
Adequacy of markets |
40.0 |
15.6 |
21.7 |
19.3 |
32.6 |
15.8 |
15.9 |
23.1 |
31.3 |
14.3 |
9.5 |
16.3 |
26.2 |
21.9 |
|
n |
30 |
32 |
23 |
57 |
86 |
19 |
69 |
78 |
16 |
35 |
42 |
43 |
42 |
572 |
|
Negative public opinion about farm chemical usage |
17.2 |
18.8 |
30.4 |
25.9 |
14.0 |
21.1 |
11.6 |
34.2 |
37.5 |
22.9 |
14.3 |
13.3 |
28.6 |
21.2 |
|
n |
29 |
32 |
23 |
54 |
86 |
19 |
69 |
79 |
16 |
35 |
42 |
45 |
42 |
571 |
|
Excess use of organic waste |
3.6 |
3.1 |
0.0 |
1.8 |
1.2 |
5.3 |
4.3 |
1.3 |
6.3 |
2.9 |
2.4 |
2.2 |
4.8 |
2.6 |
|
n |
28 |
32 |
22 |
56 |
86 |
19 |
69 |
77 |
16 |
35 |
42 |
45 |
42 |
569 |
|
Note: Valid responses are only shown for participants who answered the survey item and their state location. |
||||||||||||||
|
Table 6: Indicators of resilience |
|
|
Please indicate the extent of participation by farmers/ranchers in your county. |
Percent |
|
Process commodities into products for sale |
|
|
No participation (0%) |
9.4 |
|
Minimal participation (1-24%) |
77.6 |
|
Moderate participation (25-49%) |
9.9 |
|
Widespread participation (50% or more) |
3.1 |
|
N |
648 |
|
Add value through on-farm processing |
|
|
No participation (0%) |
9.3 |
|
Minimal participation (1-24%) |
77.6 |
|
Moderate participation (25-49%) |
10.9 |
|
Widespread participation (50% or more) |
2.2 |
|
N |
644 |
|
Use direct marketing |
|
|
No participation (0%) |
2.3 |
|
Minimal participation (1-24%) |
61.6 |
|
Moderate participation (25-49%) |
29.1 |
|
Widespread participation (50% or more) |
7.0 |
|
N |
643 |
|
Use multiple venues to market their goods |
|
|
No participation (0%) |
3.3 |
|
Minimal participation (1-24%) |
46.0 |
|
Moderate participation (25-49%) |
40.5 |
|
Widespread participation (50% or more) |
10.3 |
|
N |
642 |
|
Sell value added products within 100 miles of the farm |
|
|
No participation (0%) |
6.8 |
|
Minimal participation (1-24%) |
65.0 |
|
Moderate participation (25-49%) |
21.2 |
|
Widespread participation (50% or more) |
7.0 |
|
N |
643 |
|
Participate in collaborative marketing with other farmers |
|
|
No participation (0%) |
12.1 |
|
Minimal participation (1-24%) |
63.8 |
|
Moderate participation (25-49%) |
19.7 |
|
Widespread participation (50% or more) |
4.3 |
|
N |
644 |
|
Sell only raw commodities |
|
|
No participation (0%) |
4.3 |
|
Minimal participation (1-24%) |
19.6 |
|
Moderate participation (25-49%) |
22.8 |
|
Widespread participation (50% or more) |
53.3 |
|
N |
644 |
|
Saw an increase in their assets in the last 5 years |
|
|
No participation (0%) |
6.2 |
|
Minimal participation (1-24%) |
29.5 |
|
Moderate participation (25-49%) |
37.2 |
|
Widespread participation (50% or more) |
27.1 |
|
N |
631 |
|
Saw a decrease in their assets in the last 5 years |
|
|
No participation (0%) |
8.4 |
|
Minimal participation (1-24%) |
64.1 |
|
Moderate participation (25-49%) |
22.3 |
|
Widespread participation (50% or more) |
5.2 |
|
N |
629 |
|
Buy supplies and equipment from independent suppliers |
|
|
No participation (0%) |
4.2 |
|
Minimal participation (1-24%) |
23.5 |
|
Moderate participation (25-49%) |
43.6 |
|
Widespread participation (50% or more) |
28.7 |
|
N |
642 |
|
Have detailed plans to ensure operation viability |
|
|
No participation (0%) |
4.6 |
|
Minimal participation (1-24%) |
50.9 |
|
Moderate participation (25-49%) |
35.0 |
|
Widespread participation (50% or more) |
9.6 |
|
N |
635 |
|
Grow the same crops or crop rotations every year |
|
|
No participation (0%) |
5.5 |
|
Minimal participation (1-24%) |
15.0 |
|
Moderate participation (25-49%) |
31.8 |
|
Widespread participation (50% or more) |
47.7 |
|
N |
639 |
|
Changed their basic management practices in the past 5 years |
|
|
No participation (0%) |
3.5 |
|
Minimal participation (1-24%) |
53.4 |
|
Moderate participation (25-49%) |
34.5 |
|
Widespread participation (50% or more) |
8.6 |
|
N |
637 |
|
Changed management structure in the past 5 years |
|
|
No participation (0%) |
9.4 |
|
Minimal participation (1-24%) |
66.3 |
|
Moderate participation (25-49%) |
20.6 |
|
Widespread participation (50% or more) |
3.7 |
|
N |
627 |
|
Note: Full set of responses across the southern region. |
|
|
Table 7: Fate of farms upon retirement |
|
|
When farmers/ranchers in your county retire, what usually happens to the farm? (Respondents checked the appropriate level for each outcome.) |
Percent |
|
The farms will be broken up or sold for a non-agricultural use. |
|
|
None (0%) |
5.1 |
|
Minimal (1-24%) |
42.0 |
|
Moderate (25-49%) |
28.4 |
|
Widespread (50% or more) |
24.6 |
|
N |
610 |
|
The farms or ranches will stay in agricultural use, but as a hobby or family use rather than commercial use. |
|
|
None (0%) |
6.4 |
|
Minimal (1-24%) |
49.7 |
|
Moderate (25-49%) |
34.4 |
|
Widespread (50% or more) |
9.5 |
|
N |
610 |
|
A relative will take over operation. |
|
|
None (0%) |
2.6 |
|
Minimal (1-24%) |
45.9 |
|
Moderate (25-49%) |
38.2 |
|
Widespread (50% or more) |
13.3 |
|
N |
608 |
|
The farm will be leased to a neighboring farmer or rancher. |
|
|
None (0%) |
3.3 |
|
Minimal (1-24%) |
29.6 |
|
Moderate (25-49%) |
47.2 |
|
Widespread (50% or more) |
19.9 |
|
N |
608 |
|
The farm will be sold to non-family members to continue farming. |
|
|
None (0%) |
6.2 |
|
Minimal (1-24%) |
53.1 |
|
Moderate (25-49%) |
31.2 |
|
Widespread (50% or more) |
9.5 |
|
N |
612 |
|
Note: Full set of responses across the southern region. |
|
Educational & Outreach Activities
Participation summary:
We have published online the results of our work in an expanded version of this final report. The expanded version also provides practical advice for farmers in improving the qualities of resilience of the farm and food system. It also provides several hundred links to related research and educational materials from SARE-funded research and other sources.
The online book is free to everyone at: https://meadowcreekvalley.wordpress.com/projects/land/roots-of-resilience-the-book/
We have also provided a powerpoint presentation of our basic results which many have used in educational programs to introduce the ecological resilience perspective on sustainability to agricultural audiences. This is available free on-line at: https://meadowcreekvalley.wordpress.com/2015/07/09/roots-of-resilience-most-recent-presentation/
Project Outcomes
Major impact of the research in this report is in two areas.
I. Impact on foundations of sustainability, permaculture, agroecology and vulnerability research.
For almost three decades, sustainability has been the goal of people focused on the world’s “wicked problems” [1] (interconnected issues on which people are polarized —e.g. environmental degradation, overpopulation, endangered species, poverty, food security and climate change). The right mix of incentives, technology substitutions and social change were assumed to eventually lead to a lasting equilibrium with our planet and each other. Those working in sustainability have noticed instead that the world is increasingly out of balance, the wicked problems becoming more intractable.
Sustainability engendered worldwide enthusiasm with Gro Bruntland’s Our Common Future[2] in 1987 and then became embedded throughout the US government in the early 1990s with the President’s Council on Sustainable Development[3] and the Sustainable Agriculture Research and Education program[4].
However, the concept of sustainability has often been stretched, distorted, co-opted, and even trivialized by being used without the ecological context that anchors it to natural systems.
Resilience arising from sustainability. The mass media has chronicled the growing number of scientists, social innovators, community leaders, nongovernmental organizations, philanthropies, governments and corporations who contend that resilience may provide a useful perspective on resilience. As is the wont of journalists, some pit sustainability against resilience.[5]
“Resilience holds the key to our future. It is a deceptively simple idea,” according the Administrator of NOAA, Jane Lubchenco. The Federal Reserve promotes resilience.[6] USAID seems to be changing its focus to have resilience at the core of everything it does.[7] The Soil and Water Conservation Society's 2013 annual conference theme was Resilient Landscapes. The 2012 USDA Publication “Climate Change and Agriculture in the United States” uses the term resilience 46 times and sustainability only 10 times. One excellent summary of sustainable agriculture in the US[8] points out that a primary quality of systems that move toward greater sustainability is resilience. For example, the study’s discussion of case study farms notes that resilience and similar overlapping concepts are the primary qualities of sustainable systems. “[C]ase study farms still in operation appear to exhibit qualities that are associated with movement toward greater sustainability (for example, robustness, resistance, and resilience)”.[9] Resilience is the route to achieve the goals sustainability, according to industry trade groups,[10] design firms,[11] and think tanks such as Living Future Institute[12] and World Resources Institute.[13]
Several research centers devoted to resilience have arisen lately at Universities including Ohio State University, University of Stockholm, throughout the Australian national agricultural research organization and the European Union and, most broadly, the International Resilience Alliance.[14]
*************
Man-made laws and natural laws: a personal epiphany
Every blue moon or so, I realize I have been pretty blind to an obvious truth. These epiphanies usually come when we succeed in reconciling seemingly contradictory ideas. One epiphany began when I learned that Alabama, Kansas, Tennessee and Missouri legislatures had all passed bills opposing sustainability. In 2013, 15 bills in seven states were introduced to oppose sustainability (specifically the Agenda 21—a United Nations document written 20 years ago.
Many who advocate for sustainability were surprised, amazed and nonplussed. For many, sustainability ranks right up there with Mom and apple pie as absolute goods and with gravity as an absolute truth. Yet these bills have been overwhelmingly adopted in many instances by our elected officials. Presuming that both sides are well-meaning, why is sustainability raising such vociferous emotion?
Then I stumbled onto research on ecological resilience and slapped my forehead with my palm saying, how could I have missed this all these years? This research area studies how systems grow and transform themselves in adaptive cycles. Resilient systems are those which last, just as sustainable systems are those which last. I realized that the mainstream approach defined sustainability normatively and legally and not based on natural, empirical evidence. In fact, nearly all those involved in sustainability research have focused on achieving practical and applied goals—such as achieving an environmentally sound and socially just agriculture--rather than understanding sustainability as a natural phenomenon. These practical and applied goals can be fine and good, but they are normative, not scientific, goals. That is, we have decided that environmentally sound and social just systems are better. These are values, not testable hypotheses. When you pursue a particular value, you can’t logically object when others promulgate goals based on other values such as maximizing profit or favoring one ethnic group over another.
Ecological resilience research gives us more than a set of values we are trying to push systems toward. It gives us a working model of the cycle of adaptation and transformation that explains and predicts which systems survive and which don’t. Sustainability is a term which carries some of the meaning of resilience to some people, but has never been defined in testable, scientific terms. Ecological resilience research seeks a well-defined model which will enable sustainability to be based on natural law instead of man-made law.
Advocates of sustainability who discover the adaptive cycles of ecological resilience can marshal arguments which transcend values. Eventually, naysayers realized the earth is not flat and the sun does not revolve around it because a spherical earth revolving around the sun results in better predictions. As people begin to see how the adaptive cycle and resilience explain and predict behavior of systems, those who attack it will disappear just as all non-resilient systems do.
When presented as a natural property of systems, rather than a set of values we want to impose on others, sustainability as a concept will have more resilience. Popular values are fads. They inevitably rise and fall in popularity. Meanwhile the natural systems just keep rolling along. The resilient systems survive and transform into even more successful systems. Values which are consistent with natural laws survive. They will be tested and contradicted by popular values but they will survive. Societies, businesses and farms which don’t operate consistent with those natural laws may seem successful, but they will perish. A concept of sustainability will likewise perish unless it is derived from empirical evidence of systems which adapt and transform in the face of adversity.
*************
Assumptions which can lead sustainability astray
Why all this movement toward a resilience perspective on sustainability? A few unchallenged assumptions have led sustainability astray. The first will be the toughest for some.
- Sustainability is a societal norm not natural law.
Many contend that this trend toward resilience provides a scientific foundation which sustainability desperately needs. Resilience arose not as a normative goal for society, but as an observation of nature. As long as sustainability is based on social values it will be limited to those who share those values and remains susceptible to change as those values change. Unfortunately, some who work in resilience are also taking a normative, political stance.
Assessment tools based on internal qualities, not external goals. All sustainability assessment tools define external goals or principles which systems must meet in order to be called sustainable. By focusing on goals or principles, such tools are conceptually similar to any assessment tool which measures the ability of a system to achieve goals set externally, such as profit maximization. Ecological researchers focus on emergent qualities of the system which make it resilient, rather than externally imposed criteria.[15]
Sustainability needs a testable theoretical structure. Sustainability simply leaves too much room for doubt, manipulation and distortion in terms of exactly what is sustainable and inescapably why that item or practice is sustainable. Sustainability has legal meaning and moral meaning, but scant testable theoretical structure. The normative aspects of sustainability have attracted both widespread support and recent antipathy. The lack of a rigorous empirical definition of sustainability enables a polarizing debate since sustainability can be whatever an interest group projects onto it. As long as sustainability research focuses on societal goals instead of understanding existing empirical systems, it will continue to be a concept easily hijacked by those uninterested in creating more ecologically resilient systems.
Sustainability is conceived in three different ways: as a science, a movement or a set of practices. As a science, it is wholly synonymous with ecological resilience. As a particular set of defined practices or a social movement, sustainability becomes a plethora of conflicting approaches.[16]
- Sustaining an unsustainable system versus transforming the system.
The goal of sustainability, for some, is to maintain and sustain our present system. Societies throughout human history have sought to sustain unsustainable systems.[17] A resilience perspective on sustainability beckons us to reshape, reform and adapt. It welcomes the ingenuity that emerges based on the local capacities within a system.
Throughout history, many have focused on eliminating the vagaries of Nature and creating what today we might call a well-engineered mall.[18] Some hope to sustain the same kind of consumption that generates cheap, low quality, environmentally degrading items that are now turning China and India into ecological nightmares.[19] If we think that our civilization can consume the fossil fuels required to produce all our hearts’ desire and ship them to us, while casting toxic waste willy-nilly into our air and water, we’re going to fall short and never create resilient systems. Sustainability can too easily suggest that we continue on by making a few changes to alter our energy sources, create more efficient engines, use “98% biodegradable materials”, while ignoring the life cycle assessment which shows the toxic effect of most of our agricultural and manufacturing systems on our ecosystems.[20]
- Belief in “Balance of nature” has led sustainability astray
Popular conceptions of ecological systems usually operate on the assumption that the normal condition of nature is a state of equilibrium, in which organisms compete and coexist in an ecological system whose workings are essentially stable. It led to the doctrine, popular among conservationists, that nature does best and involving human intervention is bad by definition.
Simultaneous with the emergence of an "environmental crisis" and attendant widespread environmental consciousness and conscience in the1960s, Eugene Odum, then dean of the field, announced the advent of the "New Ecology." Odum's new ecology was based on the ecosystem concept as its organizing idea and reiterated the classic notion of nature, unperturbed by human disturbance, as in a steady state of dynamic equilibrium.[21] Many modern agroecologists seem to also see the most sustainable system as a well-developed, stable, mature system which recovers from disturbance and adapts to change.[22]
This traditional wisdom, first voiced by the ancient Greeks, assumed that nature undisturbed by human influence is characterized by a certain kind of harmony, balance and order. Wilderness is presumed to have three attributes: (1) It remains in a constant state; (2) when disturbed and then left to its own devices, wild nature returns to that original state and (3) finally, an ethic is attached to this natural state which is assumed to be preferable to all others.[23]
This view of nature is espoused in popular environmental literature throughout the world. It is the basis of twentieth century scientific theory about populations and ecosystems. It is the basis of our Federal and state laws and international agreements that control our use of wild lands and wild creatures.
The accumulation of evidence has led many ecologists to abandon the concept or declare it irrelevant, and others to alter drastically. They say that nature is actually in a continuing state of disturbance and fluctuation. Change and turmoil, more than constancy and balance, is the rule. As a consequence, say many leaders in the field, strategies of conservation and resource management will have to be rethought. The classic "balance-of-nature" paradigm has been replaced by a paradigm in which ecosystems are open, human influence has been ubiquitous and long-standing, and natural disturbance is multifaceted, widespread, and frequent. Everything is subject to periodic disturbance, of which fire is so common an instance as to be symbolic. Every organism in an ecosystem is a unique point of unpredictability striving to manage its environment to make it more comfortable for its self and its offspring.
However, most laypersons are unaware of this paradigm shift in ecology, which was consolidated over the last forty years.
First order and second order equilibrium. In short, first-order equilibrium -- a return of a disturbed ecosystem to the prior structure, and species population and inventory -- is at worst a myth, and at best an "ideal type" (like a "frictionless machine" in physics), never exemplified in nature.
Few ecologists have believed otherwise in the past, and none believe this today. Unfortunately, this understanding has not been universally acknowledged by environmental activists, popular writers, educators, and even some policy-makers.
In some systems the return frequency of disturbance is so long that the impression of equilibrium conditions develops. This is what underlies the traditional idea of climax communities. However, careful observation reveals that disturbance is ubiquitous and frequent relative to the life spans of the dominant taxa.
Populations do balance each other by their competition. Wolf numbers will decline when they eat too many caribou, because after caribou numbers get low enough, wolves starve. But neither the wolves nor the caribou populations are striving for equilibrium, but to expand their numbers.
Consider the chaparral biome of evergreen scrub oak. The system requires fire to release the chaparral seeds from their pods. No fire means no regeneration, and the chaparral community will be succeeded by a different community. So if the chaparral community is to persist through time, it must "walk" through a sequence of inflammable maturity, fire, regeneration, maturity, etc . Clearly there is no equilibrium at the first level, but there is equilibrium at the second level: a constant, repeated sequence. In this sense, it is like the "equilibrium" of the furnace thermometer: constant change (first order) according to a constant pattern (second order).
Second-order equilibrium -- the return of an ecosystem to a state of "health" and "integrity," though with an altered structure and component species -- remains a tenable ecological concept, with the constant caveat that even this (higher order) sense of "equilibrium" is also never completely exemplified in nature.[24]
- Order is not always our friend, nor chaos our enemy.
In our introduction section and the periodic transformation section under results, we have briefly discussed chaos theory and complex adaptive systems. Sustainability (and allied systems in agroecology and organic agriculture) often focus on creating very orderly systems with very well-defined rules. Resilience establishes systems which use disturbance to maximize evolution, adaptive reorganization and quick reassembly after adversity. Continuous improvement is the goal of any successful system and this means responding to competing systems, but sustainability often looks only at current drivers. Any agricultural or other business enterprise which commits all resources to maximizing external sustainability goals or efficiency or profits will often die when system drivers change and they can't change quickly enough.[25]
The basic conflict between seeking order in sustainability and embracing chaos in resilience warrants a deeper look at complex adaptive systems.
Complex adaptive systems. Complex Adaptive System (or CAS) theory recognizes that most systems have a capacity for self-organization and adaptation. This conceptual framework recognizes the complexity of systems (ecological, economic, and social) in the hierarchical structures, the interactions and energy flows between these hierarchies and the systems and subsystems self-organization and adaptation which form all systems.
A complex adaptive system is a system that has a diversity of “agents” which are connected, with certain behaviors and actions which are interdependent and which exhibit adaptation and self-organization. Each CAS is composed of multiple CAS which must be redundant, flexible, modular, diverse and prone toward reassembly. An economy composed of businesses, composed of people, composed of selves. Society is composed of communities, composed of families, composed of individuals, composed of selves, composed of cells, composed of proteins and lipids, composed of molecules, composed of atoms, composed of quarks, etc.
The resilient system has multiple states, multiple ways of dealing with adversity, disturbance or just changes in the external environment. Take a resilient college student for example. He can deal with sitting in school, actively playing sports, solitary study, socializing with friends, interacting in formal meetings with peers or formal meetings with his boss, children, elderly, his girlfriend and with platonic friends, and on and on.
When a CAS becomes less redundant, less flexible, less modular, less diverse, less ready for reassembly, it becomes more vulnerable to destruction when outside drivers change.
Transformation and change are inevitable. Trying to maintain a particular system means continually fighting the natural inclination to change. Finally the changes will build and you will be overwhelmed if you are not willing to adapt and transform your system.
Any effort to create a permanent agriculture or perpetually stable and constant system has a basic problem in this area. This we shall see as we explore another powerful and influential perspective: permaculture.
Uniting ecological resilience and permaculture
Any discussion of permanence in agriculture must discuss permaculture.[26] This is especially true for the purpose of comparing different approaches to resilience since the guiding principles of permaculture are nearly entirely consistent with the findings of ecological resilience research.
Permaculture exemplifies a basic quality of ecological resilience: ecological integration. Permaculture is a design philosophy which imitates and amplifies naturally occurring patterns, as do ecologically resilient systems. Below, the twelve permaculture design principles articulated by permaculture co-founder David Holmgren in his Permaculture: Principles and Pathways Beyond Sustainability[27] are explored to see the consistency with research on the adaptive cycles and ecological resilience.
Principle 1: Observe and interact: By taking time to engage with nature we can design solutions that suit our particular situation.
The concept of ecological resilience has arisen from observation of adaptive cycles in thousands of ecosystems. These observations, however, contrast with permaculture beliefs by embracing disturbance and change. No agricultural system is or can be permanent. All components are constantly adapting to each other and changing the system. Ecological resilience is not resilience in the materials science sense, where a material bounces back to its original form. Ecological communities naturally encounter disturbances which seem to destroy them. The oak-hickory forest where I live can be destroyed when a beaver family comes in, downs trees, builds dam. Organic matter gradually accumulates in the pond, eventually becomes a bog. Then a meadow. Then invaded by shrubs. Then forest. Multiple climax communities are possible depending on external drivers. Destruction of the climax community always occurs now and then, permitting the expression and renewal of other communities contributing to the resilience of the system. The ubiquity of disturbance has led to the concept of adaptive cycles.¬
Ecological communities are always in resilience and transformation cycles with four stages: rapid growth (r), conservation (K), release (Ω) and reorganization (α). Observance of any ecosystem over time reveals a succession of communities following these stages. A system which seeks to make one stage permanent runs afoul of this natural cycle.
Observation of nature also shows that the most successful systems have a host of potential tools which are deployed exactly when needed. These include the propagules of a multitude of organisms which respond to disturbance by creating new systems, not by cementing an established system.
Principle 2: Catch and store energy: By developing systems that collect resources at peak abundance, we can use them in times of need.
We suggest that by building assets with ample built in backups we can build resilient systems, reflecting the principle to catch and store energy very clearly.
A detailed approach to “peak abundance” is shown in the ecological resilience literature. American Indians learned to use regular burning to maintain grassland and attract and increase buffalo and other ungulates. Manure from grazing animals helps soils deepen and become more fertile, capturing more carbon and nitrogen and building communities of microorganisms, and soil flora and fauna so grassland is even more productive.
In the late 1900s farmers began using management intensive grazing to mimic natural systems. In management intensive grazing owners are always rotating to pastures in the r phase when the pasture has the highest nutrient content. Managers do not wait till the K phase, but induce the release phase (Ω) by grazing to induce the reorganization phase (α) of the adaptive cycle.
Principle 3: Obtain a yield: Ensure that you are getting truly useful rewards as part of the work that you are doing.
A resilient system gives positive feedback to the complex adaptive systems which contribute to its resilience. If you are contributing to the resilience, the permanence, of your system, you will receive the positive feedback which is continued yield (a more benign synonym for profit). This profit is extracted from the system for the use of you, the manager. If that yield is invested in useful tools, new skills or other inputs, yield can again contribute to resilience of the system.
However, profit can be stealing when you’re mining the soil. Stealing is extraction of yield without providing any contribution to improving the resilience of the system. Using this definition, taxes and insurance are other types of stealing.
Principle 4: Apply self-regulation and accept feedback: We need to discourage inappropriate activity to ensure that systems can continue to function well.
All living organisms adapt. Those who respond to feedback the best are the most resilient. The conservative innovation of ecologically resilient systems insures that innovation also learns from and preserves valuable practices of the past. The end goal is to weed out “inappropriate” activities that are corrosive, ineffective or outdated. Also in our application of periodic transformation we encourage renewal based on self-regulation and the feedback received within and outside the system.
Principle 5: Use and value renewable resources and services: Make the best use of nature’s abundance to reduce our consumptive behavior and dependence on non-renewable resources.
In the chapter on working with nature we explore how ecological resilience requires us to utilize the abundant resources and abilities of nature. Moreover, by working with those natural processes we can achieve equal or greater results by leveraging the complementary diversity ever present in nature.
Ecological resilience research wholly supports this principle by noting the lack of non-renewable inputs in ecological systems. We advocate local value-added processing to keep as many local resources as possible available in the local system. For example, producing herbal remedies from herbs you grow. Valuable herbal medicines are organic compounds made primarily of nitrogen, carbon and oxygen from the air and minerals from local rock. If these are removed, they are replaced by natural processes and enable the purchase of new tools which can decrease need for future inputs from outside.
Principle 6: Produce no waste: By valuing and making use of all the resources that are available to us, nothing goes to waste.
Viewed as an adaptive cycle, no living system has either resources or wastes. What some call resources, others might call wastes. Producing too much yield by extracting nutrients from the soil is wasteful. Often what we call resources are waste (or wasteful overproduction) from another system. All resources and wastes are inputs to other systems.
Within the working with nature and building assets chapters we assess the value and potential of channeling these resources into opportunities for growth.
Principle 7: Design from patterns to details: By stepping back, we can observe patterns in nature and society. These can form the backbone of our designs, with the details filled in as we go.
Complex adaptive systems (CAS) can only be made useful if we can see patterns in the chaos. In working with CAS going through the adaptive cycle it is important to find those regularities and make detailed decisions with them. Ecological resilience research has shown the overarching patterns (modular connectivity, complementary diversity, conservative innovation and flexibility, redundancy, etc.) which a permaculturalist can use to maximize resilience on their lands.
Principle 8: Integrate rather than segregate: By putting the right things in the right place, relationships develop between those things and they work together to support each other.
Optimizing connectivity is crucial to resilience. By bonding between units and bridging to other units, but remaining modular (not integrating too much with external systems), failure of one unit does not lead to failure of others. Ecological resilience further supports this with the principal of complementary diversity which aims to pair complementary components, placing the right plants, people or infrastructure in the right places with each other to create the results we’re looking for.
Integration also means feedback is insured and all outputs are turned into inputs for others within the system.
Principle 9: Use small and slow solutions: Small and slow systems are easier to maintain than big ones, making better use of local resources and producing more sustainable outcomes.
Ecological resilience research has expanded upon this basic principle. A basic observation of resilience research is: anything which can be done quickly can be undone quickly. The most valuable changes just take a while.
The fast, efficient system can often be most vulnerable to disruptions, less resilient. A just-in-time supply chain can cause the downfall of a business system if it is interrupted. Continuous improvement is the goal of any successful enterprise but only looks at current drivers. Resilience assumes enterprises will do their best to compete with each other and those who commit all resources to maximizing efficiency and profits will often die when system driver’s change and they can’t change quickly enough. The goal of adaptive governance for resilience is not to insure that all enterprises survive, only that their focus on efficiency does not include driving all other players out of the market.
Fast, unchecked coordination between units can speed a wave of failure throughout the system.
The slow variables, such as amount of soil organic matter, shape how a fast variable, such as crop production, responds to variation in an external driver, such as variation in rainfall during the growing season.
The fast-moving variables in the system fluctuate more in response to environmental and other shocks; and these shocks or directional change in the drivers can push the system across a threshold into an alternate stability regime.
“Fast” variables are typically those that are of primary concern to ecosystem users, for example a pest species or (often) ecosystem goods and services, such as crop production, clean water, and favored species. The dynamics of these fast variables are strongly shaped by other system variables that generally change much more slowly, and hence have been referred to as “slow”, or(because they are not always slow) “controlling” variables. They are not the same as the control variables used in other contexts, and to avoid confusion, ecosystem resilience researchers suggest it is best to simply refer to them as “slow” variables, recognizing that “fast” and “slow” are relative terms.
Resilient systems do respond quickly to minimize the impact of disturbance and to reassemble after disturbance. However, direct response to adversity is not the usual activity of any resilient systems. The usual focus is establishing a system which maximizes evolution, adaptive reorganization and the foundation for reassembly after adversity.
Principle 10: Use and value diversity: Diversity reduces vulnerability to a variety of threats and takes advantage of the unique nature of the environment in which it resides.
Resilient systems optimize diversity by making sure that diversity is complementary. Complementary units generate outputs which are needed inputs to other systems. Complementary units also engage the principle of backups, performing different functions and enabling the system to respond to multitudes of sudden problems.
If a unit is fulfilling the same function, producing the same outputs as other units, then it is not increasing complementary diversity. If not needed to optimize redundancy, then it is not contributing to resilience.
Some increases in diversity can destroy resilience. This include invasive plants or man-made systems which accumulate resources instead of feeding them back into the adaptive cycle.
Principle 11: Use edges and value the marginal: The interface between things is where the most interesting events take place. These are often the most valuable, diverse and productive elements in the system.
Adaptive cycles, with their r, K, Ω and α stages are most apparent on the edges of systems. On the edges, one system in transitioning from Ω into α and its successor is in α reassembling into r phase. The Ω is where resources are released and made available as profit (or taxes or other forms of stealing) or as inputs to the new system in α phase. Ω exists at margins where one system is dissolving and creating another system.
Principle 12: Creatively use and respond to change: We can have a positive impact on inevitable change by carefully observing, and then intervening at the right time.
Ecological resilience requires change. Periodic transformation is the quality of ecological resilience that most readily reflects this permaculture value. We explore in that chapter the value of creatively using times of disturbance. The Ω phase inherent to every adaptive system is not destruction or an end, but a necessary part of reorganization to a more productive system. Ω is precursor to α, reassembly, reorganization creation of new system with emergent qualities.
Change and adaptation are at the foundation of ecological resilience, which views all living systems as complex adaptive systems (CAS) composed of other complex adaptive systems. Each CAS is composed of multiple CAS which must be connected, redundant, flexible, modular, diverse and prone toward reassembly. Each CAS is continuously changing in response to feedback from other CAS. An economy is composed of businesses which are composed of people which are all changing and adapting to each other. Society is composed of communities, composed of families, composed of individuals, composed of cells, composed of proteins and lipids, composed of molecules, composed of atoms, composed of quarks, etc.
Since each CAS is composed of CAS adapting to each other, every living system is constantly in flux. For example, the resilient person has multiple ways of dealing with the external environment and adversity. Sitting in school, actively playing sports, solitary study, socializing with friends, interacting in formal meetings with peers or formal meetings with bosses, with children, with elderly, are all useful responses demonstrating the flexibility needed for resilience.
When a CAS becomes less redundant, less flexible, less modular, less diverse, less ready for reassembly, it becomes more vulnerable to destruction when outside drivers change.
To assume that a system should remain stable, consistent and effectively stagnant is short sighted and destructive. A foundation of ecological resilience is a system’s ability to both anticipate disturbance and to absorb it constructively.
Summarizing the relationship of ecological resilience and permaculture, ecological resilience provides an empirical foundation for some aspects of permaculture, refines other principles and shows some permaculture pronouncements are too broad and sweeping. The value of a discipline such as permaculture is enhanced when it stays grounded in the natural patterns it seeks to emulate, manage, and improve.
This is the task of anyone seeking to create an ecologically resilient system, to mimic the inevitable ebb and flow of nature. Within the shifting qualities of nature we can build lasting and, relatively, permanent structures that can continue to serve populations long into the chaotic and unpredictable future of our planet.
Vulnerability and resilience. Vulnerability assessment is entrenched in international rural development circles.[28] People have built careers and reputations on the concept. Vulnerability assessment has even crept into some climate change circles.[29]
Vulnerability research has a long history in social psychological research. Vulnerability is an attractive characteristic, to some. The look of vulnerability is said to be "the key to unlocking intimacy.” “The more vulnerable you look, the more men find you attractive.” There’s even a vast and growing body of psychological research on the topic: “Why do we find vulnerability attractive?”[30] Vulnerability, as a set of signals used to stimulate attraction, does seem to have some physical reality. Big eyes, small chin and other characteristics of infants do connote vulnerability and do induce protective instincts across many species.
Neoteny, in the field of developmental biology, is the retention, by adults, of traits seen only in babies of its progenitors. Baby chimpanzees look much more attractive to us than adult chimps.
In babies, vulnerability means dependency. We want to take care of a new baby. It’s hardwired into us. But dependency in rural development is something to be avoided. It is the opposite of resilience.
Furthermore, vulnerability in famine mitigation, poverty reduction, disaster preparation, etc., refers to the lack of something. You can’t measure the lack of something except by measuring the real thing which is lacking. You can’t measure how much space is left in a glass without the water which is already in the glass. If the water is gone, so is the lack of water which once the water enabled you to see.
Empirical scientists usually feel that they can only study something when they can measure it. Other, more theoretical, scientists study with the hope of someday measuring it. In order to measure something, it must exist. A huge number of concepts in psychology and sociology do not exist in Nature. So they can’t be measured, no matter how much some psychologists build their careers on them. In the long run, it’s not wise to build your career on a nonexistent phenomenon. Just because it has a name does not mean it exists, except in the minds of the deluded. That’s why psychologists need to get out in nature and away from people regularly. And not just psychologists, but all of us.
Vulnerability, from an ecological resilience perspective, is simply the lack of resilience. Resilience is the real phenomenon of which vulnerability is just the lack. If you measure resilience on a 0-1 scale, vulnerability is 1 minus resilience. V=1-R.
Conclusions
Sustainability, agroecology, organic agriculture and permaculture can each be improved by incorporating ecological resilience research. You can follow any of these approaches and still be consistent with the natural processes revealed by resilience research. What ecological resilience research adds to these approaches is a more specific method. One that is echoed through every old growth forest and developed prairie. The eight factors outlined in this book combined with ecological resilience research from around the world also adds a distinct dimension of change, shift and new beginnings. Where too-often systems aim to stay the same, resilient systems are waiting for change, poised to respond and recalibrate.
Citations and notes on impact of resilience on sustainabilility, permaculture, agroecology, vulnerability
[1] Rittel, H. and M. Webber, 1973. Dilemmas in a General Theory of Planning, Policy Sciences 4:155-169; Tackling Wicked Problems: A Public Policy Perspective, http://www.enablingchange.com.au/wickedproblems.pdf
[2] Sustainable development is “development that meets the needs of the present without compromising the ability of future generations to meet their own needs'' http://www.earthsummit2012.org/about-us/historical-documents/92-our-common-future
[3] http://clinton2.nara.gov/PCSD/Overview/index.html
[5] See the five part series in the Guardian (http://www.theguardian.com/sustainable-business/sustainability-movement-faces-extinction) and many articles in the New York Times, e.g., http://www.nytimes.com/2012/11/03/opinion/forget-sustainability-its-about-resilience.html?pagewanted=all&_r=0)
[6] http://www.federalreserve.gov/newsevents/speech/bernanke20130412a.htm
[7] https://www.devex.com/en/news/blogs/usaid-s-new-way-of-doing-business
[8] c.f., National Research Council, 2011. Toward Sustainable Agricultural Systems in the 21st Century.
[9] Ibid, p. 355.
[10] http://www.nrmca.org/resilience/downloads/Resilence_Article.pdf
[11] http://inhabitat.com/resilient-design-is-resilience-the-new-sustainability/
[12] http://living-future.org/resilience-new-driver-sustainability)
[13] http://www.wri.org/blog/new-language-sustainability-risk-and-resilience
[14] http://resilience.osu.edu/CFR-site/concepts.htm; http://www.stockholmresilience.org/ ; http://www.resalliance.org/
[15] Some resilience researchers, however, have introduced external criteria as we discuss in Chapter 10.
[16] Agroecology, which many see as the foundation of sustainable agriculture, is likewise torn between being a science, a social movement and a set of practices as explicated by Wezel et al., 2009. Agroecology as a science, a movement and a practice. A review. Agron. Sustain. Dev. http://www.ensser.org/fileadmin/files/2009_Wezel-etal.pdf. Organic agriculture is also torn between the three.
[17] See discussion in the Working with Nature: ecological integration chapter.
[18] See discussion in the Embracing disturbance for periodic transformation chapter.
[19]http://www.theguardian.com/world/2014/may/08/india-admits-delhi-matches-beijing-air-polllution-world-health-organisation-cities; http://www.economist.com/news/leaders/21642172-narendra-modi-should-learn-chinas-mistakes-its-too-late-indian-winter
[20] http://www.epa.gov/sustainability/analytics/life-cycle.htm
[21]Odum, H., 1974. Energy, Ecology, & Economics, http://www.sustainabletucson.org/2007/01/energy-ecology-economics-by-howard-t-odum-intro-by-bob-cook/
[22] Gliessman, S., 2004. Agroecology and Agroecosystems. In Agroecosystems Analysis, http://www.canunite.org/sites/default/files/agroecology%20and%20agroecosystems2004.pdf
[23] http://gadfly.igc.org/papers/much-ado.htm
[24] First and second order equilibrium ref.
[25] Though beyond the scope of this report competition which destroys other systems to create a monopoly destroys the diversity necessary for resilience. Adaptive govvernance for resilience insures that a business, farm or other component system does not use momentary advantage to drive all other players out of a market or even out of existence.
[26] http://permaculturenews.org/
[27] http://permacultureprinciples.com/product/principles/
[28] Moret, W., 2014. Vulnerability Assessment Methods. USAID. http://www.fhi360.org/sites/default/files/media/documents/Vulnerability%20Assessment%20Methods.pdf
[29] Manangan AP, Uejio CK, Saha S, Schramm PJ, Marinucci GD, Brown CL, Hess JJ, and Luber G. Assessing health vulnerability to climate change: A guide for health departments. Climate and Health Technical Report Series, 2014. (http://wwwdev.cdc.gov/climateandhealth/pubs/AssessingHealthVulnerabilitytoClimateChange.pdf.
[30]http://attractioninstitute.com/being-vulnerable-and-increasing-the-attraction/
II. Impact on other frameworks of resilience
The qualities of resilient systems have been explored by other researchers. Below we discuss a few of the many other attempts to develop systematic tools for inducing ecological resilience. On the surface, these attempts seem different and may appear confusing, but in fact they have all helped us understand and unearth the eight roots of resilience in this book. In this section, we will explore in more depth several of the most prominent frameworks and show how they fit with our eight qualities of ecologically resilient systems.
|
Scale is crucial to a deeper understanding of resilience. When you inoculate a log with lion’s mane mushroom spawn, you are making an innovation from the scale of the farm, but a transformation from the scale of the log. Likewise building up the soil is building an asset for the farmer, but at the scale of the soil, redundancy is increasing. An asset at one scale is redundancy at another scale. Similarly local self-organizing and ecological integration are similar qualities at different scales. However, resilience at any given scale seems to require that all eight qualities are present. |
Do we need to understand everything about an ecosystem to predict or induce resilience? Some contend that understanding resilience requires a thorough understanding of the many aspects of social, biological, and ecological systems as they interact. This complexity has spawned a multitude of frameworks for understanding social-ecological systems.[1] This is the approach taken by the Resilience Alliance with their Resilience Assessment Workbook.[2] This tool takes a stepwise approach to describing an Social Ecological System by first defining its boundaries, framing key issues, and identifying critical thresholds: a process referred to as defining “the resilience of what to what.” Answering this question appears to be a first step in most assessments.
Our approach seeks not to first define the overall SES. Since resilience is an emergent property of social-ecological systems (SES), the complexity of interactions within each SES make each SES unique and render impossible accounting for every factor which influences resilience now and in the future. One may be able to define a specific component and design it to be resilient (such as reducing the effect of flooding on an electric power grid). However, a comprehensive framework will focus on a few of these influences and cannot define specific activities needed to improve resilience to all present and future disturbances.
Most ecological resilience researchers instead have attempted to establish what basic qualities appear in all resilient systems.
One of earliest (by Walker and Salt[3]) formulates a set of nine necessary qualities for a resilient world: Diversity, Ecological Variability, Modularity, Acknowledging Slow Variables, Tight Feedbacks, Social Capital, Innovation, Overlap in Governance, and Ecosystem Services.
Carpenter et al. [4] clarified the distinction between the specific “resilience of what to what” and general resilience which confers the ability cope with any disturbance. They went on to posit nine slightly different qualities which enable general resilience: diversity, modularity, openness, reserves, feedbacks, nestedness, monitoring, leadership, and trust. Since Walker is one of the authors of the Carpenter paper, we will assume that this later version subsumes his and Salt’s earlier formulation.
|
Some resilience theorists lump and some split. Others lump and then split. Carpenter et al. split the emergent quality of modular connectivity into several areas. Our interest is in finding the emergent qualities which are necessary to resilience, whether they are lumped or split into various categories. |
Frankenberger et al.’s conceptual framework for community resilience[5] is an influential treatment of resilience from a sociological perspective. This framework posits seven central “community social dimensions.” These are preparedness, responsiveness/flexibility, learning and innovation, self-organization, diversity, inclusion and aspirations. Seeing the impossibility of predicting interaction of innumerable complex adaptive systems, others have come up with lists of principles, qualities or indicators correlated with resilience similar those of Frankenberger et al.’s central dimensions.
Rockefeller Foundation has developed a City Resilience Framework which posits seven slightly different qualities of resilient systems: reflective, robust, redundant, flexible, resourceful, inclusive and integrated.[6]
The Stockholm Resilience Center has developed a set of “seven principles that are considered crucial for building resilience in social-ecological systems”: maintain diversity and redundancy, manage connectivity, manage slow variables and feedbacks, foster complex adaptive systems, encourage learning, broaden participation, and promote polycentric governance.[7]
|
Resilience is viewed by some as an emergent quality. Emergence occurs when the merger of components results in a system with properties unknown in any of its components. Resilience is a quality which can be present at all scales. We contend it must be present in component systems to be present at any particular scale. Hence, resilience emerges at a particular scale, only if already present at component scales. Resilience is a bottom-up process, though it can be created top-down through management changes in social ecological systems. |
Perhaps the most comprehensive review to date is Cabell and Oelofse,[8] which details thirteen categories of indicators shown to be associated with resilience: socially self-organized, ecologically self-regulated, appropriately connected, functional and response diversity, optimally redundant, reflective and shared learning, spatial and temporal heterogeneity, exposed to disturbance, coupled with local natural capital, globally autonomous and locally interdependent, honors legacy, build human capital and reasonably profitable.
Our approach derives the qualities of resilient system from direct observation and case studies of eight resilient local food systems. We seek not to model the complete complexity of interacting adaptive systems which compose each SES. Nor are we satisfied with simply noting indicators which correlate with resilience. Instead our project is to define the qualities which are foundational to resilient systems. Then we seek indicators which tell us these qualities are present. Below, the eight qualities to emerge from our study are compared to the five discussed above which will be referred to as: Carpenter et al., Frankenberger et al., Rockefeller, Stockholm Resilience Center or SRC, and Cabell and Oelofse.
- Modular Connectivity.
All prominent frameworks for resilience recognize the importance of connectivity and modularity. Some who are mainly concerned with human systems make social capital a separate category. We see social capital as describing a type of connectivity which occurs in all systems, not just human systems.
Carpenter et al. have a strong focus on modular connectivity. However, they split this quality into several separate areas: modularity, managing feedback, monitoring, openness, and development of trust.
Cabell and Oelofse call the quality appropriately connected. They extoll connectivity, but don’t recognize situations where high connectivity leads to low resilience. If the system is not modular or independent, it can’t be resilient when disturbance floods though systems.
Frankenberger et al. see the vital importance of social capital, but discuss other aspects of connectivity in less detail and do not discuss modularity.
Rockefeller uses slightly different terminology. Instead of connectivity, they refer to resilient systems as integrated (where exchange of information between systems enables them to function collectively and respond rapidly through shorter feedback loops). Instead of modularity, they use the term robust. (Over-reliance on a single asset, cascading failure and design thresholds that might lead to catastrophic collapse if exceeded are actively avoided.)
Stockholm Resilience Center focuses on managing connectivity and feedbacks, but with less emphasis on modularity than other frameworks.
2. Locally Self-organized.
Frankenberger et al. and Cabell and Oelofse have a strong focus on the locally self-organized quality. Cabell and Oelofse use the term socially self-organized and specifically cite the example of local food systems in the US. They make a distinction echoed in many other frameworks, that locally self-organized networks can be more responsive and adaptable to changing conditions than can larger groups. Top-down initiatives can fail if the timing is wrong, if the needs are misinterpreted, or if there is no buy-in from the stakeholders. Frankenberger et al. and Rockefeller refer to the quality as inclusiveness.
Other frameworks are less specific about the need for local self-organization, but imply its importance in the quality labelled overlap in governance (Walker and Salt), nestedness (Carpenter et al.) and polycentric governance (SRC). These three frameworks all focus on need for governance above the local level to be focused on resilience. Since we see local as a term relative to scale, this distinction is not useful in our framework. Regional and national and world governance are examined at their own scale. All ecosystems are nested since every system is composed of systems. Every resilient system contributes to the resilience of subsystems of which it is composed. Those subsystems are resources or assets to the larger system which must be enhanced and maintained, as we address in the next quality.
- Building Physical Infrastructure.
Rockefeller is most explicit about the need for physical infrastructure. They use the term robust to refer to well-conceived, constructed and managed physical assets, which enable a system to withstand the impacts of hazard events without significant damage or loss of function.
Cabell and Oelofse emphasize that resilient systems are coupled with local natural capital—the slow variables such as soil organic matter, hydrological cycles, and biodiversity. SRC also notes the importance of managing slow variables, though without emphasis on building up such assets, perhaps because their focus is not primarily agroecosystems.
Frankenberger et al. highlight community assets, which are resources that enable communities to meet the basic needs of their members and reduce vulnerability to shocks. However, the broad definition of assets (including both tangible and intangible assets: social, human, financial, natural, physical, and political capital) makes measurement of this quality difficult in Frankenberger et al.’s framework. Frankenberger et al. proposes two other qualities which are not explicitly stated in other conceptualizations, but are related to building assets: preparedness and aspiration. Preparedness refers to the community resources needed to cope with disturbance. Aspirations are the underlying personal qualities which make people make investments needed to cope with disturbance. Both terms also are defined to include tangible and intangible assets, making measurement difficult.
The other frameworks are not explicit about the necessity of building assets for resilient systems, though the quality seems to be assumed in such terms as reserves (e.g., by Carpenter et al.) which contribute to recovery from disturbance. Reserves cannot be created without the productive assets needed to create them. Reserves, in our framework, reflect the presence of redundancy (or back-ups) as shown below.
- Responsive Redundancy or Back-ups.
Redundancy is seen as crucial in all resilience frameworks, though Frankenberger et al. does not explicitly use the term. Cabell and Oelofse use the term optimally redundant. This highlights the crucial qualification that redundancy inevitably increases inefficiency of the system. The presence of reserves, as noted above, reflects redundancy in our framework.
- Complementary Diversity.
Diversity is extolled by nearly all resilience frameworks. Some frameworks (e.g., Carpenter et al., SRC and Frankenberger et al.) do not address the need for diversity to be complementary or that diversity can undermine resilience. Cabell and Oelofse, in contrast, make this distinction explicit. They also include, as a separate quality, spatial and temporal heterogeneity which is lack of uniformity across the landscape and through time. We see this as a measure of diversity, not a separate quality from diversity.
Though Rockefeller fails to explicitly mention the quality of diversity in their 20114 index, in 2015 their website included diversity as a characteristics of all resilient systems.
- Conservative Innovation and Flexibility.
Innovation is a necessary quality of resilient systems in nearly all frameworks. Carpenter et al. discuss it under their term openness; Rockefeller under flexible, resourceful and reflective; Cabell and Oelofse under build human capital and reflected and shared learning; SRC under encourage learning; Frankenberger et al. under responsiveness/flexibility and learning and innovation. Many frameworks, however, are not as explicit about the dangers of innovation which does not, as Cabell and Oelofse put it, honor legacy. Legacy is the memory component of the SES. Frankenberger et al. refers to this quality as memory with strong community memory of traditions, practices, past disasters, and changing conditions supporting communities’ abilities to draw on experience to prepare for and respond to similar challenges.
- Ecologically integrated (Working with Nature)
Cabell and Oelofse are the most explicit in recognizing the value of ecological integration when they state that the more intact and robust the regulating ecosystem services are, the more resilient the agroecosystem. They further suggest that more resilient systems are more capable of self-regulation.
Rockefeller’s discussion of integration and the importance placed on diversity by all other frameworks make this quality implicit in all the frameworks. Our analysis of local food systems indicates that the quality should be explicitly measured and induced.
- Reorganizing, reforming, embracing disturbance for transformation.
Cabell and Oelofse mostly clearly see “exposed to disturbance” as a quality of resilient systems. Resilient systems regularly form new systems. Cabell and Oelofse’s indicator of temporal heterogeneity also shows recognition of the transformation over time of resilient systems. Frankenburger notes the importance of transformative capacity.
Though innovation within a system is transformative on a smaller scale and is a quality recognized by all as necessary to resilience, most frameworks don’t make the leap to recognizing that sometimes the innovation required may be so extensive as to transform the entire system. This limited embrace of transformation is illustrated by Rockefeller’s emphasis on reflective systems which notes that resilient systems have mechanisms to continuously evolve, but does not go so far as to say they are periodically totally transformed.
Our work with local food systems indicates that transformation is a quality necessary to resilience and must be explicitly included.
|
Adaptive cycle and the eight roots of resilience. Transformation and innovation are easily identified as the qualities underlying the omega or dissolution phase transition to the alpha or reorganizing phase. Building assets and redundancy are associated most clearly with the K or conservation phase. Diversity is a result of innovation and transformation and most clearly seen as alpha moves into the r or rapid growth phase. Local self-organizing and ecological integration and modular connectivity are readily apparent in the r phase. However, all qualities must be available to the system throughout the life cycle when needed. |
Our eight qualities are compared to qualities proposed by the six other frameworks in the following summary chart.
|
|
Cabell and Oelofse |
Carpenter et al |
Rockefeller |
Stockholm Resilience Ctr |
Frankenberger et al. |
Walker and Salt |
|
1.Modular connectivity |
Appropriately connected. |
Modularity, openness, feedbacks, monitoring, leadership and trust |
Integrated (connected) Robust (modularity) |
Manage connectivity Manage slow variables and feedbacks |
Social capital |
Modularity, Tight Feedbacks |
|
2. Locally self-organized |
Socially self-organized; globally autonomous and locally interdependent |
nestedness |
inclusive |
Promote polycentric governance systems (nestedness)
|
Self-organized inclusive |
Overlap in Governance |
|
3. Build Assets |
|
|
robust |
|
Community Assets preparedness aspirations |
Social Capital |
|
4. Responsive Redundancy/Back-ups |
Optimally redundant |
reserves, |
redundant |
Maintain redundancy |
|
|
|
5. Complementary diversity |
Functional and response diversity; spatial and temporal heterogeneity |
diversity |
|
Maintain diversity |
Diversity |
Diversity |
|
6. Conservative innovation |
Builds human capital; honors legacy; Reflected and shared learning |
openness |
reflective, flexible, resourceful, |
Encourage learning |
Learning and innovation; responsiveness/ flexibility Memory |
Innovation |
|
7. Ecologically self-regulated (works with nature) |
Ecologically self-regulated, coupled with local natural capital |
|
integrated |
|
|
Ecological Variability, Ecosystem Services |
|
8. Embracing disturbance for transformation |
exposed to disturbance temporal heterogeneity |
|
reflective |
Foster complex adaptive systems thinking |
Responsiveness |
|
What did we leave out? Nearly all of the factors deemed necessary by other frameworks are incorporated in our eight qualities of resilience. A couple are not. Stockholm Resilience Center is the only framework which adds the quality foster complex adaptive systems. Complex adaptive systems do embrace and use disturbance for transformation. However, all living systems are complex adaptive systems, so fostering CAS does not distinguish a resilient from a non-resilient system.
Similarly, “sufficient profit,” one of Cabell and Oelofse’s 13 indicator categories, does not distinguish between resilient and non-resilient systems. A resilient system will be generating sufficient profit, but profit is not necessarily an output which leads to resilience. Excess profit can certainly lead to non-resilience if it extracts too many resources from the system while giving little back, as we discuss in depth in previous sections. Other systems may not be profitable one year due to expenses related to increasing resilience.
Which set of qualities are the most useful? The eight qualities we present each appear to be necessary for resilience in the local food systems we present in this book. Those who arrived at the other sets of qualities likely feel their set fits the systems they know best. The best way to decide between is to attempt to induce resilience in your own local food system or other agroecosystem. In order to do that, we need to operationalize these concepts. We must have specific ways of inducing and measuring each of these qualities. We don’t pretend we have the final answers, rather we have tried to define the questions which will lead to particular local answers for a particular system. In the first chapter of this book, we proposed such a set of questions at the scale of the farm, here they are reworded to focus on the community level.
- How is your community independent yet tightly connected to other communities, markets and government policy systems?
- How is your community welcoming a diversity of complementary enterprises?
- How is your community establishing back-ups and redundancy?
- Are you insuring your community is as locally-oriented as possible? How are you helping your local systems to self-organize to increase resilience?
- What assets are you building on your community? How do they contribute to your community’s resilience?
- Is your community increasingly working with nature, achieving ecological integration?
- How do you insure innovation is regularly occurring on your community in a way which conserves the tried and true methods which built it?
- How is your community embracing disturbance and periodically transforming itself?
In the following chart, we have generated activities and measures at various scales which we hope you will use to test our hypothesis.
If we continue to find these qualities in resilient systems, our basic concept will have been supported, but our work is not complete. Given limited resources, which of these qualities is most important? If all are not necessary in all situations, which should we induce first and which can wait? Are some of the qualities easier to induce in some situations? What determines how easy a quality is to induce? Are low levels of some qualities as effective as higher levels? How much bang for our buck do we get from various intervention to induce each quality? What is the cost-effectiveness of inducing change in each quality?
There are a virtually unlimited set of questions whose answers could help our systems become more resilient to climate change, economic change, technological change, political change or any of a vast set of potential disturbances on our agroecosystem.
The following diagram illustrates a number of ways to think about each factor at different social and biological scales.
Resilient food systems three dimensional matrix: scale, qualities, time |
||||||||
|
|
modular connectivity |
locally self-organization |
Increasing physical infrastructure |
Responsive redundancy |
complementary diversity |
conservative innovation |
ecological integration |
periodic transformation |
|
Federal Policy System |
Cooperative development programs (RCDG) |
VAPG, FMPP, LFPP, F2S implemented with ease of access for planning funds for local projects |
NRCS support for increasing assets (soil, water catch & conserve, equipment, fence) |
BFRDP focused on training a new generation of farmers |
Opportunity workshops to encourage diversification of crops and markets |
On-farm innovation demonstration trials of tools incorporating traditional methods, tools and products |
Workshops to increase use of ecological services (beneficials, cover crops, MIG) |
Support for new leader training in farm & cooperative groups. |
|
Regional Network
|
Bridging contact maintained to all member groups. |
Bring contacts which facilitate local control |
↑Capability of network to assist local asset increase. |
Network recruits new groups from across region. |
Accesses new markets, practices for farmer groups |
Local traditions celebrated while new ideas embraced |
Wilderness reserves maintained |
Regular turn-over in governing officials. |
|
Community |
Facilitates communication between all members. |
Local firms encouraged, outsiders must partner |
↑ infrastructure for services. |
Community maintains and replaces all needed services. |
Increased diversity dedicated to local heritage |
Community embraces innovation and new practices as preserve heritage. |
↑Area of parks and woodlands |
New and young leaders encouraged. |
|
Group of farmers |
Farmers trust and value other members of group |
LOVA local ownership of processing and marketing |
Processsing/market equipment and facilities growing |
Group recruits new members |
Many different markets maintained for products |
Variety of processing methods used as markets change |
Support refuges and local heritage products |
New processing/ marketing systems and products adopted |
|
Farm and farm family |
All systems on farm are independent but connected |
Local managers make land decisions |
Farm assets, equipment, inventory |
Family and friends ready to help manage farm |
Variety of systems (e.g., crop/livestock) integrated. |
Farm uses old and new tools to produce heritage and new products |
Wild refuges maintained on farm |
Kaizen, continuous improvement of farm systems |
|
Soils |
Feedback tight between soil and soil cover systems |
Local soils need few inputs |
Soil health increasing |
Soil systems, soil cover reproduce selves |
Diversity of soil organisms, and plants maintained. |
Soil systems adapt to changing conditions |
Native flora, fauna, EM increasingly relied on. |
More systems for ↑ SOM, soil depth |
|
Water |
Water resource and need have tight feedback. |
Local water harvest meets local need |
Water capture increasing |
Water sources steady to increasing |
Multiple water sources available. |
Variety of water sources developed/ maintained. |
Water systems enhance wilderness |
New systems employed to harvest/store local water |
|
Person |
Bonding and bridging social capital |
Internal locus of control |
Maintains equipment, soil, water catchment |
Heals quickly, helps others learn |
Has variety of approaches, attitudes |
Changes approach when need to |
Follows natural cycles, eats wild |
Regularly tries new patterns, breaks old habits |
Eight or five or thirteen or three?
Scientists are renowned for bickering over terminology. Much of the bickering results from pride of authorship and other temporal concerns. Only continued research will clarify which framework is most useful—or lead to creation of new frameworks even more useful than any of these. We have focused on determining the number of qualities necessary to insure resilience. Our qualities can be lumped into broader categories only for heuristic purposes. That is, if it makes understanding them easier, please lump.
Eight qualities in three categories?
For example, we could argue for lumping our eight qualities into just three categories: establishing ecologically sound networks, creating new systems and building up resources.
Establishing an ecologically sound network. Three of the eight qualities of ecological resilience concern the establishment of ecologically sound networks. Modular connectivity, Ecological Integration (Working with Nature) and Local Self-Organization are distinct qualities which emerge in resilient systems at different aspects and scales of the system.
Modular Connectivity emerges in the relationships between all components.
Ecological integration occurs as natural, self-regulating ecological systems merge with those managed more closely by man.
Local Self-organization is created as all components become more tightly meshed in one emergent whole based on local control.
Creating new systems. Local self-organization is also closely related to three other qualities.
Conservative Innovation and Periodic Transformation are distinct qualities which emerge independently at each scale but are similar when viewed from different scales. A conservative innovation at one scale can be a transformation at another scale.
Complementary Diversity could conceivably be lumped in this category since it arises from innovation and can lead to transformation.
Innovation, transformation and diversity all show self-organization as different components merge into novel wholes.
Building up Resources. Increasing Physical Infrastructure at the scale of the farm may reflect redundancy at other scales. The soil infrastructure is created by the redundancy of many soil organisms. From the community level, the infrastructure of many viable farms is created by the redundancy of each farm.
Adaptive cycle and qualities of resilience.
This lumping of qualities usefully brings us back to the adaptive cycle of all living systems, as illustrated in the accompanying figure.
The qualities subsumed under “Establishing an ecologically sound network” can be seen most readily in the alpha stages of the adaptive cycle—when a system is getting organized and growing rapidly.
The qualities subsumed under “Building up resources” are most evident in the K phase—maturation.
The qualities subsumed under “Creating new systems” are most evident in the omega and alpha phases. Often these phases overlap as an innovation is created which gradually transforms the system by creatively destroying the previous system.
Appreciating the interrelationships of each of the eight qualities becomes easier as you understand each quality in more depth, seeing their interactions at different stages.
Citations on impact on other frameworks of resilience
[1] Binder, C. R., J. Hinkel, P. W. G. Bots, and C. Pahl-Wostl. 2013. Comparison of frameworks for analyzing social-ecological systems. Ecology and Society 18(4): 26. http://dx.doi.org/10.5751/ES-05551-180426
[2] Resilience Alliance, 2010. http://www.resalliance.org/resilience-assessment
[3] Walker, B. and D. Salt, 2006. Resilience Thinking. Washington, D.C.: Island Press.
[4] Carpenter, Stephen R., Kenneth J. Arrow, Scott Barrett, Reinette Biggs, William A. Brock, Anne-Sophie Crépin, Gustav Engström, Carl Folke, Terry P. Hughes, Nils Kautsky, Chuan-Zhong Li, Geoffrey McCarney, Kyle Meng, Karl-Göran Mäler, Stephen Polasky, Marten Scheffer, Jason Shogren, Thomas Sterner, Jeffrey R. Vincent, Brian Walker, Anastasios Xepapadeas and Aart de Zeeuw, 2012. General Resilience to Cope with Extreme Events. Sustainability, 4:3248-3259; doi:10.3390/su4123248
[5] Frankenberger, T., Mueller M., Spangler T., and Alexander S. October 2013. Community Resilience: Conceptual Framework and Measurement Feed the Future Learning Agenda. Rockville, MD: Westat.
[6] https://www.rockefellerfoundation.org/report/city-resilience-framework/
[7] Biggs, R., et al., 2015. Principles for Building Resilience in Social-Ecological Systems. Resilience Alliance and Cambridge University Press.
[8] Cabell, J. F., and M. Oelofse. 2012. An indicator framework for assessing agroecosystem resilience. Ecology and Society 17(1): 18. http://dx.doi.org/10.5751/ES-04666-170118
Economic Analysis
The Sustainability/Resilience Index (SRI) subsumes economic indicators of sustainability in the eight ecologically based qualities of resilient and sustainable systems. While economic sustainability is required for a high SRI, our research looked at underlying causes for the results of economic and social sustainability.
Farmer Adoption
Farmers responding to our online educational materials express gratitude for our making available these materials. The next phase of the project will focus specifically on farmer incorporation of more resilient and sustainable qualities in their systems.
Areas needing additional study
The Sustainability/Resilience Index (SRI) needs to be tested in high productivity regions of the South since it is based on examination of resilient local food systems in lower productivity regions and possibly refined after conducting case studies in those regions. A second area for future research (Quality of life including health, poverty, equity, etc.) was only touched on tangentially in this study. Below we present initial findings and areas needing additional study on the topic of sustainability, resilience, productivity and quality of life.
Introduction
Ecological resilience provides a means of assessing and improving sustainability of agricultural systems based on qualities present in both natural ecosystems and agroecosystems. Resilience is the amount of disturbance which a system can absorb before dissolving. Climate change is among the many disturbances to agricultural systems. We seek to determine the necessary qualities of resilient Southern agricultural systems.
SSARE funding twenty years ago helped establish local processing and marketing as a key quality of sustainable systems. A local food movement has followed in the United States. We examined ecological resilience of long-lasting local food systems created in recalcitrant areas of the South. Consistent with the resilience literature, we found that specific qualities were present in all these systems. By combining indicators of these qualities from databases such as the National Agricultural Census, we developed a draft sustainability/resilience index (SRI). Fascinating preliminary results emerged from applying the draft index to all counties in the South. For example, states which have received the highest levels of SSARE funding have the highest average resilience index scores in their counties.
Initial results are that counties with high resilience scores generally have high health scores, low poverty levels and stable to slightly increasing population. However some parts of the South (e.g., western Appalachia) show the reverse. We seek to understand why and modify the draft index if needed. Details are given below.
The draft index also resulted in low resilience scores for many of the Southern counties which produce high levels of agricultural commodities. Two regions of the South (the Delta and the High Plains) ranked almost uniformly low on the draft index. However, some counties in these regions have very high resilience index scores. These results raise two questions: does the draft index need to be modified to accurately reflect resilience in high productivity areas and why do some counties in low resilience regions have high resilience scores?
Findings and Future Research Needs Regarding Quality of Life and Resilience
Measures of resilience, as discussed in detail elsewhere in this report, do not directly incorporate indicators of quality of life. Incorporation of quality of life parameters underlies why sustainability is a wicked problem[1] and resilience is not. Wicked problems, as discussed tangentially in other chapters, have several characteristics: they must be solved before they can be understood, every example of the problem is unique, and there is no immediate and no ultimate test of a solution due in large part to polarized stakeholders with conflicting values precluding any agreement on criteria to determine when a solution is found.[2] Climate change is a classic wicked problem[3] as are most situations of environmental degradation, overpopulation, endangered species, poverty, and food security.
Solving one wicked problem (whether to suppress fire in sustainable yield forestry) led to the concept of ecological resilience.[4] As discussed in the previous chapter, ecological resilience avoids the polarizing aspects of sustainability with a measureable biological reality: the amount of disturbance a system can take before it dissolves without being able to reconstitute itself. The resilient system survives, the non-resilient does not.
If one adheres to the standard definition of resilience (ability to withstand disturbance) ecological resilience assessment differs from sustainability assessment in one basic area. Resilience assessments will not incorporate indicators unless they are associated with the ability of a system to withstand disturbance. The holy grail of resilience measurement is a set of indicators of the key qualities of ecological resilience across scales and types of systems, including soils and wildlife systems. Indicators regarding human social demographics, no matter how important they are, therefore cannot be indicators of basic and universal qualities of resilience.
Sustainability assessments include a variety of indicators which express normative or aspirational conditions which many deem valuable. Sustainable systems are variously defined as those which increase quality of life (United States Congress in 1990[5]), increase economic well-being and social equity[6] and other socially desirable outcomes (White House, 2015[7]).
Quantitative measures of resilience such as our sustainability/resilience index (SRI) allow correlation of resilience with the variety of social indicators included in more standard definitions of sustainability. Such analyses show the relationship of resilience to socially desirable characteristics which are only indirectly reflected in the fundamental qualities of resilience. These social demographic indicators appear correlated with resilience from our preliminary data. SRI enables us to explore the relationship of resilience to measures of poverty, health, population, and other human social demographic variables.
Other social demographic variables such as education levels or population trends, though not included in most definitions of sustainability, also have interesting relationships to SRI.
Correlations of these various social demographic indicators with resilience are shown in the tables which follow. We present our initial data about the relationship between the SRI and indicators of health, poverty, education, and population. We also point out in each case areas where additional study is needed.
Health, poverty and resiience
Our tentative conclusion is that resilient systems (at least at the county level as measured by SRI) generally are accompanied by low poverty and high health outcomes.
Health and ecological resilience. We used two different measures of correlation and came out with basically the same results on each measure on two different health measure. A crucial health indicator for resilience is birth outcomes. Birth outcomes (see Methods) reflect the overall health and resilience of the mother in her community. The correlation of SRI and birth outcomes is extremely high for demographic data. More resilient counties are like to have good birth outcomes. Answering why is difficult. Examining some of the components of resilience may provide part of the answer. Only two of the individual indicator databases used to determine SRI scores were higher than the overall index correlation, as shown in the above box. Rotation grazing had the highest correlation with birth outcomes. An associated measure, percent of operations with animals was second highest. Counties with the most positive birth outcomes had a higher percent of operations with animals (a measure of diversity), especially those using the practice of ecological integration known as management intensive grazing. The third highest correlation was with a component of the locally self-organized quality—whether the principal operator lived on the farm.
The fact that the overall SRI was nearly as high as the highest components while many components have extremely low correlations appears to indicate that the index, by incorporating many unrelated components, is enabling measurement of a concept which reaches beyond any individual component.
|
Correlations with of SRI with Low Birth Outcomes Per 100 Live Births (2013 3-Year Estimates) |
||
|
Sustainability/Resilience Index and Components |
Spearman's Rank |
Kruskal's Gamma |
|
Percent Operations with Sales, Animals |
-.330** |
-.321** |
|
Percent of Operations Principal Operators Residence on Farm |
-.263** |
-.278** |
|
Percent of Farm Operations with Rotational or Management-Intensive Grazing Practices |
-.341** |
-.373** |
|
Sustainability/ Resilience Index |
-.314** |
-.313** |
|
Notes: *=Correlation is significant at the 0.05 level (2-tailed). **=Correlation is significant at the 0.01 Level (2-tailed). |
||
|
Correlation Coefficients Between Sustainability/Resilience and Health |
||
|
Low Birth Outcomes Per 100 Live Births (2013 3-Year Estimates) |
||
|
Sustainability/Resilience Index and Components |
Spearman's Rank |
Kruskal's Gamma |
|
Percent of Operations Principal Operators Residence on Farm |
-.263** |
-.278** |
|
Farmer Alternatives Scale |
-.117** |
-.102** |
|
Community Alternatives Index |
-.148** |
-.180** |
|
Percentage Change in the Value of Farm Machinery Between 2007 and 2012 |
.102** |
.111** |
|
Age Redundancy |
-.068* |
-.091** |
|
Percentage Change in the Number of Farms Between 2007 and 2012 |
-.099** |
-.099** |
|
Average Percent of Operations Producing Row Crops Across Seven Different Options |
.128** |
.139** |
|
Percent Operations with Area Harvested, Vegetables |
.213** |
.240** |
|
Percent Operations with Sales, Animals |
-.330** |
-.321** |
|
Production Diversity Index Across Row Crop, Vegetables, and Livestock |
.006 |
.020 |
|
Percent of Cropland Acres Not Treated with Herbicide |
-.025 |
-.035 |
|
Percent of Cropland Acres Not Treated with Insecticide |
-.216** |
-.227** |
|
Average of Z scores for No Herbicide and No Insectide |
-.141** |
-.153** |
|
Percent Operations USDA Certified Organic |
-.129** |
-.207** |
|
Percent of Farm Operations with Rotational or Management-Intensive Grazing Practices |
-.341** |
-.373** |
|
Percent of Operations with Internet Access |
-.210** |
-.216** |
|
Sustainability/ Resilience Index |
-.314** |
-.313** |
|
Notes: *=Correlation is significant at the 0.05 level (2-tailed). **=Correlation is significant at the 0.01 Level (2-tailed). |
||
The Birth outcomes measure is a direct measure of health of babies in a county. No such direct measure is available for overall health of residents, but a database does exist which details self-reported health at the county level. This measure of overall health was also highly correlated with SRI, though not as highly as the direct measure of birth outcomes. Counties where residents reported being in good health are more likely to have high SRI scores. The following table shows the negative correlation of poor health and SRI.
|
Correlations with Percent of Adults With Self-reported Poor or Fair Health (2012 5-Year Estimates) |
||
|
|
Spearman's Rank |
Kruskal's Gamma |
|
Farmer Alternatives Scale |
-.260** |
-.237** |
|
Community Alternatives Index |
-.300** |
-.328** |
|
Percent Operations USDA Certified Organic |
-.215** |
-.357** |
|
Percent of Operations with Internet Access |
-.397** |
-.423** |
|
Sustainability/Resilience Index |
-.241** |
-.251** |
None of the components of SRI which had higher correlations with birth outcomes also were in the highest categories of self-reported health. As shown in the above box, the components of SRI which correlated most highly were farmer internet access, a measure of the modular connectivity quality of resilience, two measures of local self-organization (community and farmer organized processing and marketing) and one measure of ecological integration (percent with certified organic operations).
Many studies do indicate the presence of farmers markets (community organized marketing) is correlated with more consumption of healthy foods[8]and a recent review of 343 studies published in the British Journal of Nutrition[9] found that organic foods are more healthful than conventional foods, mainly because the former contain higher concentrations of antioxidants, while the latter contain higher levels of the toxic metal cadmium.
The highest correlations with self-reported health, however, was the modular connectivity indicator, percent of farms with internet access. Since farm internet access likely means access for nonfarmers, perhaps access to information about health-related topics is higher in resilient counties. However, these explanations are merely hypotheses and must be tested further.
|
Correlation Coefficients Between Sustainability/Resilience and Health |
|
|
|
Percent of Adults With Poor or Fair Health (2012 5-Year Estimates) |
|
Sustainability/Resilience Index and Components |
Spearman's Rank |
|
Percent of Operations Principal Operators Residence on Farm |
-.050 |
|
Farmer Alternatives Scale |
-.260** |
|
Community Alternatives Index |
-.300** |
|
Percentage Change in the Value of Farm Machinery Between 2007 and 2012 |
.009 |
|
Age Redundancy |
.170** |
|
Percentage Change in the Number of Farms Between 2007 and 2012 |
-.072* |
|
Average Percent of Operations Producing Row Crops Across Seven Different Options |
.046 |
|
Percent Operations with Area Harvested, Vegetables |
-.059* |
|
Percent Operations with Sales, Animals |
.056 |
|
Production Diversity Index Across Row Crop, Vegetables, and Livestock |
.020 |
|
Percent of Cropland Acres Not Treated with Herbicide |
.094** |
|
Percent of Cropland Acres Not Treated with Insecticide |
.064* |
|
Average of Z scores for No Herbicide and No Insectide |
.077** |
|
Percent Operations USDA Certified Organic |
-.215** |
|
Percent of Farm Operations with Rotational or Management-Intensive Grazing Practices |
-.080** |
|
Percent of Operations with Internet Access |
-.397** |
|
Sustainability/Resilience Index |
-.241** |
Poverty and resilience. Many dedicated to eradicating poverty believe that lack of resources produce a lack of resilience. Some believe poverty is just a lack of money.[10] Others believe a lack of resilience produces a lack of resources.[11] Fighting poverty is one of those wicked issues where people are polarized. Some feel it is the poor person’s fault--that they need to pull themselves up by their bootstraps. Others feel we should have compassion and give the poor what they need.
As usual in any polarized situation, the solution is often to come up with a more basic organizing assumption which unites the polarized groups. Then we build on this new assumption.
Maybe something more basic is causing both a lack of resilience and poverty. Maybe the poverty warriors need to look at natural ecological systems.
We found that our Sustainability/Resilience Index (SRI) was highly correlated with lack of poverty in Southern counties. In addition, all components of SRI, except one (internet access) were much lower than the overall SRI correlation with both measures of poverty we examined, as shown in the box below.
|
Correlation Coefficients Between Sustainability/Resilience and Poverty
|
|||
|
Sustainability/Resilience Index and Components |
Income and Benefits (in 2012 Inflation-Adjusted Dollars), Median Household Income (Dollars) |
Families Whose Income in the Past 12 Months is Below the Poverty Level |
Gini Index Estimate |
|
Percent of Operations Principal Operators Residence on Farm |
.103** |
-.152** |
-.209** |
|
Farmer Alternatives Scale |
.215** |
-.199** |
-.051 |
|
Community Alternatives Index |
.200** |
-.183** |
.047 |
|
Percent of Farm Operations with Rotational or Management-Intensive Grazing Practices |
.163** |
-.239** |
-.146** |
|
Percent of Operations with Internet Access |
.375** |
-.289** |
-.098** |
|
Overall Resilience (SRI) |
.239** |
-.279** |
-.147** |
Overall SRI is highly correlated with median income and negatively correlated with families in poverty. Resilient agricultural systems are associated with low levels of poverty. The two components of resilience most highly correlated with income and low poverty are the locally self-organized (LSO) and modular connectivity components.
For income and poverty, the highest correlations with LSO are farmer-organized processing and marketing and community-organized processing and marketing. These findings are echoed in numerous international development studies which show that resilient food systems are all locally self-organized. By providing food aid from outside, we undermine local self-organization and so undermine resilience.[12] President Bill Clinton, after leaving office, realized that international aid efforts he had promoted “might have helped Arkansas farmers,” but exacerbated the problem of food insecurity in developing countries.[13] The Obama Administration has taken those lesson learned to heart. The Feed the Future initiative of USAID[14] supports purchase of local food instead of importing food. Whether this initiative increases food system resilience in developing countries will depend on whether the other qualities of resilient systems are also strengthened.
We need to let others organize themselves in ways that fit their ecosystems. Instead, we impose our values and our resources on them. Our values and our resources may work for our society, but other societies need to organize their own.
Our data also indicate that modular connectivity is highly related to poverty and income. The one measure available at a county level in the South is more highly correlated with income and more negatively correlated with poverty than any other component and even the overall SRI.
But by itself, local self-organization is not sufficient if to facilitate resilient systems. The eight qualities are all necessary for resilience, but local self-organization appears to be the linchpin.
We also examined the correlation of SRI with the Gini index--a measure of statistical dispersion intended to represent the income distribution of a nation's residents, and is the most commonly used measure of inequality. SRI and the Gini Index were negatively correlated, though not nearly as highly correlated as was lack of poverty and SRI. SRI is related to lack of inequality. In addition, only one component of SRI (managers living on their farms) was more highly correlated with inequality than the overall SRI. If farmers live on their land, Southern counties are less likely to have a huge spread in incomes. Teasing out the causes of the relationship awaits more in depth study.
|
Correlation Coefficients Between Sustainability/Resilience and Poverty |
|||
|
Income and Benefits (in 2012 Inflation-Adjusted Dollars), Median Household Income (Dollars) |
Families Whose Income in the Past 12 Months is Below the Poverty Level |
Gini Index Estimate |
|
|
Percent of Operations Principal Operators Residence on Farm |
.103** |
-.152** |
-.209** |
|
Farmer Alternatives Scale |
.215** |
-.199** |
-.051 |
|
Community Alternatives Index |
.200** |
-.183** |
.047 |
|
Percentage Change in the Value of Farm Machinery Between 2007 and 2012 |
-.017 |
.032 |
.020 |
|
Age Redundancy |
-.095** |
.049 |
-.043 |
|
Percentage Change in the Number of Farms Between 2007 and 2012 |
.106** |
-.106** |
-.052 |
|
Average Percent of Operations Producing Row Crops Across Seven Different Options |
-.097** |
.087** |
-.025 |
|
Percent Operations with Area Harvested, Vegetables |
-.047 |
.081** |
.066* |
|
Percent Operations with Sales, Animals |
.042 |
-.135** |
-.100** |
|
Production Diversity Index Across Row Crop, Vegetables, and Livestock |
-.042 |
-.009 |
-.056* |
|
Percent of Cropland Acres Not Treated with Herbicide |
-.033 |
-.021 |
-.004 |
|
Percent of Cropland Acres Not Treated with Insecticide |
.061* |
-.124** |
-.086** |
|
Average of Z scores for No Herbicide and No Insectide |
.010 |
-.076** |
-.048 |
|
Percent Operations USDA Certified Organic |
.141** |
-.115** |
-.042 |
|
Percent of Farm Operations with Rotational or Management-Intensive Grazing Practices |
.163** |
-.239** |
-.146** |
|
Percent of Operations with Internet Access |
.375** |
-.289** |
-.098** |
|
Overall Resilience (SRI) |
.239** |
-.279** |
-.147** |
|
Notes: *=Correlation is significant at the 0.05 level (2-tailed). **=Correlation is significant at the 0.01 Level (2-tailed). |
|||
Education and resilience
The locally self-organized quality (as indicated by community processing and marketing and farmer organized processing and marketing) and modular connectivity (internet access) are both correlated with education, but overall SRI not as highly correlated with education. Education does explain some components of overall resilience, but not nearly as much does it explain total resilience.
|
Correlations of SRI and components with education |
|
|
Educational Attainment, Bachelor’s Degree or Higher |
|
|
Farmer Alternatives Scale |
.215** |
|
Community Alternatives Index |
.394** |
|
Percent of Operations with Internet Access |
.363** |
|
Overall Resilience (SRI) |
.194** |
Population and resilience. As you’ve heard many times in this book, resilience is how much disturbance a system can take before it is destroyed. Measuring resilience is simple if you are willing to destroy the system--just increase a disturbance until the system is destroyed. But since we want to help systems transform to avoid destruction, we have to come up with a different measurement system.
Our research has discovered eight qualities which are necessary to resilient systems. Increasing these qualities leads to more resilience. Responsive redundancy is one of the qualities. In ecological terms, redundant systems are those which do a good job of reproducing themselves. Each of the species in the system is prolific. But in ecologically resilient systems, the redundancy is controlled. Population explosion is prevented by the controls of predators. Populations of those at the top of the food chain are hampered by the lack of food. Animals have fewer offspring when food is not available.
Human populations used to have similar controls. In the mountains of Southern Ethiopia the Konso people have created a permaculture system which has fed their people for untold generations. Their terraced fields build soil, conserve water, and stop erosion. They use agroforestry and intercropping with more species than virtually any American farmer. They traditionally controlled population by only permitting pregnancy to those who are members of a particular generation grade and limiting members of this group. Some of their methods aren’t comfortable to Westerners. Instead we use chemical and physical birth control. After contact with Westerners the Konso abandoned their traditions with the result of huge population increases and dependence on foreign food aid.[15]
We are so sure our values are right, that we have convinced the Konso and other peoples to abandon values which made their societies resilient. To promote resilience, we need to let others organize themselves in ways that fit their ecosystems. All too often, we impose our values and our resources on them. Our values and our resources may work for our society, but other societies need to organize their own.
Ecologically resilient systems can have a complex relationship with population. When technology change is stagnant, resilient societies must have a stable to very slightly increasing population with regular fluctuations depending on drought and other factors.
However, in agroecological systems where technology change is rapid, resilient systems can attract migration from other non-resilient areas. Excessive migration, however, puts pressure on availability of farmland leading to reduced resilience as we saw in Chapters Six and Seven.
In the counties of the Southern U.S., population trends have relationships to the components of resilience which are similar to those of education, though managers living on their farms is also correlated with population trends.
However, population trends are much more highly correlated with SRI and its components than education, or poverty. People appear to want to move to areas with highly sustainable/resilient agricultural systems.
|
Correlations of Population Trends with SRI and resilience components |
||
|
Total Migration Rate |
2010 Population |
|
|
Percent of Operations Principal Operators Residence on Farm |
.358** |
.271** |
|
Farmer Alternatives Scale |
.253** |
.286** |
|
Community Alternatives Index |
.282** |
.541** |
|
Percent of Operations with Internet Access |
.248** |
.247** |
|
Overall Resilience (SRI) |
.356** |
.284** |
Migration to counties correlated highly with high SRI, all the indicators of LSO and modular connectivity. Though total population was correlated the same components of resilience, it was not nearly so highly correlated with SRI. One extremely high correlation (with community organized processing and marketing) may be explained by the increased ability of areas with higher population to support farmers markets and other community organized processing and marketing. However, this high correlation did not bleed over into the overall resilience measure.
Understanding these relationships will require further study.
|
Correlations of Education and Population Trends with SRI and resilience components |
|||
|
Educational Attainment, Bachelor’s Degree or Higher |
Total Migration Rate |
2010 Population |
|
|
Percent of Operations Principal Operators Residence on Farm |
.062* |
.358** |
.271** |
|
Farmer Alternatives Scale |
.215** |
.253** |
.286** |
|
Community Alternatives Index |
.394** |
.282** |
.541** |
|
Percentage Change in the Value of Farm Machinery Between 2007 and 2012 |
-.086** |
-.180** |
-.100** |
|
Age Redundancy |
-.162** |
-.041 |
.001 |
|
Percentage Change in the Number of Farms Between 2007 and 2012 |
.044 |
.041 |
.004 |
|
Average Percent of Operations Producing Row Crops Across Seven Different Options |
-.142** |
-.065* |
-.136** |
|
Percent Operations with Area Harvested, Vegetables |
.036 |
.158** |
.220** |
|
Percent Operations with Sales, Animals |
-.015 |
.129** |
-.004 |
|
Production Diversity Index Across Row Crop, Vegetables, and Livestock |
-.056* |
.125** |
.035 |
|
Percent of Cropland Acres Not Treated with Herbicide |
-.018 |
.023 |
-.034 |
|
Percent of Cropland Acres Not Treated with Insecticide |
.026 |
.011 |
-.099** |
|
Average of Z scores for No Herbicide and No Insecticide |
.007 |
.027 |
-.070* |
|
Percent Operations USDA Certified Organic |
.148** |
.180** |
.193** |
|
Percent of Farm Operations with Rotational or Management-Intensive Grazing Practices |
.077** |
.275** |
.060* |
|
Percent of Operations with Internet Access |
.363** |
.248** |
.247** |
|
Overall Resilience (SRI) |
.194** |
.356** |
.284** |
|
Notes: *=Correlation is significant at the 0.05 level (2-tailed). **=Correlation is significant at the 0.01 Level (2-tailed). |
|||
[1] Paulson, J., 2010. Sustainability is a wicked problem, Dairy Star, July 16, 2010.
[2] Rittel, H. W., & Webber, M. M. 1973. Dilemmas in a general theory of planning. Policy Sciences, 4(2): 155–169.
[3] World Bank, 2014. http://www.worldbank.org/en/news/feature/2014/09/30/a-wicked-problem-controlling-global-climate-change; Lazarus, R.J., Super wicked problems and climate change: restraining the present to liberate the future. Cornell Law Review, 94:1153-1234. http://www.lawschool.cornell.edu/research/cornell-law-review/upload/Lazarus.pdf; Levin, K., Cashore, B., Bernstein, S., and G. Auld, 2012. Overcoming the tragedy of super wicken problems: constraining our future selves to ameliorate global climate change. Policy Sciences, 45:123-152. http://link.springer.com/article/10.1007%2Fs11077-012-9151-0.
[4] Holling, C.S. and G. K. Meffe, 1996. Command and Control and the Pathology of Natural Resource Management. Conservation Biology 10:328–33.
[5] 1990 Farm Bill [Food, Agriculture, Conservation, and Trade Act of 1990 (FACTA), Public Law 101-624, Title XVI, Subtitle A, Section 1603 (Government Printing Office, Washington, DC, 1990).
[6] Toman, M., Lile, R. and D. King, 1998. Assessing Sustainability: Some Conceptual and Empirical Challenges. Washington, D.C.: Resources for the Future. http://www.rff.org/files/sharepoint/WorkImages/Download/RFF-DP-98-42.pdf.
[7] https://www.whitehouse.gov/the-press-office/2015/03/19/executive-order-planning-federal-sustainability-next-decade.
[8] Traub, A., 2011. http://ocw.jhsph.edu/courses/capstone2011/PDFs/Traub_Arielle_2011.pdf; Obadia, J. and J. Porter, http://bostonfarmersmarkets.org/media/pdf/F/a/r/FarmersMarkect-Impact-on-FV_Website.pdf; Evans AE, Jennings R, Smiley AW, et al. Introduction of farm stands in low-income communities increases fruit and vegetable among community residents. Health & Place. 2012;18(5):1137-43; Racine EF, Smith Vaughn A, Laditka SB. Farmers' market use among African-American women participating in the special supplemental nutrition program for women, infants, and children. Journal of the American Dietetic Association. 2010;110(3):441-6; Ruelas V, Iverson E, Kiekel P, Peters A. The role of farmers' markets in two low income, urban communities. Journal of Community Health. 2012;37(3):554-62.
[9] Baranski, M. et al., 2014. Higher antioxidant and lower cadmium concentrations and lower incidence of pesticide residues in organically grown crops: a systematic literature review and meta-analyses. Br J Nutr. 2014, 112:794-811. doi: 10.1017/S0007114514001366.
[10] http://www.sociology.org/what-causes-poverty/
[11] Hobfall, S.F., 1989. Conservation of Resources: A New Attempt at Conceptualizing Stress. American Psychologist, 44:513-524. http://www.personal.kent.edu/~shobfoll/Files/pdfs/AP1989CORnewattempt.pdf.
[12] http://www.fao.org/publications/sofa/2006/en/
[13] Fuller, A., 2015, Haiti on its Own Terms. National Geographic, December 2015, p. 112.
[14] http://www.feedthefuture.gov/
[15] Forch, W. 2003. Case Study: The Agricultural System of the Konso in Southwestern Ethiopia. https://www.uni-siegen.de/zew/publikationen/volume0103/1-wiebke-konso-pubs.pdf.