Final report for LS16-276
Project Information
Ecological resilience has the potential to improve the ability of sustainability research to help systems survive and thrive in the face of disturbances such as climate change. Ecological resilience research focuses on the internal qualities of complex adaptive systems which enable continuing adaptation and innovation. Prominent among the qualities enabling such resilience is local self-organization. Locally self-organized processing and marketing has long been recognized as a crucial component of sustainable agricultural systems. This study determined the common qualities of such resilient locally organized food systems and compared them with those proposed by the most prominent resilience frameworks in the literature. Our case studies of resilient food systems in recalcitrant areas of the U.S. South have affirmed that eight common qualities are consistent with the most prominent frameworks. Information from the case studies and focus groups resulting in the eight qualities laid a foundation for establishment of quantitative indicators and thus refine a Sustainability/Resilience Index. Such a quantitative index enables investigation of the relationships between agricultural system resilience and economic and social demographic indicators. Thus the index provides a first attempt to elucidate how a system's internal qualities determine social, ecological and economic outcomes.
The second aspect of the project involved operationalization and measurement of indicators focused on the sustainability and resilience of local agrifood systems in the southern United States with the purpose of constructing data-driven tools for theory building and informing development programs and policy. The Local Agrifood Systems Sustainability/Resilience Index (SRI) was constructed through insights from literature and prior case studies. Building from that work emphasizing the locally modifiable qualities of resilience, this study contributes by analyzing publicly available data sources at the county level. Piloted with data from the southern region, findings suggest state and regional differences that may be informative for development and tracking change in the future, as new waves of data become available.
The third aspect of the project explored the relationship between the index and quality of life (health and poverty). Although some approaches to resilience incorporate resources from multiple levels of analysis and diverse social goals, others work to construct domain specific measures focused on the local level to provide opportunities to explore the relationships between resilience and issues such as inequality, poverty, health, and efforts to improve wellbeing. This approach is important for community practice, programmatic interventions, and policy options. Informed by livelihoods and community capitals and a broad collection of resilience writings, we explored associations between local agrifood system indicators and other markers of food systems, broader socioeconomic development, and health at the county level in the Southern US. Of interest are the patterns of association between socioeconomic status, social capital, agrifood system resilience, traditional food desert measures, and population health outcomes, namely self-rated health and premature age-adjusted mortality. Findings will help scholars, practitioners, and policy analysts to have a more nuanced understanding of the ways in which development of local agrifood systems intersect with broader development goals. This study also contributes to conversations around integration of ecological and community resilience, sustainability, and social development.
Finally, this study validates the above findings with ten additional case studies in high poverty and low health region. This work integrates poverty, health and resilience to point a route toward interventions which can decrease poverty and increase health while creating resilient systems.
Objective 1. Explore the qualities conditioning ecological resilience in highly productive Southern agricultural systems (Delta, High Plains) through semi-structured interviews, focus groups and case studies in adjoining counties with opposite resilience scores.
Objective 2. Elaborate and refine a resilience index based on county level secondary databases.
Objective 3. Determine the relationship between the resilience index and poverty, health and population indicators in regions which rank high on the resilience index and low on quality of life indicators.
Cooperators
- - Technical Advisor (Researcher)
- (Researcher)
Research
Overall approach
We used both qualitative and quantitative research methods to achieve our objectives. In complex adaptive systems, which include all living systems) few variables can be tightly controlled because nearly all systems and subsystems adapt to some degree independently, making response to stimuli unpredictable. Non-experimental quantitative methods allow the researcher to track the effects of complex adaptive systems on variables of interest. However, to determine which variables reflect the most important factors, qualitative research is necessary. Therefore, we use a mixed-methods research approach. This will entail qualitative research methods (comparative multiple case study methods and construct group methods) to questions for quantitative survey methods, secondary database indicators. Standard statistical analyses were employed on quantitative data.
Objective 1.) Explore the qualities conditioning ecological resilience in highly productive Southern agricultural systems (Delta, High Plains) through semi-structured interviews, focus groups and case studies in adjoining counties with opposite resilience scores.
Activity 1.1. Interviews, focus groups and case studies on ecological resilience in Delta and High Plains, Oct-2016 to May 2017, resulting in complete case studies
Output: Interviews with 40 farmers from both the Delta and High Plains from adjacent counties with opposite SRI scores.
Semi-structured interviews using established protocol and methods similar to those used in SSARE project LS13-259 were used to produce case studies in counties with high and low resilience index scores in highly productive agroecoregions
We used standard case recruitment and selection methods (Lauckner et al., 2012) to choose the subjects for our case studies. The primary selection criteria are that the farm enterprise must integrate production, processing and marketing, and must be whole-heartedly willing to participate in all aspects of the study.
Output: Focus groups of farmers who participated in interviews and community leaders. At least two were held in each region.
Output: Case studies of counties with opposing scores on the draft SRI. At least four case studies will be developed in each region.
Case study is now recognized as an important research approach for agricultural systems (Abatekassa and Peterson, 2011; Bitsch, 2005) and in the social sciences (Yin, 2014). Today, numerous agricultural journals publish several case studies every year. The cases developed here were used to generate and inform hypotheses for our quantitative research process and to explore issues not readily accessible through quantitative methods.
Case studies were of farms in counties with high SRI scores and adjacent counties with low SRI scores. All were resilient farms, but those in low SRI counties should clue us in to the unique challenges they have faced. Comparing to counties next door with no such constraints
Research Methods
We used standard case recruitment and selection methods (Lauckner, Paterson, & Krupa, 2012) to choose the subjects for our case studies. The primary selection criteria were that the system must be attempting to integrate ecologically sound production, processing, and marketing; must have lasted for a minimum of five years; must have originated and be located in an area where few such systems have developed; and key managers involved in the system had to demonstrate willingness to participate in all aspects of the study. A multiple case study design was chosen in order to study our topic from several perspectives and contexts (Yin, 2014). We examined systems where agricultural system managers worked independently in different contexts and communities, providing the opportunity to identify common and distinct processes. Such resilient systems proved difficult to find, but through our extensive contacts in the region, especially Southern Sustainable Agriculture Working Group, we found three systems in each state, nine in total, that fulfilled our criteria.
The case study protocol outlined the key information to be gathered from each case and primary sources (Yin, 2014). Initial issues for exploration were extrapolated from project leader experience, previous ecological resilience research, and related literature. These initial issues were points of departure to guide interview questions and preliminary analysis. The initial researcher-identified issues were influenced by issues raised by study participants. Particular issues were developed and explored in each case to guide data collection and analysis for the individual case descriptions. The emerging issues from each case were then examined to identify shared issues, which then directed the cross-case analysis. Regularly revisiting and refining these issues during data collection and preliminary analysis provided an emergent theoretical structure from the data collection processes.
As is consistent with case study design, data collection methods in this study included in-depth semi-structured interviews, document review, direct observation, and participant observation. At least four interviews of key system managers were conducted for each case study. Sixty-seven interviews in total were conducted for the case studies. Each interview was written up as a vignette for later analysis. The vignettes and related information were then integrated to create each of the case studies. Information was gathered from the inception of the initiative to the time of data collection, to capture process changes.
Data analysis occurred in three stages. Stage 1 involved the independent, in-depth analysis of each case. The major determinants of resilience in each case were identified through consensus by the three interviewers who participated in each case study interview. Stage 2 involved a cross-case analysis of the nine cases. In Stage 2, each case's main processes were compared to explore how different contexts and processes varied across the cases. The key qualities that were identified for each case as described previously were re-examined to distill common qualities that were addressed differently across the nine cases. Finally, case-specific qualities were identified that were present in all cases. In Stage 3, conclusions from the case studies were compared to each of the six prominent resilience frameworks discussed above.
Objective 2) Elaborate and refine a resilience index based on county level secondary databases.
Operationalizing the concepts
Beyond representing qualities of the system that local people can influence through their actions, in choosing local sustainability/resilience indicators, the research team also directed attention towards those dimensions that could be measured at the county-level. This is important for conceptual development and clarity, because any effort to operationalize resilience including broader/higher scale resources, such as programs operated through government agencies and non-governmental organizations, runs the risk of measuring resilience at that larger scale. Although important for broader regional development, these approaches result in measures that can only address the resilience at the higher unit of analysis. Instead, this project sought to identify and measure those qualities that could be self-organized through local initiative in local spaces.
Though bonding, bridging and linking social capital are subsumed as part of the connectivity quality of resilient systems (reference withheld for review), intentional effort was made not to include more general measures of social capital (Rupasingha, Goetz, & Freshwater, 2006), social resilience, socioeconomic position, or health and wellbeing, such as the Social Science Research Council’s (n.d.) Measure of America operationalization of the Human Development Index for application to the US and the University of Wisconsin/Robert Wood Johnsons Foundation’s County Health Rankings (Remington, Catlin, & Gennuso, 2015). This was not because they are unimportant for understanding resilience, but rather because of the need for conceptual distinction. Scholars, practitioners, and policymakers should be interested in whether there are relations between local agrifood system sustainability/resilience and other socioeconomic, health, and wellbeing indicators. Mixing social, health, and wellbeing measures within this index would prevent exploration of the associations between them and local agrifood system sustainability/resilience in the future.
Indicators were chosen from publicly accessible databases to reflect the qualities of sustainability and resilience identified through the previously mentioned nine case studies of local agrifood systems in the southern US. Although researchers were not able to identify county-level comparable data for all dimensions of sustainable/resilient local agrifood systems, they constructed indicators for five of the dimensions that could be combined to a composite Local Agrifood System Sustainability/Resilience Index (SRI). They did this drawing primarily from the 2012 and 2007 National Census of Agriculture, with additional data from the USDA’s 2013 Food Atlas, 2013 Farm to School Census, and state-level regulatory records assembled by the research team during 2014 (Table 1). (Future iterations of the SRI will make use of updated data as appropriate.) In choosing variables, they privileged data available for most counties in each of the states. Each indicator is discussed below.
Table 1. Local Agrifood System Sustainability/Resilience Index (SRI) indicators and data sources.
|
Dimension |
Indicators |
|
Connectivity |
Farms with internet % farm operations with Internet access (Source: 2012 Census of Agriculture) |
|
Local self-organization |
Farmer lives on farm % principal operators living on farm Farms with local food alternatives scale (alpha = .739) % operations with on-farm packing % operations with direct marketing to retail % operations with community supported agriculture Community local food alternatives index Cumulative score on having meat processing facilities, farmers markets, and farm to school programs (Sources: 2012 Census of Agriculture; 2013 Food Environment Atlas; 2013 Farm to School Census; 2014 online research of state regulations and listings) |
|
Maintenance |
Average age of farm operator Each county as a % of the highest average age in the region (68.7) Reverse coded for lower average ages to have higher scores on final indicator Stability-change % change in number of farm operations between 2007 and 2012 (Sources: 2007 and 2012 Census of Agriculture) |
|
Ecological integrity |
Low chemical input scale (alpha = .759) % agricultural land not treated with herbicides % agricultural land not treated with insecticides (Note: Acres of “crop land” in the denominator. Numerator for insecticides excludes treatment for nematodes.) Organic farms % operations certified organic Management intensive livestock % operations practicing management intensive/rotational grazing (Source: 2012 Census of Agriculture) |
|
Diversity |
Production diversity index Row crop diversity Average % of operations producing across seven different row crop options (Note: Does not indicate these crops were grown on the same farms.) Vegetable production % operations with vegetables harvested Livestock production % operations with livestock sales (Source: 2012 Census of Agriculture) |
|
Local Agrifood System Sustainability/Resilience Index |
All indicators listed above were standardized and then coded into a summative index. |
Locally self-organized
Data on three variables were used to calculate scores for the concept of a system’s level of being locally self-organized. Local farm management was measured by one variable: percent of principal operators living on their farm. This is assumed to reflect degree of locally self-organized management in contrast to absentee ownership. The indicator to measure prevalence of farm operations with local food alternatives was composed of three variables (alpha = .739): percent of operations with on-farm packing, percent of operations with direct marketing to retail, and percent of operations with community supported agriculture. Locally organized community food alternatives consisted of a cumulative score of individual binary variables representing whether farmers markets, and farm to school programs were present in the county and whether meat processing facilities were present in adjoining counties.
Responsive redundancy
This quality was measured with two indicators. The first variable was average age of farm operator. First, each county was given a score of the percent of the highest average farm operator age in the region (68.7). These scores were then reverse coded for lower average ages to result in higher scores on the final indicator based on the assumption that younger farmers provide the potential for greater redundancy of farm operators over time. The second variable was the percent decrease or increase in the number of farm operations between 2007 and 2012. Scores were reverse coded such that counties with lower percent decreases (and increases) had higher scores.
Complementary diversity
No county level data were available to reflect the complementarity of diversity, so scores for this quality reflect only production diversity. Diversity at the county level was derived from three indicators: row crop diversity (average percent of operations producing across seven different row crop options), vegetable production (percent of operations with vegetables harvested), and livestock production (percent of operations with livestock sales).
Ecological integration
Researchers used data from four variables to calculate ecological integration scores. The low chemical input index (alpha = .759) was created from two variables: percent of agricultural land not treated with herbicides, and percent of agricultural land not treated with insecticides. Acres of crop land were used as the denominator in these calculations. The numerator for insecticides excludes treatment for nematodes. The two other variables included for the ecological integration quality were organic practices (percent of operations certified organic) and the ecologically integrated practice of management intensive/rotational grazing (percent of operations practicing management intensive/rotational grazing).
Modular connectivity
Only one indicator was available in county level databases that addressed connectivity. This was the percent of operations with internet access.
During the conduct of this study, we did not obtain access to useful indicators at the county level of the other three of the eight qualities of resilience: accumulation of reserves and infrastructure, conservative innovation and transformation.
Analysis and computation of the Local Agrifood System Sustainability/Resilience Index (SRI)
Counties/county equivalents were the units of analysis, focusing in this project on the 13 state Southern Region as designated by the USDA: Alabama, Arkansas, Florida, Georgia, Kentucky, Louisiana, Mississippi, North Carolina, Oklahoma, South Carolina, Tennessee, Texas, and Virginia. Starting with a total of 1,344 counties, 43 were treated as missing due to insufficient data on some key variables, especially number of farm operations in either 2007 or 2012. All other missing values in the index were counted as 0 on the basis that the practices under consideration were not prevalent enough to avoid data suppression. Final analysis was based on 1301 cases (counties).
All percentages were transformed to z-scores for the purpose of normalization. Summated multi-variable scales (farms with local food alternatives and low chemical input) and indices (community food alternatives and production diversity) were calculated by summing z-scores across component variables. Z-scores were then ranked (higher scores have higher ranks) by county across the entire region and categorized by quartile groupings. Because of low organic certification rates, this variable was only ranked in two categories.
The research team also created a composite “Local Agrifood System Sustainability/Resilience Index” (SRI), summing and standardizing the standardized scores across all of the separate indicators. Since the indicators were standardized and ranks were calculated across the region (rather than within each state separately), findings show the position of each county within the entire southern region. (Future analysis will feature both state and regional rankings for each county.)
Objective 3. Determine the relationship between the resilience index and poverty, health and population indicators in regions which rank high on the resilience index and low on quality of life indicators.
Methods
To address the research question and hypotheses, we combined several different sources of data to represent counties and county equivalents across 13 states in the southern region of the United States. While the county-level of analysis is not a perfect proxy for community, it is meaningful as a local political and policy unit, it has relatively stable boundaries across time, and it is the level at which many data are available for this kind of ecological analysis. Because of the importance of demonstrating the potential lagged effects of development on health outcomes, independent variables were, to the extent possible, chosen from years non-overlapping with the dependent health outcomes. In general, this meant we drew independent variables from 2009, 2010, 2012, and 2013 (depending on the conceptual indicator and available data sources), and the dependent variables were 2015 estimates. As described below, there were some multi-year estimates.
We sourced the dependent health outcome variables from the County Health Rankings program, a collaborative effort between the Robert Wood Johnson Foundation and the University of Wisconsin Population Health Institute. We used data from the 2017 report, but these were originally drawn from other sources representing earlier years. We used the 2015 estimates of the percent of adults reporting poor or fair health, originally collected through the Centers for Disease Control and Prevention’s (CDC) Behavioral Risk Factor Surveillance Survey (BRFSS). An additional indicator of population health was premature age-adjusted mortality, originally collected by the County Health Rankings program from the CDC’s WONDER mortality data for 2013-2015.
Several indicators of socioeconomic status were obtained from the 2012 five-year estimates from the American Community Survey (ACS). Conducted by the US Census Bureau, the ACS is an ongoing annual survey of more than 3 million households with data aggregated at various geographic levels, including the county level. Five-year estimates are developed by the Bureau to provide figures with lower margins of error than the one-year estimates. For this analysis, 2012 estimates include data aggregated from 2008 through 2012. Specific variables included percent of adults 25 years and older with a high school degree or higher, median household income, GINI coefficient of income inequality, and percent of families living below the poverty line. To develop an index similar in formulation to those used for social capital and local agrifood system sustainability/resilience (see below), variables were reverse coded (when necessary) to measure positive outcomes, standardized, and combined to form a weighted index using principal components analysis. Higher scores on the index represent higher socioeconomic position.
The Rupasingha, Goetz, and Freshwater (2006) social capital index was used to measure social capital. This index consolidates data from multiple sources, including the Census Bureau, County Business Patterns, USA Counties, National Center for Charitable Statistics, and the Regional Economic Information System (Rupasingha, Goetz, & Freshwater, 2006). Component measures include number of associations per capita, voter turnout, response rates to the Decennial Census, and nonprofits per capita. The index authors used principal components analysis to calculate weights. The result is a county-level index measuring social capital that has been updated several times from 2006 through 2014, and research has demonstrated its validity (Lee & Kim, 2013). For this study, 2009 data were used, including both the complete index and its individual components. The latter was done to identify whether particular elements of social capital were more or less strongly associated with the variables of interest.
Local agrifood system sustainability/resilience was measured through a previously constructed index (Green et al., 2017). The index was rooted in case studies and community engagement processes and then, utilized data from the 2012 and 2007 National Census of Agriculture, with additional data from the US Department of Agriculture (USDA) 2013 Food Atlas, 2013 Farm to School Census, and state-level regulatory records assembled by the research team in 2014. The data represent five characteristics of local agrifood systems – connectivity, local self-organization, maintenance, ecological integrity, and (agricultural) diversity. These five characteristics were chosen for three reasons. These characteristics appeared necessary for resilience in nine case studies of resilient food systems, are consistent with the ecological resilience literature, and are reflected in available county level databases. Based on standardized scores for each indicator, a cumulative index was also created (with weighting again based on principal components analysis). See Appendix Table 1 for the specific variables and data sources used to construct the index.
There are other measures of local food system characteristics important to food security, especially access to food purchasing opportunities through grocery stores and supercenters. Using data from the 2012 USDA Food Atlas, the measures for this analysis included the number of grocery stores per 1,000 population and the number of supercenters per 1,000 population.
Given our focus on health outcomes, we wanted to account for issues of access to healthcare in the models. Data on the percent of adults age 18 to 64 with insurance were obtained from the ACS 2012 five-year estimates. Additional health system data were obtained from the County Health Rankings for the number of primary care physicians per 100,000 population (the 2015 rankings data were used to obtain the data from the year 2012).
To classify counties in terms of their metropolitan status, a reduced form of the USDA Economic Research Service’s Rural-Urban County Continuum Codes was utilized, categorizing counties as being either metropolitan or non-metropolitan. An alternative measure used was the percent of the population living in an urban area. In both cases, the data were originally derived from the 2010 Decennial Census.
Analysis consisted of descriptive statistics, mapping of the dependent variables, correlations and partial correlations, and linear ordinary least squares regression using the Statistical Package for the Social Sciences (SPSS). Regression models were run twice for each of the two dependent variables (poor or fair health and premature mortality), once using each of the indicators of metropolitan status. We followed this by running the models separately for the non-metropolitan counties and the metropolitan counties. Given expectation of some level of correlation between the independent variables as they are different measures of development, we did have concerns about multi-collinearity. We ran diagnostic tests (VIF and tolerance scores), and all results were within acceptable parameters. Because many of the variables were based on survey data with various county-level margins of error, we used bootstrapping methods (based on 1,000 subsamples) to generate 95% confidence intervals.
Results and discussion for Objective 1: Explore the qualities conditioning ecological resilience in highly productive Southern agricultural systems (Delta, High Plains) through semi-structured interviews, focus groups and case studies in adjoining counties with opposite resilience scores.
Background for Objective 1
For nearly three decades, sustainability has been the goal of people focused on the world’s “wicked” problems, including environmental degradation, overpopulation, endangered species, poverty, food insecurity, and climate change (World Bank, 2014). Wicked problems are characterized by interconnected issues and polarized stakeholders with conflicting values, which precludes easy agreement on criteria to determine when a solution is found (Rittel & Webber, 1973). Achieving consensus around policy incentives to create social change and substitute technologies was assumed by those working in sustainability to eventually lead to a lasting equilibrium between our planet and our social systems (e.g., Forrester, 1971; Curry, 2013). Despite valiant efforts to find sustainable solutions, the world is increasingly out of balance: the wicked problems are becoming more intractable. A revised perspective on sustainability appears needed.
Achieving sustainable agricultural systems has long been a goal internationally (World Commission on Environment and Development, 1987) and in the US. (USDA farm bill, 1990). However, definitions of sustainable agriculture and sustainability assessment tools focus on whether systems meet a range of other criteria. rather than viewing sustainability as a naturally occurring phenomenon—in contrast to ecological resilience, which is defined as the ability of a system to withstand and overcome disturbance without being destroyed (Holling, 1973). Sustainability assessment tools have been developed for various scales of the food system, including farm, community, eco-region, and nation (Van Passel & Meul, 2012). These tools range from indicator sets (Grenz, 2011) to simulation models (e.g. Cerf, Jeuffroy, Prost, & Meynard, 2012; Van Meensel, Lauwers, Kempen, Dessein, & Van Huylenbroeck, 2012). All definitions of sustainability seek to move agriculture and food systems toward achieving social, economic, and environmental goals that are agreed on and valued by and defined by particular segments of society. Sustainability as a social movement (Wezel et al., 2009) must maintain focus on these valued societal goals. When focused on such goals, however, defining sustainability itself becomes a wicked problem (Paulson, 2010).
Including societal goals in the definition of sustainability has led to co-optation and antipathy from those who do not share those values. Co-optation of sustainability has been seen with Nestlé, Unilever, Danone’s Sustainable Agriculture Initiative Platform (SAIP, 2016), and Monsanto’s Global Harvest Initiative (Crossfield, 2009). Holt-Giménez and Altieri (2016) have delineated the deep roots of such co-optation. Direct antipathy is shown by the introduction in twenty-six U.S. state legislatures of legislation opposing sustainable development as proposed in the United Nations Agenda 21 (Frick, Weinzimmer, & Waddell, 2014). Along with co-optation and antipathy, a recent study indicates “flat-lined public interest in sustainability” since 2004 (Andrew et al., 2016, p. 138). Focusing on understanding the qualities that help systems become resilient appears to be a means of removing sustainability from this wicked situation by defusing political tensions and clarifying the dynamic, systematic nature of human-environment relationships.
Though defining sustainability is fraught with problems, having a legal definition (USDA farm bill, 1990) enabled a systematic attempt, known as the State of the South, in the early 1990s to prioritize sustainable agriculture research and education interventions, which was commissioned by the USDA-supported Southern Sustainable Agriculture Research and Education. Through agroecoregion focus groups, a regional survey, and secondary database analysis, the study concluded that locally owned and organized processing and marketing systems were crucial to develop sustainable agricultural systems (Worstell, 1995). (The study included the first documented “local food systems” workshop, in Williamsburg, Virginia.)
Since the study, encouraging processing and marketing cooperatives, farmers’ markets, and community-supported agriculture (CSA) has become extremely popular in much of the United States. Several state and federal programs have been implemented to facilitate this effort, including the Value-Added Producer Grant program, the Farmers Market Promotion Program, the Local Foods Promotion Program, the Kentucky Agricultural Development Board, Know Your Farmer, Know Your Food, Food Compass, and many other national, regional, and local programs (Low et al., 2015). The USDA has progressed from dismissing as trivial the likely impact of local foods (USDA, 2001) to trumpeting loudly the importance of local foods (Martinez et al., 2010). The trend toward local food systems is broad and deep. When a conservative Arkansas Congressman says, “The future of food is local” (R. Crawford, personal communication, 2013), Walmart pledges to increase local food to 15 percent of its sales by the end of 2015 (Wenninger, 2013), and it is claimed that every church seems to want its own farmers’ market (e.g., C. Sheffield, personal communication, May, 2013), the trend seems ineluctable.
Merely being local, however, does not meet traditional definitions of sustainability (Vermeulen, Campbell, & Ingram, 2012; Weber & Matthews, 2008). The State of the South project (Worstell, 1995) concluded that a very specific type of local food system is needed for sustainability, one which is locally organized and locally owned. In the language of ecological resilience, this quality is referred to as self-organization (Holling, 1973). Although all ecologically resilient systems self-organize with the components available locally, we have chosen the term local self-organization (LSO) to underscore the well-established importance for sustainability of processing and marketing organized and owned by locally self-organized groups.
The polarization typical of wicked problems can be eliminated when opposing groups build on more basic principles on which they do agree. An ecological resilience approach to sustainability focusing on qualities which enable a system to withstand, adapt, and transform itself in the face of disturbance may be able to reduce polarization while indirectly achieving the goals of the movement. Thus, viewing sustainability from the perspective of ecological resilience may help provide a route out of this wicked problem.
Emergence of Ecological Resilience Perspective on Sustainability
The concept of ecological resilience emerged from failure to develop stable, sustainable yields in many managed ecosystems, coupled with observations of adaptive cycles that maintain natural ecosystem relationships and functions (Holling, 1973). Resilience first arose as a scientific concept in materials engineering: the “ability of a material to absorb energy when deformed elastically and to return to [the original state] when unloaded” (Total Materia, 2001). Similarly, as developed by Holling, ecological resilience has a specific biological reality: how much disturbance a system can withstand. Resilient systems last; non-resilient systems do not. This definition is widely used, especially in climate change studies (e.g., U.S. CCSP, 2008).
The ecological resilience perspective also differs from many sustainability perspectives in distinguishing resilience from stability. In his seminal resilience paper, Holling (1973) noted that stability is the ability of a system to return to equilibrium after a temporary disturbance. Also called engineering resilience (Holling, 1996), this is the ability of a system to bounce back to its original form, as in materials science. However, societies throughout human history have sought to sustain unsustainable systems (Lowdermilk, 1948). Many societies have striven to eliminate the vagaries of nature and create what today we might call a well-engineered mall (Raskin, 2014). Many “fear that we may be clever enough to create a world that is grievously biologically impoverished, but nevertheless sustainable” (May, 2002, p. 141). Such conceits do not reflect the ecological resilience perspective on sustainability, which emphasizes not so much stability as the ability of the system to absorb change and still persist (Holling, 1996). Resilient systems can fluctuate wildly and change abruptly, to reshape, reform, and adapt themselves.
Explaining and predicting ecological resilience requires understanding the complex adaptive systems people interact with over time. A multitude of frameworks have been developed for these social-ecological systems. However, the complexity of interactions within each social-ecological system (SES) make each SES unique and render impossible accounting for every factor that conditions resilience now and in the future. Any framework will focus on a few of these factors, as none can encompass all factors (Binder, Hinkel, Bots, & Pahl-Wostl, 2013).
Seeing the impossibility of predicting interaction within and between innumerable complex adaptive systems, many researchers have focused on defining the basic qualities that appear in all resilient systems. There are both similarities, especially in terminology, and differences between them (listed in Table 1; these are addressed later in relation to the framework proposed in this paper). One of the earliest attempts formulated a set of nine necessary qualities for a resilient world (Walker & Salt, 2006): diversity, ecological variability, modularity, acknowledgment of slow variables, tight feedbacks, social capital, innovation, overlap in governance, and ecosystem services. Carpenter et al. (2012) clarified the distinction between specific resilience, involving particular disturbances, and general resilience that confers the ability to cope with any disturbance. They posited nine qualities that enable general resilience: diversity, modularity, openness, reserves, feedbacks, nestedness, monitoring, leadership, and trust.
Frankenberger, Mueller, Spangler, and October (2013) built on previous resilience frameworks to include community interactions, in their influential discussion of resilience in the context of international community development. This framework posits seven central “community social dimensions”: preparedness, responsiveness/flexibility, learning and innovation, self-organization, diversity, inclusion, and aspirations. The Rockefeller Foundation (2014) expanded resilient systems work to cities. Their City Resilience Framework posits seven qualities of resilient systems: reflective, robust, redundant, flexible, resourceful, inclusive, and integrated. Integrating much of the previous work on resilience frameworks, the most well-known center for study of ecological resilience, the Stockholm Resilience Center (2015), developed a set of “seven principles that are considered crucial for building resilience in social-ecological systems”: maintain diversity and redundancy, manage connectivity, manage slow variables and feedbacks, foster complex adaptive systems, encourage learning, broaden participation, and promote polycentric governance.
Specific to agroecosystems is the framework developed by Cabell and Oelofse (2012), who describe thirteen categories of indicators shown to be associated with resilience: social self-organization, ecological self-regulation, appropriate connectedness, functional and responsive diversity, optimal redundancy, reflective and shared learning, spatial and temporal heterogeneity, exposure to disturbance, coupling with local natural capital, global autonomy and local interdependence, honoring of legacy, building human capital, and being reasonably profitable.
In contrast to these ecological resilience frameworks, some conceptualizations of resilience include external assistance to assist systems in becoming resilient. These approaches to resilience include those developed by the UN Food and Agriculture Organization (FAO) and the University of Florence (e.g., Alinovi, Mane, & Romano, 2009; Alinovi, D’Errico, Mane, & Romano, 2010; Ciani & Romano, 2013; FAO, 2014), Oxfam (Hughes & Bushell, 2013), and the Livelihood Vulnerability Index (e.g. Hahn, Riederer, & Foster, 2009). The Alinovi-FAO effort has produced a household resilience index, which posits that resilience is a function of “IFA = income and food access; ABS = access to basic services; AA = agricultural assets; NAA = non-agricultural assets; APT = agricultural practice and technology; SSN = social safety nets; CC = climate change; EIE = enabling institutional environment; S = sensitivity; AC = adaptive capacity” (FAO, 2014, p. 4). Oxfam (Hughes & Bushell, 2013) maintains that resilience is the weighted sum of five factors: livelihood viability, innovation potential, contingency resources and support access, integrity of natural and built environments, and social and institutional capacity. The Livelihood Vulnerability Index (Hahn et al., 2009) is composed of seven factors: socio-demographic profile, livelihood strategies, social networks, health, food, water, and natural disaster and climate variability.
Many of the parameters in these three indices are consistent with those of ecological resilience frameworks. The admirable goal of the FAO, Oxfam, and Livelihood Vulnerability indices, however, is to assist aid agencies in helping households survive with a combination of external assistance and modification of household qualities. Thus, if resilience is a measure of ability to withstand disruption external to the system, and aid agency assistance programs are part of the system, then the indices do not measure resilience at the household level, but at the scale of the aid agencies assisting the households. Resilience at the household or community level, however, would incorporate the ability to withstand fluctuations in aid agency policies, along with disruptions from policy, market, input supply, and other systems beyond the household or community level. As Levine (2014) discusses at length, resilience indices that incorporate measures at various scales can only estimate resilience at the highest scale each addresses.
Since the ecological resilience approach focuses on defining the qualities that are necessary for systems to achieve general resilience, resilience must be measured at specific scales for specific types of systems. Resilience at the household scale, community scale, and aid agency scale can even be contradictory (Levine, 2014). This is apparent when we look at a crucial component of resilience: self-organization.
Local Self-organization (LSO) Is Necessary But Not Sufficient for Resilience To Emerge
Self-organization refers to the emergence of new structures and systems from systems already present in a locality (Camazine et al., 2003). An aid agency organizing a community and its households for resilience can be considered self-organized at the scale of the aid agency, but not at the scale of the household. Systems highly influenced by external organizations are at least somewhat dependent on those entities. All prominent frameworks of ecological resilience contend that self-organization is one of the necessary qualities of any resilient system.
In some regions, systems of LSO processing and marketing of food survive and thrive; in others they do not. The Southern United States is a region that generally ranks low in LSO and in local food system activities more broadly. One prominent 2016 index (Strolling of the Heifers, 2016) puts only Virginia of all Southern states in the top half of states in presence of local food systems. South Carolina is 27th, North Carolina 34th, and the other ten Southern states are ranked in the lowest 13 states. Except for the top four Southern states (Virginia, North Carolina, South Carolina and Kentucky), all others have been declining in rankings in each of the last three years. Yet in each of the lowest ranked states, some LSO food systems have proven resilient. Study of the food systems that have survived and thrived in recalcitrant areas should provide insight into the qualities of resilient systems beyond LSO.
This study seeks to determine the common qualities of such resilient LSO food systems and compare them with those proposed by the most prominent resilience frameworks. Obtaining a defined set of qualities of resilient Southern systems lays the foundation for exploration of indicators for each of these qualities. Combining scores on indicators across all the qualities could then result in a sustainability/resilience index, which can be correlated with social demographic characteristics such as poverty, health, and education. Then it will be possible to determine the extent to which levels of sustainability/resilience are associated with the societal goals often measured by sustainability assessments. The work described here has accomplished the first step by identifying the common qualities of resilient food systems.
Results and Theory Elaboration
Case studies of resilient food systems in the Texas High Plains, Louisiana and Mississippi were developed and analyzed in the context of the frameworks noted above, resulting in a theoretical framework applicable to all cases. The case studies are available on our resilience website (Worstell, 2018).
Eight qualities were found to be common to all case studies and consistent with the qualities identified by the most prominent resilience frameworks. These eight qualities are compared to the six frameworks in Table 1. Below, we describe these qualities with examples from the case studies and from other resilience frameworks.
|
Table 1. Comparison of the Eight Qualities of Resilient Systems in Six Prominent Frameworks for Analysis of Resilient Systems. |
||||||
|
|
Cabell & Oelofse (2012) |
Carpenter et al. (2012) |
Rockefeller Foundation (2014) |
Stockholm Resilience Center (2015) |
Frankenberger et al. (2013) |
Walker & Salt (2006) |
|
1.Modular connectivity |
Appropriately connected |
Modularity, openness, feedbacks, monitoring, leadership, and trust |
Integrated (connected), robust (modularity) |
Manage connectivity, manage slow variables and feedbacks |
Social capital |
Modularity, tight feedbacks, social capital |
|
2. Locally self-organized |
Socially self-organized; globally autonomous and locally interdependent |
Nestedness |
Inclusive |
Promote polycentric governance systems (nestedness)
|
Self-organized, inclusive |
Overlap in governance |
|
3. Increasing physical infrastructure |
|
|
Robust |
|
Community assets, preparedness, aspirations |
|
|
4. Responsive redundancy/Back-ups |
Optimally redundant |
Reserves |
Redundant |
Maintain redundancy |
|
|
|
5. Complementary diversity |
Functional and responsive diversity; spatial and temporal heterogeneity |
Diversity |
|
Maintain diversity |
Diversity |
Diversity |
|
6. Conservative innovation |
Builds human capital, honors legacy, reflected and shared learning |
Openness |
Reflective, flexible, resourceful |
Encourage learning |
Learning and innovation; responsiveness/ flexibility, memory |
Innovation |
|
7. Ecologically self-regulated (works with nature) |
Ecologically self-regulated, coupled with local natural capital |
|
Integrated |
|
|
Ecological variability, ecosystem services |
|
8. Embracing disturbance for transformation |
Exposed to disturbance, temporal heterogeneity |
|
Reflective |
Foster complex adaptive systems thinking |
Responsiveness |
|
Locally Self-organized (LSO)
The case studies were chosen because they were locally self-organized food systems, which we define as food systems where farmers, marketers, and processors in one agroecoregion have developed a system owned and managed by those same farmers, marketers, and processors. The systems studied ranged from farmers-restaurants-butchers-philanthropists in Southeast Tennessee to farmers-meat processors-aggregators-food store operators in North Central Arkansas.
Ecosystems unmanaged by man are finely attuned to local conditions; farms and food systems often are not. Frankenberger et al. (2013) and Cabell and Oelofse (2012) have an especially strong focus on the LSO quality. Cabell and Oelofse (2012) use the term socially self-organized, and specifically cite the example of community supported agriculture (CSA) systems and farmers’ markets. They make a distinction echoed in many other frameworks, that LSO networks can be more responsive and adaptable to changing conditions than can larger groups. Top-down initiatives can fail if the timing is wrong, if the needs are misinterpreted, or if there is no buy-in from stakeholders. Frankenberger et al. (2013) and Rockefeller Foundation (2014) refer to “buy-in from stakeholders” as inclusiveness.
Other frameworks are less specific about the need for LSO, but imply its importance in the qualities labeled overlap in governance (Walker & Salt, 2006), nestedness (Carpenter et al., 2012), and polycentric governance (Stockholm Resilience Center, 2015). These three frameworks emphasize need for governance above the farm and community level to be focused on resilience. Since, as we discussed earlier, resilience indices that include measures at higher scales can only measure at the highest scale where indicators are measured, regional, national, and world governance must be examined at their own scales. All ecosystems are nested, since every system is composed of systems. Every resilient system contributes to the resilience of subsystems of which it is composed. Those subsystems are resources or assets for the larger system that must be enhanced and maintained, as addressed with the next resilience quality.
Maintenance, Responsive Redundancy or Back-ups
Resilient systems have back-ups and maintain and replenish their components. Ecologists use the term redundancy to mean that several of each component of a system are present and they are replaced when lost. (This should not be confused with uses of the term in other fields, such as labor redundancy or redundancy in grammar.) Redundancy that promotes resilience is responsive to needs of the system. The resilient system has mechanisms to control excessive fecundity. Skills, abilities, and functions are also reproduced and passed on to the next generation to insure that that generation survives and multiplies.
All the resilient case study farmers and entrepreneurs had family and friends who were deeply involved in the system and able to take over functions as needed. One Arkansas system is a five-generation family farm where the two most recent generations have maintained and expanded a LSO food production and marketing system in existence for more than 25 years. A Mississippi system showed high levels of redundancy when members of the group continued farm and market operations when the husband and wife managers were absent for months with a sick child. A farm in one of the Tennessee case study systems is transitioning its enterprise to an employee and the founders’ children.
Redundancy, the ability of a system to replace as needed its components, is seen as crucial in all resilience frameworks, though Frankenberger et al. (2013) does not explicitly use the term. Their term, reserves, as noted above, has a similar definition as redundancy in our framework. Cabell and Oelofse (2012) use the term “optimally redundant,” which highlights the crucial qualification that redundancy inevitably increases inefficiency of the system.
Accumulating Reserves and Physical Infrastructure
As they developed, all our case studies systems saw an increase in physical infrastructure, including natural capital, human-made environmental capital, and technological capital as defined by Stokols, Lejano, and Hipp (2013). Managers in these systems delayed consumption and profit-taking to build infrastructure and reserves. This quality is reflected in such indicators as increasing water harvesting capability, increasing soil organic matter, making trees and permanent pastures part of the production system, increase on-farm storage, and increasing value-added processing capacity. Every farm in all nine case studies reported gradually increasing soil quality, water harvesting capacity, and on-farm storage. Six of the nine showed increases in on-farm processing infrastructure.
The Rockefeller Foundation (2014) is most explicit of all the frameworks about the need for physical infrastructure. They use the term “robust” to describe well-conceived, constructed, and managed physical assets, which enable a system to withstand the impacts of hazard events without significant damage or loss of function. Cabell and Oelofse (2012) emphasize that resilient systems are coupled with local natural capital—the slow variables such as soil organic matter, hydrological cycles, and biodiversity. The Stockholm Resilience Center (2015) also notes the importance of managing slow variables, though without emphasis on building up such infrastructure, perhaps because their focus is not primarily agroecosystems.
Frankenberger et al. (2013) are explicit about the necessity of building infrastructure for resilient systems. In other frameworks, this quality seems to be assumed in such terms as reserves (e.g., Carpenter et al., 2012) that contribute to recovery from disturbance. Reserves cannot be established without the productive infrastructure needed to create them. Frankenberger et al. (2013) highlight community assets, which are resources that enable communities to meet the basic needs of their members and reduce vulnerability to shocks. However, the broad definition of assets—including both tangible and intangible assets, involving social, human, financial, natural, physical, and political capital—makes measurement of this quality difficult in their framework (Frankenberger et al., 2013). They propose two other qualities that are not explicitly stated in other conceptualizations, but are related to increasing assets or infrastructure: preparedness and aspiration. Preparedness refers to the community resources needed to cope with disturbance. Aspirations are the underlying personal traits that induce people to make investments needed to cope with disturbance. Most clearly of the frameworks, Frankenberger et al. (2013) point out that actors in resilient social agroecosystems display an ability to delay gratification and a desire to create infrastructure to accumulate reserves.
Modular Connectivity
In all case studies the farmers and entrepreneurs were independent, but highly connected to many other farmers, marketers, and suppliers. Sensitivity and responsiveness to feedback of other systems does not, however, undermine modularity in resilient systems. High levels of connectivity mean resilient systems are sensitive and responsive to feedback, though in a modular fashion. Modular subsystems have enough independence that damage or failure of even a key sub-system has low probability of generating failure throughout the system. Such sub-systems could be a farm in a network of connected farms or an individual enterprise on one farm, depending on the scale at which resilience is examined. Yet each component of the system is connected enough to detect and respond to changes throughout the system. Resilient connectivity has a few strong connections and many weak connections. Successful individual businesses only lead to resilient development when they are part of a collaborative network of businesses and organizations.
All case study systems were connected to an abundance of marketing and production sources, while not being solely dependent on any one of these connections. One Mississippi system was a 40-year-old cooperative of almost a hundred members that is part of state and national collaborations of cooperatives. Another Mississippi system features a nonprofit that facilitates connections between thousands of farmers, marketers, processors, and policy experts. One Arkansas case study system has farmers, marketers, processors, and aggregators among its over 500 members.
All prominent frameworks for resilience recognize the importance of connectivity and modularity. Some who are mainly concerned with human systems make social capital a separate category. While recognizing the vital important of social capital in the Community Capitals Framework (Flora, Flora, & Gasteyer, 2015) and the Sustainable Livelihoods Framework (e.g., Scoones, 1998), social capital can be seen as a subset of the connectivity which occurs in all systems, not just human systems.
Carpenter et al. (2012) have a strong focus on modular connectivity, but they split this quality into several separate areas: modularity, managing feedback, monitoring, openness, and development of trust. Cabell and Oelofse (2012) call the quality “appropriately connected.” They extol connectivity, but do not address situations where high connectivity leads to low resilience to disturbance. If components of the system are not modular or independent, it cannot be resilient when disturbance floods though systems. Frankenberger et al. (2013) see the vital importance of social capital, but discuss other aspects of connectivity in less detail, and do not discuss modularity. The Rockefeller Foundation (2014) uses slightly different terminology. Instead of connectivity, they refer to resilient systems as integrated, when exchange of information between systems enables them to function collectively and respond rapidly through shorter feedback loops. Instead of modularity, they use the term robust to refer to well-designed systems that actively avoid over-reliance on a single asset, cascading failure, and design thresholds that might lead to catastrophic collapse. The Stockholm Resilience Center (2015) focuses on managing connectivity and feedbacks, but with less emphasis on modularity than other frameworks.
Complementary Diversity
The peculiar diversity of resilient systems is complementary in function. For example, resilient systems are composed of diverse complementary systems which turn wastes of one system into valuable inputs to other system. Complementary diversity is characterized by a variety of crops, markets, sources of inputs, and spatial heterogeneity. Heterogeneity of features within the landscape and on the farm—diversity of inputs, outputs, income sources, markets, pest controls—all reflect this diversity in resilient systems. One Mississippi system included dozens of farmers marketing together with complementary products. Collaborating with multiple suppliers, marketing outlets, and fellow farmers to encourage symbiosis and mutualism is evident in all the case studies.
All resilient food system case study farmers and entrepreneurs had a diversity of enterprises. One Tennessee system combined a dairy and fruit and vegetable operations with sales to farmers markets and restaurants, and direct to consumers. One farm in an Arkansas case study system included dozens of crops grown nowhere else in Arkansas. The diversity of the case studies was characterized by complementarity. While diverse, each enterprise was complementary to other enterprises. The managers recognized that lack of complementarity could compromise resilience.
Diversity is extolled by nearly all resilience frameworks. Some frameworks—e.g., Carpenter et al. (2012), Stockholm Resilience Center (2015), and Frankenberger et al. (2013) —do not address the need for diversity to be complementary or the fact that diversity can undermine resilience if, for example, enterprises compete for time and resources. Cabell and Oelofse (2012), in contrast, make this distinction explicit. They also include, as a separate quality, spatial and temporal heterogeneity; that is, lack of uniformity across the landscape and through time. We see this as a measure of diversity, and not a separate quality from diversity.
Ecological Integration (Working with Nature)
The diverse managed components of resilient systems are complementary not just to each other, but to unmanaged ecosystem services. Ecological integration means using natural ecological processes to increase productivity and decrease imported inputs. Basic examples include reduced tillage, integrated pest management, and use of cover crops—practices many farmers have embraced. This aspect of resilience places a value on the preservation of minimally managed or uncultivated land, left to the natural cycles of insects, birds, and other beneficial organisms. Farms that maintain plant cover and incorporate more perennials provide habitat for predators and parasitoids, use ecosystem engineers such as soil fauna, and align production with local ecological parameters are naturally more resilient than farms that stress the use of increasing amounts of chemical fertilizers and pesticides, excluding nature as much as possible for the sake of monocultures. Rotational grazing to build soils, inoculating soils with beneficial microorganisms, and various agroforestry practices are more advanced methods of ecological integration. Permaculture is an applied example of ecological integration in resilient systems, as we have discussed elsewhere (Worstell & Johnson, 2015).
The myriad studies on ecological integration are summarized in our online book that gives a plethora of practical tips for increasing that quality of resilience (Worstell & Johnson, 2016). Each farmer in our case studies has found ways of using local ecological systems to increase productivity, whether through biodynamic farming (the Central Tennessee case study) or organic methods (the Central Arkansas study), rotational grazing (case studies in all three states), or integrated pest management (case studies in all three states).
Of the most prominent resilience frameworks, Cabell and Oelofse (2012) are the most explicit in recognizing the value of ecological integration, stating that the more intact and robust the regulating ecosystem services are, the more resilient the agroecosystem. They further suggest that more resilient systems are more capable of self-regulation. The Rockefeller Foundation’s discussion of integration (2014) and the importance placed on diversity by other frameworks make this quality implicit in all the frameworks. Our analysis of LSO food systems indicates that the quality should be explicitly measured and induced.
Conservative Innovation and Flexibility
Resilient systems are open to new ideas while retaining ideas that work from the past. Practical learning is valued, as are elders and heirloom seed varieties. Moore, McCarthy, Byrne, and Ward (2014) call this quality reflexive resilience. Innovation also applies to the whole system where it is manifested in the transformation quality discussed below.
Since resilience requires the ability to come up with uniquely appropriate responses in diverse situations, a system needs a variety of approaches. Ecologically resilient systems stress multiple, overlapping strategies rather than single solutions. Collaboration between universities, research centers, and farmers, and cooperation and knowledge sharing between farmers reflect the quality of flexibility in resilient systems.
All case study systems were highly innovative, but in a very conservative fashion. All their innovations fit their existing system and maintained successful traditions. A farmer in one Arkansas case study manages both his organic farm and a conventional farm that is gradually incorporating innovative organic methods. All case studies were innovative for their area, but had chosen innovations which were working successfully in similar regions in other parts of the world. For example, one case study system in Arkansas has introduced various crops grown only in similar microclimates in California and China, for discerning local customers.
Innovation is a necessary quality of resilient systems in nearly all frameworks. Carpenter et al. (2012) discuss it under their term openness; the Rockefeller Foundation (2014) under the quality “flexible, resourceful, reflective”; Cabell and Oelofse (2012) under the quality “build human capital and reflected and shared learning”; Stockholm Resilience Center (2015) under the quality “encourage learning”; Frankenberger et al. (2013) under the quality “responsiveness/ flexibility and learning and innovation.” Many frameworks, however, are not as explicit about the dangers of innovation that do not honor legacy, as Cabell and Oelofse (2012) put it. Legacy is the memory component of a SES. Frankenberger et al. (2013) refers to this quality as a strong community memory of traditions, practices, past disasters, and changing conditions which supports a community’s abilities to draw on experience to prepare for and respond to similar challenges.
Periodic Transformation: Reorganizing, Reforming, Embracing Disturbance
Resilient systems are continually reforming themselves. In a SES, this is reflected in regular turnover of leadership, lack of authoritarian leaders, inheritance taxation, and mandatory retirement. Reformation is intimately related to self-organization and innovation. Innovation at one scale is transformation at another scale.
The resilient food systems in our case studies all had undergone regular transformations and sought out means of transforming their systems. One Arkansas system moved from traditional cotton production, to a farmer’s market and agri-tourism center, to inclusion of a restaurant and grocery stores, and then to direct marketing of highly diverse crops including organic production. A Tennessee system changed from direct marketing fruits and vegetables, to sales to restaurants, to a U-pick operation coupled with a cheese dairy.
Of the prominent resilience frameworks, Cabell and Oelofse (2012) mostly explicitly state that exposure to disturbance is a quality of resilient systems. Their indicator of temporal heterogeneity also shows recognition of the transformation over time of resilient systems. Frankenberger et al. (2013) notes the importance of transformative capacity.
Though innovation within a system is transformative on a smaller scale and is a quality all recognize as necessary to resilience, most frameworks do not make the leap to recognizing that sometimes the innovation required might be so extensive as to transform the entire system. This limited embrace of transformation is illustrated by the Rockefeller Foundation (2014) emphasis on reflective systems, which notes that resilient systems have mechanisms to continuously evolve, but does not go so far as to say that periodically they are totally transformed. Our work with LSO food systems indicates that transformation is a quality necessary to resilience and must be explicitly included.
Qualities That Do Not Distinguish Resilient from Non-resilient Systems
Nearly all the factors deemed necessary by other frameworks are incorporated in the eight qualities of resilience found consistently in LSO food systems. Two are not, however. The Stockholm Resilience Center is the only framework that includes the quality of “fostering” complex adaptive systems (CAS). A CAS does embrace and use disturbance for transformation. As all living systems are complex adaptive systems (Levin, 1998), however, fostering a CAS does not distinguish a resilient from a non-resilient system. Similarly, “sufficient profit,” one of the 13 indicator categories of Cabell and Oelofse (2012), is not a quality that distinguishes between resilient and non-resilient systems. A resilient system will be generating sufficient profit, but profit is not necessarily an output that leads to resilience. Excess profit can certainly lead to non-resilience if it is extracted by undermining system qualities that promote resilience. Other systems may not be profitable for several years due to expenses related to increasing resilience. Resilient systems, by definition, withstand economic disturbances and shocks due to the qualities inherent in the system. However, using resilience to economic disturbances as a defining characteristic of resilience makes the definition circular.
Which Set of Qualities Is the Most Useful?
The eight qualities we present each appear to be necessary for resilience in our case studies of resilient food systems in recalcitrant Southern states. Those who arrived at the other sets of qualities likely feel that their set fits the systems they know best. The best way to decide between the frameworks would be to attempt to induce resilience in a particular system following the predictions of each framework. This requires operationalizing these concepts; that is, defining specific ways of inducing and measuring each of the qualities espoused by each framework.
In Table 2 we have generated activities and measures at various scales which could be used to test whether the eight qualities we identified in studies of resilient food systems improve resilience and sustainability, and whether they are each necessary and, together, sufficient to induce resilience in systems at various scales. If those espousing alternative frameworks attempt to operationalize their concepts as well, then alternative models can be tested to see which predicts resilience most fully. The goal of this table is to stimulate those interested in an ecological resilience perspective on sustainability to examine agricultural systems at various scales to determine what qualities lead to systems which survive and thrive in response to disturbance, as well as to generate measurable indicators of these qualities.
|
Table 2. Resilient food systems three-dimensional matrix: scale, qualities, time |
||||||||
|
|
Modular connectivity |
Local self-organization |
Accumulation of Infrastructure and reserves |
Maintenance or Responsive redundancy |
Complementary diversity |
Conservative innovation |
Integration of natural ecological systems |
Periodic transformation |
|
Federal policy system |
Cooperative development programs (RCDG)[1] |
VAPG, FMPP, LFPP, F2S implemented with planning funds for local projects |
NRCS support for increasing infrastructure (soil, water catch & conserve, equipment, fence) |
BFRDP focused on training a new generation of farmers |
Opportunity workshops to encourage diversification of crops and markets |
On-farm innovation trials of tools incorporating traditional methods, tools and products |
Workshops to increase use of ecological services (beneficial uses, cover crops, MIG) |
Support for new leader training in farm & cooperative groups |
|
Regional network
|
Bridging contact maintained to all member groups |
Bring contacts which facilitate local control |
Increasing capability to improve local infrastructure |
Network recruits new groups from across region. |
Accesses new markets, practices for farmer groups |
Local traditions celebrated while new ideas embraced |
Wilderness reserves maintained |
Regular turn-over in governing officials |
|
Community |
Facilitates communication between all members |
Local firms encouraged, outsiders must partner |
Increasing infrastructure for services |
Community maintains and replaces all needed services. |
Increased diversity dedicated to local heritage |
Community embraces innovation and new practices as preserve heritage. |
Increasing area of parks and woodlands |
New and young leaders encouraged |
|
Group of farmers |
Farmers trust and value other members of group |
Local ownership of processing and marketing |
Processing/market equipment and facilities growing |
Group recruits new members |
Many different markets maintained for products |
Variety of processing methods used as markets change |
Support refuges and local heritage products |
New processing/ marketing systems and products adopted |
|
Farm and farm family |
All systems on farm are independent but connected |
Local managers make land decisions |
Farm assets, equipment, inventory |
Family and friends ready to help manage farm |
Variety of systems (e.g. crop & livestock) integrated. |
Farm uses old and new tools to produce heritage and new products |
Wild refuges maintained on farm |
Kaizen, continuous improvement of farm systems |
|
Soils |
Feedback tight btw soil and soil cover systems |
Soils need few inputs to maintain productivity |
Soil health increasing |
Soil systems, soil cover reproduce selves |
Diversity of soil organisms, and plants maintained. |
Soil systems adapt to changing conditions |
Native flora, fauna, EM increasingly relied on |
More systems for ↑ soil organic matter and topsoil depth |
|
Water |
Water resource and need have tight feedback |
Local water harvest meets local need |
Water capture increasing |
Water sources steady to increasing |
Multiple water sources available. |
Variety of water sources developed/ maintained |
Water systems enhance wilderness |
New systems employed to harvest/store local water |
|
Person |
Bonding and bridging, social capital |
Internal locus of control |
Maintains equipment, soil, water catchment |
Heals quickly, helps others learn |
Has variety of approaches, attitudes |
Changes approach when need to |
Follows natural cycles, eats seasonal foods |
Regularly tries new patterns, breaks old habits |
Combining the Eight Qualities into an Overall Index of Sustainability/Resilience
Operationalizing the qualities of resilience such that they can be quantified lays the foundation for creating an overall index of sustainability/resilience. If such an index is a good predictor of resilience, it would help managers of a system—farm, community, food system, etc.—improve resilience and be able to track changes in resilience. Indicators of the qualities of resilience are publicly available at the county level in databases such as National Census of Agriculture, Decennial Census, American Community Survey Five-Year Estimates, Net Migration Patterns for U.S. Counties, County Health Rankings, USDA Food Atlas, and USDA Farm to School Database. Aggregate county-level data from these sources could be used to test the validity of the eight qualities of resilient systems by integrating the nine case studies of resilient local food systems in recalcitrant areas of the Southern U.S. with previous frameworks or the qualities espoused by other frameworks.
We are attempting to create quantitative measures of each of the qualities and an overall sustainability/resilience index. In our approach, available data from every county in the 13 Southern states are united in an overall sustainability/resilience index (SRI) that provides estimates of sustainability/resilience for each county in the South. These data are presented in draft form online (Worstell, 2016), along with practical tips for increasing resilience. We urge all other developers of resilience frameworks and models to consider quantification of their concepts to accompany their case study efforts. Such quantification can permit researchers to test whether their frameworks predict resilience. For example, Tsai, Wilson and Rahman (2015) used some of the data sources mentioned above to test resilience of rural counties to the 2007-2008 Great Recession. Their dependent variable, rebound in employment after the Recession, was highly correlated with their resilience measures.
Relating SRI to Social Demographic Variables
As discussed above, ecological resilience avoids the polarizing aspects of other perspectives on sustainability with a measurable biological reality, the amount of disturbance a system can take before it dissolves without being able to reconstitute itself. The resilient system survives, the non-resilient does not. Ecological resilience assessment differs from sustainability assessment in one basic area: resilience assessments do not incorporate indicators unless they are associated with the ability of a system to withstand disturbance. An ultimate goal of resilience measurement is a set of indicators of the key qualities of ecological resilience across scales and types of systems, including soils and wildlife systems. Indicators of human social development are not available at the scale of soil or field.
Furthermore, if we are to determine whether sustainable and resilient local food systems contribute to broader goals of improving quality of life and wellbeing (USDA farm bill, 1990; Toman, Lile, & King, 1998; Exec. Order No. 13, 693, 2015), a crucial proposition of sustainable agriculture movements and policies, it is critical that our theoretical and analytical frameworks not confound them. Frameworks that incorporate all desired outcomes in measures of resilience cannot measure the contribution of the system to these desired outcomes. Because of this, we intentionally do not include traditional poverty or health indicators. It is not because they are not part of broader social resilience, but rather because we want to be able to measure the extent to which they are associated with the ecological indicators of system resilience.
Approached from the standpoint of ecological resilience, quantitative measures of sustainability/resilience allow correlation of food system resilience with the variety of social indicators included in many traditional definitions of sustainability. Such analyses show the relationship of resilience to socially desirable characteristics that are only indirectly reflected in the fundamental qualities of resilience.
This approach enables examination of correlations of quantitative measures of resilience (such as our SRI) with measures of poverty, health, population, and other human social demographic variables. Determining the effect on such variables is crucial to determining whether ecologically resilient systems meet the quality of life or social criteria established by the various definitions of sustainability. We do have preliminary data (Green & Worstell, in preparation) that show that indicators of poverty appear highly negatively correlated with our sustainability/resilience index. Others, such as health indicators, are highly positively correlated. One tentative conclusion of these studies being prepared for publication is that resilient systems, at least at the county level as measured by SRI, generally are accompanied by low poverty and high health outcomes. Some basic data is presented in draft form online at Worstell and Grand (2016).
Other social demographic variables such as education level or population trends, though not included in most definitions of sustainability, also have interesting relationships to SRI. Correlations of these various social demographic indicators with resilience are in preparation (Green & Worstell, in preparation). We urge all other resilience analysts to consider the relationships of health, poverty, and other social-demographic variables as efforts to quantify resilience. If low levels of poverty and high levels of health outcomes are correlated with resilience, an ecological resilience approach to sustainability may achieve the societal objectives of sustainability while establishing roots in biological and ecological sciences.
Conclusions
Living systems survive and thrive when their integrated components work together to adapt and transform in response to similar adaptation and transformation of other complex adaptive systems. Those that survive and thrive are called ecologically resilient. Viewing sustainability from a resilience perspective offers a means of reducing polarization and solving wicked problems due to the simple and observable definition of resilience. Defining and measuring the qualities of resilient systems should facilitate design and enhancement of similar systems.
We have identified eight qualities consistently shown in our case studies of uniquely resilient food systems in conjunction with examination of six prominent frameworks of ecological resilience. Identifying these qualities of resilient food systems was our first step toward a quantitative index of sustainability and resilience. We are using the resulting sustainability/resilience index to assess and help entrepreneurs and other managers to improve resilience at the community and farm level. Our continuing mission is to refine the index and our toolbox and extend it to various scales. We seek a set of descriptive statements that apply to multiple levels. For example, below is a set of statements summarizing our findings with food systems, but expressed at the community level by substituting community for food system.
- C: A resilient community is independent yet tightly connected to other communities, markets, and government policy systems.
- L: A resilient community has many LSO processing and marketing enterprises.
- I: A resilient community encourages regular innovation that conserves the tried and true qualities that built it.
- M: A resilient community maintains its systems and establishes back-ups and redundancy.
- A: A resilient community accumulates reserves and physical infrastructure that enable withstanding disturbance.
- T: A resilient community embraces disturbance and periodically transforms itself.
- E: A resilient community works with nature to minimize imported manufactured inputs, moving toward ecological integration.
- D: A resilient community has a diversity of complementary enterprises.
The acronym CLIMATED expresses the eight qualities consistently found in systems that last. The eight qualities can also be expressed in a conceptual model expressed as SRI = f(C, L, I, M, A, T, E, D). Future research will define these qualities and their relationships to better explain, predict, and facilitate resilient sustainability.
Our framework lays a foundation for a virtually unlimited set of studies that will help increase resilience to climate change, economic change, technological change, political change, or any of a vast set of potential disturbances of our social agroecosystems.
References
Alinovi, L., Mane, E., & Romano, D. (2009). Measuring household resilience to food insecurity: Application to Palestinian households (EC-Food and Agriculture Organization Food Security Programme Working Paper). Rome: FAO of the UN. Retrieved from http://www.fsnnetwork.org/sites/default/files/measuring_household_resilience_to_food_insecurity.pdf
Alinovi, L., D’Errico, M., Mane, E., & Romano, D. (2010). Livelihoods strategies and household resilience to food insecurity: An empirical analysis to Kenya. Paper prepared for the conference, Promoting Resilience through Social Protection in Sub-Saharan Africa. European Report of Development, Dakar, Senegal, June 28-30, 2010. Retrieved from http://erd.eui.eu/media/BackgroundPapers/Alinovi-Romano-D'Errico-Mane.pdf
Andrew, L., Arndt, D., Beristain, N., Cass, T., Clow, T., Colmenares. B. … & McCallum, M. L. (2016). Changes in United States’ citizens’ interest in sustainability (2004–2014). Life: The Excitement of Biology, 4(3), 138-164. http://dx.doi.org/10.9784/LEB4(3)
Binder, C. R., Hinkel, J., Bots, P., & Pahl-Wostl, C. (2013). Comparison of frameworks for analyzing social-ecological systems. Ecology and Society, 18(4), 26. http://dx.doi.org/10.5751/ES-05551-180426
Cabell, J. F., & Oelofse, M. (2012). An indicator framework for assessing agroecosystem resilience. Ecology and Society, 17(1), 18. Retrieved from http://www.ecologyandsociety.org/vol17/iss1/art18/
Camazine, S., Deneubourg, J.-L., Franks, N. R., Sneyd, J., Theraulaz, G., & Bonabeau, E. (2003). Self-organization in biological systems. Princeton, New Jersey: Princeton University Press.
Carpenter, S. R., Arrow, K. J., Barrett, S., Biggs, R., Brock, W. A., Crépin, A.-S. … & de Zeeuw, A. D. (2012). General resilience to cope with extreme events. Sustainability, 4(12), 3248-3259. http://dx.doi.org/10.3390/su4123248
Cerf, M., Jeuffroy, M., Prost, L., & Meynard, J. (2012). Participatory design of agricultural decision support tools: Taking account of the use situations. Agronomy for Sustainable Development, 32(4), 899–910. http://dx.doi.org/10.1007/s13593-012-0091
Ciani, F., & Romano, D. (2013). Testing for household resilience to food insecurity: Evidence from Nicaragua. Florence, Italy: Department of Economics and Management, University of Florence. Retrieved from http://www.siecon.org/online/media/pdf/C/i/a/Ciani-Romano.pdf
Crossfield, P. (2009). Global Harvest Initiative seeks not to feed people, but to bolster big agriculture’s profits. [Blog post]. Huffington Post. Retrieved from http://www.huffingtonpost.com/paula-crossfield/global-harvest-initiative_b_294482.html
Curry, J. (2013). Forget sustainability—it’s about resilience. [Blog post]. Retrieved from https://judithcurry.com/2013/05/29/forget-sustainability-its-about-resilience/
Exec. Order No. 13, 693, 3 C. F. R. 281-296. (2015). Planning for federal sustainability in the next decade. Washington, D.C.: Government Printing Office. Retrieved from https://www.whitehouse.gov/the-press-office/2015/03/19/executive-order-planning-federal-sustainability-next-decade
Food and Agriculture Organization of the UN [FAO]. (2014). Resilience index: Measurement and analysis model. Rome: Author. Retrieved from http://www.fao.org/3/a-i4102e.pdf
Flora, C. B., Flora, J. L., & Gasteyer, S. P. (2015). Rural communities: Legacy and change (5th ed.). Boulder, Colorado: Westview Press.
Forrester, J.W. (1971). Counterintuitive behavior of social systems. Theory and Decision, 2(2), 109-140. Retrieved from http://ocw.raf.edu.rs/courses/sloan-school-of-management/15-988-system-dynamics-self-study-fall-1998-spring-1999/readings/behavior.pdf
Frankenberger, T., Mueller, M., Spangler, T., & Alexander, S. (2013). Community resilience: Conceptual framework and measurement Feed the Future learning agenda. U.S. Agency for International Development. Rockville, Maryland: Westat. Retrieved from https://agrilinks.org/sites/default/files/resource/files/FTF%20Learning_Agenda_Community_Resilience_Oct%202013.pdf
Frick, K. T., Weinzimmer, D., & P. Waddell, P. (2014). The politics of sustainable development opposition: State legislative efforts to stop the United Nation’s Agenda 21 in the United States. Urban Studies, 52(2), 209-232. http://dx.doi.org/10.1177/0042098014528397
Grenz, J. (2011). RISE (Response-Inducing Sustainability Evaluation), version 2.0. Field Manual. Zollikofen, Switzerland: Swiss College of Agriculture. Retrieved from http://www.saiplatform.org/uploads/Modules/Library/What%20is%20RISE%202.pdf
Hahn, M. B., Riederer, A. M., & Foster, S. O. (2009). The livelihood vulnerability index: A pragmatic approach to assessing risks from climate variability and change. A case study in Mozambique. Global Environmental Change, 19(1), 74–88. http://dx.doi.org/10.1016/j.gloenvcha.2008.11.002
Holling, C. S. (1973). Resilience and stability of ecological systems. Annual Review of Ecology and Systematics, 4(1), 1-23. Retrieved from http://dx.doi.org/10.1146/annurev.es.04.110173.000245
Holling, C.S. (1996). Engineering resilience versus ecological resilience. In P. Schulze (Ed.), Engineering within ecological constraints (pp. 31-44). Washington, D.C.: National Academy Press.
Holt-Giménez, E., & Altieri, M. (2016). Agroecology “lite”: Cooptation and resistance in the global North. Oakland, California: Food First. Retrieved from https://foodfirst.org/agroecology-lite-cooptation-and-resistance-in-the-global-north/
Hughes, K., & Bushell, H. (2013). A multidimensional approach for measuring resilience. Oxford, UK: Oxfam GB. Retrieved from http://policy-practice.oxfam.org.uk/publications/a-multidimensional-approach-to-measuring-resilience-302641
Lauckner, H., Paterson, M., & Krupa, T. (2012). Using constructivist case study methodology to understand community development processes. The Qualitative Report, 17(13), 1-22. Retrieved from http://nsuworks.nova.edu/cgi/viewcontent.cgi?article=1790&context=tqr
Levin, S. A. (1998). Ecosystems and the biosphere and complex adaptive systems. Ecosystems, 1(5), 431-436. http://dx.doi.org/10.1007/s100219900037
Levine, S. (2014). Assessing resilience: Why quantification misses the point. London: Overseas Development Institute. Retrieved from http://capacity4dev.ec.europa.eu/resilience_ethiopia/document/assessing-resilience-why-quantification-misses-point-simon-levine-2014-humanitarian-policy-
Lowdermilk, W. C. (1948). Conquest of the land through seven thousand years. Washington, D.C.: U.S. Department of Agriculture, Soil Conservation Service.
Low, S. A., Adalja, A., Beaulieu, E., Key, N., Martinez, S., Melton, A. … & Jablonski, B. B. R. (2015). Trends in U.S. local and regional food systems (AP-068). Washington, D.C.: U.S. Department of Agriculture, Economic Research Service. Retrieved from https://www.ers.usda.gov/webdocs/publications/ap068/51173_ap068.pdf
Martinez, S., Hand, M., Da Pra, M., Pollack, S., Ralston, K., Smith, T. … & Newman, C. (2010). Local foods systems: Concepts, impacts, and issues (ERR-97). Washington, D.C.: U.S. Department of Agriculture, Economic Research Service. Retrieved from http://www.ers.usda.gov/media/122868/err97_1_.pdf
May, R. M. (2002). The future of biological diversity in a crowded world. Current Science, 82(11), 1325-1331. Retrieved from http://www.iisc.ernet.in/currsci/jun102002/1325.pdf
Moore, O., McCarthy, O., Byrne, N., & Ward, M. (2014). Reflexive resilience and community supported agriculture: The case that emerged from a place. Journal of Agriculture, Food Systems, and Community Development, 4(3), 137-153. http://dx.doi.org/10.5304/jafscd.2014.043.007
Paulson, J., (2010, July). Sustainability is a wicked problem. St. Paul: University of Minnesota Dairy Extension. Retrieved from http://www.extension.umn.edu/agriculture/dairy/farm-life/sustainability-is-a-wicked-problem/
Raskin, P. (2014). A great transition? Where we stand. Keynote address at the biennial conference of the International Society for Ecological Economics, Reykjavik, Iceland. Retrieved from http://www.greattransition.org/publication/a-great-transition-where-we-stand
Rittel, H. W., & Webber, M. M. (1973). Dilemmas in a general theory of planning. Policy Sciences, 4(2), 155–169. http://dx.doi.org/10.1007/BF01405730
Rockefeller Foundation, The. (2014). City resilience framework. New York: The Rockefeller Foundation. Retrieved from https://www.rockefellerfoundation.org/report/city-resilience-framework/
Scoones, I. (1998). Sustainable rural livelihoods: A framework for analysis (Institute for Development Studies [IDS] Working Paper 72). Brighton, UK: IDS. Retrieved from https://energypedia.info/images/a/a5/Scoones_1998_Sustainable_Rural_Livelihoods.pdf
Stokols, D., Lejano, R. P., & Hipp, J. (2013). Enhancing the resilience of human-environment systems: A social ecological perspective. Ecology and Society, 18(1), 7. Retrieved from http://www.ecologyandsociety.org/vol18/iss1/art7/
Stockholm Resilience Center. (2015). Applying resilience thinking. Seven principles for building resilience in social-ecological systems. Stockholm: University of Stockholm. Retrieved from http://www.stockholmresilience.org/download/18.10119fc11455d3c557d6928/1459560241272/SRC+Applying+Resilience+final.pdf
Strolling of the Heifers. (2016). 2016 Locavore Index: Which states are most committed to locally-sourced food? Brattleboro, Vermont: Author. Retrieved from http://www.strollingoftheheifers.com/locavoreindex/
Sustainable Agriculture Initiative Platform. (2016). Who we are. Brussels: SAI Platform. Retrieved from http://www.saiplatform.org/about-us/who-we-are
Tsai, C-Y., Wilson, P., & Rahman, T. (2015). Economic resilience and vulnerability in the rural west (Departmental Working Paper 2015-01). Tucson, Arizona: Department of Agricultural and Resource Economics, University of Arizona. Retrieved from http://ageconsearch.umn.edu/bitstream/202969/2/Economic%20Resilience%20and%20Vulnerability.pdf
Toman, M. A., Lile, R., & King, D. (1998). Assessing sustainability: Some conceptual and empirical challenges. Washington, D.C.: Resources for the Future. Retrieved from http://ageconsearch.umn.edu/handle/10756
Total Materia. (2001). Resilience. Zurich, Switzerland: Total Materia. Retrieved from http://www.totalmateria.com/page.aspx?ID=CheckArticle&site=kts&NM=41
U.S. Climate Change Science Program [U.S. CCSP]. (2008). Our changing planet: The U.S. climate change science program for fiscal year 2009. Washington, D.C.: Author. Retrieved from http://www.globalchange.gov/browse/reports/our-changing-planet-us-climate-change-science-program-fiscal-year-2009
U.S. Department of Agriculture farm bill. (1990). Food, Agriculture, Conservation, and Trade Act 101-624, 16 U.S. C. § 1603. Definitions. Washington, D.C.: Government Printing Office. Retrieved from http://Sarasota.ifas.ufl.edu/AG/SusAgFAO.pdf
U.S. Department of Agriculture. (2001). Food and agricultural policy: Taking stock for the new century (pp. 16-35) [Technical report]. Washington, D.C.: USDA. Retrieved from https://catalog.hathitrust.org/Record/003573898
Van Meensel, J., Lauwers, L., Kempen, I., Dessein, J., & Van Huylenbroeck, G. (2012). Effect of a participatory approach on the successful development of agricultural decision support systems: The case Pigs2win. Decision Support Systems, 54(1), 164–172. http://dx.doi.org/10.1016/j.dss.2012.05.002
Van Passel, S., & Meul, M. (2012). Multilevel and multi-user sustainability assessment of farming systems. Environmental Impact Assessment Review, 32(1), 170–180. http://dx.doi.org/10.1016/j.eiar.2011.08.005
Vermeulen S. J., Campbell, B. M., & Ingram, J. S. I. (2012). Climate change and food systems. Annual Review of Environment and Resources. 37(1), 195-222. http://dx.doi.org/10.1146/annurev-environ-020411-130608
Walker, B., & Salt, D. (2006). Resilience thinking: Sustaining ecosystems and people in a changing world. Washington, D.C.: Island Press.
Weber, C. L., & Matthews, H. S. (2008). Food-miles and the relative climate impacts of food choices in the United States. Environmental Science & Technology, 42(10), 3508-3513. http://dx.doi.org/10.1021/es702969f
Wenninger, D. (2013). Sustainable agriculture and local sourcing at Walmart. Arlington, Virginia: Agricultural Outlook Forum. Retrieved from https://www.usda.gov/oce/forum/presentations/Wenninger.pdf
Wezel, A., Bellon, S., Dore, T., Francis, C., Vallod, D., & David, C. (2009). Agroecology as a science, a movement and a practice. A review. Agronomy for Sustainable Development, 29(4), 503-515. http://dx.doi.org/10.1051/agro/2009004
World Bank. (2014). A wicked problem: Controlling global climate change. Washington, D.C.: The World Bank. Retrieved from http://www.worldbank.org/en/news/feature/2014/09/30/a-wicked-problem-controlling-global-climate-change
World Commission on Environment and Development. (1987). Report of the world commission on environment and development: Our common future. New York: United Nations. Retrieved from http://www.un-documents.net/our-common-future.pdf
Worstell, J. V. (1995). Southern futures: Opportunities for sustainable agricultural systems (State of the South Report). Retrieved from http://mysare.sare.org/media/pdf/4/8/3/483Southern%20Futures.pdf
Worstell, J. V. (2016). Sources of resilience. Fox, Arkansas: The Resilience Project. Retrieved from https://meadowcreekvalley.wordpress.com/projects/
Worstell, J. V., & Grand, K. (2016). Sustainability, resilience and quality of life. Fox, Arkansas: The Resilience Project. Retrieved from https://meadowcreekvalley.files.wordpress.com/2015/05/srs-chapter-13-quality-of-life.pdf
Worstell, J. V., & Johnson, L. (2015). Relating sustainability, resilience, permaculture, agroecology, organic agriculture, and vulnerability. Fox, Arkansas: The Resilience Project. Retrieved from https://meadowcreekvalley.files.wordpress.com/2015/05/srs-chapter-11-permaculture-sus-vulnera-org.pdf
Worstell, J. V., & Johnson, L. (2016). Working with nature: Towards ecological integration. Fox, Arkansas: The Resilience Project. Retrieved from https://meadowcreekvalley.files.wordpress.com/2015/05/srs-chapter-4-ei.pdf
Yin, R. K. (2014). Case study research: Design and methods. Los Angeles: Sage.
[1] RCDG=Rural Cooperative Development Grant program, VAPG=Value-Added Producer Grant program, FMPP=Farmers Market Promotion Program, LFPP=Local Food Promotion Program, F2S=Farm to School, NRCS=Natural Resource Conservation Service, BFRDP=Beginning Farmer/Rancher Development Program, MIG=Management Intensive Grazing,
Results and discussion for Objective 2: Elaborate and refine a resilience index based on county level secondary databases and a survey of stakeholders.
Background for Objective 2
This study focuses on efforts to construct a composite measure of agrifood system sustainability/resilience in the form of a county-level index. Rooted in ecological resilience literature and building on a series of previously conducted qualitative case studies described above under Objective 1, the specific emphasis here is on utilizing publicly available secondary data to derive indicators to inform development planning and evaluation processes. Piloted with data from the thirteen state southern region as designated by the US Department of Agriculture (USDA), findings suggest important state and regional differences.
Conceptual framework
The connections of sustainability and resilience, to broader health and wellbeing have been gaining attention (see following chapters). Defining sustainability, however, is widely seen as a wicked problem (see previous chapter). Some see sustainability and resilience as distinct, even competing, concepts (see previous chapter). As discussed in the previous chapter, the researchers are persuaded by other researchers who see resilience as an alternative perspective on sustainability which stresses an observable biological phenomenon. Scholars and practitioners have constructed multiple theoretical frameworks and models to inform work on ecological resilience (Cabell & Oelofse, 2012; Carpenter et al., 2012; Folke et al., 2010; Frankenberger, 2013; Rockefeller Foundation (2014);Walker & Salt, 2006). Resilience has been applied in fields as diverse as ecology, disaster mitigation, community and economic development, and social-psychological resources.
The concept of ecological resilience emerged from problems confronted in attempts to obtain sustained yields in managed systems, along with observation of adaptive cycles that maintain natural ecosystems’ relationships and functions (Holling, 1973). As articulated by Holling and strongly emphasized by (citation withheld for review), ecological resilience has an observable biological and physical reality: how much disturbance a system can withstand. Resilient systems last (through adaptation), while non-resilient systems do not. This conceptualization is widely used, increasingly among climate change analysts (e.g. US Climate Change Science Program, 2008). Numerous studies focus on developing frameworks and theories of resilience and attempt to measure and analyze resilient agricultural systems (Lengnick, 2015). In addition, resilience thinking has been applied to social, economic, and community development research (e.g. Han & Goetz, 2015; Maclean, Cuthill, & Ross, 2014; Matarrita-Cascante, Trejos, Qin, Joo, & Debner, 2017), and collectively, these insights help to connect varying concepts of resilience to various spatial units of analysis.
Insights from case studies of long lasting local food systems in areas of the Southern US with few local food systems enabled us to integrate the six above-cited frameworks describing resilient systems into eight qualities which appear necessarily for resilient systems. Foremost among these is the quality of self-organization.
Although numerous features of agrifood systems are important, self-organization in agrifood systems is manifested in those dimensions that are locally modifiable through collective action. As noted by others (Wilson, 2012; Matarrita-Cascante et al., 2017), it is important to direct attention to people’s willingness to take responsibility and control of their development via responsive strategies. Scholars have pointed out that local agrifood food systems represent the convergence of community and economic development initiatives (Christensen & Phillips, 2016). So-called “alternative” and “local” agrifood systems can build bridges between traditional agriculture and more effective natural resource management (Milestad, Westberg, Gerber, & Bjorklund, 2010). Of particular interest is the proposed ability of localized systems to adapt to sudden and external forces. Such forces might result from short-term shocks or long-term stressors ranging from droughts, floods, and climate change to natural disasters and economic downturns. Locally self-organized response to many such disasters has been shown to be characteristic of resilient communities (ref). rough engaging local people, kindling relationships, and enhancing participation, people working to organize agrifood systems in their communities can help to promote inclusiveness, resource mobilization, and knowledge sharing, thereby contributing to broader community development processes. Local agrifood system entities, such as farmers markets, can enhance the adaptive capacity of the systems in which they are embedded to deal with shocks and stresses by collaborative learning between producers and consumers. This adaptive potential arises partially due to close links and face-to-face interactions (Hinrichs, Gillespie, & Feenstra, 2004; Milestad et al., 2010) and the civically engaged nature of these enterprises (Lyson & Guptill, 2004).
This conceptualization of local self-organization does not preclude inclusion of inputs provided from outside the local system when economies of scale or lack of local processing or manufacturing make such non-local inputs more reliably available at a given point in time. However, the literature cited and the researchers’ case studies indicate local self-organization of provision of any such inputs is crucial to resilience.
Based on a review of published ecological and agricultural literature combined with nine field-based case studies conducted across the southern United States (see previous chapter), the research team for this study sought to elaborate and augment existing theory to conceptualize, operationalize, and measure local agrifood system sustainability/resilience. Eight qualities (i.e. dimensions) of sustainable and resilient local agrifood systems were identified as common to all nine case studies and consistent with the themes identified by some of the most prominent resilience frameworks (e.g. Cabell & Oelofse, 2012; Carpenter et al., 2012; Frankenberger, Mueller, Spangler, & Alexander, 2013). A sustainable and resilient local agrifood system is characterized by being independent yet tightly connected to other communities, markets, and government policy systems. It is also locally self-organized with production, processing, and marketing enterprises, and is able to accumulate resource reserves and physical infrastructure to withstand disturbance and have back-ups and redundant units and pathways. Additionally, such agrifood systems entail diverse and complementary enterprises, embrace a conservative approach to innovation, entail people working to achieve better ecological integration, and engage disturbances and achieve periodic transformation.
Quantitative measurement of these qualities will enable testing whether these qualities are and necessary and sufficient predictors of resilience and, if so, providing a tool to help communities increase their resilience.
Operationalizing the concepts
Beyond representing qualities of the system that local people can influence through their actions, in choosing local sustainability/resilience indicators, the research team also directed attention towards those dimensions that could be measured at the county-level. This is important for conceptual development and clarity, because any effort to operationalize resilience including broader/higher scale resources, such as programs operated through government agencies and non-governmental organizations, runs the risk of measuring resilience at that larger scale. Although important for broader regional development, these approaches result in measures that can only address the resilience at the higher unit of analysis. Instead, this project sought to identify and measure those qualities that could be self-organized through local initiative in local spaces.
Though bonding, bridging and linking social capital are subsumed as part of the connectivity quality of resilient systems (reference withheld for review), intentional effort was made not to include more general measures of social capital (Rupasingha, Goetz, & Freshwater, 2006), social resilience, socioeconomic position, or health and wellbeing, such as the Social Science Research Council’s (n.d.) Measure of America operationalization of the Human Development Index for application to the US and the University of Wisconsin/Robert Wood Johnsons Foundation’s County Health Rankings (Remington, Catlin, & Gennuso, 2015). This was not because they are unimportant for understanding resilience, but rather because of the need for conceptual distinction. Scholars, practitioners, and policymakers should be interested in whether there are relations between local agrifood system sustainability/resilience and other socioeconomic, health, and wellbeing indicators. Mixing social, health, and wellbeing measures within this index would prevent exploration of the associations between them and local agrifood system sustainability/resilience in the future.
Indicators were chosen from publicly accessible databases to reflect the qualities of sustainability and resilience identified through the previously mentioned nine case studies of local agrifood systems in the southern US. Although researchers were not able to identify county-level comparable data for all dimensions of sustainable/resilient local agrifood systems, they constructed indicators for five of the dimensions that could be combined to a composite Local Agrifood System Sustainability/Resilience Index (SRI). They did this drawing primarily from the 2012 and 2007 National Census of Agriculture, with additional data from the USDA’s 2013 Food Atlas, 2013 Farm to School Census, and state-level regulatory records assembled by the research team during 2014 (Table 1). (Future iterations of the SRI will make use of updated data as appropriate.) In choosing variables, they privileged data available for most counties in each of the states. Each indicator is discussed below.
Table 1. Local Agrifood System Sustainability/Resilience Index (SRI) indicators and data sources.
|
Dimension |
Indicators |
|
Connectivity |
Farms with internet % farm operations with Internet access (Source: 2012 Census of Agriculture) |
|
Local self-organization |
Farmer lives on farm % principal operators living on farm Farms with local food alternatives scale (alpha = .739) % operations with on-farm packing % operations with direct marketing to retail % operations with community supported agriculture Community local food alternatives index Cumulative score on having meat processing facilities, farmers markets, and farm to school programs (Sources: 2012 Census of Agriculture; 2013 Food Environment Atlas; 2013 Farm to School Census; 2014 online research of state regulations and listings) |
|
Maintenance |
Average age of farm operator Each county as a % of the highest average age in the region (68.7) Reverse coded for lower average ages to have higher scores on final indicator Stability-change % change in number of farm operations between 2007 and 2012 (Sources: 2007 and 2012 Census of Agriculture) |
|
Ecological integrity |
Low chemical input scale (alpha = .759) % agricultural land not treated with herbicides % agricultural land not treated with insecticides (Note: Acres of “crop land” in the denominator. Numerator for insecticides excludes treatment for nematodes.) Organic farms % operations certified organic Management intensive livestock % operations practicing management intensive/rotational grazing (Source: 2012 Census of Agriculture) |
|
Diversity |
Production diversity index Row crop diversity Average % of operations producing across seven different row crop options (Note: Does not indicate these crops were grown on the same farms.) Vegetable production % operations with vegetables harvested Livestock production % operations with livestock sales (Source: 2012 Census of Agriculture) |
|
Local Agrifood System Sustainability/Resilience Index |
All indicators listed above were standardized and then coded into a summative index. |
Locally self-organized
Data on three variables were used to calculate scores for the concept of a system’s level of being locally self-organized. Local farm management was measured by one variable: percent of principal operators living on their farm. This is assumed to reflect degree of locally self-organized management in contrast to absentee ownership. The indicator to measure prevalence of farm operations with local food alternatives was composed of three variables (alpha = .739): percent of operations with on-farm packing, percent of operations with direct marketing to retail, and percent of operations with community supported agriculture. Locally organized community food alternatives consisted of a cumulative score of individual binary variables representing whether farmers markets, and farm to school programs were present in the county and whether meat processing facilities were present in adjoining counties.
Responsive redundancy
This quality was measured with two indicators. The first variable was average age of farm operator. First, each county was given a score of the percent of the highest average farm operator age in the region (68.7). These scores were then reverse coded for lower average ages to result in higher scores on the final indicator based on the assumption that younger farmers provide the potential for greater redundancy of farm operators over time. The second variable was the percent decrease or increase in the number of farm operations between 2007 and 2012. Scores were reverse coded such that counties with lower percent decreases (and increases) had higher scores.
Complementary diversity
No county level data were available to reflect the complementarity of diversity, so scores for this quality reflect only production diversity. Diversity at the county level was derived from three indicators: row crop diversity (average percent of operations producing across seven different row crop options), vegetable production (percent of operations with vegetables harvested), and livestock production (percent of operations with livestock sales).
Ecological integration
Researchers used data from four variables to calculate ecological integration scores. The low chemical input index (alpha = .759) was created from two variables: percent of agricultural land not treated with herbicides, and percent of agricultural land not treated with insecticides. Acres of crop land were used as the denominator in these calculations. The numerator for insecticides excludes treatment for nematodes. The two other variables included for the ecological integration quality were organic practices (percent of operations certified organic) and the ecologically integrated practice of management intensive/rotational grazing (percent of operations practicing management intensive/rotational grazing).
Modular connectivity
Only one indicator was available in county level databases that addressed connectivity. This was the percent of operations with internet access.
During the conduct of this study, we did not obtain access to useful indicators at the county level of the other three of the eight qualities of resilience: accumulation of reserves and infrastructure, conservative innovation and transformation.
Analysis and computation of the Local Agrifood System Sustainability/Resilience Index (SRI)
Counties/county equivalents were the units of analysis, focusing in this project on the 13 state Southern Region as designated by the USDA: Alabama, Arkansas, Florida, Georgia, Kentucky, Louisiana, Mississippi, North Carolina, Oklahoma, South Carolina, Tennessee, Texas, and Virginia. Starting with a total of 1,344 counties, 43 were treated as missing due to insufficient data on some key variables, especially number of farm operations in either 2007 or 2012. All other missing values in the index were counted as 0 on the basis that the practices under consideration were not prevalent enough to avoid data suppression. Final analysis was based on 1301 cases (counties).
All percentages were transformed to z-scores for the purpose of normalization. Summated multi-variable scales (farms with local food alternatives and low chemical input) and indices (community food alternatives and production diversity) were calculated by summing z-scores across component variables. Z-scores were then ranked (higher scores have higher ranks) by county across the entire region and categorized by quartile groupings. Because of low organic certification rates, this variable was only ranked in two categories.
The research team also created a composite “Local Agrifood System Sustainability/Resilience Index” (SRI), summing and standardizing the standardized scores across all of the separate indicators. Since the indicators were standardized and ranks were calculated across the region (rather than within each state separately), findings show the position of each county within the entire southern region. (Future analysis will feature both state and regional rankings for each county.)
Findings
It is critically important for readers to note that the SRI was not constructed as a “scale” where multiple indicators would be expected to be highly inter-correlated, each one measuring relatively the same concept and thereby serving as indicators of some broader latent construct with internal reliability. Instead, this “composite index” combined a range of indicators that were: a) not expected to be highly inter-correlated, and b) better thought of as causes of or contributors to our latent construct, that is “Local Agrifood System Sustainability/Resilience.” The methodological approach used to construct this composite index was somewhat similar to the approach used for the County Health Rankings System (Remington et al, 2015), with the exception of the SRI being based on regional versus statewide rankings.
Following initial construction of the SRI, tables and maps were prepared and shared at 14 meetings across local, regional, national, and international settings with participants who included farmers, extension professionals, policy advocates, and researchers. Besides outreach and dissemination of preliminary findings, a major purpose of those presentations and discussions was to address the validity of the index. In three meetings held in the southern region, attendees helped to “workshop” the SRI and provided feedback on the relevance of the measures for informing local initiatives. After each presentation, the SRI was re-evaluated and sometimes modified to arrive at the version presented in this article.
There is considerable debate concerning whether individual items included in composite indices should be weighted equally or assigned weights based on theoretical and/or statistical analysis (Organization for Economic Co-operation and Development, 2008). Equal weighting was used for the analysis presented here, because it is likely more intuitive for general users and is theoretically parsimonious (Stapleton & Garrod, 2007). However, it is critically important to note that the number of indicators from each dimension or quality included in computation of the composite index essentially provide de facto weights. For instance, the resilience quality of a system having locally self-organized features includes three indicators, as does the quality ecological integration. However, the quality modular connectivity only has one indicator. Since the overall composite SRI was computed through summation of all indicators across the qualities, local self-organization and ecological integration are more heavily represented than connectivity.
Recognizing that some analysts criticize equal weights in composite indices, and following the recommendation of the OECD (2008) to assess the impact of different weighting schemes, the research team also used principal component factor analysis (PCA) to determine if alternative weighting procedures would have led to notably different results. Four factors were extracted explaining 60% of variation. The loading scores on the first principle component were used as an alternative form of the SRI (results not shown here). To test the potential difference between the use of equal weights and the PCA method, the correlation between the two versions of SRI was calculated, Pearson’s r=.907 and Spearman’s rho=.898. Additionally, the alternative SRI was used to test for state level patterns, and the findings were similar to what are shown in this article using the equal weighting version of SRI.
The descriptive findings presented here identify patterns within and between states on the individual indicators and the overall SRI. State-level patterns were identified for these indicators (Table 2), and regional concentrations (within and across state lines) were observed (Map 1).
Table 2. Southern US state comparisons on the Local Agrifood System Sustainability/Resilience Index (SRI).
|
State |
Connectivity |
Local self-organization |
Maintenance |
Ecological integration |
Diversity |
Full Index |
Weighted Full Index |
|||||
|
Farms w/ internet access |
Farmer lives on farm |
Farms w/ local food alternatives |
Community local food alternatives |
Age redundancy |
Stability/ positive change in # of farms |
Low chemical input |
Organic farms |
Management intensive livestock |
Production diversity |
|||
|
Percent of counties in state within the highest quartile for the southern region |
||||||||||||
|
Alabama (67) |
9.0 |
16.4 |
10.4 |
29.9 |
13.4 |
9.0 |
13.4 |
11.9 |
4.5 |
19.4 |
3.0 |
9.0 |
|
Arkansas (75) |
16.0 |
49.3 |
2.7 |
13.3 |
48.0 |
17.3 |
13.3 |
16.0 |
29.3 |
22.7 |
17.3 |
30.7 |
|
Florida (67) |
46.3 |
23.9 |
47.8 |
31.3 |
14.9 |
46.3 |
11.9 |
55.2 |
11.9 |
6.0 |
34.3 |
13.4 |
|
Georgia (48) |
40.3 |
30.2 |
25.8 |
17.6 |
17.6 |
16.4 |
14.5 |
21.4 |
14.5 |
25.8 |
16.4 |
17.6 |
|
Kentucky (120) |
15.8 |
30.8 |
30.0 |
12.5 |
58.3 |
9.2 |
60.0 |
25.0 |
41.7 |
44.2 |
50.0 |
49.2 |
|
Louisiana (62) |
29.0 |
19.4 |
29.0 |
8.1 |
37.1 |
33.9 |
16.1 |
9.7 |
19.4 |
12.9 |
16.1 |
14.5 |
|
Mississippi (82) |
7.3 |
17.1 |
8.5 |
9.8 |
9.8 |
14.6 |
14.6 |
6.1 |
6.1 |
13.4 |
3.7 |
7.3 |
|
North Carolina (100) |
40.0 |
24.0 |
75.0 |
46.0 |
26.0 |
31.0 |
11.0 |
53.0 |
24.0 |
83.0 |
56.0 |
47.0 |
|
Oklahoma (77) |
18.2 |
39.0 |
2.6 |
23.4 |
37.7 |
7.8 |
6.5 |
20.8 |
7.8 |
0.0 |
13.0 |
22.1 |
|
South Carolina (46) |
15.2 |
21.7 |
19.6 |
47.8 |
10.9 |
52.2 |
15.2 |
39.1 |
10.9 |
26.1 |
32.6 |
32.6 |
|
Tennessee (95) |
7.4 |
37.9 |
17.9 |
14.7 |
23.2 |
8.4 |
55.8 |
20.0 |
37.9 |
21.1 |
21.1 |
31.6 |
|
Texas (254) |
23.2 |
5.5 |
5.5 |
13.8 |
12.2 |
40.2 |
22.8 |
20.5 |
30.3 |
5.1 |
8.3 |
6.3 |
|
Virginia (97) |
43.4 |
37.1 |
66.3 |
37.1 |
22.7 |
35.1 |
48.5 |
36.1 |
55.7 |
51.5 |
68.0 |
61.9 |
Map 1. Unweighted Composite Local Agrifood System Sustainability/Resilience Index (SRI) in the Southern US (quartile ranks).
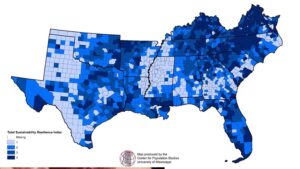
Based on summated and standardized scores across 10 indicators. A higher quartile ranking indicates a higher level of sustainability/resilience on this composite index. Data sources: 2012 Census of Agriculture, 2013 Food Environment Atlas, 2013 Farm to School Census, and 2014 review of state policies and regulations; extra calculations by the authors and research team. Analysis based on 1301 counties
Analyzing the percent of counties within each state scoring within the top quartile when ranked to the region, interesting patterns emerged. While some variation was identified between states concerning whether their counties ranked high on the various qualities, there were major distinguishing patterns between states concerning total composite SRI. Kentucky, North Carolina, and Virginia each had more than 50% of their counties (excluding missing cases) in the highest quartile for the region, thereby representing the greatest levels of local agrifood system sustainability/resilience in the southern region. The map helps to visualize these state-level differences, but it also demonstrates that there are regional clusters that cross state lines. More densely populated and urbanized areas have higher SRI scores, and both west Texas and the multi-state Mississippi Delta region have some of the lowest. State comparisons indicate that the Appalachian region has higher scores than might be expected given previously documented socioeconomic conditions. Although not explored here, these patterns might result from a combination of different agronomic conditions, development legacies in agricultural production, and local political-economic systems, all warranting more research. Determining the reasons for these patterns may prove particularly useful for development practitioners and policymakers.
Discussion
Identifying patterns of local agrifood system resilience in the southern US may be useful for informing extension, program development, policy innovations, and investment decisions to address sustainability, food security, and health. For instance, the SRI helps to identify specific counties and regions that are doing relatively well in the search for greater resilience, and they can be studied to learn about effective strategies at the local and statewide levels. Those places that are not doing as well might be the focus of additional efforts to spur more local initiatives to create agrifood systems with greater agility and adaptability. This first attempt to operationalize resilience at the county level in the U.S. should not be regarded as definitive in regions such as the High Plains, the Delta and Appalachia, as noted above. More research is needed and ongoing to ground-truth and refine the index. Particularly useful will be studies relating the index to performance of local agrifood systems—such as claims for crop insurance and surival of farms.
The SRI is based on publicly accessible data sources that are regularly updated. Researchers used 2012 Census of Agriculture data along with other sources (Farm to School Census, Food Atlas) from near that time period for this article. At the time of this writing, the 2017 Census of Agriculture was being conducted, so data for comparison will soon be available. At that point, researchers will be able to track temporal change, a key feature of sustainability and resilience missing from the present analysis.
Piloted here for the southern US, the SRI could be measured for counties across the country, and comparable variables could be identified for other nations. As previously noted, the SRI was standardized to the region as whole for this article. This could be done for the nation as well. In either case, practitioners, development funders, and policy makers would also benefit from having access to within state rankings (as has been done for the County Health Rankings program, see: Remington et al, 2015). This is the next step for the research team.
Finally, the SRI maybe useful in analyses concerning factors associated with broader socioeconomic wellbeing and health outcomes. For instance, many studies focused on food insecurity use indicators such as the number of food retailers per capita or whether a county is considered a “food desert” because of the lack of nearby grocery stores and supermarkets (Ver Ploeg et al., 2009). Although informative, decisions about the location of these food sources are often far beyond local control (with the exception of tax and regulatory incentives/disincentives). The SRI contributes individual measures and a composite index that represents factors that can be mobilized and organized at the local level. These factors may be influenced by broader policies and access to resources such as grants from government agencies and foundations, but they are not fully dependent upon them. They are, however, dependent on some level of local action. Thus, authors of the SRI hypothesize that it will be particularly informative to the field of community development. In this vein, their current work is investigating the inter-relationships between the SRI, measures of human development, and population health.
References
Cabell, J. F., & Oelofse, M. (2012). An indicator framework for assessing agroecosystem resilience. Ecology and Society, 17(1), 18. doi: 10.5751/ES-04666-170118
Carpenter, S. R., Arrow, K. J., Barrett, S., Biggs, R., Brock, W. A., Crépin, A.-S., … & de Zeeuw, A. D. (2012). General resilience to cope with extreme events. Sustainability, 4(12), 3248-3259. doi: 10.3390/su4123248
Christensen, B., & Phillips, R. (2016). Local food systems and community economic development through the lens of theory. Community Development, 47(5), 638–651. doi: 10.1080/15575330.2016.1214609
Folke, C., Carpenter, S. R., Walker, B., Scheffer, M., Chapin, T., & Rockström, J. (2010). Resilience thinking: Integrating resilience, adaptability, and transformability. Ecology and Society, 15(4), 20. Retrieved from http://www.ecologyandsociety.org/vol15/iss4/art20/.
Frankenberger, T., Mueller, M., Spangler, T., & Alexander, S. (2013). Community resilience: Conceptual framework and measurement Feed the Future learning agenda. US Agency for International Development. Rockville, Maryland: Westat. Retrieved from https://agrilinks.org/sites/default/files/resource/files/FTF%20Learning_Agenda_Community_Resilience_Oct%202013.pdf.
Han, Y., & Goetz, S. J. (2015). The economic resilience of US counties during the Great Recession. The Review of Regional Studies, 45, 131-149. Retrieved from http://journal.srsa.org/ojs/index.php/RRS/article/view/45.2.2/pdf.
Hinrichs, C. C., Gillespie, G., & Feenstra, G. W. (2004). Social learning and innovation at retail farmers’ markets. Rural Sociology, 69(1), 31-58. doi: 10.1526/003601104322919892
Holling, C. S. (1973). Resilience and stability of ecological systems. Annual Review of Ecology and Systematics, 4(1), 1-23. doi: 10.1146/annurev.es.04.110173.000245
Lengnick, L. (2015). Resilient agriculture: Cultivating food systems for a changing climate. Gabriola Island, BC, Canada: New Society Publishers.
Lyson, T. A., & Guptill, A. (2004). Commodity agriculture, civic agriculture, and the future of US farming. Rural Sociology, 69(3), 370-385. doi: 10.1526/0036011041730464
Maclean, K., Cuthill, M., & Ross, H. (2014). Six attributes of social resilience. Journal of Environmental Planning and Management, 57(1), 144-156. doi: 10.1080/09640568.2013.763774
Matarrita-Cascante, D., Trejos, B., Qin, H., Joo, D., & Debner, S. (2017). Conceptualizing community resilience: Revisiting conceptual distinctions. Community Development, 48(1), 105–123. doi: 10.1080/15575330.2016.1248458
Milestad, R., Westberg, L., Geber, U., & Björklund, J. (2010). Enhancing adaptive capacity in food systems: Learning at farmers' markets in Sweden. Ecology and Society, 15(3), 29. Retrieved from http://www.ecologyandsociety.org/vol15/iss3/art29/.
Organization for Economic Co-operation and Development. (2008). Handbook on constructing composite indicators: Methodology and user guide. Paris, France: Author. Retrieved from: www.oecd.org/publishing/corrigenda.
Remington, P. L., Catlin, B. B., & Gennuso, K. P. (2015). The County Health Rankings: Rationale and methods. Population Health Metrics, 13(11). doi: 10.1186/s12963-015-0044-2
Rupasingha, A., Goetz, S. J., & Freshwater, D. (2006). The production of social capital in US counties. The Journal of Socio-Economics, 35(1), 83–101. 10.1016/j.socec.2005.11.001
Social Science Research Council (n.d.). Measure of America. Accessed 5/7/2017 at http://www.measureofamerica.org.
Stapleton, L. M., & Garrod, G. D. (2007). Keeping things simple: Why the Human Development Index should not diverge from its equal weights assumption. Social Indicators Research, 84(2), 179–188. doi: 10.1007/s11205-006-9081-3
US Climate Change Science Program [US CCSP]. (2008). Our changing planet: The US climate change science program for fiscal year 2009. Washington, DC: Author. Retrieved from http://www.globalchange.gov/browse/reports/our-changing-planet-us-climate-change-science-program-fiscal-year-2009.
Ver Ploeg, M., Breneman, V., Farrigan, T., Hamrick, K., Hopkins, D., Kaufman, P., Lin, B. H., Nord, M., Smith, T. A., Williams, R., Kinnison, K., Olander, C., Singh, A., & Tuckermanty, E. (2009). Access to affordable and nutritious food-measuring and understanding food deserts and their consequences: Report to Congress. Washington, DC: US Department of Agriculture Economic Research Service. Retrieved from https://www.ers.usda.gov/publications/pub-details/?pubid=42729.
Walker, B., & Salt, D. (2006). Resilience thinking: Sustaining ecosystems and people in a changing world. Washington, DC: Island Press.
Wilson, G.A. (2012). Community resilience, globalization, and transitional pathways of decision-making. Geoforum, 43, 1218–1231. doi:10.1016/j.geoforum.2012.03.008
Results and discussion for Objective 3: Determine the relationship between the resilience index and poverty, health and population indicators in regions which rank high on the resilience index and low on quality of life indicators.
Background to Objective 3
Movements and scholarship focused on local agrifood system development abound, especially case studies of place specific projects and programs. Less abundant are comparative studies and those using standardized indicators for statistical analysis. A recent special issue of Community Development (Lamie & Deller, 2017) on local food system development was published to help fill this gap, and the present article seeks to continue the conversation in three important ways. First, we approach local agrifood systems using a development approach and integrating development focused theoretical approaches and frameworks (livelihoods, community capitals framework, and resilience). Second, we analyze associations between local agrifood systems and health while accounting for other development concepts and indicators. Third, we do this by employing an innovative conceptual and methodological tool to measure local agrifood system sustainability/resilience at the county level.
The concept of resilience has been developed and applied in a wide range of disciplines and fields, including but not limited to ecology, agriculture, psychology, development, and disasters. Across diverse approaches, vocabularies, and substantive applications, it is understood as a concept and framework to help us understand how systems may be able to mitigate, respond, and adapt to shocks and stresses, and it is therefore essential to the pursuit of sustainability. Some approaches to resilience take on a comprehensive focus, including numerous social and ecological domains, assets, and processes, arguing for the inherent inter-connectedness of these systems (de Olde et al., 2017; Hatanaka & Konefal, 2017). Although this may be attractive intuitively, the all-encompassing approach may preclude empirical assessment of the relationship between various domains of resilience and social goals like equality, wellbeing, and population health. This study seeks to help fill that gap by exploring the relationship between resilience in a particular domain – local agrifood systems – and other indicators of socioeconomic, food system, and health development. The findings from this type of analysis provide important insights into the potential benefits of developing more resilient and adaptive systems to broader goals of social development.
Literature review
Approaching the idea of “development” as encompassing processes and outcomes from intentional and contested efforts for socioeconomic change, our study is concerned specifically with efforts aimed at social-ecological wellbeing and health. Although much of the literature in development studies concerns grand narratives to describe and explain national, international, and global social change, more localized community and regional scholars have attempted to understand the complex structures, processes, interactions, and contingencies at the local level where people try to make their lives. The livelihoods approach (de Haan, 2016; de Haan & Zoomers, 2005) and community capitals framework (Flora, Flora, & Gasteyer, 2015; Green & Haines, 2015; Gutierrez-Montes, Emery, & Fernandez-Baca, 2009) may help to bridge understanding of differing paths of development.[1]
Drawing from international development literature (Bebbington, 1999; de Haan & Zoomers, 2005), the general livelihoods framework, along with its variants concerned with rural livelihoods and sustainable livelihoods, centers on the resources and strategies that individuals, households, and communities have access to and utilize in people’s everyday lives. Additional attention is focused on the structural inequalities that shape opportunity pathways and constraints for accessing and utilizing these resources. Development pathways are influenced by political, economic, and environmental change, all of which may result in further shocks and stresses to people’s livelihood systems. The community capitals framework (Flora et al., 2015; Gutierrez-Montes et al., 2009) expands on the livelihoods approach by moving analysis from the household level to more directly entail the community as a system and more thoroughly articulate the ways in which various forms of capital influence each other in complex ways.
There are multiple forms of resources and assets/capital that individuals, families, organizations, and communities use to make their livings and maintain or even improve quality of life. These include the natural, cultural, human, social, financial, political, and built domains. What delineates a resource from a form of capital is the ability to accumulate the resource and translate it for use in other domains (Flora et al., 2015). Ongoing investment in diverse forms of capital is considered key to sustainable “upward” community development, while protracted underinvestment in some areas can lead to a “downward” spiral to greater vulnerability (Emery & Flora, 2006).
Social capital is an important and often underappreciated factor for development, according to both livelihoods and community capitals theorists. Social capital can be broadly defined to include networks, norms, and trust, and it is a concept for helping to understand the ways in which development takes place. Social capital helps to facilitate social interaction for collective action (Nanetti & Holguin, 2016). Literature based on statistical analysis demonstrates that county-level social capital is associated with per capita income growth (Rupasingha, Goetz, & Freshwater, 2000), poverty patterns (Rupasingha & Goetz, 2007), and population health (Lee & Kim, 2013). Social capital, however, is not necessarily sufficient or always conducive to social development. Not only does social capital in the form of personal bonds, trust, and networks in a paternalistic environment often have a “dark side” (Schulman & Anderson, 1999), but some forms of social capital bring more resources than do others. Theorists have noted that both bonding and bridging social capital are important to understanding patterns of socioeconomic development (Agnitsch, Flora, & Ryan, 2006). Having local networks with personal interactions and trust are essential to solidarity and collective action, but if the groups are too tight-knit and overly homogeneous, they may contribute to in-group and out-group identities and conflict. Also problematic is that those types of networks do not add many new resources for group members. Bridging social capital connects individuals and groups to share information and other resources, thus complementing and augmenting what resources they can access.
Using a social-ecological approach, it is important to recognize that all forms and directions of development are not equal, and we need to better understand how particular arrangements contribute to greater security, sustainability, and adaptability. Scholarship in the burgeoning field of resilience may be instructive. Ecology (Holling, 1973), climate change (US Climate Change Science Program, 2008), disaster (Adger, Hughes, Folke, Carpenter, & Rockström, 2005), community and economic development (Han & Goetz, 2015; Matarrita-Cascante, Trejos, Qin, Joo, & Debner, 2017; Sherrieb, Norris, & Galea, 2010), and psychological wellbeing (Schultze-Lutter, Schimmelmann, & Schmidt, 2016) scholars have focused attention on identifying factors that help a variety of systems to prevent, mitigate, and adapt in the face of change. From an ecological perspective, Holling (1973; also see Worstell & Green, 2017) maintains that resilience has an observable reality: how much disturbance a system can withstand and still exist. Building from this basis and applying it to social-ecological systems and development, Nyamwanza emphasizes the importance of resilience in terms of adaptive capacity in the face of shocks and stressors, an important element to sustainable livelihood systems (2012).
With the passing of the United Nations Sustainable Development Goals in 2015, community resilience has transcended from being a buzzword to being at the foreground of numerous development agencies and non-governmental organizations (NGOs) and conceptualized in much of the international development literature (Adger, 2000; Béné, Fahim, Mamun, Sabbir, & Ferdous, 2012; Walker, Holling, Carpenter, & Kinzig, 2004). Understood generally, community resilience is the ability of community systems to adapt, absorb, mitigate, and recover from shocks and stressors in such a way that facilitates positive future outcomes and reduces overall vulnerability to future shocks and stressors (Adger, 2000; Norris, Stevens, Pfefferbaum, Wyche, & Pfefferbaum, 2008; USAID, 2013; Walker et al., 2004). The core of this definition relates to sustainability and the capability of socio-ecological systems and communities to adapt and transform to both fluctuations and stressors (Milman & Short, 2008; Walker et al., 2004). Adaptability refers to a community’s agency and ability to respond to such changes, and transformability is the ability to alter the system (Walker et al., 2004). Thus, community resilience appears differently at various stages of shock and stress experienced by a community.
Many development organizations have established resilience frameworks to measure several resilience livelihood outcome indicators. However, the challenge persists for these agencies and organizations to measure and affirm that the actions and programs implemented actually improve community resilience (Béné et al., 2012). As addressed by Worstell and Green (2017), numerous conceptualizations of resilience exist and are being refined, but there is a tendency in many of them to take an approach that entails a wide range of concepts and indicators on the basis that social and ecological life consist of multiple domains. Although appealing from a holistic perspective, this leads to operationalization and indicators that cover so much that they do not provide analytically distinctive findings. An alternative approach is to build domain specific concepts of resilience (e.g. natural, agrifood, social) that can then help us to explore not only the elements, structures, and processes within any one domain, but can also show places where domains are associated.
Applying resilience thinking to local agrifood systems and building from a combination of case studies and county-level statistical analysis across the southern US, previous research (Green, Worstell, & Canarios, 2017; Worstell & Green, 2017) suggests that relatively more resilient local agrifood systems have people who are connected to share information and resources, and they are independent while still being connected to communities, markets, and government initiatives. The people are self-organizers pursuing improved production, processing, and marketing enterprises themselves, yet they tend to take conservative approaches to innovation. These systems maintain back-ups, redundant units, and alternative route pathways, and they are able to accumulate resource reserves and physical infrastructure to withstand and/or adapt to disturbance, sometimes going through transformations in the process. Additionally, resilient agrifood systems entail some commitment to ecological integrity and have diverse and complementary enterprises (Worstell & Green, 2017). The labels associated with these dimensions of sustainable and resilient local food systems spell the acronym CLIMATED[2] (Worstell, 2017) connectivity, local self-organization, innovation, maintenance, accumulation, transformation, ecological integrity, and diversity.
Given its connection to social capital and socioeconomic development more broadly, the self-organization dimension of resilience warrants more attention. Self-organization is manifested in those dimensions that are locally modifiable through collective action. As noted by other resilience scholars (Matarrita-Cascante et al., 2017; Wilson, 2012), it is important to address people’s willingness to take responsibility and control of their development via active, responsive strategies. Emphasis on local self-organization does not require disregarding inputs provided from outside the local system by governments, private businesses, foundations, and/or NGOs. However, the literature clearly indicates that local self-organization, initiative, and provision of any such inputs is crucial to resilience at that particular geographic scale. The presence of locally developed practices, organizations, and institutions demonstrate collective potential to address and adequately respond to challenges and opportunities. Building general social capital is an important element for broader local self-organization of development, and this may be particularly important for achieving higher levels of resilience in specific fields, such as agrifood systems as described above. Furthermore, we might expect that efforts to build local agrifood systems would contribute to broader social capital, thus creating an upward spiral. Of course, local organization and development do not take place in a vacuum, and there are broader historical, geographic, and socioeconomic factors that may influence and be influenced by local efforts.
To conclude, literature demonstrates that local-level resilience to handle shocks and stressors – whether through prevention, mitigation, and/or adaption – is influenced via several dimensions and pathways. The focus here has been to identify those dimensions with the goal of measuring the connections between the socioeconomic position, social capital, local agrifood system sustainability/resilience, and access to commercial food sources and then to use the indicators to see how they relate to health outcomes. With population, physical development, and access to services varying spatially between rural-urban/non-metropolitan-metropolitan spaces (Bailey, Jensen, & Ransom, 2014; Lobao, Hooks, & Tickamyer, 2007; Tickamyer, Sherman, & Warlick, 2017), we would also expect the social, food system, and health system associations with health outcomes to vary as well. For the empirical portion of this study, we addressed the following hypotheses:
- There are associations between socioeconomic, social capital, and food system development variables demonstrating mutual development.
- Although socioeconomic position of a place is likely to have the most profound influence on health, measures related to self-organization in general (social capital) and in a particular domain (local agrifood systems) are expected to have notable effects.
- These relationships will vary by metropolitan status.
Findings
Table 1 shows the descriptive statistics for each variable used in the analyses presented below. It is important to note that the original number of counties, parishes, and other county equivalents was 1,340 in the southern region. However, some data were missing for counties because of data suppression (such as too few respondents to a particular survey, or not enough people engaging in a particular agricultural practice for it to be reportable). Because we utilized two different health outcome variables and one (premature age-adjusted mortality) had more missing cases than the other (self-rated health), we used listwise deletion of missing cases for all variables, resulting in a total N of 1,235 for all subsequent analyses. We also ran the models using mean replacement of missing cases (results not shown here). This did influence effect sizes and p values somewhat, but the overall patterns were similar.
Table 1. Descriptive statistics from US Southern Region counties.
|
Variables |
Mean |
Min. to max. |
Standard dev. |
|
Health outcomes |
|||
|
% adults poor or fair health (2015) |
20.10 |
9.38 to 42.40 |
4.56 |
|
Premature age-adjusted mortality per 100,000 population (2013-15) |
452.39 |
166.10 to 924.10 |
95.33 |
|
Socioeconomic position |
|||
|
% adults 25 years + w/ high school degree or higher (2008-12) |
79.61 |
44.90 to 94.60 |
6.58 |
|
Median household income (2008-12) |
41,716.74 |
20,281.00 to 122,068.00 |
11,148.76 |
|
GINI income inequality (2008-12) |
.45 |
.34 to .55 |
.03 |
|
% families below poverty (2008-12) |
14.78 |
2.40 to 38.80 |
5.62 |
|
Socioeconomic position index (composite of variables above coded for higher value=higher position, 2008-12) |
-.01 |
-3.88 to 4.24 |
.97 |
|
Social capital |
|||
|
Social capital index (2009) |
-.64 |
-3.93 to 17.44 |
.94 |
|
Local agrifood system sustainability/resilience |
|||
|
Sustainability/resilience index (2012/13) |
.05 |
-3.45 to 3.09 |
.98 |
|
Access to commercial food outlets |
|||
|
Grocery stores per 1,000 population (2012) |
.20 |
.00 to 1.27 |
.11 |
|
Supercenters per 1,000 population (2012) |
.02 |
.00 to .21 |
.02 |
|
Access to health care |
|||
|
Primary care physicians per 100,000 population (2012) |
46.43 |
.00 to 179.79 |
25.86 |
|
% adults 18 to 64 years insured (2008-2012) |
74.25 |
40.90 to 91.70 |
6.50 |
|
Metropolitan status |
|||
|
Metropolitan status (binary metro=1, 2010) |
.41 |
.00 to 1.00 |
.49 |
|
% population living in urban area (2010) |
40.27 |
.00 to 100.00 |
29.30 |
|
Total number of counties and county equivalents in focus region is 1,340. Listwise deletion of missing cases on some variables resulted in final N=1,235. |
|||
The geographic distribution of the health outcome variables is shown in maps 1 and 2. For illustrative purposes, the variables were recoded into categories based on quintiles. The latter regression analyses, however, were based on the continuous versions of the variables.
Map 1. Percent of adults with fair or poor self-rated health in Southern US counties (2015).
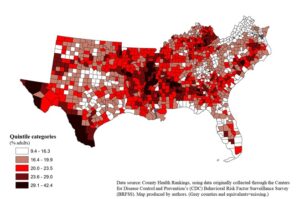
Map 2. Premature age-adjusted mortality in Southern US counties (2013-2015)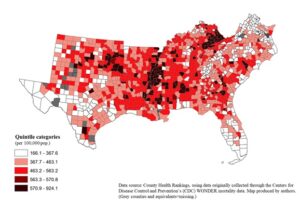 .
.
Table 2 shows the Pearson’s r correlation coefficients between all of the variable combinations. To a large extent, the findings demonstrate what development theories suggest. There is a negative relationship between most indicators of development (socioeconomic, social capital, agrifood system, and healthcare system) and health outcome indicators. Furthermore, the position of a county in terms of non-metropolitan or metropolitan status is related to the health outcomes such that metropolitan counties and those with a higher percentage of people living in urban areas have lower levels of poor health outcomes. Two exceptions to the assumptions concern measures of grocery stores and supercenters. The number of grocery stores per 1,000 population was positively correlated with poor health outcomes, and the number of supercenters per 1,000 population was negative correlated with percent of adults reporting poor or fair health and positively correlated with the premature age-adjusted mortality. However, the coefficient effect sizes for supercenters were very low and not statistically significant.
Table 2. Pearson’s r correlation matrix for variables in Southern US counties.
|
Variables |
% poor or fair health |
Premature age-adj. mortality |
Socioecon. position index |
Social capital index |
Sust./ resilience index |
Grocery stores |
Super centers |
Primary care physicians |
% insured |
Metro. status |
% pop. urban |
|
% poor or fair health |
-- -- -- |
|
|
|
|
|
|
|
|
|
|
|
Premature age-adj. mortality |
.564 (<.001) |
-- -- -- |
|
|
|
|
|
|
|
|
|
|
Socioecon. position index |
-.824 (<.001) |
-.627 (<.001) |
-- -- -- |
|
|
|
|
|
|
|
|
|
Social capital index |
-.180 (<.001) |
-.110 (<.001) |
.149 (<.001) |
-- -- -- |
|
|
|
|
|
|
|
|
Sust./ resilience index |
-.465 (<.001) |
-.290 (<.001) |
.419 (<.001) |
-.107 (<.001) |
-- -- -- |
|
|
|
|
|
|
|
Grocery stores |
.186 (<.001) |
.201 (<.001) |
-.231 (<.001) |
.220 (<.001) |
-.254 (<.001) |
-- -- -- |
|
|
|
|
|
|
Super centers |
-.020 (.479) |
.036 (.210) |
.052 (.069) |
-.058 (.042) |
.121 (<.001) |
-.152 (<.001) |
-- -- -- |
|
|
|
|
|
Primary care physicians |
-.214 (<.001) |
-.235 (<.001) |
.201 (<.001) |
.146 (<.001) |
.199 (<.001) |
-.015 (.604) |
.177 (<.001) |
-- -- -- |
|
|
|
|
% insured |
-.492 (<.001) |
-.227 (<.001) |
.542 (<.001) |
.131 (<.001) |
.422 (<.001) |
-.162 (<.001) |
.065 (.027) |
.198 (<.001) |
-- -- -- |
|
|
|
Metro. status |
-.415 (<.001) |
-.400 (<.001) |
.497 (<.001) |
-.086 (.002) |
.310 (<.001) |
-.245 (<.001) |
-.035 (.216) |
.158 (<.001) |
.345 (<.001) |
-- -- -- |
|
|
% pop. urban |
-.146 (<.001) |
-.355 (<.001) |
.280 (<.001) |
-.144 (<.001) |
.049 (.082) |
-.232 (<.001) |
.196 (<.001) |
.463 (<.001) |
.058 (.042) |
.395 (<.001) |
-- -- -- |
|
Listwise deletion of missing cases. Total N=1,235 counties and county equivalents. |
|||||||||||
Concerning the correlations between the various measures of socioeconomic, social capital, agrifood, and healthcare system development, these patterns also matched what development theory would suggest. Given that these indicators were coded such that higher scores represented access to more resources and services, there was a positive correlation among most indicators. With the exception of a few correlations with the socioeconomic position index, the effect sizes between indicators were low to moderate in strength. Differences with the general pattern were found between a few variables. The social capital index and local agrifood sustainability/resilience index were negatively correlated, although the effect size was weak. Further decomposition of the social capital index showed that the negative correlation was between the number of associations per capita and SRI, whereas all of the other components to social capital were positively correlated with local agrifood sustainability/resilience. The other unexpected correlations were the negative correlation between the socioeconomic position index and grocery stores per 1,000 population and the negative correlation between local agrifood sustainability/resilience and grocery stores per 1,000 population. There were both negative and positive correlations between the development indicators and metro status/percent of the population living in urban areas.
Tables 3 (self-rated health) and 4 (premature age-adjusted mortality) display results from the ordinary least squares (OLS) linear regression. As previously mentioned, the models were structured to show lagged effects with independent variables measured roughly at time 1 and the health outcome variables measured at time 2. Each table shows the results from two variations of the respective model, one with metropolitan status as a binary variable (1=metropolitan county and 0=non-metropolitan county) and the other with a continuous variable measuring percent of the population living in an urban area.
Table 3. OLS lagged effects regression findings for percent of adults reporting poor or fair health in Southern US counties.
|
Variables |
Dependent=% poor or fair health (2015) |
Dependent=% poor or fair health (2015) |
||||
|
|
Unstandardized [95% CI] |
Beta |
p value |
Unstandardized [95% CI] |
Beta |
p value |
|
Constant |
20.617 [18.075, 22.798] |
|
<.001 |
19.651 [17.263, 21.833] |
|
<.001 |
|
Socioeconomic position index (2008-12) |
-3.457 [-3.665, -3.214] |
-.737 |
<.001 |
-3.069 [-3.807, -3.387] |
-.770 |
<.001 |
|
Social capital index (2009) |
-.379 [-.670, -.232] |
-.079 |
<.001 |
-.270 [-.502, -.135] |
-.056 |
.001 |
|
Sustainability/resilience index (2012/13) |
-.746 [-.937, -.581] |
-.160 |
<.001 |
-.649 [-.840, -.477] |
-.139 |
<.001 |
|
Grocery stores per 1,000 population (2012) |
-.142 [-1.568, 1.597] |
-.003 |
.837 |
.490 [-1.000, 2.193] |
.012 |
.475 |
|
Supercenters per 1,000 population (2012) |
8.602 [1.651, 15.109] |
.038 |
.019 |
6.459 [-.618, 14.019] |
.028 |
.074 |
|
Primary care physicians per 100,000 population (2012) |
-.005 [-.010, .001] |
-.027 |
.101 |
-.013 [-.019, -.007] |
-.075 |
<.001 |
|
% adults 18 to 64 years insured (2008-12) |
-.009 [-.040, .023] |
-.013 |
.499 |
.001 [-.028, .031] |
.001 |
.968 |
|
Metropolitan status (binary metro=1, 2010) |
.032 [-.324, .329] |
.003 |
.853 |
|
|
|
|
% population in urban area (2010) |
|
|
|
.016 [.009, .022] |
.101 |
<.001 |
|
Adjust R2 F-test p value for model |
.704 <.001 |
.710 <.001 |
||||
|
N=1,235 counties and county equivalents. Confidence intervals based on bootstrapping method using 1,000 sub-samples. |
||||||
Table 4. OLS lagged effects regression findings for premature age-adjusted mortality rates per 100,000 population in Southern US counties.
|
Variables |
Dependent=Premature age-adjusted mortality (2013-15) |
Dependent=Premature age-adjusted mortality (2013-15) |
||||
|
|
Unstandardized [95% CI] |
Beta |
p value |
Unstandardized [95% CI] |
Beta |
p value |
|
Constant |
233.294 [161.777, 307.465] |
|
<.001 |
273.612 [206.357, 344.942] |
|
<.001 |
|
Socioeconomic position index (2008-12) |
-60.166 [-65.104, -54.519] |
-.613 |
<.001 |
-58.353 [-64.047, -52.675] |
-.595 |
<.001 |
|
Social capital index (2009) |
-5.400 [-11.163, .599] |
-.053 |
.021 |
-8.137 [-14.694, -3.411] |
-.081 |
.001 |
|
Sustainability/resilience index (2012/13) |
-5.598 [-10.364, -.738] |
-.057 |
.022 |
-10.007 [-14.938, -5.156] |
-.103 |
<.001 |
|
Grocery stores per 1,000 population (2012) |
63.596 [14.432, 113.000] |
.075 |
.001 |
47.749 [.941, 97.921] |
.056 |
.014 |
|
Supercenters per 1,000 population (2012) |
418.783 [182.969, 666.394] |
.088 |
<.001 |
558.077 [314.712, 818.207] |
.118 |
<.001 |
|
Primary care physicians per 100,000 population (2012) |
-.480 [-.643, -.323] |
-.130 |
<.001 |
-.177 [-.360, .012] |
-.048 |
.060 |
|
% adults 18 to 64 years insured (2008-12) |
3.046 [2.077, 3.946] |
.208 |
<.001 |
2.518 [1.604, 3.351] |
.172 |
<.001 |
|
Metropolitan status (binary metro=1, 2010) |
-21.634 [-31.989, -12.049] |
-.112 |
<.001 |
|
|
|
|
% population in urban area (2010) |
|
|
|
-.625 [-.809, -.447] |
-.192 |
<.001 |
|
Adjust R2 F-test p value for model |
.450 <.001 |
.464 <.001 |
||||
|
N=1,235 counties and county equivalents. Confidence intervals based on bootstrapping method using 1,000 sub-samples. |
||||||
As hypothesized, socioeconomic position, social capital, local agrifood sustainability, resilience, primary care physicians, and health insurance were all negatively associated with aggregate poor health outcomes. Effect sizes were most pronounced for socioeconomic position, yet accounting for this, local agrifood sustainability/resilience and social capital remained important predictors of poor or fair self-rated health. The effect sizes for these variables were less notable (although still significant) for premature age-adjusted mortality, where healthcare system development was relatively more important. Grocery store location was not related to self-rated health in any meaningful way, but supercenters per 1,000 population was positively associated with this outcome. Both commercial food access variables (grocery stores and supercenters) were positively associated with premature age-adjusted mortality. Metropolitan status played a lesser role for self-rated health than with premature age-adjusted mortality where percent of the population living in an urban area had the second highest beta coefficient following socioeconomic position.
Running the models separately for non-metropolitan and metropolitan counties (Tables and 5 and 6), similar patterns emerged. Socioeconomic position remained the most influential predictor for both self-rated health and premature age-adjusted mortality across metro status. However, local agrifood sustainability/resilience and percent of population living in an urban area were consistently important, albeit at lower effect sizes. The overall model fit was best for self-rated health.
Table 5. OLS lagged effects regression findings for percent of adults reporting poor or fair health in nonmetropolitan versus metropolitan counties.
|
Variables |
Nonmetropolitan counties |
Metropolitan counties |
||||
|
|
Dependent=% poor or fair health (2015) |
Dependent=% poor or fair health (2015) |
||||
|
|
Unstandardized [95% CI] |
Beta |
p value |
Unstandardized [95% CI] |
Beta |
p value |
|
Constant |
21.932 [18.928, 24.799] |
|
<.001 |
17.329 [12.687, 20.818] |
|
<.001 |
|
Socioeconomic position index (2008-12) |
-3.957 [-4.252, -3.641] |
-.742 |
<.001 |
-3.258 [-3.560, -2.922] |
-.771 |
<.001 |
|
Social capital index (2009) |
.123 [-.316, .574] |
.027 |
.332 |
-.325 [-.982, -.193] |
-.091 |
.001 |
|
Sustainability/resilience index (2012/13) |
-.497 [-.937, -.581] |
-.113 |
<.001 |
-.666 [-.963, -.388] |
-.144 |
<.001 |
|
Grocery stores per 1,000 population (2012) |
-.363 [-2.299, 1.650] |
-.011 |
.635 |
-1.076 [-3.309, 1.676] |
-.024 |
.383 |
|
Supercenters per 1,000 population (2012) |
6.528 [-2.009, 15.064] |
.034 |
.143 |
5.044 [-13.054, 23.948] |
.019 |
.499 |
|
Primary care physicians per 100,000 population (2012) |
-.018 [-.028, -.007] |
-.092 |
<.001 |
-.013 [-.020, -.003] |
-.102 |
.003 |
|
% adults 18 to 64 years insured (2008-12) |
-.025 [-.063, .014] |
-.034 |
.166 |
.032 [-.013, .089] |
.051 |
.151 |
|
% population in urban area (2010) |
.020 [.010, .031] |
.107 |
<.001 |
.013 [.002, .021] |
.106 |
.003 |
|
Adjust R2 F-test p value for model |
.642 <.001 |
.662 <.001 |
||||
|
N=1,235 counties and county equivalents. Confidence intervals based on bootstrapping method using 1,000 sub-samples. |
||||||
Table 6. OLS lagged effects regression findings for premature age-adjusted mortality rates per 100,000 population in nonmetropolitan versus metropolitan counties.
|
Variables |
Nonmetropolitan counties |
Metropolitan counties |
||||
|
|
Dependent=Premature age-adjusted mortality (2013-15) |
Dependent=Premature age-adjusted mortality (2013-15) |
||||
|
|
Unstandardized [95% CI] |
Beta |
p value |
Unstandardized [95% CI] |
Beta |
p value |
|
Constant |
273.224 [184.321, 365.461] |
|
<.001 |
175.999 [58.652, 304.087] |
|
<.001 |
|
Socioeconomic position index (2008-12) |
-48.266 [-56.562, -29.460] |
-.448 |
<.001 |
-68.028 [-77.434, -58.956] |
-.693 |
<.001 |
|
Social capital index (2009) |
-12.808 [-22.246, -4.335] |
-.126 |
.001 |
-7.023 [-18.270, .762] |
-.085 |
.009 |
|
Sustainability/resilience index (2012/13) |
-8.741 [-15.511, -2.143] |
-.100 |
.011 |
-13.102 [-20.213, -5.378] |
-.122 |
<.001 |
|
Grocery stores per 1,000 population (2012) |
55.272 [-.488, 111.218] |
.078 |
.025 |
34.487 [-28.928, 140.970] |
.033 |
.301 |
|
Supercenters per 1,000 population (2012) |
318.500 [55.122, 623.239] |
.085 |
.012 |
1121.974 [706.465, 1566.019] |
.179 |
<.001 |
|
Primary care physicians per 100,000 population (2012) |
.041 [-.243, -.328] |
.011 |
.768 |
-.465 [-.683, -.224] |
-.157 |
<.001 |
|
% adults 18 to 64 years insured (2008-12) |
2.460 [1.248, 3.607] |
.173 |
<.001 |
3.808 [2.158, 5.307] |
.263 |
<.001 |
|
% population in urban area (2010) |
-.529 [-.806, -.237] |
-.141 |
<.001 |
-.468 [-.719, -.233] |
-.168 |
<.001 |
|
Adjust R2 F-test p value for model |
.265 <.001 |
.542 <.001 |
||||
|
N=1,235 counties and county equivalents. Confidence intervals based on bootstrapping method using 1,000 sub-samples. |
||||||
Discussion
The purpose of this study was to investigate the relationship between multiple markers of development, including socioeconomic position, social capital, local agrifood system resilience, commercial food outlets, and the healthcare system, followed by analysis of their association with population health outcomes across the rural-urban continuum. Framed through integration of livelihoods, community capitals, and resilience, the findings generally supported the hypotheses, thereby contributing to a better understanding of the ways in which dimensions of development relate to each other and development goals such as better health and wellbeing.
Community resilience is increasingly viewed as crucial to health outcomes by many federal agencies (Chandra et al., 2011). The National Health Security Strategy (US Department of Health and Human Services, 2009) identifies community resilience as critical to national health security. Since our methods identify specific dimensions of community resilience, the findings have the potential to contribute to specification of the components of community resilience that lead to better health outcomes.
The lack of positive relationship between all components of social capital and our measure of resilience indicates that more work is needed to understand the relationship of these two concepts. Further research is also needed for some areas of the South where the relationship between community agrifood resilience and health does not follow regional trends (e.g. Eastern Kentucky).
There are some limitations to this study. Among others, these include the need for more complete theoretical and analytic models, data that are from more distinctive time periods to allow for conclusive analysis of lagged effects, and investigation of potential interaction effects. As new data are collected and disseminated over time, it will be possible to follow up on this analysis and to explore how changes in the development indicators themselves may be associated with changes in health outcomes. This would be particularly useful for further development of community resilience theory and informative for the development of policies and programs intended to improve community quality of life.
Appendix Table 1. Local agrifood system sustainability/resilience index (SRI) indicators and data sources.
|
Dimension |
Indicators |
|
Connectivity |
Farms with internet % farm operations with Internet access (Source: 2012 Census of Agriculture) |
|
Local self-organization |
Farmer lives on farm % principal operators living on farm Farms with local food alternatives scale (alpha = .739) % operations with on-farm packing % operations with direct marketing to retail % operations with community supported agriculture Community local food alternatives index Cumulative score on having meat processing facilities, farmers markets, and farm to school programs (Sources: 2012 Census of Agriculture; 2013 Food Environment Atlas; 2013 Farm to School Census; 2014 online research of state regulations and listings) |
|
Maintenance |
Average age of farm operator Each county as a % of the highest average age in the region (68.7) Reverse coded for lower average ages to have higher scores on final indicator Stability-change % change in number of farm operations between 2007 and 2012 (Sources: 2007 and 2012 Census of Agriculture) |
|
Ecological integrity |
Low chemical input scale (alpha = .759) % agricultural land not treated with herbicides % agricultural land not treated with insecticides (Note: Acres of “crop land” in the denominator. Numerator for insecticides excludes treatment for nematodes.) Organic farms % operations certified organic Management intensive livestock % operations practicing management intensive/rotational grazing (Source: 2012 Census of Agriculture) |
|
Diversity |
Production diversity index Row crop diversity Average % of operations producing across seven different row crop options (Note: Does not indicate these crops were grown on the same farms.) Vegetable production % operations with vegetables harvested Livestock production % operations with livestock sales (Source: 2012 Census of Agriculture) |
|
Local agrifood system sustainability/resilience index |
All indicators listed above were standardized and then coded into a summative index. (Weighted version based on loadings derived through principal components analysis.) |
References
Adger, N. (2000). Social and ecological resilience: Are they related? Progress in Human Geography, 24(3), 347–364.
Adger, W. N., Hughes, T. P., Folke, C., Carpenter, S. R., & Rockström, J. (2005). Social-ecological resilience to coastal disasters. Science, 309(5737), 1036–1039. https://doi.org/10.1126/science.1112122
Agnitsch, K., Flora, J., & Ryan, V. (2006). Bonding and bridging social capital: The interactive effects on community action. Community Development, 37(1), 36–51. https://doi.org/10.1080/15575330609490153
Bailey, C., Jensen, L., & Ransom, E. (Eds.). (2014). Rural America in a globalizing world: Problems and prospects for the 2010’s. Morgantown: West Virginia University Press.
Béné, C., Fahim, C., Mamun, R., Sabbir, D., & Ferdous, J. (2012). Squaring the circle: Reconciling the need for rigor with the reality on the ground in resilience impact assessment. World Development, 92, 212–231.
Bebbington, A. (1999). Capitals and capabilities: A framework for analyzing peasant viability, rural livelihoods and poverty. World Development, 27(12), 2021–2044. https://doi.org/10.1016/S0305-750X(99)00104-7
Chandra, A., Acosta, J., Stern, S., Uscher-Pines, L., Williams, M. V., Yeung, D., … Meredith, L. S. (2011). Building community resilience to disasters: A way forward to enhance national health security. Santa Monica, CA: RAND Health. Retrieved from https://www.rand.org/content/dam/rand/pubs/technical_reports/2011/RAND_TR915.pdf
de Haan, L. (2016). Livelihoods in development. Canadian Journal of Development Studies, 1–17. https://doi.org/10.1080/02255189.2016.1171748
de Haan, L., & Zoomers, A. (2005). Exploring the frontier of livelihoods research. Development & Change, 36(1), 27–47. https://doi.org/10.1111/j.0012-155X.2005.00401.x
de Olde, E. M., Moller, H., Marchand, F., McDowell, R. W., MacLeod, C. J., Sautier, M., … Manhire, J. (2017). When experts disagree: The need to rethink indicator selection for assessing sustainability of agriculture. Environment, Development and Sustainability, 19(4), 1327–1342. https://doi.org/10.1007/s10668-016-9803-x
Emery, M., & Flora, C. (2006). Spiraling-up: Mapping community transformation with community capitals framework. Community Development, 37(1), 19–35. https://doi.org/10.1080/15575330609490152
Flora, C. B., Flora, J. L., & Gasteyer, S. P. (2015). Rural communities: Legacy + change (5th ed.). Boulder, CO: Westview Press.
Green, G. P., & Haines, A. L. (2015). Asset building & community development (4th ed.). Los Angeles: SAGE Publications, Inc.
Green, J., Worstell, J., & Canarios, C. (2017). The Local Agrifood System Sustainability/Resilience Index (SRI): Constructing a data tool applied to counties in the southern United States. Community Development, 48(5), 697–710. https://doi.org/10.1080/15575330.2017.1370001
Gutierrez-Montes, I., Emery, M., & Fernandez-Baca, E. (2009). The sustainable livelihoods approach and the community capitals framework: The importance of system-level approaches to community change efforts. Community Development, 40(2), 106–113. https://doi.org/10.1080/15575330903011785
Han, Y., & Goetz, S. J. (2015). The economic resilience of US counties during the Great Recession. The Review of Regional Studies, 45(2), 131–149.
Hatanaka, M., & Konefal, J. (2017). Legitimation and de-legitimation in non-state governance: LEO-4000 and sustainable agriculture in the United States. In M. Viele, H. Bjørkhaug, & M. Truninger (Eds.), Research in Rural Sociology and Development: Transforming the Rural (pp. 135–153). Bingley, UK: Emerald Insight.
Holling, C. S. (1973). Resilience and stability of ecological systems. Annual Review of Ecology and Systematics, 4, 1–23. https://doi.org/10.2307/2096802
Lamie, R. D., & Deller, S. (2017). Motivations for a special issue on local food systems development. Community Development, 48(5), 609–611. https://doi.org/10.1080/15575330.2017.1373899
Lee, C.-J., & Kim, D. (2013). A comparative analysis of the validity of US state- and county-level social capital measures and their associations with population health. Social Indicators Research, 111(1), 307–326. https://doi.org/DOI 10.1007/s11205-012-0007-y
Lobao, L. M., Hooks, G., & Tickamyer, A. R. (Eds.). (2007). The sociology of spatial inequality. Albany: State University of New York Press.
Matarrita-Cascante, D., Trejos, B., Qin, H., Joo, D., & Debner, S. (2017). Conceptualizing community resilience: Revisiting conceptual distinctions. Community Development, 48(1), 105–123. https://doi.org/10.1080/15575330.2016.1248458
Milman, A., & Short, A. (2008). Incorporating resilience into sustainability indicators: An example for the urban water sector. Global Environmental Change, 18(4), 758–767. https://doi.org/10.1016/j.gloenvcha.2008.08.002
Nanetti, R. Y., & Holguin, C. (2016). Social capital in development planning: Linking the actors. New York: Palgrave Macmillan.
Norris, F., Stevens, S., Pfefferbaum, B., Wyche, K., & Pfefferbaum, R. (2008). Community resilience as a metaphor, theory, set of capabilities, and strategy for disaster readiness. American Journal of Community Psychology, 41(1–2), 127–150.
Nyamwanza, A. M. (2012). Livelihood resilience and adaptive capacity: A critical conceptual review. Jàmbá: Journal of Disaster Risk Studies, 4(1), 1-6. https://doi.org/10.4102/jamba.v4i1.55
Rupasingha, A., & Goetz, S. J. (2007). Social and political forces as determinants of poverty: A spatial analysis. The Journal of Socio-Economics, 36(4), 650–671. https://doi.org/10.1016/j.socec.2006.12.021
Rupasingha, A., Goetz, S. J., & Freshwater, D. (2000). Social capital and economic growth: A county-level analysis. Journal of Agricultural and Applied Economics, 32(3), 565–572.
Rupasingha, A., Goetz, S. J., & Freshwater, D. (2006). The production of social capital in US counties. The Journal of Socio-Economics, 35(1), 83–101. https://doi.org/10.1016/j.socec.2005.11.001
Schulman, M. D., & Anderson, C. (1999). The dark side of the force: A case study of restructuring and social capital. Rural Sociology, 64(3), 351–372. https://doi.org/10.1111/j.1549-0831.1999.tb00357.x
Schultze-Lutter, F., Schimmelmann, B. G., & Schmidt, S. J. (2016). Resilience, risk, mental health and well-being: Associations and conceptual differences. European Child & Adolescent Psychiatry, 25(5), 459–466. https://doi.org/10.1007/s00787-016-0851-4
Sherrieb, K., Norris, F. H., & Galea, S. (2010). Measuring capacities for community resilience. Social Indicators Research, 99(2), 227–247. https://doi.org/10.1007/s11205-010-9576-9
Tickamyer, A., Sherman, J., & Warlick, J. (Eds.). (2017). Rural poverty in the United States. New York: Columbia University Press.
US Climate Change Science Program. (2008). Our changing planet: The US Climate Change Science Program for fiscal year 2009. Retrieved from http://www.globalchange.gov/browse/reports/our-changing-planet-us-climate-change-science-program-fiscal-year-2009
US Department of Health and Human Services. (2009). National health security strategy and implementation plan - PHE. Retrieved from https://www.phe.gov/Preparedness/planning/authority/nhss/Pages/strategy.aspx
USAID. (2013). The resilience agenda: Measuring resilience in USAID. United States Agency for International Development. Retrieved from https://www.usaid.gov/sites/default/files/documents/1866/Technical%20Note_Measuring%20Resilience%20in%20USAID_June%202013.pdf
Walker, B., Holling, C. S., Carpenter, S., & Kinzig, A. (2004). Resilience, adaptability and transformability in social-ecological systems. Ecology and Society, 9(2), 1–9.
Wilson, G. A. (2012). Community resilience, globalization, and transitional pathways of decision-making. Geoforum, 43(6), 1218–1231. https://doi.org/10.1016/j.geoforum.2012.03.008
Worstell, J., & Green, J. (2017). Eight qualities of resilient food systems: Toward a sustainability/resilience index. Journal of Agriculture, Food Systems, and Community Development, 1–19. https://doi.org/10.5304/jafscd.2017.073.001
Worstell, J. (2017, May 18). CLIMATED - Resilience Blog, Meadowcreek [Wordpress]. Retrieved from https://meadowcreekvalley.wordpress.com/2017/05/18/climated/
[1] Some authors capitalize the titles for the Sustainable Livelihoods Approach and the Community Capitals Framework. We elected not to do this because of the general nature of the review and the range of different approaches covered in this article.
[2] From the eight dimensions making up the CLIMATED framework, five of them were included in the local agrifood system sustainability/resilience index analyzed later in this article: connectivity, local self-organization, maintenance, ecological integrity, and diversity.
Pulling together work on all three objectives, we explored the relationship of poverty, health and resilience in qualitative research to ground truth and deepen our previous quantitative work. Specifically, we conducted ten cases studies of resilient systems in an area widely seen as characterized by ill health and poverty: Eastern Kentucky.
Background
Natural ecological systems are not characterized by the presence of unhealthy individuals. Individuals who cannot obtain the resources to survive and thrive (what we might call extremely impoverished in human systems) exist only briefly in natural systems.
In natural ecological systems, the health and survival of any particular individual is not a goal of the system. An ecologically resilient system does not necessarily put value on the poverty or health status of individuals. In fact, removing unhealthy, weak individuals may enable a system to be more ecologically resilient.
In most modern human systems, however, the eradication of poverty and disease is seen as a universal good. The 193 members of the United Nations unanimously adopted the first three Sustainable Development Goals: end poverty, end hunger and ensure healthy lives (United Nations, 2015). However, the means usually called on to achieve those goals, agriculture, has often resulted in the destruction of the natural systems on which agriculture depends. Deserts exist today where once vast civilizations abused the land (Lowdermilk, W., 1942). Some contend that there were no deserts on the planet until agriculture arose (Wright, 2017).
Agriculture has certainly been a foundation of human civilization since its inception between ten and twelve thousand years ago. However, a growing entourage of social, economic, and environmental consequences associated with contemporary agricultural production are hindering progress towards a sustainable and resilient future for people and the planet. Many agricultural production systems significantly contribute to climate change, water pollution, loss of biodiversity, decreasing public health and social justice and increasingly compete for natural resources, such as land and phosphorus (Steinfeld et al., 2006; Bos et al., 2009). The need to move toward a more environmentally sound, economically viable and socially just agricultural systems (first trumpeted by Brundtland, 1978) is increasingly acknowledged (de Olde et al. 2016).
Though almost innumerable and contradictory systems for measuring these three qualities of sustainability have arisen, all these indicator systems have been very ineffective at changing behavior to move systems toward sustainability (Pitarch-Garrido, 2018). This ineffectiveness has led some to embrace resilience research as a pathway toward the traditional goals of sustainability (Biggs et al., 2015).
Poverty, health and resilience are increasingly seen as interrelated phenomena. Poverty is widely seen as the most “ubiquitous, intractable and noxious risk factor for population health” (Sanders et al, 2008). Resilience of individuals and communities was first related to public health in relation to disaster preparedness (Landau, 2007) and, more recently, to poverty (Zautra et al, 2010). Furthermore, maintaining the basic qualities of ecological resilience, such as biodiversity, is increasingly seen as in conflict with efforts to reduce poverty (Adams et al., 2004).
However, combining ecological resilience and developmental approaches to poverty and health means uniting two almost antithetical mindsets. Reducing poverty and increasing health are inherently value-laden. Ecological resilience is value-neutral (Olsson et al., 2015).
Most significantly, poverty and health programs can decrease resilience. Reducing human poverty and increasing human health is most easily accomplished by processes which destroy resilience of natural systems. Increasing productivity to provide more food in the short term can destroy natural resources and increase poverty in the longer term. Lade et al. (2017) conclude that the most commonly used strategies for poverty eradication (agricultural intensification, external aid and market liberalization) often lead to unexpected negative consequences included degradation of natural capital and social capital and destruction of biodiversity. Though conventional development interventions may be useful in some contexts [such as highly degraded landscapes (Faminow, 1998)] more often conventional development approaches reduce resilience.
Declining yields in severely degraded landscapes, such as sub-Saharan Africa, force the poor to farm increasingly small plots of land ever more intensively, reinforcing continued degradation of the land. In some frontier regions, poor people may increasingly encroach on primary forests to clear more land for agriculture. Intensification degrades the biological resources that support agricultural production, such as soil health, on- and off-farm biodiversity, and availability of landrace seeds. Although increased physical capital increases production, degradation of natural capital associated with higher physical capital makes this state highly vulnerable to stochastic shocks such as natural disasters or price fluctuations. Responses to a large shock could include returning to the initial attractor or, if the natural capital is subject to tipping points, degenerating into an attractor of extremely low physical and natural capital. Because intensification led to alleviation failure or even negative consequences, this approach can be characterized as an intensification trap, similar to the pesticide trap (Cowan and Gunby, 1996) or modernization trap (Scott, 1998).
Consequently, Lade et al., contend that solving the poverty-environment puzzle will require a new research agenda that “strengthens efforts to understand the interplay of multiple physical, natural, and cultural factors that shape the relative success or failure of development interventions in agricultural systems across the developing world.” Lade et al. conclude that a resilience lens is required to reduce poverty without destroying the environment.
Disturbance and resilience
One reason many take a resilience perspective on poverty and health is the success of resilience research in understanding the effect of disturbance on living systems. Ecological scholars no longer regard ecosystems as closed, self-regulating entities that “mature” to reach equilibria. Instead, they see such systems as multi-equilibria, open, dynamic, highly unpredictable, and subject to frequent disturbance (Pickett et al. 1992). Ecological resilience was developed to explain, predict and control the ability of populations to survive and thrive in the face of disturbance (Holling, 1973).
Disturbance, long recognized as a crucial driver of ecological processes, has become a topic of research in social ecological systems (Alberti et al., 2003). Living systems (from cells to households to communities to the biosphere) are constantly changing in response to change or disturbance. Among the disturbances are climate change, conflict and displacement, floods, hurricanes, food price fluctuation, and disease. The range of possible disturbances that pose threats to nations and communities is not limited. Some disturbances seem to be coming more frequent or intense, such as extreme weather events and political change. At the same time, new disturbances emerge, including threats to human, plant, animal, and community health we cannot yet imagine.
The importance of disturbance as a driver of biodiversity, innovation and evolution is increasingly recognized as disturbance regimes change globally (Davies et al., 2016). Some living systems innovate and are stronger after disturbance. Others suffer and die. Disturbances have the most deleterious effect on the poor and those in ill health. Minor disturbances for wealthy families can be major disasters for the poor. Minor health challenges for those with a strong constitution can be major health catastrophes for those plagued by ill health. Many rural development workers view disturbances or “shocks—such as ill health or bereavement—as the single greatest cause of descents into poverty” (Brown, 2016).
The focus on achieving equilibrium states of good health and lack of poverty for individuals appears to contrast with routine ecological observations. Observations of equilibrium in ecological systems are transitory. Any particular “state” of a living system is but a waystation which is followed by continued disturbance, reorganization, rapid growth and maturation/seeming equilibrium and another disturbance. These four phases are referred to as the adaptive cycle (Holling, 1986).
Early on, ecological theory was associated with the equilibrium and stability of ecosystems. In his seminal paper in 1973, Holling questioned the notions of a single equilibrium and stability in his definition of resilience: “Resilience determines the persistence of relationships within a system and is a measure of the ability of these systems to absorb change of state variable, driving variables, and parameters, and still persist.”
Resilience research studies how living systems persist and change in response to disturbance. More broadly, this is also the focus research on evolution of living systems. Living systems absorb or adapt and transform to overcome their many and varied disturbances or they die out. Those systems which survive and thrive are called ecologically resilient (Holling, 1973).
Thus the condition—even the very survival—of individual members is not intrinsically essential, as long as populations of species are maintained. The fact that humanitarian and development efforts, in contrast, focus tightly on the well-being of individuals especially those who are poor and in ill health means that development researchers attracted to the resilience perspective must meld these conflicting mindsets.
Models of resilience
An oft cited development resilience model (Barnett and Constas, 2014) try to reconcile these opposites by echoing the contrast Holling made between ecological resilience and the engineering resilience which enables nonliving systems to bounce back to their original state. They propose that ecological resilience when applied to human social ecological systems should go beyond just neutral observation and prediction of how SES survive and thrive in the face of disturbance. In this perspective, resilience must have a normative dimension; it cannot be “merely descriptive”, “neither good nor bad” (Barnett and Constas, 2014). This “developmental resilience” perspective values the health and lack of poverty of individual human and their communities.
Barnett and Constas (2014) suggests a path forward based on integration of several distinct empirical literatures in economics. They explicitly motivate their approach from the poverty dynamics and traps literatures that emphasize the possibility of nonlinear well-being dynamics and asset-based poverty traps. Cisse and Barrett (2016) further develop this theory and apply it to data from small holders in Northern Kenya.
Smerlak and Vaitla (2017) propose a general non-equilibrium framework to quantify resilience based on the statistical notion of persistence. Their method requires high frequency time-series data. Where these are not available, they agree that alternative methods such as those developed by Cissé & Barrett (2016) are preferable.
These and similar theories of resilience seek to quantitatively track how households, communities or countries withstand shocks and disturbances. But resilience is ultimately qualitative: the system survives (is resilient) or it disappears (is not resilient). Until a system disappears, there is always the possibility it will adapt, innovate and begin again to thrive. A satisfactory theory of resilience will not just model the trajectories of systems--which survive and which don’t. Such a theory will also posit the qualities of systems which enable them to be resilient.
Several research groups have attempted to identify these qualities. Six of the most prominent models have been synthesized and integrated with case study results to produce a model which posits eight qualities (Worstell and Green, 2017). This model does not incorporate measures of the three aspects of sustainability since they are results, not causes. The model posits the causal qualities which are necessary for more sustainable and resilient systems. The group then proposed a sustainability/resilience index (SRI) Green, Worstell and Canarios (2017) which measures these qualities.
The eight qualities can be summarized with the acronym CLIMATED
The C in the model refers to connectivity. All resilient systems are highly connected to other systems. In any lasting ecological system each individual is highly networked with other species. But they maintain independence along with that connectivity. Any component which is too dependent on any other component will die when that component dies. Toyota car production in Japan plummeted 62.7% in March 2011 after a tsunami wiped out the sole source of a crucial part.
The L refers to locally self-organized. Resilient systems organize themselves. They are not organized from outside. Regions which recover most quickly after a disaster are those where the local people are self-organized and begin their own relief efforts. Many failures of international rural development efforts and federal antipoverty programs illustrate the lack of this quality. Such efforts are often organized by well-meaning people from outside the system with little to no input from local people.
The I is for innovation, but a conservative innovation. No system can change unless it has the capacity for innovation. Biological systems evolve through changes in their genetic material (the DNA/histone complexes which are your chromosomes). If these changes help the species survive and thrive, they will be passed on to the next generation. Any business will fall behind which does not have the capacity to quickly adapt and change. Just ask the buggy makers who didn’t evolve into automobile makers. But innovation in resilient systems is always conservative. Innovations do not fit within the existing system will fail. Da Vinci invented a helicopter, but it took 400 more years before a larger system existed in which a helicopter fit.
The M refers to maintenance which in ecology is known as redundancy. Resilient systems replace themselves. No agricultural system will be resilient if new farmers don’t come into the system. No individual farm is resilient unless its equipment is carefully maintained. Maintenance requires that replacement parts be at hand or easily manufactured locally. The smooth functioning over time of any system requires that redundant systems be present to replace and maintain components of the system.
A is for accumulation of reserves and infrastructure. Resilient farms are more likely to have wells and reservoirs for irrigation, increasing soil quality, storage for crops, and processing equipment. Resilient ecosystems accumulate the reserves and infrastructure they need to survive. A resilient tropical forest has huge reserves of nutrients accumulated in its vegetation, just as a resilient prairie has huge reserves of nutrients stored in its soil and vegetation.
T is for transformation. Resilient systems regularly transform themselves. Nations which languish under the same leadership for generation will stultify and decline. A healthy temperate forest will have fire as part of its natural cycle of renewal. In natural ecosystems, transformation is triggered by external shocks, but in social-ecological systems, effective transformations often are intentional, as opposed to change triggered by external shocks and are led by actors endogenous to the system being transformed. These actors set priorities justified by narratives fundamentally different to the status quo and often lead to change across multiple levels of society. For example, agroecological farming that improves production by combining modern farming techniques with traditional cultivation practices, when combined with farmer choice over whether and how to interact with global food markets, could lead to transformations that achieve more social justice and reduced poverty. This example also illustrates how transformation is equivalent to innovation, though at a different scale. To a farmer a new practice may be an innovation, but to the organisms in the field, the innovation may constitute a transformation.
E stands for ecologically integrated. Unless a system is integrated with the local natural ecology it cannot long survive without massive and continuous inputs from outside. The failure of Northern Europeans in Greenland was due to dependence on sheep, cattle and hay. The native Inuits resiliently relied on fish and seals which were still abundant when climate cooled and not enough forage could be grown for ruminants.
Diversity, albeit a complementary diversity, is the quality designated D. The diversity of resilient ecosystems is unbelievable–try to count the thousands of species in any shovel of healthy soil. But sometimes an increase in diversity can destroy a system. Introducing kudzu into the U.S. South seemed sensible to those who wanted a fast-growing species palatable to grazing animals. Until it began to grow over and smother existing species. Noone expected the harmless rabbit to wreak such havoc in Australia. Diversity only contributes to resilience when it is complementary to other component system.
Scale and resilience
The SRI and other resilience models are applicable to both individuals and to higher level systems. They recognize the central role of background risk (stressors) of all sorts and that sometimes risk is realized in the form of adverse events (shocks) that can catastrophically change lives. It emphasizes the time path of standards of living, which may be nonlinear and uncertain. The main value of resilience is that it compels a coherent, multidisciplinary, and rigorous explanation of the interrelated dynamics of risk exposure, multiscalar human standards of living, and broader ecological processes.
These models define resilience as a multidimensional capacity that draws on human, social, economic, physical, ecological, and programmatic (for example, safety nets) resources, the optimal configuration of which varies by type of shock, level of aggregation, context, and target population.
Resilience is observed at a given level (such as household or community) but is understood as a multilevel construct. Interventions should be sensitive to nested dependencies between levels (for instance, households and communities, communities and regions).
Resilience can be observed at an individual, community level or a scale which includes the level of the provider. Adopting a multisectoral and participatory approach to resilience building brings together local communities, governments, researchers, development practitioners, and humanitarian workers.
People have always faced shocks and have devised a variety of responses to cope with, recover from, and prevent future impacts. Central to these shocks and this coping capacity, but often underexplored, is the role of local self-organization—which is similar to the concept of social capital. Social capital includes “features of social organization, such as networks, norms, and social trust that facilitate coordination and cooperation for mutual benefit” (Putnam 1995) and can serve as an asset for communities, enabling them to engage in and benefit from collective action and cooperation.
Often, however, the humanitarian efforts to rescue people from poverty and ill health, especially immediately after catastrophe or disturbance, conflict with long term resilience. Humanitarian assistance after disasters can undermine development of resilience in the communities targeted Labbe, 2014).
As Holling and others explain, resilience is particularly important when a system approaches a threshold in which critical functions of that system may be subject to sudden, perhaps unpredictable, regime shifts. Thresholds of this kind appear particularly prevalent in low-income countries where high poverty, food insecurity, stressed sociopolitical systems, and inadequate infrastructure (Barrett, 2014).
Why link poverty, health and resilience?
In the third world, food systems, poverty and health are obviously intimately intertwined. Where practitioners realize this, progress toward resilience is possible. So well accepted is this concept internationally that NGOs are competing to have programming which results in the most resilience, according to Frankenberger et al. (2014). In the developed world, the divorce of food production and consumption often makes a direct link between poverty, health and resilience less obvious. Most people in such societies are far removed from agriculture.
Whether in developed or underdeveloped countries, it is generally the poor who tend to suffer worst from disasters (DFID, 2004; Twigg, 2004; Wisner et al., 2004; UNISDR, 2009b). Impoverished people are more likely to live in hazard-exposed areas and are less able to invest in risk-reducing measures. The lack of access to insurance and social protection means that people in poverty are often forced to use their already limited assets to buffer disaster losses, which drives them into further poverty. Poverty is therefore both a cause and consequence of disaster risk (Wisner et al., 2004), particularly extensive risk, with drought being the hazard most closely associated with poverty (Shepard et al., 2013). The impact of disasters on the poor can, in addition to loss of life, injury and damage, cause a total loss of livelihoods, displacement, poor health, food insecurity, among other consequences.
Climate change and exposure to natural hazards threaten to derail international efforts to eradicate poverty by 2030 (Shepard et al., 2013).
Resilience means the capacity not only to bounce back from shocks, but also to get ahead of them. Given that normal conditions for the poor are often dire, people need the capacity to transform and improve after a shock rather than merely returning to a dismal original state. When resilience goes beyond recovery to include a capacity for transformation, it may involve changes in economic, social, and ecological structures that allow for greater long-term well- being. This capacity for transformation is especially important in terms of food and nutrition security, given that more than 800 million people still suffer from chronic hunger and 165 million children younger than five years of age are stunted (Black et al. 2013).
Though traditional ecological resilience approaches do not address the poverty or health of individuals, only populations, such approaches all include the capacity for transformation required for creation of better poverty and health outcomes in human systems.
Instead of poverty and disease, a resilience lens stresses capabilities
The approach of those applying ecological resilience to poverty builds on the capabilities approach which won a Nobel Prize for Amarya Sen (1999).
The word ‘poverty’ often finds company with the terms such as deprivations, backwardness, disempowerment, lack of development, lack of well-being, poor quality of life, human suffering, and so on. Living in poverty means living deprived of basic material necessities of life. They also face adverse forces coming from non-material dimensions, which could be psychological, social, cultural, political and environmental. They are no less important than material factors but taken together they dis-empower the poor. As a result, people in poverty lack capability to lead a normal decent life like others.
The traditional idea of poverty associates it with lack of sufficient money, so it sees poverty as a situation of income deficit. Taking forward the logic, the efforts for poverty removal then revolve around increasing employment opportunities which is connected with the economic processes. This (erroneously) makes economic development (GDP growth) the only panacea for poverty eradication. This is why around 1 billion people across the world live in extreme poverty.
In the capability approach to development initiated by Sen, poverty is seen as ‘deprivation of capabilities.’ It is a development model that aims to increase people’s capabilities and empower them to lead the life they value. The approach was first articulated in the 1980s, and remains most closely associated with him. It has been employed extensively in the context of human development, for example, by the United Nations Development Programme, as a broader, deeper alternative to narrowly economic metrics such as growth in GDP per capita.
Sen first introduced the concept of capability in his Tanner Lectures on Equality of What? (Sen 1979) and went on to elaborate it in subsequent publications during the 1980s and 1990s. Sen notes that his approach has strong conceptual connections with Aristotle’s understanding of human flourishing (this was the initial foundation for Nussbaum’s alternative Capability Theory); with Adam Smith, and with Karl Marx. Marx discussed the importance of functionings and capability for human well-being. For example, Sen often cites Smith’s analysis of relative poverty in The Wealth of Nation in terms of how a country’s wealth and different cultural norms affected which material goods were understood to be a ‘necessity’. Sen also cites Marx’s foundational concern with “replacing the domination of circumstances and chance over individuals by the domination of individuals over chance and circumstances”.
Béné and colleagues (2012) advocate a variant of the capabilities approach, focused on capacities, and apply it to resilience. Resilience in their conceptualization, has three dimensions, namely absorptive capacity, adaptive capacity, and transformative capacity. Absorptive capacity refers to coping skills by which households and communities buffer themselves or moderate the impact of shocks to persist with their existing way of life. Adaptation, a term now often used in the context of climate change, refers to incremental adjustment to the impacts of a stress (for instance, adjusting planting schedules or shifting to drought-resistant crops), while transformation refers to the ability to create a fundamentally new system (or way of life) when conditions require it. FAO (2012) has adopted this approach by advocating various interventions designed to strengthen households’ absorptive, adaptive, and transformative capacities.
Thinking on resilience has evolved from characteristics-based or outcome-based approaches to a focus on capabilities or capacities. Building the resilience of individuals, households, communities, or higher-level systems to deal with shocks and stresses requires improving absorptive, adaptive, and transformative capacities, which are distinct but interrelated, are mutually reinforcing, and exist at multiple levels.
Just as Sen showed for poverty broadly, Lade et al., 2017 show evidence that improving the capabilities of rural people is more effective at increasing resilience than providing money or technology. Financial or technological inputs intended to “push” the rural poor out of a poverty trap have had many successes but have also failed unexpectedly with serious ecological and social consequences that can reinforce poverty
Although the poverty traps concept is not always explicitly invoked, the idea that a sufficiently large injection of assets or other aid can move rural people out of poverty— “pushing” them over the barrier between poverty and economic growth—is pervasive. Yet, excessive focus on asset inputs, such as finance or technology, risks ignoring well-established knowledge about more endogenous and inclusive poverty alleviation pathways (Easterly, 2006) and can lead to increased resource degradation or the loss of biological and cultural diversity (Chappell et al, 2013).
Unfortunately, where resilience has become popular in development policy, it is commonly viewed as a property of individuals or communities that can be “built” through investments and used to measure the effectiveness of these interventions. The view that resilience is an outcome or a property that can be measured, although useful for some purposes, risks dangerously simplifying and neglecting aspects of the complex social-ecological dynamics that characterize most development situations.
Resilience is just a fact ex post, all the we can measure are the qualities which increase the likelihood that a system will survive or transform. Any single measure or score will oversimplify and not lead to proscriptions which can increase the likelihood of survival. Rather a useful measure should determine scores on all eight qualities which interact to determine resilience. All are necessary and must be strong for resilience to be high.
General resilience and health
In both the poverty and health literature, the concept of general resilience is often not understood. Though some contend resilience capacities are setting and shock/stressor specific, we can also seek a more general resilience. Certainly, if a household is resilient to one type of shock, it does not follow that the household is resilient to all shocks. As an example, consider two rural households. In one, livelihoods are derived from farming activities; in the second, the household receives wage income from a member’s employment as a government schoolteacher. The schoolteacher’s household may be more resilient to a climatic shock, say a flood, than the farming household. But if there is an economic or governance shock that causes governments to stop paying teachers, the farming household is less likely to be affected. However, a focus on general resilience is revealed in a third family which has a member who is a farmer and another who is a teacher, giving the family a more general resilience.
General resilience has a long history in the health literature under the rubric “constitution.” “A hardy constitution constitutes a stronger defensive armor against the attacks of disease than a weak constitution, no matter how reinforced and strengthened by a favorable environment” (Morrow, 1911).
Modern analyses have focused more on community than individual resilience. Chandra et al. (2010) have produced the most thorough analysis of health and community resilience. Chandra et al. cite several of the qualities identified by Worstell and Green as noted below. Innovation, transformation and maintenance are not explicitly mentioned by Chandra et al. (2010) though they are implicit in their conceptualization of a resilient community.
The CLIMATED qualities of resilience in poverty and health
Connectivity and accumulation of reserves and infrastructure are crucial to community health resilience. To date, we have many theoretical models articulating factors that contribute to community resilience (Norris et al., 2008; Pfefferbaum et al., 2007; Pfefferbaum et al., 2008) such as community cohesion and the ability to marshal resources quickly, which are considered critical to mitigating vulnerabilities, reducing negative health consequences, and rapidly restoring community functioning. According to the Homeland Security Presidential Directive-21 (HSPD-21), resilience is essential to limiting the need for prolonged assistance post disaster.
Redundancy and diversity are also crucial to community health resilience. In order to improve resilience, Bruneau (2003) argues that communities must build capabilities that are characterized by robustness (the ability to withstand stress), redundancy (resource diversity), and rapidity (the ability to mobilize resources quickly). These efforts ensure that communities (and especially those with resource poor neighborhoods) will have the ability during an event to respond quickly, even when critical parts of the community are severely impacted, and to return to normal functioning with little delay.
Local self-organization appears most crucial to community health resilience. Families and communities can facilitate recovery and resilience by reorganizing social structures and “sharing acknowledgement of traumatic event, sharing experience of loss and survivorship” (Walsh, 2007). These social structures can then feed back into individual resilience. According to Steury et al. (2004), the efficacy of coping by talking with friends and family “hinges on the ability of the individual’s environment and social network to respond to that call.”
Social networks can provide either a bridge that surmounts market failures (e.g., for credit or land) that might otherwise ensnare a household in chronic poverty, or they can become instruments that reinforce suboptimal behaviors and obstruct needy individuals’ access to scarce capital, improved technologies, state support to which they have a right, etc.
The differing outcomes of two women whose husbands died illustrate the importance of local social organization. In one woman’s case, her extended family stepped in and sent a teenage male cousin to live with her and help out with farm work, while congregants from her church and neighbors made extraordinarily generous donations to cover the costs of a funeral and the fatherless children’s school fees. She was traumatized but able to adapt to her new circumstances, supported by a social network that helped her and her children remain non-poor.
The other woman was not so lucky. By custom, she had to slaughter the family’s only cow to feed mourners at her husband’s funeral. Her brothers-in-law took possession of the farmland and home and, when she protested, turned her and her children out. Moreover, because one of her brothers-in-law was quite prominent in their village, her neighbors were reluctant to host her and the children. Alone and suddenly destitute, the widow withdrew the children from school, moved to a slum in the nearest big city, and turned to begging and informal street trade to try to make ends meet. The customs and power relations prevailing in the system of which she was a part greatly magnified the injury of her husband’s untimely death, casting her deep into a poverty trap she had not anticipated confronting.
Connectedness and self-organization are widely seen as foundational in creation of resilient communities which have high levels of health and low levels of poverty. Chandra and Acosta’s (2009) analysis shows that social connectedness is important for health security because social networks can be used for information and resource exchange before, during, and after an event. Further, these networks are essential for restoring the community, both structurally and at the “human” level of recovery.
The integration of organizations – from big to small, diverse to homogeneous, in the biggest city to the most rural locations – serves to strengthen the whole, to form a social system that can adequately prepare for, respond to, and recover from disasters. Unlike individual resilience, community resilience inherently involves a collection of individuals, groups, and organizations for which its integration and collaboration enhances the capacity for recovery. Norris et al. (2008) charge that “community resilience is a process of linking a set of networked adaptive capacities” and that organizational linkages help build collective resistance.
Before, during, and after a disaster, local organizations play a key role. In a pre-disaster phase, community partnerships should be developed, providing ongoing risk education, community engagement, and an opportunity to openly discuss policies and plans of action (Quinn, 2008). During a disaster, community organizations may be involved less so, but are an important conduit for receiving and distributing emergency risk communication information, providing increased capacity for response, and perhaps public-private partnerships would play a role engaging relevant supply chains (Quinn, 2008; Stewart et al., 2009).
Integrating organizations that have not been part of disaster planning in the past can engage new partners into health security and increase capacity. Faith-based organizations and other NGOs are existing community entities with strong ties to the local community who may not have been a part of disaster teams (Baezconde-Garbanati et al., 2006; Pant et al., 2008). These organizations can help to engage local people who can be vital assets. In the case of a nursing school in Kentucky, a mock drill brought together the university with the community and now both students and areas on campus can be utilized in the case of a mass vaccination clinic (Wise, 2007).
Social connectedness refers to the personal (e.g., family, friend, neighbor) and professional (e.g., service provider, community leader) relationships among community residents. Relationships can vary in closeness (acquaintance vs. close friend), and can be with individuals that are similar in status (i.e., horizontal or parallel) or with individuals of varying status and power (i.e., vertical or hierarchical). When residents have relationships with other members of their community it increases their attachment to the community, access to real and perceived social support, social capital [i.e., feelings of trust and norms of reciprocity that develop as a result of relationship; (Putnam, 2000)] and promotes a sense of community (i.e., “a feeling that members have of belonging, a feeling that members matter to one another and to the group, and a shared faith that members’ needs will be met through their commitment to be together,” (McMillan & Chavis, 1986). Research has shown that individuals who live in communities with these characteristics (i.e., healthy communities) have better psychological, physical, and behavioral health (Varda et al., 2009)
Chandra et al. (2010) identified 20 articles that offer insight about how social connectedness and the structure and composition of social networks relate to community resilience. Of these articles, ten provided empirical support linking social connectedness to community resilience or disaster preparedness and response (Birmes et al., 2009; Buckland & Rahman, 1999; Eisenman et al., 2009; Haines et al., 1996; Hurlbert et al., 2000; Moore et al., 2004; Paton et al., 2007; Procopio & Procopio, 2007; Weems et al., 2007; Yong-Chan & Jinae, 2009).
A resilient community can be characterized by its interconnectivity – that is, the presence of strong horizontal and vertical relationships that exist between community residents (Allenby & Fink, 2005). A case study of power outages in the U.S. and Canada suggested that a sense of collective identity among residents and strong relationships based on shared community events before the power outages contributed to community resiliency (Murphy, 2007). There is evidence that both the sense of community created by these relationships and individual characteristics of the relationships (i.e., characteristics of those involved) help improve disaster preparedness. Research has shown that people connected to community organizations and other providers of knowledge and resources during an emergency, perceive themselves to be at higher risk and are therefore more likely to engage in preparedness activities before a disaster (Yong-Chan & Jinae, 2009). In addition, people with a greater sense of community are more concerned with maintaining their connections to the community and are therefore more likely to engage in preparedness activities (Yong-Chan & Jinae, 2009).
Knowing who interacts with whom can be critical for promoting situational awareness and developing coordinated emergency response plans before a disaster occurs. In order for this to happen, emergency planners need to involve local community members in response planning to determine what social networks exist and how to activate them during a disaster (Lahad, 2005). Planners should also be aware of existing social routines in the community and prioritize efforts to reinforce and restore these routines; such efforts have been shown to increase community resilience (Baker & Refsgaard, 2007). For example, planners should think in family, rather than individual units, and plan accordingly so that shelters, evaluation plans, and even public assistance can be given to the family unit (Dynes, 2006).
Research has suggested that communities with many social connections can more quickly mobilize needed resources (Maysino, 2009). Although involving local social networks in disaster response can complicate decision-making, coordination, and control, events such as the September 11, 2001 collapse of the World Trade Center have shown local social networks can serve as resources during a disaster (Haines et al., 1996). During the 9/11 response, co-workers helped each other out of the towers and assisted the police and fire on scene with evacuation and first aid (9/11 Commission Report). Research has suggested the decentralized and flexible structure of these local social networks allowed them to respond quickly – and that a centralized, rigid emergency response takes longer to mobilize and can delay the distribution of needed resources, ultimately reducing community resiliency (Baker & Refsgaard, 2007).
People with a greater sense of community also try to maintain their connection to people in their area by checking to see if they are all right during a disaster and offering them needed help (e.g., transportation, food) (Yong-Chan & Jinae, 2009). Research has suggested that being part of a healthy community (i.e., one with strong social networks and sense of community) can improve survival chances and safety of community residents during a disaster (Buckland & Rahman, 1999; Schellong, 2007).
Ability to restore community connections rapidly post disaster can facilitate coping and recovery. A community’s ability to confront, cope with, and adapt to changes post-disaster is a core element of its resilience. Recovery is especially difficult for communities because over time social connectedness and social support among residents deteriorates (Moore et al., 2004). Having experience successfully confronting challenges within a normal context (i.e., day-to-day interactions where residents collectively confront and resolve problems), can help prepare a community to effectively deal with significant changes post-disaster and generate a collective feeling of confidence and efficacy among community members (Paton et al., 2007). Social networks also help to build resilience by acting as key providers of emotional and instrumental support (Aghabakhshi & Gregor, 2007; Dynes, 2006; Haines et al., 1996) and as bridges to support providers for their members (Hulbert et al., 2000). For example, cohesive social networks reduced symptoms of post-traumatic stress disorder among community residents immediately following a disaster (Birmes et al., 2009).
Finally, few interventions have been shown to improve social connectedness. Community context impacts how social networks are structured. For example, low socioeconomic neighborhoods have more horizontal relationships in their social networks, meaning that residents are less connected to figures in local government and community and organizational leaders (Weems et al., 2007).
Leveraging the diverse resources of community organizations, through public-private partnerships, social or cultural networks, linking support services to those in need, re-engaging community members after a disaster, all help to allow a community to be more prepared for and fully recover from a disaster. Norris (2008) suggests that poor neighborhoods, in particular, may feel safer through collaborative efforts between city governments and community based groups to identify needs and develop a mutual approach to address these issues.
Accumulation of reserves and infrastructure and poverty and resilience
Another of the eight qualities of the CLIMATED model is well supported by research in health and poverty circles: accumulating reserves and infrastructure. The assets-based approach to community development is most explicit in backing this quality as crucial (Kretzmunn and McKnight (1996).
Many populations are vulnerable because of lack of reserves and infrastructure. For them, life circumstances (e.g. a lack of economic, cultural, or social resources) are barriers to identifying opportunities for aid, and for using available support services (Cutter et al., 2000; Mechanic & Tanner, 2007; Norris et al., 2008). People of low socio-economic status (SES) often live together in neighborhoods that are particularly vulnerable because of the increased impact some emergencies will have on housing of dense construction or of poor quality (Curtis et al., 2007). These conditions can increase the chances that an event will result in greater harm including increased mortality and greater economic and material losses (Norris et al., 2008; Morrow, 1999).
When these populations are concentrated in geographic regions, it becomes much more difficult for the entire community to develop and maintain resilience in the face of disasters (Morrow, 1999; Norris et al., 2008; Pfefferbaum et al., 2005). According to Norris and colleagues (2008), in order to build and maintain resilience, communities must engage in economic development and reduce social and economic inequities
Low SES reduces the ability to absorb losses and recover (Cutter et al., 2003). Neighborhoods and communities that are poor prior to a disaster risk further decline during reconstruction due to the abundance of poorly built and inadequately maintained houses, vulnerable locations of housing such as in floodplains, the greater number of homeless persons, and their decreasing capacity to find homes after a disaster (Norris et al., 2008; Morrow, 1999).
Integrating health and resilience through nutrition
A health and food related area where resilience has been widely applied is nutrition. The nutritional impact of food security programs is empirically well established (Ruel and Alderman 2013). The impact of various disturbances on health through nutritional deficits has been thoroughly documented. Drought and civil unrest (independently as well as jointly) contributed to increased stunting in Zimbabwe, and subsequently this stunting led to reduced schooling (Alderman, Hoddinott, and Kinsey 2006). Moreover, even a modest rain shortfall, far less dramatic than those that generate international attention, may result in reduced linear growth and schooling (Maccini and Yang 2009). Nor are these negative outcomes confined to conflict- and drought-affected economies; the incidence of low birth weight increased with the economic contraction in Argentina in 2001–2002, with both contraction of gross domestic product and reduced health expenditures per capita independently explaining this outcome (Cruces, Gluzmann, and Lopez Calvo 2012).
One of the first signs of undernutrition observed in crises is an increased rate of wasting, defined as low weight for height but also monitored in terms of upper-arm circumference. A child who is severely wasted has a compromised immune system and a heightened risk of dying young. Fortunately, there have been recent strides in managing acute malnutrition by offering nutrient-dense, lipid-based supplements to assist in rehabilitation (Bhutta et al. 2013).
In an extensive summary of work on resilience and nutrition, Fan et al. (2014) support the notion that a resilience lens is needed to looking at issues across the food system—including smallholder production, food processing, markets and trade, food reserves/stocks, agriculture-related diseases, food safety, social safety nets, and nutrition interventions—with an eye toward their role in resilience-building.
Fan et al contend that resilience could be a natural overarching theme, encompassing poverty eradication, food security, and nutrition security. They also see resilience as a way of attacking the poverty/environment problem (or as they state it: “a way of connecting people-centered development goals with planet-centered sustainability goals.” They contend a resilience agenda could serve as the impetus to a commitment in the development community to eliminate emergencies that arise from recurrent shocks such as drought.
Reducing malnutrition is crucial to strengthening resilience because well-nourished individuals are healthier, can work harder, and have greater physical reserves; households that are nutrition secure are thus better able to withstand external shocks. Conversely, households that are most affected by shocks and threats face the greatest risk of malnutrition; (Dufour and Egal 2012; Justino 2012) thus, strengthening resilience is essential to efforts to reduce malnutrition.
Resilient food systems have health and poverty effects
The food and financial crises of 2007–2008 and 2011 moved building resilient food systems to achieve food security to the top of the development agenda. A 2014 IFPRI/FAO conference defined resilient food systems as those in which “people, communities, countries, and global institutions prevent, anticipate, prepare for, cope with, and recover from shocks and not only bounce back to where they were before the shocks occurred, but become even better off” Babu and Dorosh, 2014). The conference concluded that resilient food systems can help countries transition from a relief stage to a development path. However, the conference also noted that the development community lacks a systematic understanding of how to build capacity for resilient food systems as well as which approaches to building capacity work and why.
Development practitioners have typically invested in interventions which undermine resilience (Schipanski et al., 2016). Extensive public and private investment in agricultural research and development has focused on increasing yields of key commodity crops in response to predicted increases in energy-dense diets as well as market dynamics and industry consolidation (Fuglie et al. 2012). Agriculture now produces more than enough calories to meet basic dietary needs worldwide; however, one out of eight people do not have access to sufficient food. Despite increases in global crop production, the number of undernourished people in the least developed countries has not declined; food-price volatility persists and is consistently higher in least-developed than in developed countries. Increasingly, researchers are realizing that agriculture is also as a key driver of global environmental change, which could ultimately undermine agricultural productivity (Steffen et al., 2015).
Global agricultural systems have experienced immense homogenization and specialization over the past 50 years (e.g., Khoury et al. 2014). As production systems intensify, the consolidation and concentration of sources of seed, technology, fertilizers, and pesticides increase the dominance of a small number of commodity grain crops with a narrowing genetic base (Pingali and Traxler 2002, Khoury et al. 2014).
This specialization and intensification has improved yields—but at large costs for environmental quality and resilience (Bennett et al., 2014). Over the past 50 years, global agricultural production increased by 47%, supported by 5.6-fold and 2.5-fold increases in nitrogen and phosphorus fertilizer inputs and contributing to over 400 marine hypoxic zones worldwide (Diaz and Rosenberg 2008, Foley et al. 2011).
Headey (2011) shows that the global food crisis of 2007–2008 and various droughts have contributed to grain price fluctuations This vulnerability is moderated in wealthy economies through governmental policies and market mechanisms, although many people in more wealthy countries still experience food insecurity. In the United States, this vulnerability has largely been targeted through crop insurance subsidies for a small number of commodity crops.
Simplified systems with low genetic and taxonomic diversity are also vulnerable to pest and disease outbreaks as evidenced by the rapid rise of herbicide resistant crops over the past 40 years due to singular reliance on herbicides in pest management (Mortensen et al., 2012). Simplified production systems can be more vulnerable to climate variability because of dependence on the success of one or two crops (Schlenker and Lobell 2010). Reliance on fossil fuel–based inputs and the geographic concentration of production centers could also compound farmer and consumer vulnerability to global food price volatility (Elser et al. 2014).
Increasing the use of ecological processes—in place of chemical-based inputs—has repeatedly been promoted as a strategy for sustainably feeding the growing global population (Godfray and Garnett 2014, Ponisio et al. 2015). Agroecological approaches seek to ensure long-term productivity through the restoration of biodiversity and the full array of ecosystem functions that support food production and human well-being (i.e., clean water, nutrient cycling, and climate regulation). For example, increased biodiversity in space and time has benefits for nutrient retention or recycling and builds soil organic matter reservoirs (Drinkwater and Snapp 2007, Kremen and Miles 2012), with benefits for resilience to drought and fertilizer dependency (Gardner and Drinkwater 2009). Crop diversity and enhanced landscape diversity through diverse field border plantings can increase multitrophic pest regulation, reducing reliance on external pesticide inputs (Lundgren and Fergen 2011).
Improvements in food self-sufficiency in many countries have been a dual result of increasing domestic production as well as increasing crop imports (Porkka et al. 2012). More than one-fifth of global calorie production is exported (MacDonald et al. 2015). However, there is considerable variation in the dependencies of countries on international food imports. Almost one billion people were fundamentally dependent on imports to meet their basic dietary needs because of resource constraints or shortfalls in production circa 2000 (Fader et al. 2013). The expansion of trade has therefore helped to increase food availability in many net importing countries—but potentially at the cost of reduced resilience through reliance on foreign sources of food over which these countries have little to no agency and cannot always afford.
Growing interconnectedness in food systems means that social, economic, and ecological vulnerabilities are also connected across increasingly vast distances (Adger et al. 2008)—but often with limited transparency. Some countries outsource land use abroad either indirectly or through foreign direct investment via large-scale land acquisitions, or land grabs. Most new cropland expansion globally can be attributed to the production of crops for foreign exports (Kastner et al. 2014), especially commodity crops in tropical countries (DeFries et al. 2013). These dynamics have potentially large consequences for developing countries’ autonomy vis-à-vis food systems and social equity, including impacts on rural livelihoods (Golay and Biglino 2013). The physical separation of production and consumption activities has also displaced environmental impacts of production to exporting countries. For example, global trade in livestock feed has contributed to vast phosphorus surpluses and degraded water quality in some regions, and the depletion of soil phosphorus in other regions, while also reducing the capacity for recycling this crucial nonrenewable resource (Schipanski and Bennett 2011).
Although globalization has played a role in regional food availability, it may also contribute to less healthy diets and overconsumption in some regions. The vertical integration of production, marketing, and distribution systems has contributed to an increasingly homogenous, calorie-rich, and land-intensive global diet (Cassidy et al. 2013, Khoury et al. 2014) and to the simultaneous prevalence of chronic diseases, including type-2 diabetes, obesity, and some cancers alongside hunger (Hawkes and Popkin 2015).
Demand itself is strongly influenced by policies and commercial interests. This means that current projections conflate “wants” influenced by policy and commercial interests for resource-intensive diets with the “needs” of those without effective demand (e.g., those lacking consumer purchasing power and access sufficient to match the level of their basic food needs (Loos et al. 2014). From a resilience perspective, the current trajectory toward more resource-intensive diets that threaten ecological resources and human health illustrates the lack of feedback and adaptive capacity within the current food system.
National policies designed to support diversified production systems that provide for nutritious, culturally relevant diets could potentially drive a major shift not only in human health outcomes and the trajectory of consumptive demand but could also have cascading benefits for natural-resource use globally.
Sustaining viable, diversified local and regional food systems can improve human health. For example, a single factor study on human health could conclude that increasing the diversity of food imports will adequately provide dietary diversity; however, if the potential benefits of diversified production systems and reduced dependency on volatile global markets were included, increasing diversity across all sectors could contribute to more favorable human and ecosystem health outcomes. Recent studies support the links among crop diversity, the nutritional adequacy of diets, and human health (Jones et al., 2014), suggesting that incentives for the production of only a handful of crops may negatively affect human health and increase chronic disease risk.
Eastern Kentucky as a unique case at the nexus of poverty health and resilience
As shown above, in developing countries, the relationship between poverty health and ecological damage is often observed in developing countries. In developed countries, the intertwining of these phenomena is less apparent. However, as noted in previous chapters, the results of the Resilience Project indicate that Southern counties with high resilience scores generally have high health scores and low poverty levels (see chapter 2 of this report).
Eastern Kentucky is an enigma. In contrast to the rest of the South, Eastern Kentucky’s agricultural systems have high levels of resilience, but the region is also characterized by high poverty and low health. Resilience and health scores for the region are presented in graphic form in the accompanying figure. Methods used for generating the maps are available in the methods section of this report.
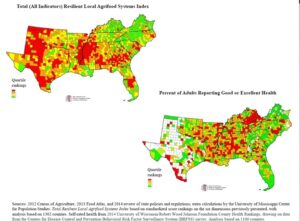
The low health and high poverty of Eastern Kentucky is well known and documented. As of Fiscal Year 2013 49 of Central Appalachia’s counties (60 percent) were officially designated as economically distressed: to be designated as economically distressed, a county must have a poverty and unemployment rate that is 150% of the national average (Appalachian Regional Commission 2007). Currently, the region’s poverty rate stands at 23 percent (as compared to 15 percent nationally). This rate is six percent higher than any of the other four Appalachian subregions. The unemployment rate is eight percent and the median income is $32,887 per year (Pollard and Jacobsen 2012). The median income in 2012 was substantially below the national median of $51,017 (DeNavas-Walt et al. 2013) and below each of the other Appalachian subregions by, at least, $9,000. In addition, Central Appalachia still faces stark disparities in education and health as compared to the rest of nation. Twelve percent of Central Appalachian residents aged 25 and over have Bachelor’s degrees, compared to 27 percent nationwide (Pollard and Jacobsen, 2012). Central Appalachia…has higher rates of heart disease, cancer, particularly breast cancer, stroke, and chronic obstructive pulmonary disease (COPD) compared to the United States as a whole (Halverson, Ma, and Harner 2004). (Pugh 2014, p.1) Fifty percent of Central Appalachian counties have only one hospital and 20 percent have zero (Appalachian Community Fund, n.d.). These statistics, while sobering, have been a part of Central Appalachian life for decades and are an image seared into the American psyche.
Recently the high poverty and low health in Appalachia has been increasingly expressed throughout the country among poor and uneducated whites. This trend has been accompanied by a desperation most starkly reflected in rising mortality rates among middle-aged uneducated whites, driven by preventable deaths such as suicides and opioid poisoning. Most notably, it is not minorities who have traditionally been discriminated against who are unhappy, but rather poor and uneducated whites who live primarily in suburban and rural areas in the heartland. (Graham and Pinto, 2016).
Explanations of poverty and ill health in Appalachia. Two primary models have been employed to explain Appalachian poverty and underdevelopment: the subculture of poverty, the and internal colonialism models. Each of these models was first developed in the context of underdevelopment in the Third World and applied by analogy to the Appalachian case.
Subculture of Poverty. The subculture of poverty model identifies the internal deficiencies of the lower-class subculture as the source of the problem. Oscar Lewis is the social scientist most closely identified with this model, and the most widely read exposition of the model applied to Appalachia is Jack Weller's Yesterday's People, which borrows an analytic framework from Herbert Gans. “Fatalism and religious fundamentalism developed to deal with the harshness of the land, the consequences of poverty, and the physical isolation.” (Elam 2002, p. 10). One area where this fatalism is most prevalent is in healthcare. “An equal barrier to controlling diabetes, Salyers [a former County Health Director in the region] says, is a deep-seated fatalism about both health and poverty. “They come in and say, ‘It runs in the family. I’ve known I’m going to get it. Just give me a pill.“ (Browning 2012, para. 12).
Internal colonialism. Helen Lewis and her associates have attempted a detailed application to Appalachia of Robert Blauner's model of the process of internal colonization of black Americans. Their narrative proceeds as follows: After outsiders discovered their region’s immense coal reserves, Central Appalachians were working the mines to power the electric grids across America at great personal risk (for the benefit of the greater society). Caught up in the social complex of the new industrial communities, many mountaineers found themselves unable to escape their condition of powerlessness ant, dependency. By coming to a coal mining town, the miner had exchanged the in-dependence and somewhat precarious self-sufficiency of the family farm for subordination to the coal company and dependence upon a wage income. He lived in a company house; he worked in a company mine; and he purchased his groceries and other commodities from the company store. He sent his children to the company school and patronized the company doctor and the company church. The company deducted rent, school, medical and other fees from his monthly wage, and under the prevailing system of scrip, he occasionally ended the month without cash income. He had no voice in community affairs or working conditions, and he was dependent upon the benevolence of the employer to maintain his rate of pay. (Lewis 1978, p. 41). Much has been written on the isolation of Central Appalachia derives from its powerful analysis of the destruction of indigenous culture in the process of establishing and maintaining domination over the colonized group. It has also performed a valuable service by focusing attention on the acquisition of the raw materials of the region by outside corporate interests and on the exploitation of the local work force and community at large resulting from the removal of the region's natural resources for the benefit of absentee owners.
A rich culture based on kinship, religion, fatalism and community pride. The traditional views of poverty-stricken Eastern Kentucky are contradicted by many who live in the region. As Walls and Billings (1977) noted: The traditional subculture of the Southern Appalachians should not be characterized as either a poverty subculture or as a peasant culture. The pre-industrial, pioneer way of life cannot be equated with a subculture of poverty as described by Oscar Lewis; there is no evidence that traditional mountain families felt helpless, dependent, or inferior.
To the contrary, careful observers have described this traditional culture as a driving force in
The lives of many mountain people. Reporting "an urge toward self-improvement" and "a great desire to amount to something" among Beech Creekers, Schwarzweller et al. (1971) observe that "the omnipresent dissatisfaction of Beech Creek people with their present lot, their inability to be satisfied with the present situation, in a word, their emphasis upon 'becoming' rather than upon 'being,' was a manifestation of their puritan philosophy."
Dealing with the realities of Appalachian life has also contributed to strong strains of community and civic pride among Central Appalachians. The region’s cultural folk art and music are key components of the American tapestry. This pride has been most famously described by Loyal Jones 1973 Appalachian Values: “We mountain people are the product of our history and the beliefs and outlook of our foreparents. We are a traditional people, and in our rural setting we valued the things of the past. More than most people, we avoided mainstream stream life and thus became self-reliant. reliant. We sought freedom from entanglements and cherished solitude. All of this was both our strength and our undoing.” Jones posited ten core Appalachian values: Religion, Independence, Self-reliance and Pride, Neighborliness, Familism. Personalism. Humility and Modesty, Love of Place. Patriotism. Sense of Beauty. And Sense of Humor.
The two types of Appalachians. The directly contradicting Jones view of Appalachia and the Oscar Lewis view both fail because they have tried to characterize all of Appalachian peoples as the same, when in fact they comprise two cultures, two impulses raging with each other. Helen Lewis appears to see a glimmer of the two subcultures of Appalachia. In her analysis, such institutions as the Appalachian family and church emerge as not simply survivals of an earlier traditional subculture but also as defensive institutions whose “closed” characteristics are in part formed in resistance to the process of colonization. By emphasizing such values as "equality, non-competitiveness, and family-neighborhood solidarity," the family and the church resist the social change that would integrate the region into the American mainstream. Family and church institutions, in particular, "became defensive and reverted inward in order to protect members from the sudden influence which came with the development of industrialization” (Lewis et al., 1973).
But why are resilience scores so high in Eastern Kentucky?
Eastern Kentucky was long home to isolated small farms which were virtually self-sustaining with primary sales through the burley tobacco program. In the early 1900s timber harvesting and coal mining became the dominant industries. By the 1990s all three of these economic engines had declined precipitously.
Kentucky Department of Agriculture responded to the decline of tobacco with a study of policy options for increasing value-added diversification (Worstell, 1996). This study noted that the most successful state programs have three common characteristics:
- An independent commission funding feasibility analysis, product research and organizational development;
- A minimum of $1 million per year to support research and development of value-added agricultural products, markets, and businesses;
- A responsive financing source (such as targeted bonding authority.
When the Tobacco Settlement provided huge yearly sums to Kentucky and 38 other states, Kentucky chose in 2000 to invest half of the proceeds in such an effort, today known as the Kentucky Agricultural Development Board. The results of this investment are seen throughout the state, but even the most elegant policy formulations will not work unless the correct foundations have been laid. The following examines the many underpinnings of resilience in Kentucky agriculture by exploring specific examples of resilience in Kentucky food and agriculture systems. The KADF found fertile ground for investment in Eastern Kentucky.
Results of case studies: do they support the eight qualities being necessary for resilient systems?
Case study 1: Bowling family in Clay County, Kentucky
There is a patch of farmland in Clay County, Kentucky where the same family has been faming since the land was settled 140 years ago. Today, the land if farmed by Will Bowling. With wife and other relatives, Will direct markets a full range of meat and vegetables. Like most resilient Eastern Kentucky farms, it was established along a river and includes bottom land and gentle slopes moving to steep forested mountains
Redundancy: cousin to cousin. Will Bowling's people acquired the land when Squire Hensley bought a sizeable plot in 1870. Will’s parents moved to the farm when one of their cousins decided to move on. “He was getting out of farming right as my parents were getting in.”
The farm has been owned by Will’s mother’s family for at least five generations. The farm that Will bought down the river is the other end of the old family farm, purchased originally by Squire Hensley in the late 1800s. Squire Hensley had seven daughters, and as they grew up, he gave them each a parcel of land to be able to start a life for themselves. Will was able to purchase the plot that he and his wife own from another cousin. “It got broke up in the second generation, but we have either end of it anyway...but it's mostly my cousins, distant cousins, that own all of the adjacent land.” Most of it is still in farm land, but most aren't farming themselves. The bulk of all of the old familial landholdings are producing corn and soybeans. The plots are leased out to yet more cousins while the landowner cousins have other jobs. They consistently get 180-200 bushels of corn per acre from this rich river bottom land.
Fifteen to twenty years ago, tobacco was the primary crop in Clay county, as with nearly all counties in Kentucky. Since the 1930's the tobacco allotment program stabilized the price of tobacco and ensured that farmers could receive vouchers and have more secure access to markets. As the voucher program was done away with, many farmers in Eastern Kentucky scrambled to find a means to make a living. Many of them, including some of Will's cousins, started raising beef. The Bowling family started growing beef as well because that is what they saw many people doing, but they quickly adapted their operation as their skills grew and they saw better markets for other types of livestock. When Will was a kid, he helped his dad grow tobacco, but almost every time he went out to work in the tobacco fields, he would get nicotine poisoning. It was naturally a better choice for him to concentrate on livestock and vegetables, especially with the tobacco program ending.
Complementary diversification. Many farmers transitioned to cattle to try to fill the void left by tobacco, but the Bowlings had land limitations. “It didn't take long to figure out that you weren't gonna make a go at it with 60 acres of pasture trying to run a cow/calf herd.” They started out trying to cut back on input cost to make up for the lack of land to support a sizeable enough herd. They got into rotational grazing, but then they also started experimenting with multi-species grazing. They began direct marketing in 2006 and went completely in with a fully diversified range of meats in 2011.
Ecological integration. This diversification of livestock was part of the land stewardship experiment that Will has taken a big part in conducting. “We tried to substitute biology and animal impact for inputs and tractor time.” In 2005, only the second year of having grazing animals, they broke the field up into paddocks and started a rotational grazing schedule. Their cousin had the fields broken into three pastures, but they broke them into considerably more. Generally, they move the cattle every day. The goats, because they aren't such a strain on the land and require less food, are rotated every week and a half to two weeks. Their goal in rotational grazing is to be able to reach a point where they don't have to bring any hay in from outside the farm. They've transitioned away from making hay for the cows in the past five years. In the beginning, they were feeding their livestock hay for 180 days out of the year. They had really dry years then and also didn't really know what they were doing. They overgrazed initially because they didn't know what to look for. “We were grazing just like everybody else around was grazing but they were also still feeding their cattle hay for 180 days, which ain't a good way to make money- I can tell you that real quick.” They started really looking into the economics of the operation and realized that if they managed in such a way that they could grow more grass on the farm, they'd be able to save all of the hay money and actually see a decent profit margin. Last year was a long winter in Eastern Kentucky and there wasn't as much spring grass growth as the Bowling crew would have hoped so they had to use more hay, but the year before was a marked improvement from when they had started. There was only seventy days of the deepest part of winter and the driest, hottest summer days in which they had to haul in hay from other farms. They've almost tripled their stock density since '04 when they started, but have learned how to manage their herds for maximum soil fertility and minimum negative impact.
Transformation and conservative innovation: diversifying into vegetables. Will’s parents began the switch to vegetables when they built a greenhouse and grow “tons of vegetables for our own use.” However, Will and Maggie were the first to try market gardening.
The first thing he did was design and build a highly economical electric fence setup to dissuade deer from getting into the garden and destroying the produce. “We've got stupid high deer density up at our place, but it (the fence) is going really good.” They were doing a bunch of elk trapping and collaring. They were sitting in a blind with other researchers on his property with thermal goggles on and he says he counted 22 deer walking all around his garden. Somehow, he hasn't had problems yet. He built a 6-foot-high fence with high tensile wire. Four strands of high tensile electric wire wrap along the six foot posts which surround the garden. Then mounted two lines of poly-tape, the kind he uses for livestock paddocks at a 24-inch distance from the fence at 36 and sixty inches. He nailed two fiberglass posts to each fencepost and put an insulator on it to build an offset fence without having to drive more fence posts into the ground. The polytape dances and shines in the wind and it works well to disorient the deer. At 36 and 60 inches, the deer get confused as to how to get past these moving lines and still clear the high tensile wire and apparently haven't succeeded in jumping the fence.
Their biggest obstacle right now is their inability to produce enough to meet demand. “It's blown my mind how receptive folks have been to buying food from us.” They aren't paying for any advertising but people are seeking them out. 75-80% of his customers can be tracked back to four or five other customers, who are very supportive and always recommend them. They've had folks drive 2-2 ½ hours to meet up with them. He sees this as a bad thing, because it means that there aren't strong farms where they are living. “You shouldn't have to drive 125 miles to buy from me.”
Complementary diversity. One of the other advantages that they have is that they are able to provide almost any vegetable one would ever want, they also mill cornmeal and of course have meat and eggs. “You can do your grocery shopping with us.” When it comes to vegetables, “We do about everything.” It's a 2-acre market garden. “We're raising everything you would expect to see in a well-stocked farmers market stand. Maggie and Will do a bit of wholesale tomatoes, peppers, and melons; things that they can produce easily and in large quantities while being able to take at least a small hit. They are thinking of giving up a few crops because they only have limited time and personnel and don't want to overextend themselves. They'll be transitioning away from sweet corn for instance because it takes up a lot of space for the amount of crop that they actually yield.
They grow mostly annuals, but Will and his wife Maggie have planted about 15 apple trees that they hope to be able to market in a few years and his parents have apples, peaches, and pears. Many of the perennials, such as his father's blueberry bushes, are mainly being used within the household but they are definitely looking in the direction of growing more such crops to market in the future. Two notable future perennial crops to will would be asparagus and rhubarb.
Diversity of markets. They have a really good customer base and getting rid of product has not been a problem so far. The biggest problem has been not being able to produce enough to meet the demand of their loyal customer base. They direct market almost everything. The biggest outlet is their online farm store. They update the store weekly throughout the season, selling both veggies and meat products. They have around 200 people on the email list who will make online purchases. The Bowlings have central drop-off locations throughout the area and their customers will meet up with them there weekly to pick up their produce. There are no minimums or limits on what people can buy. Some order weekly, biweekly, some spend $5, some spend $65. “A pretty good mix” he comments. They sell in farmers markets as well. Especially profitable is the Hazard farmers market.
They sell to a few restaurants as well as to Manchester Memorial Hospital. “We like to have a good mix of folks and a good mix of customers, it's what makes us more comfortable...to have a wide variety of folks purchasing from us rather than us just being tied to one market.” He would have a hard time sleeping so easily if they didn't have such a diverse marketing mix.
Locally organized and conservative innovation. Most of their clientele shops with them because it's local food. The local food movement has been late in arriving to Kentucky, but the last couple of years has seen an upsurge in people wanting locally produced, naturally grown food. “If you didn't grow up in a garden, chances are your grandparents gardened or something like that. For the most part, some people still remember what real food tastes like...they know what you are buying at Wal-Mart in February may look like a real tomato but don't taste like it.” There are also many local and regionally adapted varieties that can't be bought on the supermarket shelf. People recognize this and that leads to pretty enthusiastic support of locally produced veggies. Will doesn't solely grow heirlooms, however. If it makes sense economically to grow an heirloom, if it provides an appropriate yield and can be sold at a decent price, then he will naturally opt to grow a local heirloom variety. Their main motivation is taste. “A lot of the heirlooms, that's where they shine out.” but they also order seeds from Johnny's seeds, a company that is a national favorite for market gardeners.
Connectivity and innovation. Will gets a lot of information from the internet, but they also subscribe to trade journals and have a background in biology and research. He and Maggie also look at things that SARE has done and they also try to make it to several conferences throughout the year. They have a passion for learning. He sees how it also helps him economically to be connected to other farmers, journals, and association. “On this farm, there are no sacred cows.” he said, acknowledging that one of the things that leads to the farm's success is that no single production practice is beyond question.
Modular connectivity and local self-organization. Will feels fortunate to have the family farm to come back to. Having a community and family to come back to is important to him. He contends that most people around Eastern Kentucky also feel a sense of kinship to the land. Being able to make a living off the land or at least to provide enough sustenance to feed one’s family is a cornerstone of Appalachian culture. He sees this as a very important cultural characteristic and one that he sees only growing stronger in the future.
Health and resilience. Will does see that even though there are people from all across the economic and social spectrum who buy from him, but the one unifying aspect is that most of them care about their health. They also see a lot of people who have SNAP and WIC benefits coming to the farmers markets. He does acknowledge that there is a large portion of the population in Eastern Kentucky who aren't concerned with healthy living and that can tip the scales. “a lot of people who are keyed in on public benefits as a lifestyle aren't going to be as concerned with fresh food as a lot folks who aren’t on public assistance...those are the ones who are going to be gardening.”
Case study 2: Hoffman farm: All the components of resilience except redundancy. In the 1960s and 1970s, there was an influx of new settlers to Eastern Kentucky and areas throughout rural America to start life anew, to live simpler and closer to the land. Many of those who settled in Eastern Kentucky, a rugged place with limited arable land and economic infrastructure, didn't have the skill sets or abilities to make it. We set out to visit one of the few exceptions, a couple in Owsley county. The Hoffmans bought a 77 acre plot 44 years ago for about the price of a new car and have built a well-groomed and diverse farmstead in a little hollow in the poorest county in the nation.
Their house is remarkable even on first glance. They cut the logs and did the stonework themselves. We walked into the side door into the kitchen. They still cook on a wood stove and they have two taps in kitchen counter. One for well water access, and one for city water access. They have a centrally located fireplace that they only really use when it is extremely cold. Otherwise, they use a little barrel heater. They use solar heat for the water tank. The array is visible at the back of the house. It's so strong though that they have to cover a portion of it to keep from overheating the whole system in the warmer months.
Looking out over the 20 year-old blueberries and heavily laden fruit trees, the slow dancing multiplier onions and sweet corn, it's hard to imagine how rough and barren this land was when they got here. The place was so worn out by sharecropping and tobacco that there were places where weeds wouldn't even grow. The creek snaked throughout the whole bottom. The first thing they did was hire a bulldozer to reroute the creek so they could have some dependable drainage. This still can't keep the water from rising up the hill and wiping things out from time to time, their sweet corn has fallen victim to high water before.
Resilient goats. Across the road from the house is a barn where we are greeted by a herd of mostly Kiko, but some Nubian goats. The Hoffmans have milked Nubian goats for 25 years, and long had a feeder pig operation as well. Whenever a sow would birth a litter that was too big for her to be able to feed properly, Neil would milk one of the Nubian and bring the piglets goat milk in a little pan.
While most other livestock such as chickens and pigs have become increasingly unprofitable for small producers because of the ascendancy of factory farms, goats have been a stable and relatively profitable alternative. Neil and Denise started their meat goat operation with Boer goats, starting a meat goat association with some 25 area farmers. Boers, however, were horrible mothers in their experience. They would go out to graze and leave their young in the woods, completely unaware that anything had happened. Now they’ve moved to the Kikos whose incredibly high energy, they hope to temper by crossing with Nubians.
They walked us up the hillside behind the house to another little barn holding a few more goats that they needed to let out for grazing. It used to be a hog lot, and the little annex that was built there was originally used for farrowing hogs. He had 100-125 pigs a year, but again, the rise of mass processing and factory farms made it hard to do feeder pigs without contracts. The mid-level livestock dealers disappeared. He had loved raising hogs, his father had loved raising hogs as well as his grandfather, but as he said “You can be a good buggy-whip maker when the automobile came in, and it wouldn't make a difference, would it?” Their hog fields were very minimally secured. Hogs don't jump- so he only ran a single, knee-height strand of wire. Says he's never had any difficulty with losing pigs. One way to make sure is to keep them confined in a small pen with one wire at about nose height to train the piglets to be wary of the wire.
Ecological integration. The Hoffmans share a respect for the natural world and natural systems. We made our way along the flower dappled tree line to another pen full of baby goats, just old enough to be off the teat. As we neared, Neil pointed out Jack-in-the-Pulpit and other indigenous herbs. They make sure not to mow the wildflowers until they are able to go to seed. The Hoffman’s have put a lot into the soils to undo decades of mistreatment. Neil asked the old guy who lived here before when the last time was that the fellow had put lime down. His reply was “If God woulda wanted lime in that ground, God woulda put lime on that ground.” Any time you harvest a plant and remove it from the field, it removes nutrients that would otherwise be returning to the soil system. The job of the farmer is to be a patron to and steward of the soil. Without this sense of generosity and attentiveness, your soil is going to wilt to dirt and your foliage will likely follow suit. Denise and Neil preach this and have put somewhere in the neighborhood of 200 tons of lime down over the years. With the loss of farm infrastructure, it's getting tougher and tougher to bring in truckloads of soil amendments. With the end of the tobacco allotment moneys, much of the supporting agricultural infrastructure disappeared. The farm store, the tractor dealership, and so many other assets disappeared
Local self-organization: forming a cooperative with 200 other farmers. Their success in peppers led them to think the crop might work for other farmers. In 1984, Neil helped to start the largest producer cooperative in Eastern Arkansas--the Kentucky Mountain Farms Cooperative--comprised of some 200 area farmers who built a processing and storage facility. The Cooperative concentrated on peppers and cucumbers. This seemed like a conservative innovation since there was already companies contracting for pickling cucumbers and canning peppers in the area.
The Cooperative was profitable for many years, but an arrogant manager dismissed the marketing firm the Cooperative has employed since its beginning and did not have the ability to replace their connections.
The decline of the vegetable cooperative did not stop the Hoffmans. When tobacco went out in the 1990s, they were joined by many area farmers trying to diversify. One of the biggest obstacles was what Neil called the “Alls ya gotta do” crowd. “That was from my father. You'd tell him 'this guy's gonna do this'. His father would say 'yeah, yeah, aaallls ya do, build you a big hog lot, yeah yeah you'll see.” “Three years later, it was belly up.” Farmers accustomed to growing tobacco would treat other crops similarly. They'd cover the young seedlings, which would stunt them, because they were so accustomed to covering their tobacco. The Hoffmans never saw much competition with strawberries for many of the same reasons. Farmers aren't willing to invest the 14 months necessary to get a crop off, so they would opt for other more traditional crops.
Neil says that it took about four or five years from the end of the tobacco allotment program for people to transition to selling specialty vegetables. With so many people gardening for their own private consumption, and so many people switching to vegetable cultivation without any specialization, the Hoffmans felt like they were “trying to sell ice to the Eskimos” with conventional produce such as squash and tomatoes. Denise believes that the best thing to grow in Eastern Kentucky are high value specialty crops. They had grown Shitake mushrooms for a spell. They believe that coupled with smart crop choices, the best way to ensure resilience of CSAs would be to market to city centers or town in areas where there are professionals who have some sort of health consciousness.
This led the to one of the biggest commercial ventures that Hoffman farms embarked on—which would still be functioning if there was an educated farmer base. Around 2000, they met a man named Colonel Little. Colonel Little was a WWII pilot who adopted a Korean family and moved them to Beattyville. They figured out how to grow Napa Cabbage, Daikon, and Bok Choy to market to Lexington to sell in the Asian markets. They tried in the spring, but realized that it would do best in the fall. Some other farmers, Philip Combs and Joe Gragg, learned how to do it on a larger scale, were marketing to Georgia. The Hoffmans bought 100 acres of riverside land and were in production for ten years or so. Neil and a partner would run a distribution route of fall vegetables to marketplaces in Richmond, Lexington, and Winchester. Every Chinese restaurant that they would approach with Napa cabbage ended up being a client. They'd take 100 40 pound boxes out on the route and would sell it all.
This year (2016) marks the first in 23 that the Hoffmans won't be going to farmers markets. They are cutting back as they move into their late 60’s. Time to wind things down on the old homestead. Regardless, there's a nice little array of crops in the gardens below the house. Denise leads us to the strawberries. A little patch by all accounts, maybe 12 feet by 40. They'll still pull 5-600 gallons out of it. Even after the deer mowed a bit of it down back in October. They had been gone for a few days and the dogs opted to guard the neighbor's house instead of theirs. Now, there are ribbons of electric fencing surrounding it. Through the years, they've changed up strawberry varieties. The latest, Darselect, is a long-season variety that has dependable yields, rain downpours or not.
Conservative innovation. This is one of the few farms in Kentucky that can keep a fruit tree loaded and the berries healthy under threat of so many moisture-induced wilts and fungal infections. Fresh strawberries never have to be peddled too heavily, they are a rare and delicious enough find here that people usually come to the driveway and pick them up. They never take them to the farmers market except for the one time they picked 136 pounds in one day, they drove the bumper crop out to the Hazard County Farmers Market and were practically mobbed for them. Denise brought a little chilled bowl of them and passed it down the line of chairs for everybody. She said these were small and tart because of the weather, but they made you understand why people would be eager to drive across county lines through these sweeping hills to get enough to stock a freezer. They do a new patch every year, because after the initial grow year, yields drop precipitously. They'll plant Broccoli and Fall Cabbage for the cole crop rotation, and both plants serve to disinfest the soil.
The Hoffman farm doesn't shy away from using chemicals when they deem it appropriate. They came out and built their farm and home in a time and place in American history before many recent changes in our food system. There was no locavore culture when they started growing fresh, local produce. There weren't thousands of natural foods markets, or tens of thousands of health and sustainability enthusiasts. Naturally then, they don't subscribe to every tenet of the modern organic lifestyle. Neil believes is that the organic foods movement can be just as wasteful of resources and just as inattentive to the land as some conventional farmers. He recalls one time when a climber came to visit his table at the farmer's market. One of only three times or so in his career farming in East Kentucky, the climber asked if his produce was organic. Playing dumb, he asked, “What is organic?” “Organic is where you don't use chemicals.” But Neil remembers going to a symposium at Smith College. There was this overwhelming stench permeating the air. The dairy farmer he asked told him that the organic orchard nearby was completely doused every week with sulfur. He finds the organic foods movement to be anti-scientific, likening them to vaccine deniers. He mentions that though there are noxious synthetics, there are others that are chemical analogs to naturally occurring compounds.
Lack of redundancy. The only obvious area where the Hoffman system is not resilient is in redundancy. The Hoffman’s only daughter lives a couple of hours away and won’t take over the farm. Despite the jobs vacuum, it has been very difficult for Neil or Denise to find good workers. This is why they have been unable to scale up and won’t be able to keep the farm going when they quit. The Hoffmans have gone through a number of channels to find new workers from going straight to school agriculture programs, to asking everybody and their uncle via word of mouth. The best people they ever could find were older women. They went through a long line of young people who would make it just a few hours into the work day before getting sick or passing out, stepping all over the berries, or going through the whole field and only picking a couple of quarts. “Young people aren't very strong anymore.”
Health, poverty and resilience. In an area like this, Neil and Denise remind us that there have been multiple generations of people on the welfare dole. Generations ago, hill folk would work to grow much of what they ate. There are still many small food gardens, but recent generations have been disjointed from the land. Hot Pockets is a slur that is used to refer to young Appalachians coming to the farmers markets. They don't cook very often and don't know how to cook fresh foods. It's a soda pop and heat-and-serve food culture there, despite the wide availability of bonus food vouchers for buying fresh produce. Because of this, Neil and Denise have been sure to grow foods that are familiar and easy to prepare; fruit, tomatoes, sweet corn, green beans. Things that can just be eaten raw if need be.
When asked why there is so much poverty and bad health in an area where farmers are so resilient, Neil pointed to bad food choices among poor folks. Young people don't seem to cook, save for a small group of educated people who care about their health who take the time and effort to cook food. Denise also attributes a few other things to such poor health outcomes- a fatalistic attitude where people are too disempowered to take any action to change things for themselves. She tells stories of people who have diabetes and will talk about having it and not being allowed to drink soda or eat red meats but still having their carts packed with it anyway. She believes that sometimes the people just accept it as their unavoidable destiny to have diabetes, heart disease, or high blood pressure. Government programs--senior citizen vouchers, food stamps, and WIC vouchers all support local food production. There are usually just two vendors, including the Hoffman Farm, in the Beattyville market.
One of the biggest hurdles is to get kids in the area to enjoy local produce. There was a big problem of kids throwing away healthy foods when Kentucky schools started farm to school programs. The kids would rather pitch the wheat bread and other healthy options and go hungry. Owsley county school in Denise's opinion, is the exception, the kids eat the fruits and veggies. Part of that may be due to the fact that students have a hand in producing the produce at the school farm. There has been a generation that didn't learn to preserve food and farm. When the kids actually have a hand in cultivating the food or belong to families who grow a lot of their own food, they seem to be more interested in eating fruits and vegetables.
Though Neil and Denise claim to be calling it all quits, there's too much of a glint in their eyes and a fire in their belly to not be out there working on organizing something new. They look forward to the influx of Amish settlers to the area. The Hoffmans see the Amish as much like them, but with more children. They are a group of people renowned for their hard work, smart business sense, and social connectedness but functional autonomy, and. They believe that the rolling hills of Owsley and nearby Jackson county might see a rural renaissance of resilient agriculture.
Case Study 3: Owsley County students grow their own food. The interest of Owsley County students in healthy food is largely due to one person: Alan Taylor. Alan taught in the Vocational Agriculture program at the High School for 30 years, though is accepted a position as Principal late in his career to improve his pension, but he still maintains his family farm. Alan himself attended Vo-Ag classes in his youth while growing up on his father’s farm before becoming a teacher himself. He also helped establish the Kentucky Mountain Farm Cooperative when he was a Vocational Agriculture teacher.
Conservative innovation. Alan has always farmed. Like many of his generation, he got his start growing tobacco while still in high school. Up until the early 1990s, a government program controlled production of tobacco to make supply meet demand and keep prices high for farmers. Each farm had an allotment which stayed with the land when it was sold. This supply management program helped Alan earn enough to purchase his own truck, tractor and a fair amount of livestock before graduation. The elimination of the tobacco program subtracted $3 million dollars/year to Owsley county alone.
His current farming focus is much different, focusing on beans favored in the area like the Greasy Beans to tomatoes with real flavor like Cherokee Purple and a local favorite Hillbilly Eye tomato. To Alan, it’s a natural progression since the end of Kentucky’s tobacco fueled economy to move toward vegetable production. Alan has help from a former Vo-Ag student Nick Chandler. Nick is one of many of Alan’s former students to continue in agriculture in some way.
He began his teaching career part time as a substitute at the high school when his son began kindergarten allowing him enough free time as a single father to work. Taking over for a man named Jeff Silverman, it was likely a relief to both Jeff and the town. Jeff had, had a difficult time in Owsley county as both an outsider and a proud Jew. It’s hard to find anyone but white Anglo-Saxon Protestants in Owsley County. Sometimes everyone in a local store has blond hair. Jeff added fuel to the fire by being outspoken and often coarse. He earned a sour reputation with the community and his students that reached a climax when his house was burned down.
Ecological integration. Alan feels it is impossible for one vo-ag teacher to cover all the possible aspects from farm mechanics to agri-business--including marketing and business management.
Alan focused mostly on production, showing students how to be self-sufficient if they wanted to. This included how to farm the land, plant biology, soil health and with every new student a time to reflect on what they would do if technology was gone tomorrow. This last subject yielded interesting results, some students assuming they would still have a tractor in this theoretical “end of days” scenario. When Alan would ask about how they would find, or make, the diesel, students were troubled and unsure asking, “How would I work the ground?” Alan’s response was simply: think. His approach was always hands on, showing his students how to do the work with their own two hands illustrating different scientific principals in real terms. For instance, during a canning lesson he would explain osmosis as the sugars were transferred to the center of whatever fruit they might be canning that day.
In another lesson, he teamed with the school’s biology teacher to do an in depth lesson on slaughtering a hog. With the help of a teacher’s aide they were able to take high quality video of the entire lesson. With the help of his students they slaughtered the hog and went through every part of the body. The organs, bones, tissue and overall physiology of the hog. He took the opportunity to show students the heart, much the same size and dimensions as our own, to show them how a heart attack happens. He showed them the lungs which had filled with blood to illustrate how a smoker’s lung looks- dark and unhealthy. This video earned him the Kentucky Agricultural Teacher of the Year award.
Along with reduced employment and farms, infrastructure has declined. Where there were tractor and agricultural suppliers, there are none. Where there were three grocery stores in Booneville around the schools, now there is one that resembles a small convenience store rather than a town’s only grocer. As the economy collapses, so does the community infrastructure.
In response to these challenges local organizers have been doing their best to leverage grant opportunities and network within their own community to conserve resources and build healthier, stronger communities. Just around the corner from the school sits the Owsley County Action Team’s headquarters. The non-profit organization is one of many in the area that are tackling particular challenges, in their case they’re focusing on the technology gap and the obesity epidemic. The access to tech jobs has been critical to miners left behind from coal looking for work they can do from Kentucky.
Health and resilience. Owsley County is one of the unhealthiest counties in the country. Health is a growing focus for the community and the school system. Charlotte Thompson, the Food Service Director for the Owsley County School System is one who is combatting obesity in the school and community. Most recently she has been implementing both a summer feeding program for area youth and the Farmacy program through the local medical center, Mountain Comprehensive Care.
The summer feeding program has been made possible by grants to purchase two distribution vans and pays for the food that normally feeds 350 students, 5 days a week making 18 different stops around the county. Nearly 80% of Owsley students qualify for reduced or free lunch.
Charlotte always has something she’s headed to, whether it’s rushing to begin the circuit distributing food to hungry children, managing the grants for the farm to school program, or just the high demands of managing the cafeteria. The latter includes adjusting the menu to recent changes in federal dietary standards while incorporating farm to school produce. She does all this by working long hours and sleeping very little. It requires a particular finesse to merge a farm to school program with federal dietary standards. Corporate cafeteria food providers like Aramark make it easy by providing prepared meals that comply with the low sodium and whole grains required in the new federal guidelines. Today, cafeteria managers are required to send in their complete menus months in advance for approval from the government, making the prepared meals from large companies extra appealing. Charlotte, on the other hand, must consider the crops that will be available from their school farm or other local farmers later in the year, planning menus meticulously, calorie be calorie, to comply with federal guidelines. Perhaps this is why she has received national recognition for her work with the farm to school program.
Local self-organization. The farm to school program in Owsley County pivots around the 10-acre plot run by the vocational agriculture class. The school purchases everything grown from the farm, at or below market value and saving the school system approximately $50,000 a year. Furthermore, whatever the farm doesn’t sell to their own school can be sold to neighboring districts since it is GAP (Good Agricultural Practices) certified, a requirement for farms that sell to schools. The program has gone remarkably well with the farm producing up to 4 tons of food over the season, except one spring when flooding from the nearby river wiped out their entire crop.
In light of the limited participation of farmers at the Owsley county market one proposal has been to encourage more vegetable production with the creation of a new regional cooperative. This revived enthusiasm has been made possible by a few different variables. The construction of a new highway that would greatly reduce shipping time as well as a new industrial park paid for by the coal severance fund. The park has been largely underutilized with only one of the large industrial buildings in use. Alan isn’t very specific but assures us that people are, “very interested”, in forming a new vegetable cooperative.
In the past the idea and implementation of cooperatives has been challenging. The largest obstacle being the farmers themselves, used to growing tobacco and specific vegetable crops for personal use, many were unwilling to change. The difference now is simple; a genuine lack of options has made the notoriously stubborn farmer willing to work with what’s available.
Cooperation. The Kentucky Mountain Farm Cooperative, which Alan helped Neil Hoffman organize in the mid 1980’s, was a prime example of this problem of inflexibility. Originally developed to work with the large distributor Georgia Vegetable, there were demands on what crops to grow at what time of the year. Farmers started out willing to plant the required produce but after a few years of intermittently failed crops, instead of working with Georgia Vegetable to switch to something with a higher success rate. Many farmers left the cooperative. Those that remained chose to disband form Georgia vegetable and attempt their own marketing and distribution, which turned into more work than anticipated. As Alan put it, “Georgia Vegetable knew what they were doing. We didn’t.”
While these early vegetable cooperative efforts were dissolving, so did the sorghum and craft cooperatives which flourished in the county in the 1980’s. The craft cooperative served as a hub for regional crafts like quilts, birdhouses and sorghum. It was housed in a complex of three buildings that included storage of raw materials and finished crafts and a sorghum mill and continuous flow processing pan.
Unfortunately, they all burned down as the cooperatives were just picking up speed. Alan suspects arson, but it remains unknown what happened. To this day Alan receives calls requesting sorghum produced by the cooperative due to its high quality--a true testament to the potential of a new wave of cooperative work. Today there is a small sorghum press near to the school farm with students that are capable of preparing the sorghum and molasses without the aid of candy thermometers, a difficult feat according to Alan and an indicator of a new generation of sorghum makers.
Today, farmers are different and are facing different challenges of a changing economy as well as a changing climate. One longtime producer well known in the region, Bill Best, has necessarily begun to use hoop houses in the past few years and has decided he won’t be going back to conventional growing. Farmers who used to only grow peppers, cucumbers and watermelon are more willing to expand to brassicas like broccoli and cauliflower. These changes are being made without the help of a cooperative and many agree would be bolstered by the presence of one. Many also agree that a farmer’s market isn’t enough, but it’s a good start.
Today, even the local government and businesses are working together to financially back projects like the new farmer’s market which was a cost share between local businesses and a land donation from the school. People in this time of upheaval are seeing the value of cooperation. Though the number of farmers and craftsmen is small in the region, Charlotte, Alan and others in the community are confident in an agricultural revival of the region. Though they don’t believe it will ever replace the income from tobacco, they are determined to maintain the small stretches of land that families have been preserving for generations. Listening to Eastern Kentucky farmers, it is impossible not to see and feel the familial connection people have with the land they live on. Even after being gone their whole lives, some folks are eager to move back to the old family farm when the land becomes available. There is something intangible in Eastern Kentucky that keeps people here and manages to bring them back despite economic and social struggles of the region.
Case Study 4: Local self-organization of value-added processing. Adjacent to Owsley County, Jackson County was another of the eight counties which participated in the Kentucky Mountain Farm Cooperative. Jeff Henderson was a beginning County Agent then and organized county farmers to participate in the cooperative. Jackson county had been home to many of the 200 farmer-members of Kentucky Mountain Farm Cooperative which had a processing and shipping center in Lee County. Jeff was a young organizer then and has since committed his career to building healthy food systems in Eastern Kentucky, an area greatly in need of economic infrastructure. After the demise of the cooperative, with the help of Kentucky Agricultural Development Board, he facilitated creation of a value-added food processing centers near Tyner.
Tyner proper is only made up of a few buildings, just enough to signify the hint of a community. Three Baptist churches, a little pool hall, furniture store, and a little elementary school comprise the downtown. On the outskirts near where a new highway has bypassed the town, is the home to one of the most well developed value added processing centers in the South.
Accumulating reserves and infrastructure. The local utility cooperative, Eastern Kentucky Electric Power had purchased ten acres of old farmland to build a one-acre energy substation. The remainder of the land was open, unused pasture. The group building the food coop had known of the upcoming construction of the highway 30 corridor nearby, and asked the energy coop to donate some land on the back end of the property which abuts the new four-lane strip of highway.
With the all-metal roofed and windowless exterior, it looks like it could just as well be a farm storage outbuilding or an extension of the electric coop substation. Despite its nondescript appearance from outside, is a sophisticated inside. Hundreds of feet of drain piping were encased in the foundation slab. It's a lot easier to do bulk processing if the floor can be cleaned with a water hose and a deck brush.
Behind the building is an impressive farmers market pavilion, suited to host thirty vendors comfortably. From there, the ground starts to slope down and away to an acre and a half of vegetables. This small plot of vegetables is cultivated by county corrections, and saves the county $5,000 a year in food costs.
From the farmers market pavilion, another small building is noticeable. This was originally built to house a mobile chicken processing unit. The unit has a drain in the floor and bay doors for easy cleanup and movement of livestock and produce. In one end went live chickens, and out the other end comes state and USDA inspected, packaged, and vacuum sealed market-ready meat. The unit comes with two storage tanks for production waste outputs.
After there seemed to be a larger demand to do honey processing and the local USDA inspector refused to allow them to do both honey and chicken processing, it became home to honey processing equipment. Recently, however, demand for their help in chicken processing has grown again. JCRFC is planning to build a processing room for the honey under the farmer's market pavilion so they can move the chicken processing unit into its original shed once more. Chicken processing will produce more revenue once people begin to utilize the facility. Will Bowling plans to be one of the first to use it.
The road to diversification. Diversifying from tobacco and cattle is difficult for many farmers. As Jeff put it: “There's a certain comfort when that calf hits the ground in February, you kinda know where you are gonna take it to. You kinda know what you are gonna go through with the summer; if it's dry or if it's rainy. You kinda know what you are gonna get for the calf. Tobacco was the same way. You put tobacco in the ground you can treat it ever how you want to- mistreat it, and still you could have a crop to sell in November and you knew who you could sell it to. When you start growing vegetables or when you try to value add, there is a lot of uncertainty.”
When they did start to diversify, “We have farmers that want to grow two acres of cabbage and dump it at the door.” The committee is working to show farmers the importance and value of being able to process raw produce. The best way to teach sometimes is by showing, so the workers at the food center have been producing and marketing products. One of their better and simpler products is strawberry jam. They have all of the machinery on hand to create full-color labels and a whole array of packaging options. The label they designed is reminiscent of grandma's home, and looks like a painting you would find in a cozy den.
Another Jackson County Extension worker is the impetus behind this effort. She is Cathy Howell, architect of the dream (or nightmare, as she jokingly refers to the project). She is the SNAP outreach coordinator and is one of the people that have been key to turning the food center into a community hub. With her dedication, Jackson County has been able to cultivate some of the most well attended and diverse farmers markets in the area. There are five days a week where farmers can sell their produce in three locations with 21 farmers who sell in county markets. She's run the farmers market for about seven years, and loves it. “We probably have the best farmers market in the whole state,” she beams. The surrounding community is enthusiastically supportive and she gets onto the radio every market day to let people know where to look and what's being offered. Because it's a small town, local media of every type back them. In addition to radio, the local newspapers advertise all of the farmers markets and outreach events.
They use WIC and senior vouchers through SNAP at their farmers market, but they have many more people in need of food assistance than they have federal voucher money for so they apply for grants as well and print their own vouchers up in their office. They are the highest-ranking county for redemption for senior citizens vouchers and are third in the state for WIC recipients.
Farmers market organizers wear badges to help people along and do cooking demonstrations to teach people how to prepare fresh produce. Last year, they didn't have the machinery to process food stamps, so there was a slump, but the first year they started accepting food stamps, participation tripled. One of the new programs being developed in Kentucky is the Farmacy program which is has been so helpful in Owsley County. In Jackson County, doctors issue prescriptions for fresh produce for patients with a variety of ailments, from high blood pressure, to diabetes, to obesity and the like. Patients then take these prescriptions to farmers market and exchange them for fresh fruits and vegetables. This program is in its infancy and after this pilot year, doctors will assess whether or not there were noticeably positive health outcomes.
They've been slowly building reserves and infrastructure in the farmers markets such as price signage and shopping bag racks to improve the overall attractiveness of the markets to consumers in the area. They use income from vendor fees to purchase materials for all of the vendors.
Extension and JCFRC has also worked in local communities to change food culture and market possibilities. Cathy mentions how fresh veggies are visible first-off when you go into the local grocery store. Where lard used to take up a wall, it's been relegated to a single shelf. There are many more farm-to-school and farm-to-institution programs, and there are produce buyers approaching extension services. One such person is looking for 5,000 pounds of cabbage. This is a large order, and there's still a lot of teaching and convincing to get local farmers to meet the need. Farmers are hesitant to take risks. There are a few people that have offered to grow cabbage, but many of these other farmers are waiting to watch and learn from their mistakes. The early adopters will do an acre or two. They'll likely make mistakes. The farmers waiting in the wings will roll out ten acres and do it right the first time—illustrating the conservative innovation of the most resilient farmers.
Case Study 5: Agritourism and cattle on strip-mined land.
Breathitt county was another of the eight Kentucky Mountain Farm Cooperative counties. Land there is steeper than the rest of the region. Farming isn’t easy here. The mountain ranges offer few places for farming among the steep crags, bluffs and natural bridges. Many families, however, have found ways of making their farms survive and thrive. When one visits such resilient farms in the region, there is a unique perspective often unheard in the heated debate about mountain top removal. Peggy Conway and her son Chad have seen it all, through their own eyes or the stories of Peggy’s grandparents who first settled the land. Though denounced as devastating by many outsiders, coal is a source of prosperity for families like the Conways who established themselves before coal came to their region, settling large tracts that would one day be mined.
Tranformation in face of ecological disintegration. The beauty of the mountains makes it easy to see why so many people are against strip mining. The Conways acknowledge that a lot of people are against coal, but contend they wouldn’t be where they are today without it. In fact, they might not even be there at all. The stimulus from coal extraction has enabled them to build houses, buy land, repair damages and make investments like high tunnels to increase productivity.
The Conway family’s land was mined fairly recently. The mining was completed in sections, each mountain taking about 10 years to deconstruct. Through the 70’s, 80’s, 90’s and the last section leased from 2007-2015. The money has brought them several hundred acres of grazing land in the last few years and delivers enabled them to improve their farm. Many families around them have mined coal and have prospered in the same way, accumulating tractors and equipment so that they could afford to enjoy farming. Without coal it’s unclear what, if anything, would have provided such an economic stimulus to the region. Coal income allowed farmers to grow their operations over decades in ways that before were impossible. If their mountains had been sand, limestone, or some other less valuable stone, where would eastern Kentucky be today, Peggy asked us.
Peggy contends that over the past few decades coal companies have improved their practices “100%”. Before, she says they either “didn’t realize or didn’t care about the messes they made.” Erosion was out of control in the early 1900’s, but today Peggy feels they’re planting trees quickly enough to replace the forest. To her, things will return if you plant them, but much was lost as we discovered how to mitigate the damage. In the meantime, she contends lots of activists who don’t want anything disturbed aren’t listening. “It does grow back if you give it the opportunity, if you do the erosion control.”
Their farm is perhaps a testament to that, its grazing capacity has grown considerably due to the grasslands established on the strip mined land. Cattle have been a mainstay of the farm from the beginning. The family has, at least, always kept a few dairy cattle.
The Conway family established a homestead here around 1865 as a land patent. Its borders were established by foot. Peggy’s grandfather walking the surrounding mountain tops, only stopping to place a boundary marker if the distance was great enough or if he met another homesteaders border. The acreage was once larger. It has been subdivided among heirs or sold by necessity in tough times. When we visited in Jun 2016, it was 350 acres, some of which Peggy and Chad have bought back from Peggy’s brother and ex-husband as well as a recent 100 acres from a coal company. The new 100 acres is a mined mountaintop restored to grassland for cattle, like all the others that surround the farm. The homestead has changed dramatically over the years from its humble beginnings.
Beginnings: an inn on the main road. The main house today is itself completely different from when it was finished in 1905. Built as a kind of bus stop for travelers, the home used the be a “dog trot house”. It featured an open-air hallway in the middle of the house, dividing both the first and second stories, split right down the middle. Each of the numerous bedrooms had its own fireplace and at least two beds. People were often coming through to stay as they traveled along their road, which used to be the main road to Lexington and beyond. No matter what time of day or night, neighbors from around the countryside would stop in to rest. Peggy recalls a story her father told of waking up to find strangers sleeping with him for lack of available beds.
A few steps away from the expansive root cellar is another cellar buried deeper into the ground with a covered porch on the top. It is the old ice box that her father and grandfather would fill by pulling chunks of ice from the river by mule. Filling the cellar all the way to the back, each chunk was packed with sawdust to keep the ice longer.
The Conway family farm has been a source of sustenance for neighbors for over a century. One peak was in the early 1900’s. The road past their house was paved and became the main route into and out of the region. Along with the busy new road, coal mines were popping up within reach. Peggy’s grandmother would ride horseback to nearby coal camps to deliver eggs, chickens, vegetables, apples or whatever they could raise on the farm. They also built a roadside stand to sell to travelers and neighbors. As the farm grew they planted more apple trees, overtaking the yard extending from the back door for an acre or more. Around the house they built the facilities they needed for larger equipment and diversification like animals.
Chad works full time for University of Kentucky Extension, helping run the county farmers market in addition to his other duties. He’s pretty sure that they could make it off the farm alone but he doesn’t want to risk it while his work with Extension provides such good income.
Transformation to agritourism. After Peggy was grown, business dropped drastically for the farm stand and inn when a new highway was built bypassing their farm. To attract customers to their now isolated farm, they started a program called Farm Days and later began using platforms like Facebook to sell their produce and promote themselves.
The Farm Days began in 2001 when Peggy’s dad wanted to diversify the farm to include goats and participate in the growing agritourism industry. Today they host about 1,000 people per day for two weekends a year with their highest attendance at 1,400 people. It takes between 15-20 workers to operate the farm days, some people volunteering while others are paid. Five dollars at the door covers everything including pumpkin painting and hayrides where Peggy, Chad or one of their tour guides will talk about the history of the farm and coal mining in the region. The farm days were free, Chad and Peggy making money from decorations like pumpkins and corn stalks. People started suggesting they at least charge for the hay rides, saying they were the best around. They offer a petting zoo with rabbits, cows and goats but they don’t offer things like live music. It’s too much of a hassle and it would take away from the education about reclaimed land from coal mining and things like their goats, telling children about different cultures that eat goat’s meat. As they added attractions, each a different charge, five dollars at the door made it easiest for everyone to enjoy the event. The weather for farm days is consistently unpredictable, some years they have to serve popsicle because it’s so hot, others they have to run a heater for those standing in line. People keep coming back though wanting to learn about the third generation farmstead in Eastern Kentucky.
It’s hard work every year, dipping into Chad’s vacation time to get the farm prepared with hay bale forts, purchasing bulk pumpkins for the pumpkin painting or preparing the corn maze. Over the years they’ve reduced their work by buying pumpkins instead of growing them and converting a whole field into parking. Every year Chad and Peggy both say it’s the last, but they can’t quit. Though they only have the workforce to teach K-1st grade, when they see the children’s reactions, hearing what they’ve learned, it’s impossible to resist. They try to find quality staff to teach the children, like a retired school janitor who loves the kids and is used to large groups. Every year, something changes to make the weekends better and more profitable for the farm.
Agritourism is a growing industry that remains uncommon in Eastern Kentucky, but they do have a few neighbors hosting similar farm days. So far, they haven’t been much competition as the same visitors will go to all the farm days. Whether it’s their Holliday Farm or their neighbor White Oak Farm, people just want to get outside on a farm and enjoy the hayride. Peggy and Chad like to go to other farm days when they can, they enjoy seeing other farms and not having to work so hard.
The farm offers tours to local schools and sells them produce through the Farm to School Program. They’ve undergone the GAP (Good Agricultural Practices) certification in order to sell from their concession stand during far days as well as selling to schools. The Farm to School Program has been active in purchasing produce as well as bringing students to the farm to learn. The children get to see the farm they’ll someday be tasting corn, watermelons, tomatoes or squash from. Sometimes Chad will pick up excess vegetables from other people in the community, selling to the school for them. Many farmers don’t have the equipment to process the vegetables or the desire to gain certification through the FDA.
Complementary diversity. Chad has also been expanding their acreage to include more grazing land for cattle. Chad now is using the acres of grassland they’ve accumulated over years of strip mining to run 40+ cattle, up from 15-20 head. Over the years while they had their own land leased to coal companies, they would lease land back from the same companies for grazing. It’s been a steady business and Chad feels like it’s something he could retire on, if prices stay high on beef. He and others are amazed at how well the cattle do on restored grassland, with the dryer climate they tend to suffer from less infections and parasites. Though it’s great rangeland, he admits it has water issues and is admittedly worthless as tillable land until more soil builds up. The water problem is only mitigated by the ponds that sit atop the mountain left by coal companies.
Farming in Eastern Kentucky requires creativity and trying new things depending on how the land reacts. Every year the Conway’s are planting new varieties and new crops, some of which will fail in their unique microclimate. Unable to grow corn in large strips like farmers from the Midwest, the Conway’s have grown corn only in small plots, if at all because their fields aren’t connected or large enough.
Health and resilience: some have lost contact with the land and real food. As generations have passed, there have been times when few people were interested in their produce, only an older generation returning for the fruits and vegetables of their youth. Today, there is a resurgence happening, younger people with education are coming to them, interested in their goods.
There remain Eastern Kentuckians who rarely purchase or eat fresh vegetables and as Peggy remarks, rarely drink water. Her time working in the school gave her an insight into how people laid off from coal mining jobs use their benefits. A group of people whom Kentucky has become known for in recent decades, a culture of people who were left behind when their coal was gone. Where there was a pay check and a wage to support a family, now many turn to drugs, or hawking goods in order to sustain a life in the mountains. Some have no interest in using their SNAP or other government benefits to buy foods like Peggy and Chad produce, opting for prepared foods. To Peggy, farming is about passing on knowledge of food to future generations as well as a connection to the land. Those Kentuckians who have lost contact with the land have also lost contact with the food of their ancestors.
Case study 6: maintaining diversity the Best way
Of the eight qualities of resilient systems, diversity is considered the most basic by some. Preserving that diversity is the focus of one of Eastern Kentucky’s best known farmers: Bill Best. AS far as England, France, Germany, the Netherlands, Canada, Poland, New Zealand and Australia people know about Bill Best. Particularly benefiting from his work are the local Appalachian people, including the Cherokee nation. The people are all reaping the benefits of his business of propagating heirloom vegetable seed. The Cherokees are recovering many of their native seeds from Bills collection, recovering their own history seed by seed.
Redundancy. At 80 years old, Bill has spent his life growing vegetables of all kinds including beans, corn, tomatoes, potatoes and others. His first and most fond memory is picking beans with his mother at two and a half years old. Today, his great grandchildren help him sell produce at the farmer’s market. Bill began making a name for himself as a farmer in 1951 by setting a new record to become the North Carolina Corn Champion. He set this new record at the age of fifteen by producing 18 more bushels than the last record setter and held that spot for 19 years. He was taught to farm by his mother and father whom were both excellent growers. His father who attained a 7th grade education was very scientific, taking notes and testing new ideas all the time. His mother, a high school graduate, was “more traditional” than his father, taking ideas and practices that she had learned from others rather than testing every practice herself. Bill ended up following his mother’s practices more than his father’s saying that his father’s methods were, “only as good as they went”. It was from his mother that Bill learned to save seeds, to look out for mutated plants and grow them next season to test out their genetics.
Conservative innovation. Though he leaned on his mother’s farming practices, perhaps it is his father that shines through in Bill’s innovative approach to life. An unquestionably unique man, he confesses that he is both blessed and cursed by chronic multiple interests. Though vegetables have remained a constant in his life, he spent 40 years teaching all kinds of classes at the local Berea College. From modern dance which is his master’s degree, to biology and sociology. An avid woodworker with his son, he designed and built his beautiful A-Frame home and multiple outbuildings for storage, a professional grade wood shop, and even housing for interns of the farm. Near the woodshop there is even a portable sawmill and Virginia Tech Solar Dryer which he uses regularly with his grandson to process and dry timber from their own land to build houses and unique furniture.
Bean diversity. Of all his varied enterprises, Bill is best known for his beans. With over 700 varieties in a chest freezer meticulously labeled and stored with the help of his wife, he’s been on a mission to restore the heirloom bean with its rich genetics to Kentucky and the world. Many of his beans were grown in the region by native American thousands of years ago and Bill contends that, “if they were good enough for the Indians then, they’re good enough for us now” with their high nutrition and regional adaptation. His life’s mission to restore genetic diversity to our seed supply started early and has developed since the year 1963.
It all started when he planted his first garden away from home. After living in dorms around the university during his early employment at Berea college in 1963, he purchased some land and a home just out of town in Jackson County. As Bill recalls, they went to the farm supply store and purchased a variety of conventional corn, okra, potatoes, tomatoes and Blue Lake green beans. Unaware how much agriculture had changed, Bill expected average to good results from all the varieties they purchased. All were indeed satisfactory except for the green beans that he had purchased which were hard and without much flavor. He shared the problem with his mother over Thanksgiving that fall and she gave him her own heirloom seeds from the deep freeze.
Bill’s mother--like many women of her generation and since agriculture began--was the primary care taker of the garden, especially saving seeds and selecting for valued attributes. According to Bill, it’s not uncommon to find heirloom seeds named after women, “Aunt Bessie’s Beans”,” Margie’s Tomato”, and so on. The seeds Bill received from his mother changed his whole perspective as a farmer to growing food to please himself before anyone else. It was clear to Bill that the beans from his youth were far superior to the commercial varieties like the Blue Lake, meant to be machine harvested and picked before the vital proteins and micro-nutrients develop.
He is adamant about the nutrition derived from a fully developed bean. The unique flavor and texture of regional favorites, including the most popular Greasy Bean, far surpass the increasingly common tough Half Runners and Blue Lakes that have begun to be labeled as heirlooms because of their age rather than their lineage. To Bill, mislabeling a bean with minimal nutritional value that’s intended for harvest by machine as an heirloom is nothing short of “sacrilegious”. It simply doesn’t meet the requirements of a carefully chosen plant, picked by a watchful eye and carried like a family treasure to nurture future generations. To Bill, the appearance or flavor of any fruit is secondary to the nutrition and health to be gained from eating it.
With some exasperation, Bill recounts a story to explain his strong position. It is the story of an agricultural conference he attended when Berea college hired a new president. The new president, unfamiliar with agriculture, took advice from around the world about how to run the Berea agriculture program. On the last day a banquet was held where Bill recalls some peculiar green beans he attempted to eat. Nearly neon green, impossible to cut even with a knife and without flavor, Bill noticed that no one else had eaten their green beans either. An avid bean grower himself he was naturally unhappy and puzzled about why the college would purchase such inedible beans. It wasn’t until years later as Bill was presented the Keeper of the Flame Award from the Southern Foodways Alliance that he shared his story again of the green beans. He was quickly met with laughter from a group of professional chefs. They explained to him that green beans are considered a garnish rather than a nutritional food to eat. Bill’s mission is to create an antidote to the protein free garnishment green bean, the lycopene and vitamin free tomato and the single seed solutions manufactured by companies like Monsanto.
Local self-organization. Tomatoes were what started Bill in commercial farming. He got a contract selling tomatoes to a local company. He brought in pallets of beautiful vine-ripened tomatoes and the buyer cursed at him. He had expected Bill to bring him a green tomato that could be gassed when they were ready to be purchased--the “ship green tomato” of our modern age. Since that interaction Bill says he’s never sold a green tomato for shipping. He chose instead to focus on vine ripened, flavorful tomatoes to sell to local restaurants and markets.
After being dismissed by the produce purchaser, he was able to find a cooperative in Monticello that would purchase his vine ripened tomatoes. Selling for .15 - .16 cents a pound, it wasn’t a great money maker but with 13,000 tomato plants in the ground, he had to sell in bulk to someone. During the time he sold to the cooperative, he started the Berea farmers market 30 years ago and helped started the Lexington market soon after. Bill ran the Berea market for 30 years, now it’s run by a group while Bill remains involved as a seller. As for the Lexington market, he is the last surviving member of the original group. Today, he makes an average of $2.50 per lb. for his tomatoes which makes possible the giant high tunnels around his property that cost approximately $5,000 each.
Conservative innovation. Bill is notorious for starting things, including a farm run by Berea college students during his days teaching. They grew sweet corn, tomatoes and potatoes and sold off the side of the road and to the local cooperative in Monticello that was purchasing Bill’s tomatoes. According to Bill, the students that worked did very well for themselves.
Though the college farm was profitable, and Bill’s tomatoes were still selling at the Monticello Cooperative, things were changing. His children moved out, they sold the cattle they had, he attained his masters in Modern Dance, Doctorate in Appalachian Studies, a Bachelors in Biology and naturally his circle of influence was changing. It was during this time that beans became increasingly important in Bill’s life. As he talked to more people at farmer’s markets, sharing the small surpluses from his own garden, people really liked what he was growing. They also liked his mission of preserving and spreading the seeds across the country. They shared his resolve. Bill became known for his seeds, giving talks over the years in several states including Ohio, Virginia, Indiana and Kentucky which hosts an annual seed swap drawing 200-300 people from as far away as California. Bill didn’t start the seed swap, but he has remained the foremost advocate for Kentucky’s most precious beans.
Perhaps one of the more important stories that Bill keeps is that of the Native American beans. His own story with Native Americans is long and develops over time as trust was built with the communities. Unfortunately, his story begins much like all his other stories, with an acutely sour start that only increased the resolve of his life’s mission to transform modern agriculture.
While attending an Appalachian studies conference, Bill attended a seminar on the Cherokee and was intrigued by what they were doing and their history of farming. Soon, Bill went to the extension office covering the Cherokee territory to ask about finding people in the community who had heirloom seeds. Again, Bill was laughed at and told that Extension was trying to, “get rid of that stuff”, in favor of the more modern, machine harvested, nutrient empty Blue Lakes.
Since that fateful day Bill and the Cherokee have become closer, sharing their seeds as well as their struggles and successes. Over the years Bill says, “The Cherokee started contacting me for their seeds.” They were searching for something better than the commercial varieties they were sold. In particular, they share a growing commitment to health through nutritious food to overcome social epidemics like diabetes or obesity which plague many reservation communities. Often without much access to fresh fruit or vegetables from markets, local production of nutrient dense food is the most reasonable option for most.
Growing new varieties by isolating new genetics and reproducing the seed to send back to Bill, because as he put it, “They’re into it pretty big time”. Bill also reminds us that beans are one plant that will likely never be fully tamed by scientists because it’s so prone to mutation. In fact, one of his most popular beans is the mutant Greasy Bean that they still grow today!
Conservative innovation. Bill used to have his 10-year-old neighbor plow the fields. As the years passed the boy grew up to become a local minister and naturally he wasn’t tilling Bill’s fields anymore. They stopped using horses when the boy stopped coming because Bill isn’t dead set on using old methods for the sake of keeping them around. This is in large part why they began using high tunnels, drip tubes, or plastic mulch along their rows.
Bill began using the drip tape when it first came out in the mid 1980’s and started using both drip tape and high tunnels because of the research that Bill had read about them. People suggested they were useful in growing vegetables and Bill was willing to take the risk. Since that time Bill has expanded to four tunnels. His high tunnels and a small greenhouse where he starts all his seeds are heated by an outdoor wood furnace that pumps hot water into the spaces over the winter. He used to have the woodstove indoors, but found it to be too smoky in the same room he was sprouting seeds.
Conservative while innovating in tomato production. As we walk into one of the high tunnels, we see the plants are already mature, tomatoes ripening daily of Vincent Watts, Cherokee Purple and Yellow Germans. Some are a light pink, others more orange and plenty are still green. All his tomatoes are grown in high tunnels. Planted directly into the soil, he uses what’s called the Florida weave to keep them off the ground. With tall, 8 foot stakes that he and his interns use to string tomato twine, weaving the twine between the poles with tomato vines nestled within the weave. We notice a small concentration of aphids and their eggs on some of the plants. He tells us he has been using ladybugs from Arbico Organics and they’ve been working really well. Though, now he wishes he had kept a few more back after releasing upwards of 500 at a time. A few rows down are some cherry tomatoes about to ripen all at once. Though he doesn’t normally grow cherry tomatoes, he’s growing some Sungold because his son brought him starts to try and they seem to be doing extraordinarily well. Up to now he had been using Miracle Grow to fertilize through his drip tape system. He uses it mostly because its locally available and easy to find. As he inspects the leaves more closely, he’s pretty sure there is something else he needs in the soil, affirming he would test the soil in the fall and add some aged horse manure that is sitting on his property.
Horse manure is easy to come by in Kentucky, and an effective fertilizer for any farmer. Luckily, most of his crops don’t require much fertilization. Beans generate so much nitrogen in the soil, he has never had to fertilize them but remarks that he would if the soil begins to need it. He also benefits from the mineral rich knobs that surround his valley. As rains wash down the long slopes they pick up minerals and other nutrients for his field crops and the cover crops of rye that lie where he used to grow so many tomatoes years ago.
Whether it’s a small school garden or multiple acres to grow for the cafeteria, Bill doesn’t see how else we can re-educate ourselves fast enough to manage population growth and subsequent demands for healthy, nutritious food.
That’s why Bill has made it his life mission to preserve genetic diversity and to teach people how to do it themselves. He still feels like it is better for a child to watch a seed grow than to navigate apps on an iPhone. He has done his best over his life to open his farm to his children, their children, and whatever child wants to come see plants grow. Bill knows how important it is as he remembers his own childhood, in the sun picking beans with his mother, discovering life’s simple and delicious pleasures.
Case Study 7: local research and demonstration for resilience
All the resilient farmers of Eastern Kentucky praise the contribution of the main agricultural research facility in the region: the University of Kentucky research station at Quicksand, Kentucky. It’s on the flood plain above the North Fork of the Kentucky River, high enough to avoid most flooding, but not all.
The research station sits on an easy slope, stair-stepping down towards the river with a final steep grade dropping into the river. The river is lined with some trees, newly planted fields are interspersed with old plantings. Near the entrance sits the brick building where we expect to meet the researcher most mentioned by Eastern Kentucky farmers.
Shawn Williams directs all the Quicksand food production programs. He has clearly spent his years as much in the outdoors as possible, his wrinkles deep set by the sun around his persistent smile. A friendly man he’s eager to take us around to show us the research plots and explain the trials they’re conducting now as well as the history of the land itself. He has greenhouses and shade houses and research plots filled with thriving blueberries, black raspberries, a range of cucurbits, rye grass, hazelnuts, and giant trees dating back to the original saw mill days. Each of these plots, even the ancient trees, has a specific purpose for Shawn and for the community he’s been working to help for many years. The historic buildings of the research station make it a popular place for high school and wedding photos, but Shawn focus isn’t these buildings. He’s working to empower the people of eastern Kentucky to grown their own food with few pesticides, and relevant local knowledge to develop and share the strongest varieties possible.
The day we meet Shawn he’s standing beside some large equipment to plant variety trials. He has people coming out for a farm day soon and wants to get some cover crops in the ground to illustrate a no till method as well.
Near to where we’re standing are two high tunnels. Neither of them have crops in them right now but Shawn explains they’ve been tremendously successful, particularly the smaller of the two which features a low pressure, gravity fed watering system. This watering system also features gutters along the side of the high tunnel to collect rain water so they aren’t reliant on municipal or otherwise pumped water. Shawn is extremely enthusiastic about this, highlighting the success and necessity in arid or remote parts of the world that need systems that aren’t intensively reliant on water. The low pressure water is sent into drip tubes below the soil to provide water directly to the root bundle rather than risking evaporation on the exposed surface. The ground in Shawn’s high tunnel has a very slight, almost imperceptible, slope that draws the low pressure water to the end of each row. He has had no trouble with over or under watering any of his plants. He remarks that even in other high tunnels with the same low PSI that a greater slope is OK, that people have had uniform water saturation even to the end of their high tunnels of greater length up to 90 feet.
As we continue on our tour, the next plot is the swath of blueberry bushes sitting to our left, slightly uphill following the easy slope of the hillside. They’re covered in length by a fine white net intended to keep the birds out. As we peer in, the blueberries are bursting with ripeness, some feature large, sweet, disk-like berries. Others are clustered together, smaller and are more tart.
These blueberries are part of a project to help track the spread of a newly introduced gnat like insect that differs from the common fruit fly in an important and significant way. Its mandibles are serrated and can therefor cut into the flesh of a ripe berry to lay its eggs rather than waiting for a rotted, open wound. This is particularly challenging for Kentucky growers as there are no known organic treatments for the pest, only a pesticide. Nor are there sufficient predators to control the population in the existing ecosystem. As Shawn points out, even if they release the wasp that would target the gnat the wasps wouldn’t eliminate the problem, they would only reduce the population. In response to this challenge, Shawn and the state entomologist have teamed up for an innovative solution on Facebook to report the first sightings of these insects. To do this, Shawn has set up a trap within the blueberries and checks daily. He has yet to spot one but expects it any day as the berries continue to ripen beneath their mesh shroud.
Once the gnats arrive, the only known solution is spot treatment of pesticide to stop the infestation. This last fact is why the Facebook group is so important. Shawn hopes that through early notice that farmers will only spray their crops when they have to, rather than spraying too early as a preventative measure or too late and missing their crop. The other solution he suggests is planting only blueberries that set early fruit to avoid the gnats and pesticide use almost entirely.
He then tells us about a group of blueberry growers in eastern Kentucky that he is concerned about. The growers have formed a kind of cooperative to provide organic blueberries for a buyer in the Midwest. On the surface it’s a fine enterprise, high value crops to a reliable buyer. Except when it comes to the localized issue of these new gnats. The growers have agreed to plant more blueberries to satisfy the needs of the buyer for the future but Shawn isn’t sure what season the blueberries will ripen. If they are early varieties like what he’s growing on the research farm, he feels they’ll have good success. On the other hand, if the buyer insists on mid-summer or late season variety, Shawn doubts their ability to produce truly organic berries, he just doesn’t think it’s possible. He highlights the necessity of people to be aware of their particular climate zone and the particular opportunities and challenges within. In this case, Kentucky seems on a map to be an excellent region for blueberries of most any season, if you don’t know about the gnats.
Ecological integration. Shawn is of the mind to work with plant varieties that work with Kentucky’s climate and its pests both new and old. This brings us to both the hybrid hazelnuts beyond the blueberries, surrounded in their own mesh enclosure and the nearby cucurbit varieties that are planted within rye grass.
A long line of cucurbits of varying maturity, each has been planted at different times and are of different varieties to see which are most susceptible or most resistant to Kentucky’s seemingly inescapable leaf blight. Whether the blight comes early or late, Kentucky is notorious for it and Shawn is searching for the best solution to avoid excessive pesticide use while maintaining high yields. The cucurbits are planted on black plastic, tucked into the dirt along the rows. Shawn likes the plastic, it keeps the weeds down and maintains moisture in the soil. However, the problem he is having is with the rye grass surrounding the plants. Planted last fall, the winter was too warm to kill the grass off completely leaving the ground covered with mature rye grass that towers over his smaller cucurbits. Fortunately, the blight has yet to show itself, but Shawn is prepared putting out plants regularly to see what season is truly best to plant and exactly what varieties will perform under pressure.
Nearby the hazelnuts sit surrounded in a tall black plastic fence made of one inch squares to keep the deer out. In use for three seasons now the plastic is holding up well, only requiring patching occasionally along the base where groundhogs, raccoons, or other small critters have tunneled under. In the past, Kentucky’s hazelnuts have been nearly wiped out by a disease causing a massive reduction of native varieties that have been unable to recover to previous population densities. This new variety is a hybrid that is showing promise against the disease.
The square black mesh protecting the hazelnuts is one of many efforts around the property to control the impact of deer. Perhaps the most obscure are the two and three-dimensional wolves placed around the plots to deter owls and coyotes. Shawn admits that they aren’t totally effective but have been worth the test. Furthermore, Shawn uses some electric wire around his other crops with 2 strands, one low to the ground and the other at about 3 feet. He also uses peanut butter on the wire to train the deer to avoid the plots, re-treating the wire every 3 months or so. To date, it has been largely effective despite the towering oak trees that scatter acorns across the property and river bank.
What Shawn does know is that the opportunities will necessarily be developed from within, for two big reasons. Firstly, Kentuckians have a strong disfavor of government involvement and given the number of state legislators that have been indicted and imprisoned over the last few decades for embezzlement or fraud, it’s easy to understand why. Secondly, there is a deep distrust of people from outside of Kentucky. People whom have lived in the area for generations have tended to band together, developing close knit communities aimed at supporting one another, often without financial incentive. It is likely these people, whom feel a strong sense of place and family will necessarily develop the post coal and tobacco economy. Though developers may come from the Midwest, east coast, or anywhere else, it is unlikely that much will take off without the involvement of those families whom have lived and died in Eastern Kentucky for generation after generation.
Until then, Shawn will continue his work with or without outside assistance to generate results from his crop trials. He will continue to search out grants that will support the development of the farms and businesses around him. With one demonstration after another, he will impact the population around him. Even if some don’t create a living wage for themselves, they’ll all have a healthier lifestyle by producing their own fruits and vegetables.
Case study 8: Cutting edge resilience research at University of Kentucky organic farm. Nearer to the main campus of the University of Kentucky is an oasis of local and organic agriculture in the midst of suburban sprawl. This little oasis has a long history of farming. Archaeological studies have shown evidence of agricultural activity dating back 10,000 years. It was purchased by the university in 1956, one part of a very large, very old farm by the name of Waveland. The name comes from when the farm was planted to hemp whose tall leaves waved along in the wind. It was originally a slave-managed 2000-acre farm, deeded to the Bryan family, its first owners, after the revolutionary war. It was, before the tracks were erected for the world-famous Kentucky Derby, Kentucky's first horse racing farm. It came into trouble after the civil war, and has dwindled in size ever since. As the town of Lexington encroached, the farm was sold off in auction section by section.
Part of Waveland has been saved from development. The University of Kentucky has developed one of the most forward thinking agricultural programs on 100 acres. In late 1990s, it was painfully obvious that the tobacco system which had sustained Kentucky agriculture for generations was going to end. The USDA gave UK a special grant to set up a new crops opportunity center. They funded research projects to help tobacco growers transition to develop new crops and cropping systems. They did peppers and tomatoes in the warm season and cabbage in the fall, peppers being a high value crop that seemed feasible in the area. They made a point to find ways to use tobacco equipment to cultivate the crop and sell the crops on the local food market. The idea was to be able to mitigate the economic shock of the end of tobacco by teaching tobacco farmers to adapt the equipment and local markets that they already had access to.
In 2000, the farm was divided into conventional and organic agriculture sections due to the stimulus of one person, Mark Williams. He doesn’t see organic and conventional agriculture as polar opposites. “When you approach farming from a sustainability standpoint, the difference between organic and conventional from a technical standpoint becomes almost insignificant.” Mark said, going on to clarify- reminding us that in both techniques, they use the same boom sprayers, fertilizer hoppers. Here they also used the same integration of cover crops and rotation, soil fertility management, minimal tillage. The very same techniques, just different chemical applications.
One thing that detracts from the ability of sustainable farm practices to take hold in a place such as Kentucky is such the heavy polarization and misunderstanding about sustainability and organic farming. “They [conventional/commodity farmers] associate organic farming with particular political parties, religious persuasions, and everything that they are not. To them, it's not associated with which type of pesticides one prefers- it is construed to be associated with a whole way of thinking about the world.”
Many people haven't seen organic farms in operation. So many people who have these preconceived notions of organic farming in theory are surprisingly in support of most of the values of organic farming in practice. “When they are asked about whether they support systems which are harmful to small farms, or feeding people food that makes them sicker, they realize that they may support some of the benefits of sustainable agriculture.”
Health, food and resilience. Mark sees a big part of Eastern Kentucky's poor health and poverty to be a number of things. Much of it is diet and lifestyle choices. But the historic farming system has been of little help. Historically, farm production in Kentucky has been tobacco, livestock, corn, and soybeans. These are all sold on commodity markets much of the time going to other regions. The poorer it gets in Kentucky regions, the worse the health is. Food deserts are bigger, farms get tinier and tinier...and he sees it as a self-perpetuating system.
The basic science research is focused on the plant microbiome. Mark feels his and similar research in molecular biology will change the way we look at resilience of agroecological systems. Molecular biologists have developed next generation gene sequencing techniques influenced by projects where scientists are mapping out the human microbiome. They can now do mass sequencing of mixed populations of genes in a mixture. With this, they can identify different species as well as sequence genomes of these different species in a mixture. Certain plants such as legumes and clover have associations already with microbes. Nitrogen producing rhizobia and mycorrhizal fungi have also been well documented in soil/plant systems. The microorganisms which inoculate plants live throughout the plant and live in humans who ingest these plants.
If humans eat antibiotics, it kills our systems- the same thing happens with plants. “When we treat our soil in a way that kills things, there's a price that comes with that.” This has implications for drought tolerance, climate disruption, and many other things and is a justification for thinking about farming in a way that enhances biological processes in the plant. Biodiversity of organic systems has long been a focus of organic farming, but it has historically been hard to scientifically show until this research.
Sustainable practices for soil management reduce the use of pesticides which kill bacteria and fungi and destroy the soil microbial community structure. The main focus of successful organic farming is on organic matter management, which is the food of the soil. “It has been well documented that when you increase microbial community structures, functions, evenness...it increases level of activity in the plant's microbiome. When you farm in a way that increases the soil microbiome, it also goes into the plant and gives it the ability to resist disease, insects, drought.” They are just scratching the surface on how these microbes change the genetic expression in the nuclei of different parts of the plant and affect the overall health of the farm system.
They published their first paper on it last year (2015) in 'Frontiers of Plant Science' where they looked at four different crops which were either organically grown and conventionally grown. This recent research shows that beyond just the roots, microbes are circulating in plant. Just as in humans, where our body is largely populated by bacteria and fungi of different types. So plants, humans, animals, all could be connected directly to soil microbe communities. Mark doesn't want to make definite assertions until a couple more years and a couple more research teams confirm their findings.
Teaching Local self-organization. Besides his research, Mark runs the University of Kentucky Sustainable Agriculture degree program. It's a four-year undergraduate program, where the student finishes with a bachelor of science. In addition to learning about the economic, ecological and social pillars of sustainability, students also focus on a particular farming system—the livestock, organic veggies, and fruit which UK offers both field and classroom credits for. The program also reinforces that sustainability is a global phenomenon and offers study abroad programs.
One thing that sets the UK Sustainable Agriculture program apart from many studies is the emphasis on experiential education- teaching people to farm by turning them into farmers. The university set aside a quarter of Waveland as a model organic farm so they would have a situation where people could see and actively participate in practical comparisons of both conventional and organic practices. They are looking at organic operations around the world and are building a commercial scale system, not a garden scale system- which is what is seen in a lot of university settings where the students are offered organic production courses. They are more interested in building the equipment and capacity to feed a lot of people as well as to make good money on the operation. This is how they actually finance the program. In order to be able to offer such large range of study and practice, they had to be able to set up the operation on the precondition that they could fund it with farm revenue. They have a CSA for the organic section that runs for 22 weeks, they sell crops wholesale to UK dining services, and run 2 farm stands per week. It's enough to pay five people and provide revenue to continue the programming. Their gross sales for the last season for the CSA alone was $22,475 per acre with the 30 acres on the organic farming unit. It is a highly mechanized system, with their labor cost being 42% of gross sales.
They have 20 student apprentices and some 200 people in the CSA; all within the UK system of faculty, students, and staff. They only have the farm stands on UK campus. They've decreased their competition by keeping it in the UK family. In terms of scale, they have the mechanization to farm much more than they actually do. Their goal is to have a system where they can teach people what is possible in the state of Kentucky, which historically doesn't have this type of cultivation. They’d like to demonstrate the possibilities from a large scale to a much smaller scale where one would use European walk-behind tractors and hand tools. They teach both row crop systems and also high-revenue small plot systems.
Mark and staff are teaching by example, showing students that sustainability can and should impact many aspects of their lives and business practices. “For us, it's not whether we are using a naturally derived BT or a synthetically derived BT. It's the way that we live our lives.” The perfect and most immediate example of that manifestation is the farm shed visitors meet in. It was originally constructed in the 1950's. They've worked with students to get recycled, donated, or federal surplus materials to turn the old shack into a meeting area and kitchen. The structure, though reconstructed with little to no money from used materials, did not look like a random patchwork collage. The kitchen has stainless steel countertops and ample space to prepare meals on a commercial scale. Every Thursday, they have a big dinner. One of the requirements is students have to cook a meal for some 40 people with ingredients that are currently in season.
“Farming is knowing more than just putting plants in the ground,” Mark says, as we get up and walk about the room. They not only teach crop planning, but also building techniques: carpentry, masonry, and welding among other things. Adjacent to the meeting room is the packing shed. The shed has a cabinet covered in pictures assorted produce. These were pictures of every week's CSA box from 2015-2016. All 22 weeks of 2015 and the first four weeks of the 2016 season when we visited in June 2016. It was a beautiful illustration of not only their industriousness, but also the blossoming of seasons- with the boxes being populated initially with cold resistant greens but then slowly growing with the yellows and oranges of squash, and then reds, greens, purples as the summer season sets in and the heat of the long Southern summer days bring forth a multitude of crops. Mark reminds us of the website and tells us that every week for as long as the CSA has been in operation has been documented there with pictures. It was a perfect blend of old and new as the Eagles filled the room and young people brought colored bins from the produce trailer, onto the rollers, and down into the glistening stainless steel wash tanks, removing any bugs, dirt, or any other detritus that would keep them looking anything less than beautiful.
Technology of the present with the wisdom of the past. Nearly all the harvesting for the CSA is done with a harvest wagon—speeding harvest with their conveyor which pickers lay down on rather than hiking it to a trailer. Not only is it faster, it saves people's knees and backs from the strain of repeated heavy motion. We made our way across the road and out to the field to a block that was completely covered in netting, with little hoops pushed into the ground over the rows. Each hoop was less than two feet in height. Mark explained that there was a cucumber beetle that they have not figured out any appropriate chemicals to take care of. They use what is called exclusion, and have the whole plot draped in porous fabric that they can still spray through if need be. They can use neonicotinoids as well, but they have preferred Protek netting. It also protects them from bacterial wilt. They can get 92-94% of conventional yields without spraying. They've been working some eight years on cucurbits, and the Protek netting is one of the most effective methods of loss reduction.
Across the aisle, the crops were covered in a white powdery substance, kaolin clay. It serves to disrupt insect feelers and irritates them to a point that they have difficulty sensing things, so it is a very effective deterrent. Mixing the clay with neem doubles its effectiveness as a pest deterrent.
So many of the fields that they put in this season were sources of anguish because of relentless rain. They would get a clear day where the ground would be dry enough to get tractors in but it was still so wet that the soil was rough and clumpy. The tractor broke down on the day that they were putting in the plastic, so they had to use one of the older ones without precision steering. That coupled with new interns who have little to no farm equipment experience has made for some crooked, uneven rows. The plastic layer wasn't set for that type of tractor so they had to use another smaller plastic layer. The cultivators were still set for their standard layer so it ended up ripping a lot of the plastic. “Sometimes things work very well when you are farming, and sometimes it is a symphony of everything screwing up,” Mark said good humoredly as we looked out over the rows- some of which snaked together and apart at random intervals.
They are not the typical farmers, Mark mentioned as we saw some of the mowed furrows where most farmers would have bare ground during the summer. They put in very competitive cover cropping between the rows that they keep mowed to fix carbon in the soil year-round. In their you-pick fields, they don't use legumes but in the others they make sure to intercrop legumes in the furrows to continually fix nitrogen to lower the amount of fertilizers needed.
They have limited land, so there isn't the space to be able to let any of the land lay fallow for a whole year, but they make up for that by only doing single season cropping in their plots. The summer crops come off, and they cover crop. Though they are farming fairly intensively, there is space allowed during the year to be able to allow the soil to regenerate and build up more biomatter. They use a spader machine, which is the gentlest way to disturb soil. Once the soil is opened up, they'll use no-till machinery up until the next year where they plant again. They cover crop with no-till grain drills and flail mowers. So ¾ of the year they are in cover crops, regenerating organic matter and using seasonally appropriate plants to bring life and health to the soil. Rye, sudex, oats, vetch, peas, crimson clover, red clover; a whole arsenal of crops are used to allow them to outcompete any weeds and foster as much organic activity as possible. They compost at a rate of 10 tons of compost per acre per year. The cover crops set the cultivation schedules. The first cover crop that they usually till under the soil is the sudex. The second are the plots with oats, peas, and crimson clover. They all mature in April. The last fields they go in are rye and vetch, which matures around May. For crops that need additional fertilizer, they use a granular fertilizer. Only on the super long-season crops, they do use in-line liquid fertilizer.
Innovation, conservative and avant garde. UK’s organic farm is highly mechanized farm. One of the most interesting contraptions- a spader from Holland. It's the best tillage tool they have. It's a rotary spader with cupped spades. As it rotates at a really low speed, it dips into the soil and drops it out of the back. It ploughs down to 11 inches in a single pass. It has a rotary on the back that churns the soil three inches down, so it gets excellent depth while still keeping nutrients at root level. They have to go slowly but it still saves a lot of time compared to the methods that they had previously employed. When they had first started farming at the plot, they only had a moldboard plough which they drudged through the field. After that turned the soil over, they did three to five diskings and a couple of field cultivation passes before the coup de gras; dragging a telephone pole through the field.
We worked our way around this planter to spy “The Holy Grail of weed control.” Two classic Kentucky tobacco cultivation tractors, Farmall tractors from the seventies. The engine is offset to the left so the farmer is seated over the very center of the row, looking down through an opening straight to the crop. They call it cultivision. They tied the hydraulic cylinder to a box and attached that to the steering wheel, and all of a sudden, they were looking at a precision steered tractor for under $2500. “For $1,200 more we got a dedicated cultivating tractor that super-precision now.” Mark beamed as we all looked on in amusement and surprise. “That would be an example of hot-rodding old technology.”
Another cultivator is made from an old tobacco cultivator. They cut it into components and reassembled it into an s-tine cultivator with two other attachments that go along the sides of a plastic row and turn, then replace the shoulder of a plasticulture row. For anybody who has ever farmed plasticulture, you would know how near impossible it is to weed the shoulders of the plastic rows without tearing the plastic all to bits...but this machine does it without a hitch.
The final new cultivator is a basket weeder designed for when the plants are small and can't take many disturbances. It has two baskets on the front. The front sprocket is bigger than the back...so the back row turns faster. They are two rows of rolling baskets, as the front basket rolls up, it smashes and then throws weeds up. Whatever little weeds are left by the bigger front wheel, the smaller, faster basket picks up. There is a four-inch gap between baskets to allow space for the plants to pass. There is also a roller set to smash the weeds. Four inches between components to allow for seedlings to pass might seems like a lot. But, Mark reminded us, that's tiny when you're mounted on top of a tractor rolling through a field.
With only long-season and you-pick crops under plastic, the rest of the farming system is done on bare ground. Their fields are arranged in 50-foot-wide by 300 foot strips. This enables them to get their booms and harvesting conveyors out to cover the whole field to minimize ground disturbance and also to ensure faster spraying and harvesting of crops. Their boom sprayer is 25 feet wide, so they can cover the whole block in a single pass and return. They can fit ten double-row beds in each field for their bare ground system. They run buried drip tape in both the plastic and bare ground systems for efficient and uniform disbursement of water to localized areas, delivering water to the root ball and not leaving much for weeds. Being on city water, it is also a major savings. It turns water into a weed management tool.
At this farm, they do their best to only cultivate and disturb soil at about ½ to ¾ of an inch. They know that 80-95% of weeds germinate from the top ½ inch of the soil. So using very low disturbance machinery, they can eliminate germinating weeds without bringing any more up. They have very aggressive cultivators that don't penetrate more than 1 ¼ inch. It is an articulated cultivator. Each little tine is on a flexible arm. This attachment weeds right at root level without breaking up much extra soil organic matter. It's got little tined finger weeders to eliminate any weeds in the row without disturbing the crop. It can weed at three miles per hour, which beats out nearly any other method. Without the use of defoliants or other herbicides, it will clear weeds at 96 to 98%.
One of the real breakthroughs that they have made in their bare ground systems that ensures that they have very few weeds without having to use hand tools is to use buried drip tape so they can cultivate right over the top of the drip tape without having to pull up the tape to cultivate. Using no till technologies and buried drip tape they can define beds with wheel tracks and but not compact or displace too much extra soil.
“One of the hallmarks to me of what I would consider sustainable organic farming...is taking appropriate technology of the present with the wisdom of the past. It's using really high end ideas and putting them with solid concepts of rotation and soil fertility management.”
When asked about beneficial insects, Mark rolled out the arsenal. Aphids under the pro-tech netting, bumblebees in cardboard hives, ladybug releases. They also grow quite a few flowering plants to attract beneficial insects and are constantly scouting to make sure that there are plenty of native beneficial insects present to aid in pollination and to eliminate predators.
Case study 9: bringing resilient systems to isolated farms
The high-tech approach of University of Kentucky is contrasted with the very practical approach of Kentucky State University staff. Steve Skelton, with other KSU staff has created one of the most novel farmer and homesteader outreach events in the South. The workshops are conducted by KSU staff, but always given in concert with a local organization which helps recruit participants and provides follow-up and evaluation. This workshop provides small farmers with the equipment and education to start livestock enterprises in rabbit and poultry production.
A KSU flatbed trailer attached to a farm truck brings all the supplies to the workshop. It is loaded down with lumber, thick gauge fencing, PVC pipe, rolls of wire fencing, tools, and boxes and boxes of feeders, valves, and other components of the production system. Every attending family or individual is assisted in constructing a rabbit hutch as well as all of the materials to make a chicken tractor big enough to house 40-70 birds. For the rabbit workshop, each table lined out with everything needed to construct a 3-compartment rabbit hutch. Valued in the $300 range, these are the workstations for the people at the tables constructing the hutches.
Steve travels the state and sometimes other states with this programming, intended to equip poor and beginning farmers with the tools they need to go as far as they want. They can use these rabbit hutches for personal consumption or they can begin brooding rabbits and build more cages to start a commercial livestock operation.
There are people of every age, from a thin lone grandmother to a group of teenagers who arrive on a van belonging to a community based organization. There are many homesteaders, including a middle-aged couple and their two children--the Gearharts. They have been living in the Hindman area for about six months now. They lived out of state for much of their lives but returned to Kentucky to the husband's family's old farm. This farm, as with many in Eastern Kentucky, has been in the same family for countless generations. The Gearharts resolved to provide a simpler, more honest life for their children. They've been hard at work renovating and rehabilitating the farm house and have made enough progress for it to be livable. They've also planted enough seed to provide for themselves throughout the summer growing season as well as the winter.
Others live on small plots and are primarily subsistence farmers. Some are new to farming, having lost the great wealth of knowledge that was once commonplace in the minds and lives of their grandparents and great-grandparents. They are here to recapture lost knowledge. There are others who are laid-off coal miners or miners who sense that their trade will soon be coming to an end. They are here to learn ways to grow their own meat, to make a living without the wages and lifestyle that they had become so accustomed to.
As the sturdy mesh panels are fastened together, people start chatting across tables: meeting new neighbors and talking about their gardens, stopping to walk over and ask the other about how many panels to snip out for the doors and feed trough mounts. A couple of groups polished theirs off quickly, down to the trim and the little hay feed mounts and feed troughs. Both the rabbit hutches and the chicken tractors were designed by Steve Skelton. They meet all the necessary space requirements and have every creature comfort needed, including watering systems that can be attached to larger tanks and tied into multi-unit systems.
Steve recommends first that the best breeds to grow for meat are New Zealand Whites and Californians. He reminds people to stay away from the giant breeds because their bone structure is so much bigger that they don't have much in the way of meat. The giant breeds such as the Chinchilla also require more feed to gain the same weight. He recommends 18% protein feed and mentions that he gets his feed for $10.40 a bag. He mentions this because he had heard from other people in the group who already had a few rabbits that they were paying $15 a bag for 16% protein feed. He makes recommendation against feeding rabbits straight alfalfa or red clover that has already bloomed and suggests something like Tennessee Orchard grass would be preferable.
Conservative innovation in rabbit management. He tells the group to keep an eye on rabbits just as one would chickens, and if one gets the sniffles it is best to remove them from a cage near any of the other rabbits and to clean its water line to prevent transmission. To help them recuperate, he recommends a single capful of regular household peroxide mixed into their drinking water for a week. Rabbits get colds just like humans do. Peroxide helps to flush out pathogens. He says the same can be done with chickens who get colds. He also treats his rabbits every month with apple cider vinegar. It's not a medication, but more of a health tonic for them and it stabilizes their red and white blood cells as well as a fortifier for their immune systems. Steve usually mixes a gallon of apple cider vinegar to a hundred gallons of water. Many of these treatments work for other animals. He mentions other livestock that can make good use of apple cider vinegar; chickens, sheep and goats. It's said that if you give apple cider vinegar to sheep and goats, you'll see more females being born. He doesn't confirm or deny that, but still gives them the vinegar to fortify their immune systems. “Because a live animal is better than a dead one.”
He recommends against treating rabbits with any medications. If anybody has a hutch with wood in the framing, there are good chances of getting mites. These will infect the ears of the rabbits. Steve says the best treatment for mites is a mineral oil or vegetable oil. Put it in the top of their ears and let it run down and cover the ear thoroughly. If the rabbit is chewing a lot of fur off, chances are that it has fur mites. The best way to treat them makes them unsellable on commercial markets- which is putting a wormer at the base of their neck. It removes mites and worms. Mites can be transferred from one rabbit to another quickly. For sore feet, it's cheapest and easiest to put cheap ceramic tile down. Those can be cleaned regularly and they also provide cool surfaces for them to rest on when it is hot. Steve covers so many aspects of rabbit care...even touching on rabbit boredom. If a rabbit is seen chewing on a lot of stuff “Chances are, it's bored.” He recommends putting a piece of non-treated 2x4 wood in for them to chew on. Ash limbs are also good options and apparently rabbits love grape vines. “they get that sap and sugar outta them, they love them grape vines.”
He mentions the many resources online and books but has a very sensible and silly warning: “if you do everything that these professionals tell you, you're gonna be livin' in that rabbit cage and he's gonna be sitting up in your chair watching your T.V.” Care is important, however. He mentions feeding them every day at the same time. His are fed between 5 and 5:30 every day. They come right to the front of the cage and he can see their eyes and ears and check on their health. Six ounces is the max you should feed them. If you feed them too much, they'll get too fat and won't breed. Freezing a water bottle and keep it in the cage with them in hot weather. This will prevent heat stroke and combined with the ceramic tile will make quite a comfy cage.
This workshop is definitely a quick course but he covers every aspect of care, even breeding. A man speaks up and asks about gestation. Steve replies 28-35 days. He reminds people of the importance of keeping breeding cards to track their fertility as well as their lineage. He says when checking for successful breeding, “you know that it took when that buck falls off.” If the buck is brought in the next day and she resist, then chances are she's pregnant and Steve recommends marking it on the card and watching her. At fourteen days, you should be able to reach under her stomach and be able to gently squeeze and feel nodules. For market viability, a doe should successfully produce eight babies per litter. It takes four to pay for the overhead of breeding and feeding and then the next four are the profit margin. He encourages anybody who is buying from a breeder to be able to get a copy of the breeding card.
Steve is quick to engage potential market farmers. “If y'all start raising rabbits and get more than you can handle, I'll buy 'em.” These Kentucky State extension agents are exceptional because many of them are farmers themselves. They are testing their ideas and developing the markets with their own labor which they do in addition to any extension service office or field work. He'll pay $1.50 a pound. The only other buyer will offer $1.50 for white rabbits, $1.25 for colored rabbits, and $.85 for bucks or older does. He offers $1.50 to be able to not only offer a solid price across the board but also to make his accounting work, which is mainly undertaken by his wife.
A Kentucky State extension perspective on resilience. Kentucky State’s Steve Skelton has a much unique take on Eastern Kentucky resilience. When asked about what makes for a truly resilient food system from the farm level, he believes the main thing is having a good clean product, being outgoing and having a good presentation for buyers. Every time he goes to a restaurant to sell rabbit, or meets up with other farmers, he is sure to bring some rabbit to show the quality. He also brings along a printed “Kentucky Proud” certificate. This is a major incentive for restaurants especially because the state of Kentucky has an incentive program that reimburses food service industries for each purchase of Kentucky proud certified produce whether it is rabbits, beef, squash, or berries. Kentucky Proud status also puts you on the website as a producer, which brings extra buyers to you.
He'd like to get animal welfare certification but cannot because they require that the rabbits are pastured. “They want you to raise them on the grass and everything because they think that is humane. This is far from healthy for rabbits because they are prone to disease. They don’t know the whole story that rabbits on the ground would get coccidiosis.” If they are processing rabbits and the inspector sees a spotted liver, they will take a knife and split the ribs and toss it aside. Rabbits who have been infected with coccidiosis cannot be marketed. Steve often will take them back to his own coolers for personal consumption. Cooked properly, it isn't a huge problem but it definitely isn't worth the risk of taking them to market.
Steve has contacts with 35 restaurants in Louisville. Once they learn about rabbit meat, they love it. Rabbit meat is healthy because it’s so low in cholesterol and fat. They are so lean that it is said that you would starve if you ate only rabbit because you wouldn't be getting the fats and other nutrients that are needed. Recently, Steve was talking to a friend of his at an Italian restaurant. He reminded his friend of how widely used rabbit has been historically in Italy. “Back in WWI, rabbit was the number one meat source in Italy.” His friend replied that he still didn't know of any recipes. “I keep pestering him. Every time I go eat there I bring it up. Maybe I'll break him down.” he says good humoredly.
If he can find other rabbit producers who can consistently produce clean, healthy rabbits, he'd love to be able to reach into those markets. He is a fan of Kentucky's 30-day law, where you have a thirty-day wait between receiving and processing livestock. He wants to be sure that any chemicals that may have been fed to the rabbits from other people has been flushed from their system. “They most they're gonna have in 'em from me is apple cider vinegar.”
When he finds a good grower, Steve will go to great lengths to work with him. He has a grower in Virginia that is a four-hour drive away. He'll pick up 200 rabbits each trip. He's very careful in his process. He drives there and stays the night so he can drive directly home after picking up the rabbits. He'll stop on the side of the road and make sure that the rabbits are properly watered and immediately puts them up when he gets them to the farm and makes sure that they are healthy and stable. He'll sell between 300-350 rabbits a month, but he could more than double that if there are enough rabbit farmers.
There is only one other person that markets rabbits in Steve's area. When they run out, they call each other so it is a relationship built on economic cooperation. He has a meat locker at a country store where he only pays $20 a month but hasn't been able to use it but once because his meat moves so rapidly.
Local processing and marketing are key to resilience. Steve began this work when he was hired to revive the mobile meat processing unit of Kentucky State. He was told he was hired because he was the only one who had the knowledge to fix things if they ever broke down. He was the only applicant who didn't say that he would hire somebody to make repairs.
When he started reviving the mobile processing unit, it had been abandoned in a field. He cleaned it up and reached out to the Health Department, the Environmental Protection Agency, county health departments, and others. It took two years to work rabbits into production because Kentucky has the most stringent laws in the nation when it comes to processing regulations.
He's had calls from all over the country and all over the world asking for consultation on construction of a MPU. Washington State is one other place that had one, and it went strong for a while but isn't being used. $70,000 is the basic cost for the unit if you subcontract the work outs. The reason that Kentucky has been able to make it work is because Steve can do the work himself. “Most of everything that unit started out with, I've done got rid of.” He's replaced corroded copper lines with pvc and nonbreakable pex line, changed tables, shackle systems, he's added lights, air conditioning, racks, digital scales, and many other things to make it more user-friendly. He's been offered jobs in other places like Maryland but his family and roots lie in Kentucky and he holds fast to familial roots.
Resilience, poverty and health. Our previous study indicated that in most areas of the South, where farms and food systems were resilient, people were healthier and poverty was lower. Eastern Kentucky is one of very few exceptions to that rule. There are farms in Kentucky that have withstood the test of time. They have survived the end of tobacco, climate shifts, and economic slumps and still keep on farming. However, there are in some of the poorest and unhealthiest counties in the nation in Eastern Kentucky. When asked about this phenomena, Steve had pretty sensible reflections. Steve has worked all over Kentucky. He sees that there's not a lot of jobs, and not a lot of ground that can even be farmed on. The farms that are in Eastern Kentucky are old, old family farms. Doing the workshops that they've done, they've seen a lot of people with lots of drive and ambition. Even where they thought the workshop was going to be a bust, such as at a week-long chicken tractor training at a state park, they had highly engaged participants in the event. By the end of the week, most of the people who had attended the chicken tractor workshop had already built their chicken tractors. “Those people, they listen. They talked and asked a lot of questions.” He recalls a little boy whose grandmother had attended the workshop. The boy wanted to do build the structure, since he was going to be the one raising the chickens. The family sent pictures to Steve and the extension agents which showed that all the father had to do was cut the wood, and the little boy assembled the rest.
Case study 10: Shakertown has demonstrated resilience since 1805
Redundancy through new recruits. Long before either University of Kentucky, Kentucky State University, the Bowlings of Clay County, the Conways of Breathitt County or the Hoffmans of Owsley County, or even vocational agriculture, a resilient local agricultural system had begun in Kentucky. In 1805, a religious group known as the Shakers for their ecstatic religious ceremonies came to the Pleasant Hill in Kentucky. A celibate religion, they relied heavily on the adoption of orphans to keep the religion alive until 1960 when laws were passed making it illegal for religious organizations to adopt children.
No matter how innovative and ecologically integrated, no agricultural system is resilient unless its methods are passed down to the next generation. Shakertown is a poignant example of this fact. Though the sect has virtually died out, many are working to insure that the Shaker attitudes toward agriculture are passed on to the next generations.
Shakertown once was once of the most prosperous and technologically advanced farming systems of 18th and 19th century America. During their heyday their produce, baskets, seeds and other marketable goods were known to be of tremendous quality, often selling for significantly more than their counterparts. With blacksmiths, doctors, cobblers, basket makers and other tradespeople, the Shakers brought a great amount of value to central Kentucky. Through their clean architecture featuring smooth, rounded edges and astonishing symmetry we can imagine their lives to have functioned in the same way, smooth and orderly. There were only spiritual sisters and brothers that slept, dined and worked separately as they each pursued a life that was designed to be as close to heaven on earth as any Shaker could conceive.
The early accomplishments of the Shakers remain a testament to the ability of a peoples in early rural America to work together for a common good, generating fantastic technological advancements that far surpassed many settlements of the time. Those developments included a water tower with a horse powered pump that brought water from the river, the earliest municipal water supply to be built in Central Kentucky. They were also known for purchasing the newest equipment for mass production like farming implements, mills, presses and even stills until prohibition.
Today, Shakertown’s agricultural sector is experiencing its own type of revival as head farmer Dylan Kennedy and his assistants work to cultivate the land as well as the culture of farming in Kentucky. Shakertown has been working with local schools for decades to bring busloads of children to tour the grounds and learn about the Shakers. Students of all ages regularly come to see the farm, sometimes in groups of up to 150 students. They learn from Dylan and volunteer for work days, helping mulch rows of vegetables or combating the invasive thistles in the fields with hoes and shovels.
Dylan has adopted the philosophy of the Shakers saying that, “they weren’t stuck in the past and neither are we”. Instead of preserving an old system, Dylan, just like the Shakers, is ready to innovate and proselytize. Dylan aims to revive community outreach into his own version of the farm by helping people learn about new practices that he’s trying as well as tried and true methods that he relies on. He hopes that people will come and see something they want to try, like sowing buckwheat to avoid weeding for the first 3 weeks while also conditioning the soil and providing forage for the bees. He wants people to learn from his mistakes and successes to use on their own land, at their own plots no matter how small. Sometimes, if visitors are really interested in the farm, Dylan will give them seeds harvested from varieties that worked well. Though Dylan doesn’t sell seeds like the Shakers of the past, he’s doing his best to share the seed stock that he’s discovered.
As he strives to promote the Shaker philosophy, Dylan is sensitive to what visitors want to learn. Many of today’s farmers are interested in small scale farming or homesteading. Dylan is working to develop a farm that’s relevant to the needs of small scale farmers in Kentucky. His approach is dynamic, using an array of practices that embrace the tools of the past as well as those from our present day.
Ecological integration. Every season Dylan is choosing plants to see what works best with the climate, rather than forcing something to grow by using excessive chemicals or soil amendments. So, if they try a squash that doesn’t work for some reason they’ll return to what has worked in the past. Unless of course they find something that might grow better. As Dylan puts it, “The earth hasn’t been the same in 6 billion years, if we aren’t able to learn a few things every year, we won’t last long.”
It’s the same for the cattle and livestock operation that Dylan is developing with Shakertown. It will be spread over 900 acres of thriving prairie which is the state model for prairie restoration. In conversations about what type of beef or pork to raise there, Dylan keeps the conversation revolving around what they can raise rather than what they want to raise. His approach is to find animals and plants that thrive in the ecosystems that already exists. For example, the squash bug was causing insurmountable problems with modern squash varieties. Instead of continuous spraying, they’ve switched to tromboncino, a popular Italian summer squash that has a solid stem, unlike the hollow stems of most squash that harbor the bug. They’ve also switched their cucurbits to varieties with a solid stem rather than hollow. They use these varieties because of their natural resistance to squash bugs, always aiming to work with nature rather than controlling it.
To Dylan, finding those animals and plants that thrive is the foundation of building regional food culture in Kentucky, or anywhere else. For instance, he reminds us that unique regional products like champagne or the prosciutto ham were developed over time as people realized and worked with the natural resources they had to eventually develop what we know in the present day. No one from the past could necessarily choose most of what they grew in a region, rather working with the land and climate available to them, slowly selecting and developing something special. Dylan wants the Shakertown farm to show people both how to grow food as well as why to grow food. He’ll do this by developing regional tastes rather than replicating popular ideas from other places to “get beyond agriculture into culture.”
The cropland consists of six individual plots that Dylan rotates cyclically with the help of two full time and one seasonal employee, plus one volunteer. They don’t normally accept volunteers because people often want to help for only a weekend, or afternoon. This particular volunteer is different though, a retired doctor who spent his life working around the globe asked to come help Dylan regularly, every Wednesday. Over time he has learned everything he needs to know to be a productive member of the team. This training is important given the diversity of tasks and methods that Dylan uses around the farm. Most weekend volunteers simply take too much time to train.
Dylan’s farm system is intentionally designed to be resilient, following a broader philosophy of mimicking nature through diversity and working in cycles. This dynamic system revolves around a philosophy of little to no tilling, aiming to keep the soil structure intact. When they must till, they use a shallow method and only once, maybe twice a year on any given plot. Dylan knows pH of his soil and regularly conduct soil tests. His foremost goal for the soil is that the microbes and beneficial fungal communities thrive in his soil to maintain and build organic matter. Their most recent no-till approach has been to use a massive black tarp to cover a whole plot in the rotation for twelve days, allowing the heat and lack of sunlight to kill off the weeds and plants from the last rotation. When we arrive to the garden to talk with Dylan, they’ve just removed the tarp for the first time with desirable results. Scattered on the ground are plants that are quickly dissolving into the soil as insects, heat and moisture have all done their part to break down the stalks and leaves of the previous crop. The team is already planting young starts of basil and other herbs into the soil among the degraded plants. In the adjacent walkways they’ve begun to distribute straw as mulch to keep the new weeds down.
The straw they use for mulch is one of their only off farm inputs used to fertilize, otherwise they do purchase some volcanic mineral additive. They rely heavily on composting their kitchen waste, leaves and branches from around the property, and waste from the numerous large animals like oxen and horses. They want to eliminate waste by using it on the farm, composting it together and using chickens and some ducks to turn their deep litter system. More chickens are used during the crop rotation as one whole plot is dedicated to small pigs and chickens that turn and fertilize the soil for a full year. This allows the plot to become rich with nitrogen from the chickens while the pigs turn the soil, aerating it and rooting out weeds. Their current compost supply isn’t sufficient and during our visit it becomes clear that the Shakertown administration is working to help solve the problem.
He wants every action to have multiple effects, saying that he doesn’t ever want to send people out to do work that will only effect one thing. This ideology is reflected also in his pest management, which is similarly dynamic and varied like the rest of his farm. To manage pests, they alternate compounds like kaolin clay and diatomaceous earth, both silica compounds that are lethal to bugs with exoskeletons. Sometimes they’ll use extracts of cayenne, garlic and soap to make teas and decoctions to spray on their plants. They use these somewhat randomly to, “keep them [the pests] guessing.” Occasionally they’ll use an organic BT type spray. Dylan stresses the rarity of their use saying, “we may buy two little bags of BT and we might use one in a year.”
They use these pest control approaches in the orchard as well. Their orchard is something unique that even many experts have never seen before. They’re unusual because unlike most modern dwarf trees, they’re all full size and unique heirlooms that you won’t find anywhere else. They use a little bit of kaolin clay and a product called CYD-X (a coddling moth virus) to keep the worms out of the apples. Dylan is considering using copper sulfate this year to manage the fire blight that covers the leaves. It’s important to Dylan that, like the rest of the farm, the trees remain spot treated rather than putting them on a schedule to spray. Over the years they’ve been managed organically and conventionally as 12 or more people have cared for them over the last 20 years. He’s not so idealistic that he’s willing to lose trees for the sake of keeping them purely organic.
Diversity in pest management. In fact, in Dylan’s opinion, “you can throw out the word control in pest management.” He is instead relying on a diverse approach to pest management having given up the search for a silver bullet. To Dylan, you’ve got to build in layers of defense with barriers like herbs, marigolds and sacrificial plots while maintaining a watchful eye to distribute appropriate applications of decoctions, diatomaceous earth and even the organic BT if the situation calls for it. One thing he won’t use is fungicide, relying instead on developing soil microbes capable of managing fungal outbreaks. As Dylan says, “Biology takes care of a lot of it if you aren’t messing the structure up all the time.”
To help condition the soil to maintain healthy microbial colonies, he uses a lot of companion planting. From root crops to break up the soil to brassicas that manage fungal communities, they’re selecting their seeds specifically for soil health as well as standard requirements like flavor, disease resistance and regional adaptation. To do this he purchases seeds from people like Bill Best, a local expert on green beans. Always striving to find quality heirlooms like those of Best, Dylan admits it’s a challenge. One of his goals is to bring awareness to the community that we’ve lost nearly 95% of our seed diversity, encouraging visitors to look for abnormal plants and to grow them out the next year. He feels that Eastern Kentucky is particularly lucky because the land is conducive to maintaining diversity in its food system. Though the small valleys found in eastern Kentucky have quality soils and sufficient rainfall for most vegetables, most areas aren’t capable of producing mass quantities of industrially desirable crops. To break even with industrial crops, farmers need a minimum acreage of open land that simply doesn’t exist in Eastern Kentucky.
Conservative innovation. Dylan likes Mark Twain’s remark that, “When the world comes to an end, I want to be in Kentucky because everything comes to Kentucky ten years late.” Dylan suggests it might be for the best though, postulating that Kentucky gets to watch others test ideas or products to see what works and what doesn’t. Despite that, the transition of Kentucky’s farmland isn’t far behind the rest of the country in adopting modern industrial farming. The encroachment of GMO soybean and corn is slowed only by the widespread horse farms and growing metropolitan areas, all equally hungry for open flat land. What has been slower is the development of new technology and market opportunities for small scale farmers. Things like high tunnels for season extension, testing of high value crops, or the re-development of regional food systems are only trickling out. Dylan feels like there are lots of opportunity in the mountains, but they must be created by people finding niche businesses by testing out new things or introducing regional flavors of the past.
One such regional flavor that has worked for Kentucky and continues to work for Shakertown is sorghum which produces a unique syrup and is easy to grow, even in poor soil. At Shakertown they’ve begun in the last few years to cultivate their sorghum fields using the horses and oxen in their continued attempts to incorporate animals into the rotation. This year they plan to harvest the sorghum crop with animals too. They’ve even found an intern that is the current Kentucky state champion for growing sorghum. With her help they plan to expand their production. A man named Danny Townsend has been providing their sorghum seeds and is the largest producer in the area. Recently, he is running short of supply because people are enjoying sorghum so much more. From hotels wanting something unique for their guests, to individuals changing their diets by incorporating more regional or traditional foods. To Dylan, both sorghum and hemp are huge opportunities for the future.
Dylan is mindful of the future, planning so that the farm is so successful and so energized that even when he leaves, the farm will continue. Right now the farm spans only 20 acres, 15 of which are dedicated to grazing but he’s planning two big projects for the 900 acres of prairie beyond. The first is to incorporate mob grazing into the prairie using cattle, goats or other grazing animals. The mob grazing would mimic the fires that are integral to future management of the prairie. The second project, integral to the first, is to reform Shakertown into a farm incubator. Though other farms offer internships, Dylan wants to become a farm incubator to build lasting businesses that are economically viable. He sees Shakertown as a great opportunity because they already have space, assets, and attention for their products. Moreover, it seems to Dylan to be that most socially responsible thing to do as farm businesses take the longest to mature. He doesn’t see any other way to ensure resilience, reminding us that the farm is dependent on having a good team to support it.
The work done at Shakertown is obviously built on team work, each aspect tended by experts in their fields. For instance, Shakertown has bees, but Dylan is not their bee keeper. They have horses and oxen, but Dylan isn’t their trainer or keeper. Though he and his workers may help lead the large animals from pen to field, or help process the honey from the hives, the crew get to focus on their work, perfecting their own craft. Even when it comes to financing expansions to the farm or outreach to the community, the farm has support from other members of the Shakertown team.
Conclusions. These ten case studies confirm that the resilient systems of Eastern Kentucky possess the eight qualities we have found in other resilient systems in the South. These cases also helped explain why the relationship between our index and various demographic variables related to quality of life (e.g., self-reported health, poverty) is the opposite of the rest of the region. Based on the findings reported here, our conclusion is that the negative correlations result from Eastern Kentucky being composed of two different populations: resilient small farm families and former coal mining families. Small farm families have been farming the same land in a very resilient fashion for generations, resulting in high scores on our index, but the vast majority of people of the counties are former coal miners and their descendants. The low health and high poverty of the former coat-mining families have overwhelmed the high health and low poverty of the resilient farm families.
References
Adams, W., Aveling, R., Brockington, D., Dickson, B., Elliott, J., Hutton, J., Roe, D., Vira,B., and W. Wolmer, 2004. Biodiversity Conservation and the Eradication of Poverty. Science, 306:1146.
Adger WN, Eakin H, Winkels A. 2008. Nested and teleconnected vulnerabilities to environmental change. Frontiers in Ecology and the Environment 7: 150–157.
Alberti, M., John M. Marzluff Eric Shulenberger Gordon Bradley Clare Ryan Craig Zumbrunnen, 2003. Integrating Humans into Ecology: Opportunities and Challenges for Studying Urban Ecosystems. BioScience, Volume 53, Issue 12, 1 December 2003, Pages 1169–1179, https://doi.org/10.1641/0006-3568(2003)053[1169:IHIEOA]2.0.CO;2.
Alderman and Susan Walker Enhancing Resilience to Nutritional Shocks, 2020 Conference Brief (Washington, DC: International Food Policy Research Institute, 2014).
Alderman, H., J. Hoddinott, and W. Kinsey. 2006. “Long-Term Consequences of Early Childhood Malnutrition.” Oxford Economic Papers 58 (3): 450–474.
Appalachian Regional Commission (2007) County Economic Data. Retrieved April 12, 2011 from http://www.arc.gov/index.do?nodeId=56
Appalachian Community Fund (n.d.) Did you know? Retrieved March 12, 2011 from
http://www.appalachiancommunityfund.org/html/aboutcentralA.html
Babu, S.C. and S. Blom, 2014. Strengthening Capacity for Resilient Food Systems. FAO 2020 Conference Brief 6.
Bennett E, Carpenter S, Gordon LJ, Ramankutty N, Balvanera P, Campbell B, Cramer W, Foley J, Folke C, Karlberg L. 2014. Toward a more resilient agriculture. Solutions 5: 65–75.
Biggs, R., Schlüter, M. and M.L. Schoon (Eds.), Principles for Building Resilience: Sustaining Ecosystem Services in Social-Ecological Systems. Cambridge University Press.
Béné, C., R. G. Wood, A. Newsham, and M. Davie. 2012. Resilience: New Utopia or New Tyranny? Reflection about the Potentials and Limits of the Concept of Resilience in Relation to Vulnerability Reduction Programmes. Working Paper 405. Brighton, UK: Institute of Development Studies. Accessed April 2014. www.ids.ac.uk/files/dmfile/Wp405.pdf
Bhutta, Z.A., J. K. Das, A. Rizvi, M. F. Gaffey, N. Walker, S. Horton, P. Webb, A. Lartey, R. E. Black, the Lancet Nutrition Interventions Review Group, and the Maternal and Child Nutrition Study Group. 2013. “Evidence-Based Interventions for Improvement of Maternal and Child Nutrition: What Can Be Done and at What Cost?” The Lancet 382 (9890): 452–477
Cassidy ES, West PC, Gerber JS, Foley JA. 2013. Redefining agricultural yields: From tonnes to people nourished per hectare. Environmental Research Letters 8 (art. 034015).
Chappell, M. J., H. Wittman, C. M. Bacon, B. G. Ferguson, L. G. Barrios, R. G. Barrios, D. Jaffee, J. Lima, V. E. Méndez, H. Morales, L. Soto-Pinto, J. Vandermeer, I. Perfecto, 2013. Food sovereignty: An alternative paradigm for poverty reduction and biodiversity conservation in Latin America. F1000Res. 2, 235.
Cruces, G., P. Glüzmann, and L. F. López Calva. 2012. “Economic Crises, Maternal and Infant Mortality, Low Birth Weight and Enrollment Rates: Evidence from Argentina’s Downturns.” World Development 40 (2): 303–314.
DeFries R, Herold M, Verchot L, Macedo MN, Shimabukuro Y. 2013. Export-oriented deforestation in Mato Grosso: Harbinger or exception for other tropical forests? Philosophical Transactions of the Royal Society B 368 (art. 20120173).
DeNavas-Walt, C., Proctor, B. D., Smith, J. C. (2013). ‘Income, poverty, and health insurance coverage in the United States: 2012.’ Resource document P60-245. U.S. Census Bureau. Retrieved July 12, 2015 from http://www.census.gov/prod/2013pubs/p60-245.pdf
Diaz RJ, Rosenberg R. 2008. Spreading dead zones and consequences for marine ecosystems. Science 321: 926–929.
Drinkwater LE, Snapp SS. 2007. Nutrients in agroecosystems: Rethinking the management paradigm. Advances in Agronomy 92: 163–186.
Dufour, C., and F. Egal. 2012. “Nutrition in Protracted Crises: A Reason to Act, and an Entry Point for Effective Response.” Paper prepared for High-Level Expert Forum on Food Security in Protracted Crises, Rome, September 13–14. www.fao.org/fileadmin/templates/cfs_high_ level_forum/documents/Nutrition_ProtractedCrises_DufourEgal.pdf
Easterly, W., 2006. Reliving the 1950s: The big push, poverty traps, and takeoffs in economic development. J. Econ. Growth 11, 289–318.
Elser JJ, Elser TJ, Carpenter SR, Brock WA. 2014. Regime shift in fertilizer commodities indicates more turbulence ahead for food security. PLOS ONE 9 (art. e93998).
Enfors, (2013Social–ecological traps and transformations in dryland agro-ecosystems: Using water system innovations to change the trajectory of development. Glob. Environ.Change 23, 51–60.
Fader M, Gerten D, Krause M, Lucht W, Cramer W. 2013. Spatial decoupling of agricultural production and consumption: Quantifying dependences of countries on food imports due to domestic land and water constraints. Environmental Research Letters 8 (art. 014046).
Fan, S., Rajul Pandya-Lorch, Sivan Yosef, Heidi Fritschel, and Laura ZseleczkyMaccini, S., and D. Yang. 2009. “Under the Weather: Health, Schooling, and Economic Consequences of Early-Life Rainfall.” American Economic Review 99 (3): 1006–1026.
Fan, S., R. Pandya-Lorc and S. Yosef , 2014. Introduction. In Fan, S., R. Pandya-Lorc and S. Yosef (Eds.), Resilience for Food and Nutrition Security. Washington, D.C.: International Food Policy Research Institute.
FAO. 2012. “Somalia: A Resilience Strategy.” Paper prepared for Istanbul II Conference, Partnership Forum on Resilience, Istanbul, May 31. Accessed April 2014. www.fao.org/ fileadmin/templates/cfs_high_level_forum/documents/Istanbul_II_background_10-page_ paper_on_Resilience_FINAL_24May12.pdf.
Foley JA, et al. 2011. Solutions for a cultivated planet. Nature 478: 337–342.
Folke, C., S. R. Carpenter, B. Walker, M. Scheffer, T. Chapin, J. Rockström, 2010. Resilience thinking: Integrating resilience, adaptability and transformability. Ecol. Soc. 15, 20 (2010).
Ford, T. 1962. The Passing of Provincialism. In Ford T. (Ed.), The Southern Appalachian Region: A Survey (pp. 9-34). University Press of Kentucky
Fuglie K, Heisey P, King J, Pray CE, Schimmelpfennig D. 2012. The contribution of private industry to agricultural innovation. Science 338: 1031–1032.
Gardner JB, Drinkwater LE. 2009. The fate of nitrogen in grain cropping systems: A meta-analysis of 15N field experiments. Ecological Applications 19: 2167–2184.
Gliessman,S., 2013. Agroecology and food system transformation. Agroecol. Sustain. Food Syst. 37, 1–2 (2013). ecological system while promoting social justice (53). Often endogenously driven.
Godfray HCJ, Garnett T. 2014. Food security and sustainable intensification. Philosophical Transactions of the Royal Society B 369 (art. 20120273).
Golay C, Biglino I. 2013. Human rights responses to land grabbing: A right to food perspective. Third World Quarterly 34: 1630–1650.
Graham, C and S Pinto (2016), “Unhappiness in America: Desperation in white towns, resilience and diversity in the cities”, The Brookings Institution. https://www.brookings.edu/research/unhappiness-in-america-desperation-in-white-towns-resilience-and-diversity-in-the-cities/
Green, M., D. Hulme, 2005. From correlates and characteristics to causes: Thinking about poverty from a chronic poverty perspective. World Dev. 33, 867–879 (2005).
- Hahn, B. Nykvist, Are adaptations self-organized, autonomous, and harmonious? Assessing the social–ecological resilience literature. Ecol. Soc. 22, 12 (2017).
Halverson, J., Ma, L., Harner, J., Hanham, R., & Braham, V. (2004) Adult Obesity in Appalachia: an Atlas of Geographic Disparities. Morgantown, WV: West Virginia University.
Hawkes C, Popkin BM. 2015. Can the sustainable development goals reduce the burden of nutrition-related non-communicable diseases without truly addressing major food system reforms? BMC Medicine 13 (art. 143).
Headey D. 2011. Rethinking the global food crisis: The role of trade shocks. Food Policy 36: 136–146.
Holling, C. S. 1986. Resilience of ecosystems; local surprise and global change. pp. 292-317 in Sustainable Development of the Biosphere, W. C. Clark and R. E. Munn, editors. Cambridge University Press, Cambridge.
Jones AD, Shrinivas A, Bezner-Kerr R. 2014. Farm production diversity is associated with greater household dietary diversity in Malawi: Findings from nationally representative data. Food Policy 46: 1–12.
Justino, P. 2012. “Resilience in Protracted Crises: Exploring Coping Mechanisms and Resilience of Households, Communities and Local Institutions.” Paper prepared for High-Level Expert Forum on Food Security in Protracted Crises, Rome, September 13–14. www.fao.org/ fileadmin/templates/cfs_high_level_forum/documents/Resilience_in_protracted_crises_ PJustino_01.pdf
Kastner T, Schaffartzik A, Eisenmenger N, Erb K-H, Haberl H, Krausmann F. 2014. Cropland area embodied in international trade: Contradictory results from different approaches. Ecological Economics 104: 140–144.
Khoury CK, Bjorkman AD, Dempewolf H, Ramirez-Villegas J, Guarino L, Jarvis A, Rieseberg LH, Struik PC. 2014. Increasing homogeneity in global food supplies and the implications for food security. Proceedings of the National Academy of Sciences 111: 4001–4006.
Kremen C, Miles A. 2012. Ecosystem services in biologically diversified versus conventional farming systems: Benefits, externalities, and tradeoffs. Ecology and Society 17 (art. 40).
Kretzmunn J, Mcknight J: Assets-based community development. Natl Civ Rev. 1996, 85 (4): 23-29. 10.1002/ncr.4100850405.
Labbe, J., 2014. Humanitarian Aid vs Resilience Debate Should Put Priorities in Context. Global Observatory. Retrieved March 12, 2018 from https://theglobalobservatory.org/2014/03/deliver-humanitarian-aid-or-build-resilience-the-answer-is-in-the-context/.
Le Blanc D 2015. Towards integration at last? The sustainable development goals as a network of targets. Sustainable Development 23: 176–187.
Lewis, H., S. Kobak, and L. Johnson. 1973. Family, religion, and colonialism in central Appalachia or bury my rifle at Big Stone Gap. In Growing up country, ed. J. Axelrod. Clintwood, Va.; Council of the Southern Mountains.
Loos J, Abson DJ, Chappell MJ, Hanspach J, Mikulcak F, Tichit M, Fischer J. 2014. Putting meaning back into “sustainable intensifica tion.” Frontiers in Ecology and the Environment 12: 356–361.
Lowdermilk, W., 1942, 1999. Conquest of the Land Through 7,000 Years. USDA, NRCS Publication 99. Retrieved March 12, 2018 from: http://epsc413.wustl.edu/Lowdermilk_Conquest_USDA.pdf
Lundgren JG, Fergen JK. 2011. Enhancing predation of a subterranean insect pest: A conservation benefit of winter vegetation in agroecosystems. Applied Soil Ecology 51: 9–16.
MacDonald GK, Brauman KA, Sun S, Carlson KM, Cassidy ES, Gerber JS, West PC. 2015. Rethinking agricultural trade relationships in an era of globalization. BioScience 65: 275–289.
Macdonald, K. 2007. Globalising justice within coffee supply chains? Fair Trade, Starbucks and the transformation of supply chain governance. Third World Q. 28, 793–812.
Moore, M-L, O. Tjornbo, E. Enfors, C. Knapp, J. Hodbod, J. A. Baggio, A. Norström, P. Olsson, D. Biggs, 2014. Studying the complexity of change: Toward an analytical framework for understanding deliberate social-ecological transformations. Ecol. Soc. 19, 54.
Morrow, P. A., 1911. Eugenics and venereal disease. The Dietetic and Hygienic Gazette, Vol. 27 p. 12.
Morrow, B. H. (1999). Identifying and mapping community vulnerability. Disasters, 23(1), 1-18.
Mortensen DA, Egan JF, Maxwell BD, Ryan MR, Smith RG. 2012. Navigating a critical juncture for sustainable weed management. BioScience 62: 75–84.
Munk, N. 2013. The Idealist: Jeffrey Sachs and the Quest to End Poverty (Knopf Doubleday Publishing Group, 2013).
Olsson, L., Anne Jerneck1, Henrik Thoren2, Johannes Persson2 and David O’Byrne, 2015. Why resilience is unappealing to social science: Theoretical and empirical investigations of the scientific use of resilience. Science Advances, Vol. 1, no. 4, DOI: 10.1126/sciadv.1400217.
Pickett STA Parker VT Fiedler PL . 1992. The new paradigm in ecology: Implications for conservation biology above the species level. Pages. 65-88. in Fiedler PL, Jain SK, eds. Conservation Biology: The Theory and Practice of Nature Conservation, Preservation, and Management. New York: Chapman and Hall.
Pingali PL, Traxler G. 2002. Changing locus of agricultural research: Will the poor benefit from biotechnology and privatization trends? Food Policy 27: 223–238.
Pitarch-Garrido, M-D. 2018. Social Sustainability in Metropolitan Areas: Accessibility and Equity in the Case of the Metropolitan Area of Valencia (Spain). Sustainability, 10(2), 371. Accessed March 1, 2018 at: http://www.mdpi.com/2071-1050/10/2/371/htm.
Pollard K. & Jacobsen, L.A. (2012) The Appalachian Region: A Data Overview from the 2006-2010 American Community Survey. Retrieved April 12, 2014 from http://www.arc.gov/assets/research_reports/PRB-DataOverview-2012.pdf
Ponisio LC, M’Gonigle LK, Mace KC, Palomino J, de Valpine P, Kremen C. 2015. Diversification practices reduce organic to conventional yield gap. Proceedings of the Royal Society B: 282 (art. 20141396).
Pugh, J. (2014) Down Comes the Mountain: Coal Mining and Health in Central Appalachia from 2000 to 2010. Paper presented at the Proceedings from Population Association of America (dissertation) University of Louisville. Retrieved October 12, 2015 from http://ir.library.louisville.edu/cgi/viewcontent.cgi?article=2161&context=etd
Porkka M, Kummu M, Siebert S, Varis O. 2012. From food insufficiency towards trade dependency: A historical analysis of global food availability. PLOS ONE 8 (art. e82714).
Robinson, C., 2015. An Exploration of Poverty in Central Appalachia: Questions of Culture, Industry, and Technology. KOME, 3(2), 75-89.
Ruel, M., and H. Alderman, 2013. “Nutrition-Sensitive Interventions and Programmes: How Can They Help to Accelerate Progress in Improving Maternal and Child Nutrition?” The Lancet 382 (9891): 536–551
Schlenker W, Lobell DB. 2010. Robust negative impacts of climate change on African agriculture. Environmental Research Letters 5 (art. 014010).
Schwarzweller, H.K., James S. Brown, and J. J. Mangalam, 1971. Mountain Families in Transition: A Case Study of Appalachian Migration (University Park: Pennsylvania State Univ. Press,), p. 63.
Steffen W, Richardson K, Rockström J, Cornell SE, Fetzer I, Bennett EM, Biggs R, Carpenter SR, de Vries W, de Wit CA. 2015. Planetary boundaries: Guiding human development on a changing planet. Science 347 (art. 1259855).
Schipanski ME, Bennett EM. 2011. The influence of agricultural trade and livestock production on the global phosphorus cycle. Ecosystems 15: 256–268.
United Nations, 2015. Historic New Sustainable Development Agenda Unanimously Adopted by 193 UN Members. Retrieved March 12, 2018 from: http://www.un.org/sustainabledevelopment/blog/2015/09/historic-new-sustainable-development-agenda-unanimously-adopted-by-193-un-members/.
Varda, D. M., Chandra, A., Stern, S. A., & Lurie, N. (2008). Core dimensions of connectivity in public health collaboratives. Journal of Public Health Management and Practice, 14(5), E1-E7.
Varda, D. M., Forgette, R., Banks, D., & Contractor, N. (2009). Social network Methodology in the study of disasters: Issues and insights prompted by post-Katrina research. Population Research and Policy Review, 28, 11-29.
Walls, D.S. and D. B. Billings, 1977. The Sociology of Southern Appalachia. Appalachian Journal, 5:1, pp. 131-144
Wright, D.K., 2017. Humans as Agents in the Termination of the African Humid Period, Frontiers in Earth Science. DOI: 10.3389/feart.2017.00004
Education
Every aspect of our project required participation from producers. Information dissemination and outreach to producers is crucial to the success of our project and was integrated at several points in the project plan of work. Unlike many research projects, this project required active participation of many farmers, researchers and educators to be successful. To insure this happened, we recruited numerous stakeholders from across the spectrum of Southern food and agriculture systems including both land grant and non-land grant institutions, policy organizations inside and outside of government, large and small farmers, commodity producers and direct marketers, government and non-profit information providers focused on both environmental effects and production needs of Southern agricultural systems.
Our target audience for active participation in the project was managers of agricultural systems, including farms, marketing systems, research systems, Extension systems, and policy systems. Involvement of these managers in identifying constraints and developing opportunities was crucial to the success of this project.
Our target audience for long-term information/education and outreach is farmers, researchers and educators interested in increasing sustainability/resilience of agricultural systems in the South. Though the primary focus is producers, we will provide materials to assist a broader audience in understanding sustainable agriculture in the South. Included in these target audiences are:; students at all levels (i.e., primary and secondary schools, colleges and universities); the general public; and international audiences.
Goals of Project Outreach and Information Dissemination. Our first goal was increased knowledge of constraints and opportunities for increasing sustainability/resilience of Southern agricultural systems. Our second goal was an enhancement of the resources on which sustainability/resilience is based: increased networking of farmers, researchers and educators; increased numbers of managers and future managers of Southern food and agricultural systems engaged in removal of constraints to Southern agricultural sustainability/resilience; increased knowledge of a variety of tools which can increase the system qualities which lead to resilience of Southern agriculture; increased knowledge of the ecological resilience perspective on sustainability—specifically how maintenance/redundancy, modular connectivity, complementary diversity, local self-organization, accumulation of reserves and productive infrastructure, conservative innovation, ecological integration and periodic transformation contribute to sustainability/resilience.
Networking and team-building. Consistent with the ecological resilience perspective on sustainability, one of our primary goal was increasing connectivity among managers both within and between Southern food and agriculture subsystems (bonding and bridging social capital, respectively). This team-building focused on the need for every manager to establish both a team of colleagues and supporters to both collaborate with and serve as a network of mentors.
Educational & Outreach Activities
Participation summary:
Every aspect of our project requires participation from producers. Information dissemination and outreach to producers is crucial to the success of our project and has been integrated at several points in the project plan of work. Unlike many research projects, this project requires active participation of many farmers, researchers and educators to be successful. To insure this happens, we have already recruited numerous stakeholders from across the spectrum of Southern food and agriculture systems including both land grant and non-land grant institutions, policy organizations inside and outside of government, large and small farmers, commodity producers and direct marketers, government and non-profit information providers focused on both environmental effects and production needs of Southern agricultural systems.
Our target audience for active participation in the project was managers of agricultural systems, including farms, marketing systems, research systems, Extension systems, and policy systems. Involvement of these managers in identifying constraints and developing opportunities was crucial to the success of this project.
Our target audience for long-term information/education and outreach are farmers, researchers and educators interested in increasing sustainability/resilience of agricultural systems in the South. Though the primary focus will be producers, we will provide materials to assist a broader audience in understanding sustainable agriculture in the South. Included in these target audiences are:; students at all levels (i.e., primary and secondary schools, colleges and universities); the general public; and international audiences.
Goals of Project Outreach and Information Dissemination. Our first goal was increased knowledge of constraints and opportunities for increasing sustainability/resilience of Southern agricultural systems. Our second goal was enhancement of the resources on which sustainability/resilience is based: increased networking of farmers, researchers and educators; increased numbers of managers and future managers of Southern food and agricultural systems engaged in removal of constraints to Southern agricultural sustainability/resilience; increased knowledge of a variety of tools which can increase the system qualities which lead to resilience of Southern agriculture; increased knowledge of the ecological resilience perspective on sustainability—specifically how responsive redundancy, modular connectivity, complementary diversity, local self-organization, increasing productive infrastructure, conservative innovation, ecological integration and periodic transformation contribute to sustainability/resilience.
Networking and team-building. Consistent with the ecological resilience perspective on sustainability, one of our primary goal was increasing connectivity among managers both within and between Southern food and agriculture subsystems (bonding and bridging social capital, respectively). This team-building focused on the need for every manager to establish both a team of colleagues and supporters to both collaborate with and serve as a network of mentors.
Learning Outcomes
Project Outcomes
Project progress and success was measured by achievement of the outputs listed below for the project activities. Each activity is associated with a particular Objective as noted in its number. These outputs were tracked by the PMET to insure the project is on track to achieve its goals. O
Objective 1. Explore the qualities conditioning ecological resilience in highly productive Southern agricultural systems (Delta, High Plains) through semi-structured interviews, focus groups and case studies in adjoining counties with opposite resilience scores.
Activity 1.1. Interviews, focus groups and case studies on ecological resilience in Delta and High Plains, March-Oct 2016, resulting in complete case studies and local partners selected The results of these interactions will inform survey creation of Objective 2.
Output: Interviews with 40 farmers from both the Delta and High Plains from adjacent counties with opposite SRI scores.
Output: Focus groups of farmers who participated in interviews and community leaders. At least two will be held in each region.
Output: Case studies of counties with opposing scores on the draft SRI. At least four case studies will be developed in each region.
Activity 1.2. Develop resilience opportunity conference framework, March-Oct 2016, resulting in workshop framework finalized.
Output: Based on results of first three outputs, a framework will be developed for inclusion of researchers and educators with farmer and community leaders in exploration of potential research and education projects to remove constraints identified. This will be input to Objective 4.1.
Objective 2. Elaborate and refine a resilience index based on county level secondary databases.
Activity 2.1. Access and analyze secondary data bases to revise Sustainability/Resilience index (SRI). Based on interviews and focus groups conducted under Objective 1, we will chose databases which refine SRI to make SRI a valid instrument in highly productive counties.
Output: The revised SRI will be used to generate scores and maps for all counties in the South.
Objective 3. Determine the relationship between the resilience index and poverty, health and population indicators in regions which rank high on the resilience index and low on quality of life indicators.
Activity 3.1. Interviews, case studies and focus groups on SRI and Quality of Life.
Output: Recommendations on revisions needed in SRI and indicators which best represent the quality of life in rural counties.
Activity 3.2: Quality of Life index (QLI) created from poverty, health, pop. data.
Output: Scores, maps and statistical analysis completed on secondary databases combined into a QLI.
Activity 3.3: Quantitative relationships between SRI and QLI established through statistical analysis,
Output: Statistical relationship between SRI and QLI as well as all components of each index determined.
Objective 4. Develop research and education prototypes in highly productive regions through Opportunity Workshops for farmers, researchers and community leaders.
Activity 4.1. Two Opportunity Conferences will facilitate farmers, educators, researchers and community leaders’ use the construct group method to focus on solutions to constraints identified under Objective 1.
Output: Prototype research and education projects will result and be used as input to Activity 4.2.
Objective 5.) Establish a continuing education process on Southern sustainability and resilience through an interactive website which supplies county level data and online assessments for Southern farms and communities.based on analysis of all data from the first four Objectives
Activity 5.1 Interactive website development with website live by end of project
Output: An interactive website for individual on-line training, webinars, presentation and dissemination of the decision model, and evaluation surveys will be available to contribute national and international training in concepts and results of the project. The State of the South website will be launched in Summer 2014 with results of Objective 1 and updated at least monthly throughout the project with data from all project activities. The website will monitor the number of people accessing the information posted, which will allow us to know the size of the audience we are reaching electronically. The website will include with a feedback section for participants to comment on the information available. This output will not only lead to training for thousands of people, it will also encourage participation in project activities including Activity 4.2 and all activities under Objective 5.
Activity 5.2. Publicize and discuss results at regional conferences
Output: At regional conferences (Southern SAWG, Kentucky Small Farm Conference, Mississippi Sustainable Agriculture Network Conference, and various other state organizations’ conferences), we will present results and engage attendees in focus group activities to stimulate thought on research and education solutions to make agricultural systems more sustainable/resilient in the South.
Activity 5.3 Publish Southern Farm and Community Resilience book and peer-reviewed articles
Output: All project research will be summarized into a publication which presents all models and prototypes, case studies, survey, and secondary databases to establish opportunities for establishing more sustainable/resilient agricultural systems in the Southern region. This publication will be accompanied by publications of findings in peer reviewed journals and presented at conferences internationally.