Final report for LS18-287
Project Information
The purpose of this project is to move nursery production towards more sustainable management practices. To accomplish this task, evidence-based recommendations are needed to improve wood ornamental cropping while minimizing weed, pest arthropod and disease concerns. Our project will evaluate the impacts of cover crop use in field-grown woody ornamental production.
While the impact of cover crops has been studied extensively in row crop and vegetable production, less is known about how cover crops may positively or negatively affect perennial woody ornamental production. Woody ornamental production systems are complicated to manage due to the many plant species grown on a single nursery. To effectively serve this industry, management solutions must be applicable to a wide range of tree and shrub crops. Of particular interest to growers is the amount of competition endured by trees in fields with cover crops growing within tree rows as compared to rows with weeds or those kept clean with pre-emergent herbicides. The presence of cover crops may alter arthropod pest and beneficial communities as well. An additional gap in our knowledge base is the efficacy of biofumigant cover crops for management of soil-borne diseases in multi-year cropping systems such as those of woody perennials.
The objectives include an investigation of the use of cover crops in woody ornamental production systems through:
- The evaluation of winter cover crop stand recovery and tree seedling development after fall or spring transplant of tree liners;
- The evaluation of summer and winter cover crop rotations in established tree production areas;
- Optimization of winter cover crops methods for management of key woody ornamental tree pest, the flatheaded appletree borer, and;
- The incorporation of biofumigant cover crops for treatment of soils prior to liner transplant.
The impact of these practices on soil-borne pathogens, soil quality, pest and beneficial arthropod populations, weed pressure, and plant growth will be evaluated.
Cooperators
- - Producer (Researcher)
- - Producer (Researcher)
- - Producer (Researcher)
Research
Obj 1. Studies will be conducted at the Otis L. Floyd Nursery Research Center in McMinnville, TN (TSUNRC) and at field sites in the five-county nursery production area of middle Tennessee with grower cooperators. We will use a popular cultivar of red maple as our model woody ornamental tree ('Brandywine').
Maple Field Plots and Containerized Trees. Rooted cuttings of red maple will be grown to approximately ¼ in diameter in #3 nursery pots. Containers will be fertilized with a complete slow release fertilizer with micronutrients for transplant into field blocks. Trees will be planted in a common nursery industry pattern of five rows with row spacing of 7 ft apart with 6 ft in-row spacing between trees. Soil will be tested for phosphorous and potassium levels and will be supplemented if necessary. Trees will be fertilized with a granular slow release fertilizer at 50 lb N/acre (15-15-15 [NPK]; 0.4 oz/tree) in February and thereafter in subsequent years during February at the same rate.
Cover Crop Plot Establishment. The purpose of this experiment is to identify cover crops that are compatible with standard woody ornamental field transplant practices. Winter cover crops (e.g. winter wheat, crimson clover) will be planted in September - October (optimal timing for each cover crop species) in 32 ´ 32 ft field plots with four replicates per cover crop. Plots will be prepared by disk harrow and cover crop seeds broadcast, followed by a cultipacker to incorporate seed into the soil. Field preparation and seeding will be timed prior to a rain event, if possible, to maximize cover crop establishment. Plots with no cover crop will be used as controls. In early November (fall transplant) or early March (spring transplant), tree rows will be planted into the cover crop plots with a transplanter (25 trees per plot, 100 trees total per cover crop treatment). The disturbed soil will be re-packed following the pass by the transplanter. A pre-emergent herbicide (e.g., Sureguard, Marengo rotation) will be applied post-transplant within tree rows to prevent weed/cover crop competition at the base of the trees.
Soil Evaluation. Soil temperature and soil moisture (volumetric water content) will be evaluated. Each plot will be sampled randomly at 4 locations each within rows and within middles. Readings will be taken monthly using a Decagon GS3 Soil Moisture Sensor with Decagon ProCheck handheld reader. Soil mineral content and organic matter analysis will be assessed at project termination by pooling three samples per plot and analyzed by the UT Soil, Plant and Pest Center for analysis.
Cover Crop Plot Evaluation. Cover crop density will be evaluated in the plots before tree planting. Following tree planting, density of cover crop and weed pressure will be evaluated monthly in tree rows and middles in four locations within rows and middles for each plot. Cover crops will be allowed to senesce naturally and then mowed in early August. Percent coverage will be assessed every two months using 12 in. sampling squares at four random locations each within rows and within middles for each plot. Biomass will be evaluated at project termination using 12 in. sampling squares at four random locations each within rows and within middles for each plot.
Weed Assessment. Percent coverage will be collected every two months using 12-inch sampling squares at four random locations each within rows and within middles for each plot. Species frequency data will be collected to assess differences in weed species distribution between treatments.
Tree Growth. Tree height and trunk diameter (6 in. above the soil line) of all test trees will be recorded at transplant and during subsequent years in September to determine growth effects of different cover crops for the initial growing season. Trees will be marked at the initial trunk diameter measurement with a paint marker to ensure all future measurements are taken at the same location on the tree trunk.
Soil Sampling and Greenhouse Bioassay for Soil-borne Pathogen Analysis. Soil sampling to evaluate soil pathogens will be conducted at cover crop senescence each year for the first and second year bioassays, respectively. Four soil samples (from 12 × 12 in. and 8 in. deep) will be taken randomly from the plots, mixed in situ with a spade, and placed in a plastic bucket (for each treatment: 4 replications each; 8 samples total). The soil will be stored for 1 week, at ambient temperature in a greenhouse before use.
A greenhouse experiment will be conducted to determine whether cover crop soil can suppresses two common maple tree pathogens (R. solani and P. nicotianae). A 13 lb soil sample from each treatment/plot will be taken and divided into a 1 lb soil capacity container pot for each of the two-soil pathogen and one-control treatments. Control treatments will consist of non-cover cropped soils from the same production fields to assess background pathogen pressure. Rooted cuttings of red maple will be transplanted into the field soil and disease symptoms will be assessed 2 months later. For each bioassay, the experimental design will be a randomized complete block design (RCBD) with four replicates.
Pest and Beneficial Insect Assessments. Maple tree plots will be evaluated for major arthropod pests of maple trees including FAB and other insects and mites (Table 2). FAB evaluations will be done in October and April each year of the study. Evaluations of most pests will be made throughout the growing season to determine whether cover crops alter pest pressure. Monthly surveys for arthropod predators (ladybugs, lacewings, spiders, predatory bugs and mites etc.) will be conducted from May - September by beat sampling a sub-sample of trees at the center of each cover crop plot.
Obj 2. The purpose of this objective is to identify cover crop species and methods compatible with established nursery fields. Field tree plots (32 ´ 32 ft) previously established by the research team or grower collaborators will be used for these trials. Winter and summer cover crop seed (e.g. winter rye, crimson clover, cowpea, pearl millet) will be applied in September - October (winter cover crop) and March - April (summer cover crop) to established field plots in 32 × 32 ft blocks in a RCBD with four replicates per cover crop. Seed will be applied to plots by three methods (1) with a broadcast spreader and disked lightly into row middles and (2) with seed drill. Plots with no cover crop will be used as controls. A pre-emergent herbicide (e.g. Sureguard, Marengo) will be applied to the tree rows to prevent weed/cover crop competition at the base of the trees. Evaluations will follow the methods of Obj 1.
Obj 3 (a) Method development to maximize tree growth in cover-cropped plots. Previous research has demonstrated that winter cover crop stands grown within tree rows can prevent FAB attacks on tree trunks. However, the presence of cover crops at the base of the trees resulted in significant reductions in growth during the first and second years of planting compared to trees in rows that were kept clean with pre-emergent herbicides. Three methods of cover crop management will be evaluated to maximize growth of trees while minimizing the threat of FAB attacks. 1) Trees will be transplanted and grown with tree ring mulch mats extending in a 1 ft radius around the base of the tree; 2) a selective post-emergent herbicide will be used to kill the cover crop within the tree rows when it reaches 60 cm in height to reduce competition; and 3) a pre-emergent herbicide will be used to maintain a clean 1 ft radius around the tree trunks. Control trees will be grown under the current recommended practice, maintaining clean tree rows with pre-emergent herbicide applications. Tree growth and FAB attacks will be evaluated for 2 years post- transplant. While not specifically an objective of this experiment, the use of mulch mats to prevent weeds at tree bases will address the current debate among researchers over whether or not pre-emergent herbicide treatments cause more FAB attacks.
(b) Evaluation of tree growth recovery. (2017-2019). Based on previous studies, we know that most FAB attacks occur during the first and second years post-planting. Once trees are better established, a cover crop maintained at the base of trees might not be necessary for protection against FAB. Red maple tree plots from a previous FAB cover crop study (SSARE #OS14-084) will be used to assess the growth of trees in years 3 and 4 post-planting with all trees are grown with clean rows. Four pre-treatments (from years 1 and 2) will be evaluated: (1) cover cropped plots (2) cover cropped and insecticide treated plots (3) herbicide treated plots and (4) herbicide and insecticide treated plots. For all tree plots, middles will be sown with a cover crop while tree rows will be kept clean with pre-emergent herbicide applications. Tree growth will be measured in years 3 and 4 to determine whether trees grown with cover crops in tree rows during establishment years 1 and 2 can catch up to larger trees during the following two years of production. Attacks by FAB in years 3 and 4, while rarer, will also be monitored.
Obj 4. Soil Biofumigant Field Evaluation Trial. White mustard, purple top forage turnips, astro arugula, mighty mustard, dwarf essex rape, amara mustard and oriental mustard biofumigant cover crops will be evaluated in field trials at the TSUNRC (Table 3) based on the preliminary data from greenhouse studies showing efficacy of these plants as biofumigants (Liyanapathiranage 2017). The experiments will be established as a RCBD with four replications. At the TSUNRC, field beds will be artificially inoculated with Phytophthora nicotinanae and Rhizoctonia solani using established protocols developed by Dr. Baysal-Gurel. Biofumigants will be direct seeded into 26 ´ 8 ft beds at the recommended seed rate. Flowering biofumigant plants will be dug from randomly chosen 1-ft2 areas in each plot to determine plant biomass volumes. Biofumigants will be disked 6 in. deep into the soil in late July. After incorporation, plots will be covered with a polythene sheet for 15 days. Temperature and soil moisture in the plots will be monitored using WatchDog mini stations. Two additional treatments without biofumigant cover crops or polythene sheets will be used as controls, including: (1) inoculated and (2) non-inoculated plots. Soil tests will be performed to determine levels of macro and micro- nutrients, soil pH and organic matter.
Soil Pathogen Evaluation. Before and after incorporation of biofumigant cover crops, population density of R. solani, P. nicotinanae and fluorescent pseudononads bacteria will be determined using selective or semi-selective media. Soil samples will be taken to a depth of 6 in. from each plot and stored at 40°F for 1 day. Isolated colonies will be confirmed by pathogen morphology. Maple tree liners will be planted after biofumigation the following fall. Plots will be irrigated as needed. Disease occurrence and incidence will be evaluated the following spring. Area Under the Disease Progress Curves will be calculated using the formula AUDPC = Σ[(Xi+1 + Xi)/2](ti+1–ti) (Simko and Piepho 2012). Plants will be evaluated for root development and disease severity on roots at the end of the trial using a 1-5 ordinal scale where 1 = healthy, 2 = 25% or less roots necrotic, 3 = 26 - 50% roots necrotic, 4 = more than 50% roots necrotic, and 5= plant dead. Fresh weight and plant height will be recorded at the end of the trial in addition to a plant phytotoxicity rating for trees in each biofumigant treatment.
Tree Growth Measures: Tree height and trunk diameter will be measured as previously described to assess biofumigant cover crop effects on plant growth. Trees also will be rated in early summer for any visual phytotoxicity symptoms resulting from the metabolic byproducts of the biofumigant cover crops. Although it is unlikely biofumigant cover crops will impact FAB, trees will still be rated as previously described in case metabolic byproducts of biofumigants reduce FAB activity.
Objective 1
Two trials were conducted to assess time of planting and cover crops on tree growth. Cover crops were established in October 2018 and maple trees were transplanted into the field in fall 2018 and spring 2019. Baseline levels of soil moisture have been recorded since cover crop was established and the initial height and diameter of the trees has been measured. Cover crop densities were evaluated in March 2019 and will be repeated again in April 2019.
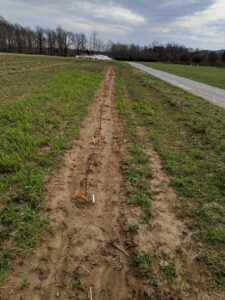
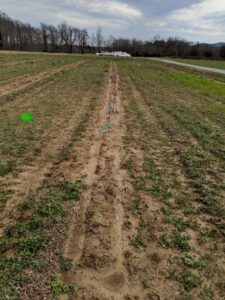
Cover crop and weedy middles.
Data from insect populations, tree growth and soil health were collected from April-July 2019. Insect samples were collected using yellow sticky cards held just above the cover crop and pitfall traps arranged at the center of each plot. Samples will be processed to the lowest classification possible. Soil samples were collected and bioassayed for pathogenicity. Preliminary results suggest that cover crop and weedy plots have different insect communities and resistance to soilborne pathogens. Also, spring transplanted trees grew more than fall transplanted trees in the first year. We hypothesize that this is due to earlier bud break of spring transplanted trees due to the deeper dormancy of fall planted trees compared to trees which were held under plastic over winter.
In fall 2019, a second trial of the same experiment was initiated. Fall trees were transplanted in November 2019 and spring trees were planted in March 2020.
Plant Growth Measurement
In Trial 1, there was a significant difference in trunk diameter growth, with Cover Crop Spring Transplant adding an average of 17.3 ± 0.6 mm (average ± SE) after 1-yr post- transplant and 14.8 ± 0.5 mm (average ± SE) for Cover Crop Fall Transplant. Additionally, the Weed Spring Transplanted trees were larger with an average trunk diameter of 16.3 ± 0.5 mm and 15.9 ± 0.5 mm (average ± SE) for the Weed Fall Transplanted trees. The same trend was observed for plant height with taller trees occurring in the Cover Crop Spring Transplanted trees (average of 95.8 ± 3.4 cm) Cover Crop Transplanted trees (average 72.3 ± 2.4 cm). Trees in the Weed Spring Transplant plots were also taller than trees in the Fall Transplant plots; 83.2 ± 4.3 cm and 68.3 ± 2.2 cm, respectively (Table 1).
Table 1. Final trunk diameter and height for Trial 1, in 2019 after one year season grown in crimson clover or weedy plots.
|
Treatments |
Tree Height (cm) |
Tree Caliper (mm) |
|
|
Cover Crop Fall Transplant |
72.25 ± 2.44 cᶻ |
14.80 ± 0.51 b |
|
|
Cover Crop Spring Transplant |
95.75 ± 3.75 a |
17.35 ± 0.58 a |
|
|
Weeds Fall Transplant |
68.31 ± 2.19 c |
15.88 ± 0.45 ab |
|
|
Weeds Spring Transplant |
83.21 ± 4.30 b |
16.27 ± 0.48 ab |
|
|
F value |
22.75 |
5.95 |
|
|
df |
6 |
6 |
|
|
P value |
0.0001 |
0.0001 |
Treatment means within columns with different letters are statistically different by General Linear Model (GLM) with means separated by LSmeans adjusted Tukey analysis (P ˂ 0.05). Treatments: 1) Cover Crop Spring Transplant, 2) Weed Spring Transplant, 3) Weed Fall Transplant and 4) Cover Crop Fall Transplant. Cover crop used was crimson clover.
The results for Trial 2 at the end of year one season were unlike Trial 1. No difference was found in the trunk diameter growth for Cover Crop or Weed Spring or Fall Transplant. Cover Crop Spring and Fall Transplanted trees averaged 139.6 ± 3.0 cm and 136.7 ± 3.0 cm tall, respectively. However, there was a significant difference between Weed Spring Transplanted trees, with Spring Transplants growing taller than Fall Transplants (138.9 ± 2.5 cm and 131.6 ± 3.0 cm respectively) (Table 2).
Table 2. Final caliper and height for Trial 2, in 2020 after one year season grown in crimson clover or weedy plots.
|
Treatments |
Height (cm) |
Caliper (mm) |
|
|
Cover Crop Fall Transplant |
136.66 ± 3.01 abᶻ |
16.06 ± 0.44 a |
|
|
Cover Crop Spring Transplant |
139.41 ± 2.97 a |
16.45 ± 0.44 a |
|
|
Weeds Fall Transplant |
131.56 ± 2.98 b |
15.46 ± 0.39 a |
|
|
Weeds Spring Transplant |
138.91 ± 2.47 a |
16.47 ± 0.55 a |
|
|
F value |
33.06 |
8.27 |
|
|
df |
6 |
6 |
|
|
P value |
0.0001 |
0.0001 |
ᶻ Treatment means within columns with different letters are statistically different by General Linear Model (GLM) with means separated by LSmeans adjusted Tukey analysis (P ˂ 0.05). Treatments: 1) Cover Crop Spring Transplant, 2) Weed Spring Transplant, 3) Weed Fall Transplant and 4) Cover Crop Fall Transplant. Cover crop used was crimson clover.
Cover Crop Coverage and Density
In trial 1, there was no difference detected in the percentage area covered for Cover Crop Spring Transplant and Cover Crop Fall Transplant (F = 2.20, df = 1, P = 0.1979) treatments, but there was a significant difference with cover crop height (F = 9.02, df = 1, P = 0.030). Crimson clover in the Cover Crop Spring Transplanted plots had an average height of 38.3 ± 3.2 cm compared to 29.8 ± 0.8 cm in the Cover Crop Fall Transplanted plots. (Table 3).
Table 3. Cover crop height and percentage coverage, Trial 1 in April 2019.
|
Treatments |
Cover Crop Height (cm) |
% Coverage |
Biomass |
|
|
Cover Crop Fall Transplant |
29.8 ± 0.8 b |
9.7 ± 2.1 a |
43.6 ± 5.7 a |
|
|
Cover Crop Spring Transplant |
38.2 ± 3.2 a |
18.3 ± 6.3 a |
35.0 ± 3.5 ab |
|
|
F value |
9.02 |
2.2 |
3.09 |
|
|
df |
1 |
1 |
6 |
|
|
P value |
0.03 |
0.1979 |
0.0109 |
ᶻ Treatment means within columns with different letters are statistically different by General Linear Model (GLM) with means separated by LSmeans adjusted Tukey analysis (P ˂ 0.05). Treatments: 1) Cover Crop Spring Transplant, 2) Cover Crop Fall Transplant. Cover crop used was crimson clover.
There was no difference detected in the average dry weight of Cover Crop Fall Transplant and Cover Crop Spring Transplant (43.6 ± 5.7 g and 34.9 ± 3.5 g, respectively), though the trend was for higher biomass in the Fall Transplant plots (Table 4).
Table 4. Dry weight of middle biomass from experimental field plots (mean ± SEM) in trial 1 in 2019.
|
Treatments |
Average Dry Weight (g) |
|
|
Cover Crop Fall Transplant |
43.6 ± 5.7 aᶻ |
|
|
Cover Crop Spring Transplant |
35.0 ± 3.5 ab |
|
|
Weeds Fall Transplant |
35.9 ± 4.7 ab |
|
|
Weeds Spring Transplant |
29.3 ± 2.5 b |
|
|
F value |
3.09 |
|
|
df |
6 |
|
|
P value |
0.0109 |
|
ᶻ Treatment means within columns with different letters are statistically different by General Linear Model (GLM) with means separated by LSmeans adjusted Tukey analysis (P ˂ 0.05).
In trial 2, there was no difference detected in the percentage area covered for Cover Crop Spring Transplant and Cover Crop Fall Transplant (F = 0.49, df = 1, P = 0.51), as well as for cover crop height (F = 0.35, df = 1, P = 0.578) (Table 5).
Table 5. Average (± SE) height and percentage coverage of crimson clover crop after one year for Trial 2 (2020).
|
Treatments |
Cover Crop Height (cm) |
% Coverage |
|
|
Cover Crop Fall Transplant |
33.20 ± 4.25 a |
40.43 ± 1.54 a |
|
|
Cover Crop Spring Transplant |
38.43 ± 7.86 a |
42.87 ± 3.12 a |
|
|
F value |
0.35 |
0.49 |
|
|
df |
1 |
1 |
|
|
P value |
0.578 |
0.51 |
ᶻ Treatment means within columns with different letters are statistically different by General Linear Model (GLM) with means separated by LSmeans adjusted Tukey analysis (P ˂ 0.05). Treatments: 1) Cover Crop Spring Transplant, 2) Cover Crop Fall Transplant. Cover crop used was crimson clover.
Soil Moisture and Temperature Measurements
In trial 1, there was no significant difference detected for soil moisture and soil temperature between Cover Crop and Weed plots. The volumetric water content in the Cover Crop plots averaged 21.7 ± 1.2 % and 20.3 ± 1.2 % for Weeds. For the soil temperature, Cover Crop and Weed plots averaged 18.6 ± 1.1 °C and 18.6 ± 1.1 °C, respectively. Data were collected and analyzed for 7 mo, and February 2019 was the month with the lowest soil temperature for both treatments (average 6.5 ± 0.1 C°). The highest average soil temperature recorded was in June 2019 at 31.2 ± 0.2 C°. January 2019 was the month with the highest average volumetric water content (VWC) of 32.8 ± 2.1 %, and the lowest average (VWC) was May at 7.9 ± 0.9 %.
In trial 2, there was a similar trend with no significant difference detected for soil moisture and soil temperature between Cover crop and Weed plots. The volumetric water content in the Cover Crop and Weed plots averaged 22.94 ± 0.61% and 22.63 ± 1.03%, respectively. For the soil temperature, Cover Crop and Weed plots averaged 13.7± 1.1 °C and 13.7 ± 1.12 °C respectively. The month with the lowest average soil temperature was February at 3.9 ± 0.07 C°. The month with the highest average soil temperature was May at 27.23 ± 0.14 C°. February was the month with the highest average VWC at 24.7 ± 0.8%, and the lowest average VWC was January at 19.23 ± 0.7%.
Pest and Beneficial Insect Assessments
Key families of beneficial insects found in the plots included Staphylinidae, Carabidae Chalcidoidae, Platygastridae, Ichneumonidae, Anthocoridae, and Braconidae. Key families of pest species include Curculionidae, Thripidae, Aphididae, Cercopidae, Cicadellidae, and Cydnidae. There were no significant differences in family diversity indices between Cover Crop and Weeds plots in the pitfall traps, with a diversity index value for the Cover Crop and Weed plots of 5.1 ± 0.7 D and 4.4 ± 1.1 D, respectively (Table 6). Treatments were compared for equitability (evenness) with no statistical difference for average equitability of Cover Crop or Weed plots at 0.3 ± 0.02 ED and 0.3 ± 0.07 ED, respectively. A similar tendency was detected for the family richness with 15.0 ± 2.1 S and 14.0 ± 0.9 S for Cover Crop and Weed plots, respectively.
Table 6. Results of the diversity indices for the arthropod samples from the pitfall traps collected from May 2019 to July 2019 at the NRC Trial 1 plot.
|
Treatment |
Diversity index |
Equitability |
Family richness |
|
Cover Crop |
5.06 ± 0.69 aᶻ |
0.34 ± 0.02 a |
15.00 ± 2.12 a |
|
Weeds |
4.41 ± 1.13 a |
0.31 ± 0.07 a |
14.00 ± 0.91 a |
|
F value |
0.24 |
0.18 |
0.19 |
|
df |
1 |
1 |
1 |
|
P value |
0.6408 |
0.6882 |
0.68 |
ᶻTreatment means within columns with different letters are statistically different by General Linear Model with means separated by General Linear Model (GLM) with means separated by LSmeans adjusted Tukey analysis (P˂ 0.05). Cover crop used was crimson clover.
After analyzing the sticky traps collected during the summer in 2019, there was likewise no significant differences detected for diversity index (Table 7), equitability, and family richness between the Cover Crop and Weed plots.
Table 7. Results of the diversity indices for the arthropod samples from the sticky traps collected from May 2019 to July 2019 at the NRC Trial 1 plot.
|
Treatment |
Diversity index |
Equitability |
Family richness |
|
Cover Crop |
6.0 ± 0.9 aᶻ |
0.16 ± 0.03 a |
37.8 ± 0.8 a |
|
Weeds |
5.9 ± 1.5 a |
0.14 ± 0.03 a |
42.7 ± 2.17 a |
|
F value |
0 |
0.39 |
4.58 |
|
df |
1 |
1 |
1 |
|
P value |
0.9699 |
0.5569 |
0.0761 |
ᶻ Treatment means within columns with different letters are statistically different by General Linear Model with means separated by General Linear Model (GLM) with means separated by LSmeans adjusted Tukey analysis (P˂ 0.05). Cover crop used was crimson clover.
Soilborne Pathogen Resistance
Soils taken from cover cropped and weedy plots in objective 1 were assessed for resistance to soilborne pathogens. Red maple rooted cuttings were grown in inoculated cover cropped soil in 2019 (71.4 g) and non-inoculated cover cropped soil in 2020 (53.2 g) had a significantly higher total plant fresh weight than inoculated and non-inoculated control plants (Table 1). Similarly, plants grown in inoculated cover cropped soil had a significantly greater root fresh weight relative to non-inoculated non-cover cropped soil (50.9 g vs 38.7 g) in 2019, while plants in both inoculated (30.3 g) and non-inoculated cover cropped (33.2 g) soil had a significantly greater root fresh weight relative to inoculated non-cover cropped soil (24.5 g) in 2020. There were no significant differences in total plant and root fresh weight among cover cropped and non-cover cropped treatments.
Table 1. Means (±SE) of height increase (cm), total plant fresh weight (g) and root fresh weight (g) of maple plants grown under four cover crop treatments in two transplant seasons when Phytopythium vexans was inoculated in 2019 and 2020. Bold numbers in P-values denote significant treatment effects at P < 0.05.
|
|
2019 |
2020 |
|||||
|
|
|
Height increase |
Total plant fresh weight |
Root fresh weight |
Height increase |
Total fresh weight |
Root fresh weight |
|
|
|
P-values for the main and interactive effects |
|
||||
|
Seasonz |
0.3261 |
0.92 |
0.7002 |
0.1146 |
0.9462 |
0.8105 |
|
|
Cover cropy |
0.8585 |
0.0366 |
0.0268 |
0.0519 |
<0.0001 |
0.001 |
|
|
Season*cover crop |
0.3744 |
0.2795 |
0.2822 |
0.6085 |
0.7849 |
0.7676 |
|
|
|
|
Means for main effects |
|||||
|
Season |
Cover crop |
||||||
|
Fall |
- |
- |
- |
- |
- |
- |
|
|
Spring |
- |
- |
- |
- |
- |
- |
|
|
Cover crop, inoculated |
9.4±1.9 a |
71.4±5.5 a |
50.9±4.5 a |
10.7±0.5 a |
49.0±1.3 ab |
30.3±1.0 a |
|
|
Cover crop, non-inoculated |
11.1±2.5 a |
66.3±2.8 ab |
44.4±1.9 ab |
11.0±0.7 a |
53.2±2.1 a |
33.2±1.5 a |
|
|
Non-cover crop, inoculated |
8.7±1.9 a |
57.8±3.6 b |
39.7±3.1 ab |
9.1±0.6 a |
38.2±1.9 c |
24.5±1.4 b |
|
|
|
Non-cover crop, non-inoculated |
10.1±1.7 a |
58.0±2.9 b |
38.7±2.4 b |
9.1±0.6 a |
43.4±2.3 bc |
28.3±1.8 ab |
zSeason represents timing of cover crop disturbance caused by red maple plantation (fall transplant or spring transplant); yCover crop: soils for bioassay were collected from cover crop plots; non-cover crop: soils for bioassay were collected from non-cover crop plots; inoculated: plants were inoculated with Phytopythium vexans; non-inoculated: plants were not inoculated with pathogen. When the interaction (cover crop*season) is not significant (P > 0.05), treatment means for main effects in a column followed by the same letter are not significantly different. When the interaction is significant (P ≤ 0.05), treatment means for interactive effects (cover crop*season) followed by the same letter are not significant, otherwise the treatment means are presented without letter for informational purpose.
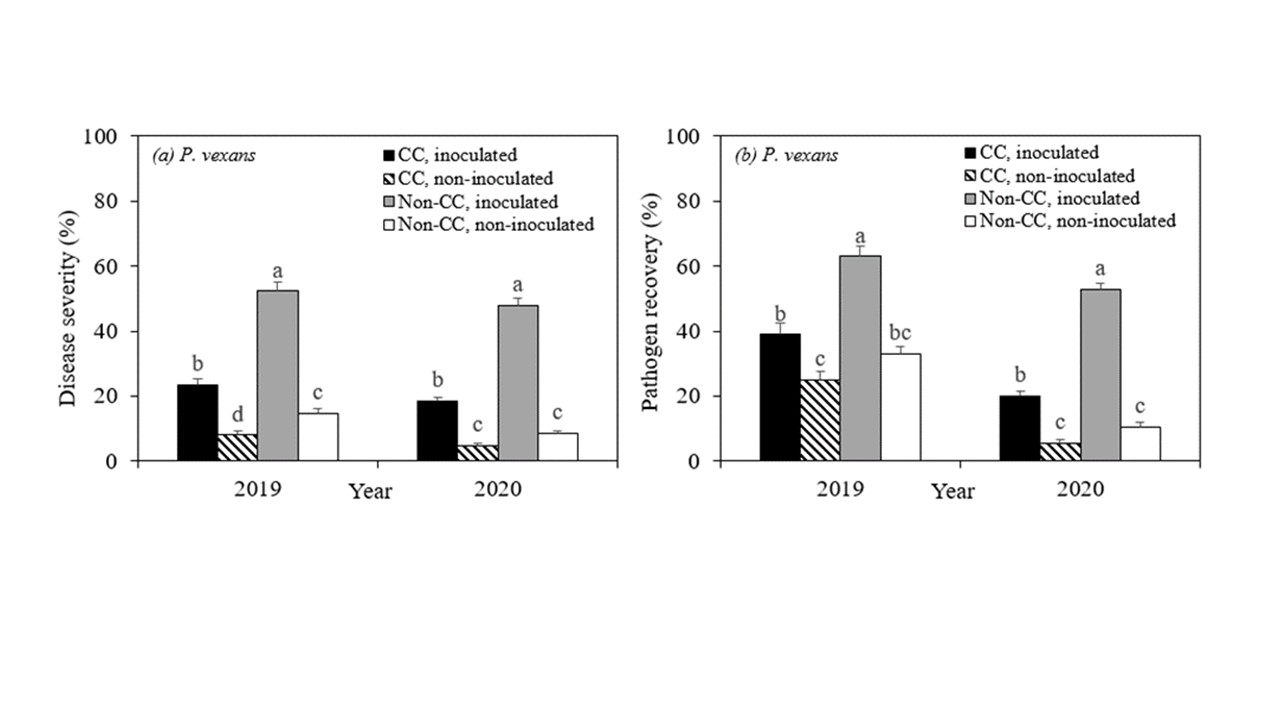
Disease severity in the roots of maple plants grown under inoculated non-cover cropped soils in 2019 and 2020 were 52.3% and 48.0%, which were significantly reduced to 23.5% and 18.5% under inoculated cover cropped soil, respectively (Figure 3a). Among the non-inoculated plants, significantly lower disease severity was observed under cover cropped in 2019 (8.0%), and numerically lower in 2020 (4.8%) as compared to non-cover cropped soils (14.8% in 2019 and 9.8% in 2020). Similarly, the significantly higher pathogen recovery was observed in plants grown under inoculated non-cover cropped soils in 2019 (63.0%) and in 2020 (48.0%), and was significantly lower, at 29.0% and 18.5%, under inoculated cover cropped soil in 2019 and 2020 (Figure 1). No significant differences were detected in pathogen recovery between non-inoculated cover cropped and non-inoculated non-cover cropped treatments. Disease severity and pathogen recovery were significantly lower in soils disturbed by fall transplant than spring transplant in 2019 (Table 3).
Table 2. P-values of two-way analysis of variance (ANOVA) test for the main and interactive effects of transplant season and cover crop on disease severity (%) and pathogen recovery (%) of maple plants inoculated with Phytopythium vexans in the year 2019 and 2020. Bold numbers denote significant treatment effects at P < 0.05.
|
|
|
2019 |
2020 |
||
|
|
|
Disease severity |
Pathogen recovery |
Disease severity |
Pathogen recovery |
|
Seasonz |
0.0045 |
0.00018 |
0.089 |
0.3022 |
|
|
Cover cropy |
<0.0001 |
<0.0001 |
<0.0001 |
<0.0001 |
|
|
Season*cover crop |
0.1098 |
0.9417 |
0.1323 |
0.2746 |
|
zSeason represents timing of cover crop disturbance caused by red maple plantation (fall transplant or spring transplant); yCover crop: soils for bioassay were collected from cover crop or without cover crop plots.
Table 3. Means (±SE) of disease severity (%) and pathogen recovery (%) of maple plants grown under two transplant seasons when Phytopythium vexans was inoculated in 2019 and 2020.
|
|
2019 |
2020 |
||
|
Season |
Disease severity |
Pathogen recovery |
Disease severity |
Pathogen recovery |
|
Fall |
22.0±2.6 b |
35.5±3.1 b |
21.0±3.1 a |
23.0±3.3 a |
|
Spring |
27.3±3.3 a |
44.5±2.8 a |
18.9±2.6 a |
21.5±3.3 a |
zSeason represents timing of cover crop disturbance caused by red maple plantation (fall transplant or spring transplant). Treatments means followed by the same letter in the column are not significantly different at P < 0.05.
Figure 1. Mean (±SE) of disease severity (%) and pathogen recovery (%) of maple plants grown under four cover crop treatments when Phytopythium vexans was inoculated; CC (cover crop): soils for bioassay were collected from cover crop plots; non-CC (non-cover crop): soils for bioassay were collected from non-cover crop plots. inoculated: plants were inoculated with Phytopythium vexans; non-inoculated: plants were not inoculated with pathogen (control). Treatments followed by the same letter are not significantly different at P < 0.05.
Objective 1 Discussion
A recommendation is needed for nursery growers regarding the optimal timing of red maple transplant into the cover crop (fall or spring) in order to maximize the beneficial impact of the cover crop for plant health. Cover crop is likely to be disturbed less while planting red maple soon after seeding the cover crop in the fall. Cover crops and soils structure will be disturbed more with spring transplant of the main crop. The disturbance timing is likely to impact soil microbial activity and pathogen pressure. We hypothesized that cover crops would reduce root rot disease severity caused by soilborne pathogens. As predicted, we found that the use of crimson clover as a cover crop significantly reduced the disease severity and pathogen recovery in maple plants from soils in both years. This finding is consistent with the significant reduction in disease severity and pathogen recovery demonstrated recently in two previous cover crop studies in maple plants. What was unexpected was the trend for greater growth of trees in spring transplanted plots. This was consistent across 2 trials and contradicts some other previous work. Two important details to note are 1) the trees used in this study were container trees, not bare root and 2) the spring transplanted trees were overwintered in a plastic covered hoop house. It was noted that the spring transplanted trees broke dormancy faster than the fall transplanted trees. This 'head start' is the likeliest cause of the observed increase in growth. Based on these results, we recommend use of a winter cover crop as it was better at disease suppression than soils with naturally occurring weeds. And while either planting time appeared acceptable for cover crop stand recovery, spring planting of containerized plants may aid in increasing first year growth.
Objective 2
Cover crops were established in October 2018 in established tree fields. Baseline levels of soil moisture have been recorded since cover crops were established. Cover crop densities were evaluated in March 2019 and will be repeated again in April 2019.
Field seeded in October. Flower City, McMinnville, TN.
Cover Crop Establishment.
Triticale established better with a Drill system, as expected by its recommended planting depth. Crimson clover, however, established similarly if applied by Broadcast or Drill (Table 1&2). Soil moisture content and temperature was similar across all treatments including weedy controls (Table 3&4).
Table 1. Average dry weight from samples collected at Pleasant Cove in cover crop and weed treatments.
|
Treatment |
Average dry weight |
|
Triticale Drill |
63.50 ± 3.30 |
|
Triticale Broadcast |
50.97 ± 6.26 |
|
Crimson clover Drill |
58.62 ± 5.74 |
|
Crimson clover broadcast |
57.14 ± 5.77 |
|
Weeds |
43.34 ± 4.39 |
|
F value |
2.23 |
|
df |
4 |
|
P value |
0.0737 |
Treatments: 1) Triticale Drill, 2) Triticale Broadcast, 3) Crimson Clover Drill, 4) Crimson Clover Broadcast, 5) Weeds as control.
Table 2. Average dry weight from samples collected at Flower City in cover crop and weed treatments.
|
Treatment |
Average dry weight |
|
Triticale Drill |
25.59 ± 1.19 bcᶻ |
|
Triticale Broadcast |
19.66 ± 1.19 c |
|
Crimson clover Drill |
27.55 ± 3.27 ab |
|
Crimson clover broadcast |
32.08 ± 2.38 a |
|
Weeds |
25.04 ± 1.90 bc |
|
F value |
3.95 |
|
df |
4 |
|
P value |
0.0058 |
ᶻTreatment means that do not share the same letter are significantly different (α=0.05). Treatments; 1) Triticale Drill, 2) Triticale Broadcast, 3) Crimson Clover Drill, 4) Crimson Clover Broadcast, 5) Weeds as control.
Table 3. Average soil moisture and soil temperature at Pleasant Cove in 2019.
|
Treatment |
Soil Moisture |
Soil Temperature |
|
Triticale Drill |
33.7 ± 1.8 |
15.3 ± 1.2 |
|
Triticale Broadcast |
35.4 ± 2.0 |
14.9 ± 1.2 |
|
Crimson clover Drill |
30.6 ± 1.9 |
15.0 ± 1.2 |
|
Crimson clover broadcast |
31.0 ± 2.0 |
15.1 ± 1.2 |
|
Weeds |
32.1 ± 1.8 |
14.7 ± 1.1 |
|
F value |
1.1 |
0.04 |
|
df |
4 |
4 |
|
P value |
0.3573 |
0.9975 |
Treatments; 1) Triticale Drill, 2) Triticale Broadcast, 3) Crimson Clover Drill, 4) Crimson Clover Broadcast, 5) Weeds as control.
Table 4. Average soil moisture and soil temperature at Flower City in 2019.
|
Treatment |
Soil Moisture |
Soil Temperature |
|
Triticale Drill |
26.1 ± 1.7 |
15.2 ± 1.5 |
|
Triticale Broadcast |
26.8 ± 1.5 |
15.2 ± 1.5 |
|
Crimson clover Drill |
26.7 ± 1.5 |
14.8 ± 1.4 |
|
Crimson clover broadcast |
26.8 ± 1.5 |
14.6 ± 1.4 |
|
Weeds |
26.1 ± 1.6 |
15.0 ± 1.5 |
|
F value |
0.05 |
0.03 |
|
df |
4 |
4 |
|
P value |
0.9944 |
0.9984 |
Treatments; 1) Triticale Drill, 2) Triticale Broadcast, 3) Crimson Clover Drill, 4) Crimson Clover Broadcast, 5) Weeds as control.
Pest and Beneficial Insect Assessments in Pleasant Cove
Key families of beneficial insects included, Anthocoridae, Carabidae, Charipidae, Cryptophagidae, Diapriidae, Ichneumonidae, and Platygastridae. Key families of pest species include Aphididae, Curculionidae, Cicadellidae, Drosophilidae, Mordellidae, and Thripidae. There was no significant difference in the diversity index between Broadcasted and Drilled Crimson Clover (3.7 ± 0.7 D and 6.0 ± 0.8 D, respectively). A similar trend was found when comparing Broadcasted and Drilled Triticale (6.8 ± 2.0 D and 5.7 ± 1.4 D). Arthropod equitability (evenness) was similar for Broadcasted and Drilled Crimson Clover (0.2 ± 0.05 ED and 0.3 ± 0.06 ED). No difference was detected between Broadcasted and Drilled Triticale (0.3 ± 0.07 ED and 0.3 ± 0.05 ED). A similar trend was repeated when comparing the family richness for Broadcast Crimson Clover (18.0 ± 1.3 S) and Drilled Crimson Clover (21.5 ± 2.3 S). Both triticale plots performed similarly with 23.5 ± 2.3 S for Broadcast Triticale and 19.7 ± 1.1 S for Drilled Triticale (Table 5).
The sticky traps collection had, no significance difference detected for any treatment when comparing the diversity index, evenness, and richness (Table 6).
Pest and Beneficial Insect Assessments in Flower City
Key families of beneficial insects included, Anthocoridae, Charipidae, Carabidae, Cryptophagidae, Diapriidae, Ichneumonidae, and Platygastridae. Key families of pest species include Aphididae, Curculionidae, Cicadellidae, Drosophilidae, Mordellidae, and Thripidae. There was no difference in the diversity index for Broadcast and Drilled Crimson Clover (5.9 ± 0.6 D and 6.3 ± 1.2 D). Triticale plots performed similarly with no difference for diversity index for Broadcast Triticale (6.9 ± 1.2 D) or drilled Triticale (3.7 ± 0.7 D).
No difference was detected for arthropod equitability with 0.3 ± 0.07 ED for Broadcasted Crimson Clover and 0.2 ± 0.05 ED for Drilled Crimson Clover. Triticale plots were similar between, Broadcast Triticale (0.3 ± 0.04 ED) and Drilled (0.2 ± 0.05 ED). Again, no difference was found when comparing for arthropod richness with 24.2 ± 5.5 S Broadcast, and 25.0 ± 0.7 S for Drilled Crimson Clover. With the triticale plots, no difference was detected with 22.7 ± 1.4 S for Broadcast and 23.5 ± 1.7 S for Drilled Triticale (Table 7). Likewise, there was no significant difference after analyzing the sticky traps for any treatment when comparing the diversity index, evenness, and richness (Table 8).
Table 5. Mean arthropod diversity index, equitability, and family richness at the Pleasant Cove plots from the pitfall traps collected from May 2019 to July 2019.
|
Treatment |
Diversity index |
Equitability |
Family richness |
|
Crimson Clover Broadcast |
3.75 ± 0.71 |
0.22 ± 0.05 |
18.00 ± 1.35 |
|
Crimson Clover Drill |
6.03 ± 0.79 |
0.30 ± 0.06 |
21.50 ± 1.94 |
|
Triticale Broadcast |
6.76 ± 2.02 |
0.28 ± 0.07 |
23.50 ± 2.33 |
|
Triticale Drill |
5.68 ± 1.37 |
0.28 ± 0.05 |
19.75 ± 1.11 |
|
Weeds |
5.04 ± 0.60 |
0.22 ± 0.02 |
22.50 ± 1.66 |
|
F value |
0.87 |
0.47 |
1.61 |
|
df |
4 |
4 |
4 |
|
P value |
0.5039 |
0.7573 |
0.2231 |
Treatments; 1) Triticale Drill, 2) Triticale Broadcast, 3) Crimson Clover Drill, 4) Crimson Clover Broadcast, 5) Weeds as control.
Table 6. Mean arthropod diversity index, equitability, and family richness at the Pleasant Cove plots from the sticky traps collected from May 2019 to July 2019.
|
Treatment |
Diversity index |
Equitability |
Family richness |
|
Crimson Clover Broadcast |
6.22 ± 0.81 aᶻ |
0.23 ± 0.02 a |
27.75 ± 3.20 a |
|
Crimson Clover Drill |
5.65 ± 0.23 a |
0.19 ± 1.78 a |
30.00 ± 1.78 a |
|
Triticale Broadcast |
7.49 ± 1.41 a |
0.28 ± 0.06 a |
27.50 ± 1.32 a |
|
Triticale Drill |
8.10 ± 0.59 a |
0.30 ± 0.02 a |
27.00 ± 1.08 a |
|
Weeds |
6.10 ± 1.30 a |
0.20 ± 0.03 a |
29.25 ± 1.65 a |
|
F value |
1.13 |
2.14 |
0.42 |
|
df |
4 |
4 |
4 |
|
P value |
0.3779 |
0.1259 |
0.7905 |
ᶻ Treatments means within columns followed by different letters were significantly different (P < 0.05). With treatments; 1) Triticale Drill, 2) Triticale Broadcast, 3) Crimson Clover Drill, 4) Crimson Clover Broadcast, 5) Weeds as control.
A summer cover crop trial was established in spring 2019. While the cover crop did germinate, all plants died due to extended drought and did not recover. Winter cover crops senesced over the early summer and provided some mulch/weed suppression. While we may investigate summer cover crops in the future, the high likelihood of drought at this time of year suggests that such crops would not be ideal for nursery fields lacking irrigation. An additional summer cover crop trial was initiated in 2020 which also failed to establish. Based on two consecutive years of crop failure, we would not recommend nursery growers rely on summer cover cropping and instead suggest focusing on winter cover crops which may provide summer weed suppression as winter biomass senesces.
Table 7. Mean arthropod diversity index, equitability, and family richness at the Flower City plots from the pitfall traps collected from May 2019 to July 2019.
|
Treatment |
Diversity index |
Equitability |
Family richness |
|
Crimson Clover Broadcast |
5.93 ± 0.65 aᶻ |
0.29 ± 0.07 a |
24.25 ± 5.48 a |
|
Crimson Clover Drill |
6.26 ± 1.17 a |
0.25 ± 0.05 a |
25.00 ± 0.71 a |
|
Triticale Broadcast |
6.89 ± 1.25 a |
0.30 ± 0.04 a |
22.75 ± 1.38 a |
|
Triticale Drill |
3.67 ± 0.70 a |
0.17 ± 0.05 a |
23.50 ± 1.71 a |
|
Weeds |
4.87 ± 0.55 a |
0.26 ± 0.02 a |
22.75 ± 1.84 a |
|
F value |
1.96 |
1.23 |
0.12 |
|
df |
4 |
4 |
4 |
|
P value |
0.1534 |
0.3389 |
0.9719 |
ᶻ Treatments means within columns followed by different letters were significantly different (P < 0.05). With treatments; 1) Triticale Drill, 2) Triticale Broadcast, 3) Crimson Clover Drill, 4) Crimson Clover Broadcast, 5) Weeds as control.
Table 8. Mean arthropod diversity index, equitability, and family richness at the Flower City plots from the sticky traps collected from May 2019 to July 2019.
|
Treatment |
Diversity index |
Equitability |
Family richness |
|
Crimson Clover Broadcast |
9.08 ± 1.86 aᶻ |
0.49 ± 0.09 a |
18.75 ± 1.60 a |
|
Crimson Clover Drill |
8.04 ± 1.52 a |
0.59 ± 0.11 a |
15.00 ± 3.72 a |
|
Triticale Broadcast |
8.78 ± 0.99 a |
0.41 ± 0.05 a |
21.25 ± 0.75 a |
|
Triticale Drill |
7.60 ± 0.93 a |
0.58 ± 0.03 a |
13.00 ± 1.35 a |
|
Weeds |
8.12 ± 2.02 a |
0.52 ± 0.09 a |
15.50 ± 2.63 a |
|
F value |
0.15 |
0.83 |
2.09 |
|
df |
4 |
4 |
4 |
|
P value |
0.959 |
0.5283 |
0.1333 |
ᶻ Treatments means within columns followed by different letters were significantly different (P < 0.05). With treatments; 1) Triticale Drill, 2) Triticale Broadcast, 3) Crimson Clover Drill, 4) Crimson Clover Broadcast, 5) Weeds as control.
Soil Microbial Biomass Content
Microbial biomass assays were conducted to determine whether small changes in soil C and N could be detected over a single growing season. There was no difference in microbial carbon at Pleasant Cove between Triticale Drilled treatment (1.4 ± 0.04 MBC), Weeds (0.97 ± 0.25 MBC) and Crimson Clover Drill (1.1 ± 0.09 MBC) (Table 9). A similar trend was detected when comparing the average microbial nitrogen content with no difference for Triticale Drill, Crimson Clover Drill, or Weeds at 0.04 ± 0.01 MBN, 0.03 ± 0.01 MBN, 0.04 ± 0.01 MBN, respectively.
The results obtained at the second location; Flower City indicated that no statistical difference was detected for any of the treatments evaluated either for the microbial biomass carbon or nitrogen content (Table 10).
Table 9. Microbial biomass carbon and nitrogen content at Pleasant Cove in 2019.
|
Treatments |
Microbial Biomass Carbon |
Microbial Biomass Nitrogen |
|
Triticale Drill |
1.39 ± 0.04 aᶻ |
0.04 ± 0.01 a |
|
Crimson Clover Drill |
1.08 ± 0.09 a |
0.03 ± 0.01 a |
|
Weeds |
0.97 ± 0.25 a |
0.04 ± 0.01 a |
|
F value |
1.99 |
0.55 |
|
df |
2 |
2 |
|
P value |
0.1926 |
0.5934 |
ᶻ Treatments means within columns with different letters are statistically different by General Linear Model with means separated by General Linear Model (GLM) with means separated by LSmeans adjusted Tukey analysis (P˂ 0.05). With treatments; 1) Triticale Drill, 2) Crimson Clover Drill, and Weeds as control.
Table 10. Microbial biomass carbon and nitrogen content at Pleasant Cove in 2019.
|
Treatments |
Microbial Biomass Carbon |
Microbial Biomass Nitrogen |
|
Triticale Drill |
0.72 ± 0.05 aᶻ |
0.02 ± 0.01 a |
|
Crimson Clover Drill |
0.75 ± 0.12 a |
0.04 ± 0.01 a |
|
Weeds |
0.66 ± 0.04 a |
0.03 ± 0.01 a |
|
F value |
0.32 |
2.14 |
|
df |
2 |
2 |
|
P value |
0.7319 |
0.1741 |
ᶻ Treatments means within columns with different letters are statistically different by General Linear Model with means separated by General Linear Model (GLM) with means separated by LSmeans adjusted Tukey analysis (P˂ 0.05). With treatments; 1) Triticale Drill, 2) Crimson Clover Drill, and Weeds as control.
Soilborne Pathogen Suppression
Soils from established field plots with and without winter cover crops (crimson clover (Trifolium incarnatum L.) or triticale (× Triticosecale W.)) were sampled following the senescence of the cover crops. Separate bioassays were performed using red maple cuttings on inoculated (with Phytopythium vexans, Phytophthora nicotianae or Rhizoctonia solani) and noninoculated field soils. The results indicated that winter cover crop usage was helpful for inducing soil disease suppressiveness. There was lower disease severity (Fig. 1) and pathogen recovery when the cover crops were used compare to the non‐cover cropped soil. However, there were no differences in maple plant fresh weight and root weight between the treatments. The rhizosphere pseudomonad microbial population was also greater when the cover crops were used. Similarly, the C:N ratio of the soil was improved with the cover crop usage. Thus, in addition to improving soil structure and reducing erosion, cover crops can provide improved management of soilborne diseases.
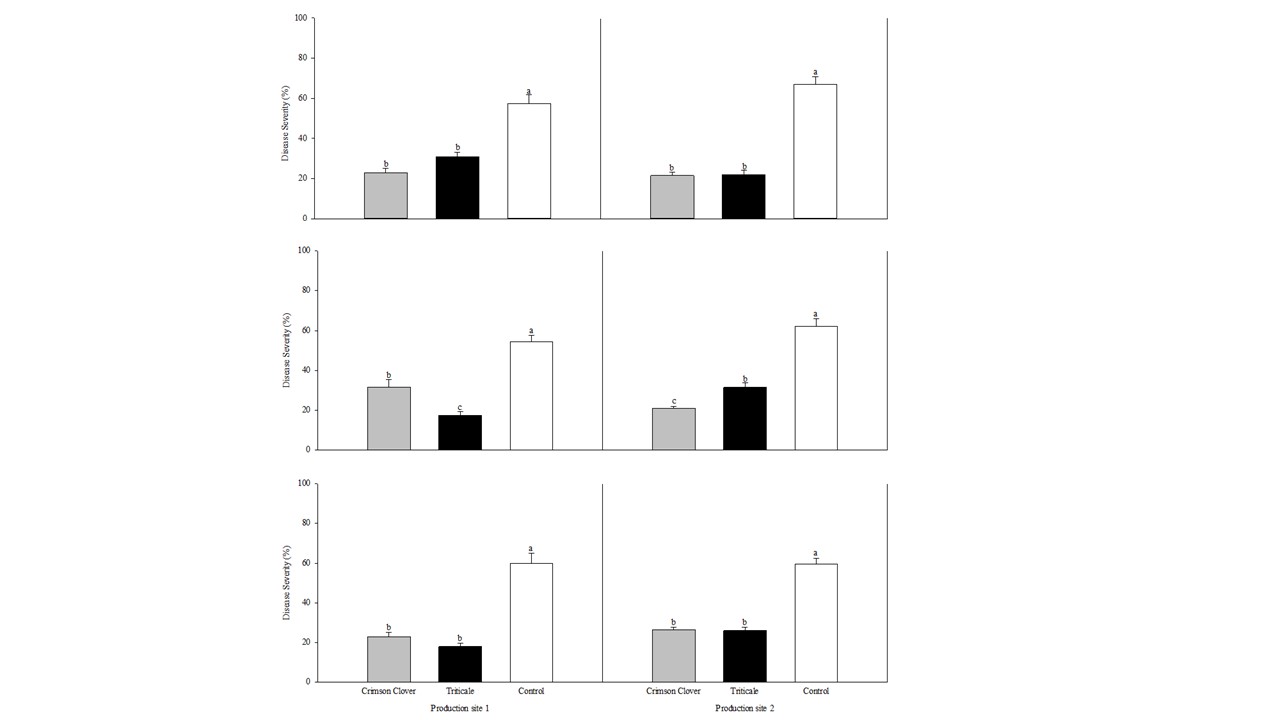
Figure 1. Disease severity of rooted maple cuttings grown in triticale crimson clover and weedy control soils inoculated with Phytopythium vexans (top), Phytophthora nicotianae (middle) or Rhizoctonia solani (bottom panel).
Objective 2 Discussion
There are important aspects to consider when planning to incorporate cover crops. In agriculture, the decision is determined by the seed size, seeding rate, date of emergence and planting method. Establishment of cover crop by selecting the right planting method is crucial to assure good germination. In this study, a comparison on the planting method for two cover crops was made including Drill or Broadcast. The results from this study suggest that the establishment of crimson clover as cover crop can be successfully achieved either by using the Drill or the Broadcast method. However, after analyzing the data collected on both sites the Broadcast Crimson Clover showed better results, even though there was no statistical difference detected. The broadcasted evaluated area had higher numbers of plants. But, broadcasting cover crops on the soil surface can minimize seed contact with the soil and can leave the seed expose to desiccation under dry conditions; thus, potentially reducing the cover crop establishment rate. Triticale established better with the Drill treatment method with significant differences at one site (Pleasant Cove), but not the other (Flower City). The Flower City site did have a higher mean triticale plant establishment. It is recommended that winter triticale should be no more than 2.45 cm deep, since deep planting increases the time to emergence and some winter triticale varieties take longer to develop their maximum cold tolerance . Dry matter from both nursery locations indicated that Drill treatment achieved a good amount of biomass for both cover crops species. While the Broadcast method can be less expensive than the use of Drill, it is considered a riskier method for crop establishment, which can also result in inconsistent cover crop yields.
The usage of cover crops can reduce the soil temperature and increase the soil moisture. Soil moisture and soil temperature from both locations were not statistically different, regardless of the planting method or cover crop species. For this experiment, cover crops were terminated in July 2019, but rolling the cover crop and using it as a mulch can reduce soil temperature and soil water evaporation, which can be beneficial for moisture conservation .
An important finding was that Ichnneuminidae and the Ceraphronidae parasitoid families were found only in the Drill Crimson Clover treatment and not in the Weeds or Triticale. Unfortunately, there was not enough specimens to infer that crimson clover will provide a suitable host for parasitoids, but these insects benefit from the nectar provided by flowering plants.
The impact in soil microbial biomass content is determined by the species utilized as a cover crop. In the past, legumes were well known in agriculture for their capability of N fixation and also helping to enrich surface soil organic C. The effect of legumes in altering N levels is more negligible when the legumes decompose and incorporate to soil. The results obtained from our experiment showed no detectable difference in the microbial content between Drill Crimson Clover and Triticale, with similar results for Weeds. Pathogen inoculated soil studies confirmed that both triticale and crimson clover soils suppressed soilborne pathogens which may infect red maple cuttings and that associated beneficial microbial populations were higher in the cover crop soils.
Overall we recommend the use of winter cover crops in established nurseries. Growers interested in using crimson clover can achieve good establishment with broadcast or drill methods. Triticale and other grains may require the use of a narrow row drill to achieve sufficient stand quality, unless they are willing to seed at a higher rate.
Objective 3
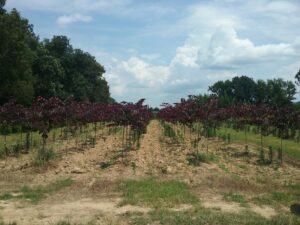
(a) Cover crop was established in October and red maple trees ('Sun Valley') were transplanted in December. Initial height and diameter of trees as well as soil moisture and temperature readings have been recorded. Germination of cover crop was evaluated in March and will be repeated in April. Treatments will be applied in early to mid April.
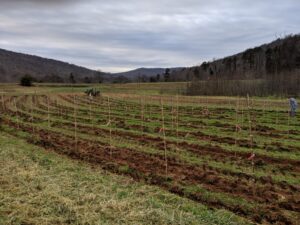
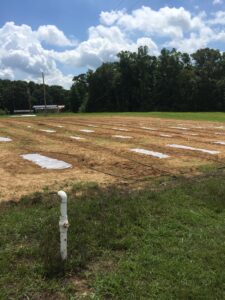
Field plot establishment. Moore Farm, Irving College, TN.
Tree growth was measured in fall 2019 and flatheaded borer damage assessed. Growth results suggest that killing cover crops in early May did not reduce competition between the cover crops and trees as these trees grew shorter and were similar in size to trees where the cover crop was allowed to naturally senesce (Figure 1). Interestingly, while the mulch mat product was able to prevent cover crop from growing up around the base of the tree, tree growth was similar to trees with cover crops. Trees with early killed cover crop had more borer attacks than trees in the live cover crop treatment (Figure 2). The early kill treatment had slightly more attacks than trees in the herbicide treatment, suggesting the early kill treatment itself may be attractive to borers in some way. Also, trees protected from weeds using mulch mats had similar amounts of damage cover crop trees, suggesting that something else about the herbicide treatment other than lack of foliage at the base of trees may draw beetles to that treatment. Since attack counts were more evenly distributed across the treatments in this study, statistical power was low, but herbicide was a clear factor in borer presence (herbicide: 27 vs no herbicide: 12).
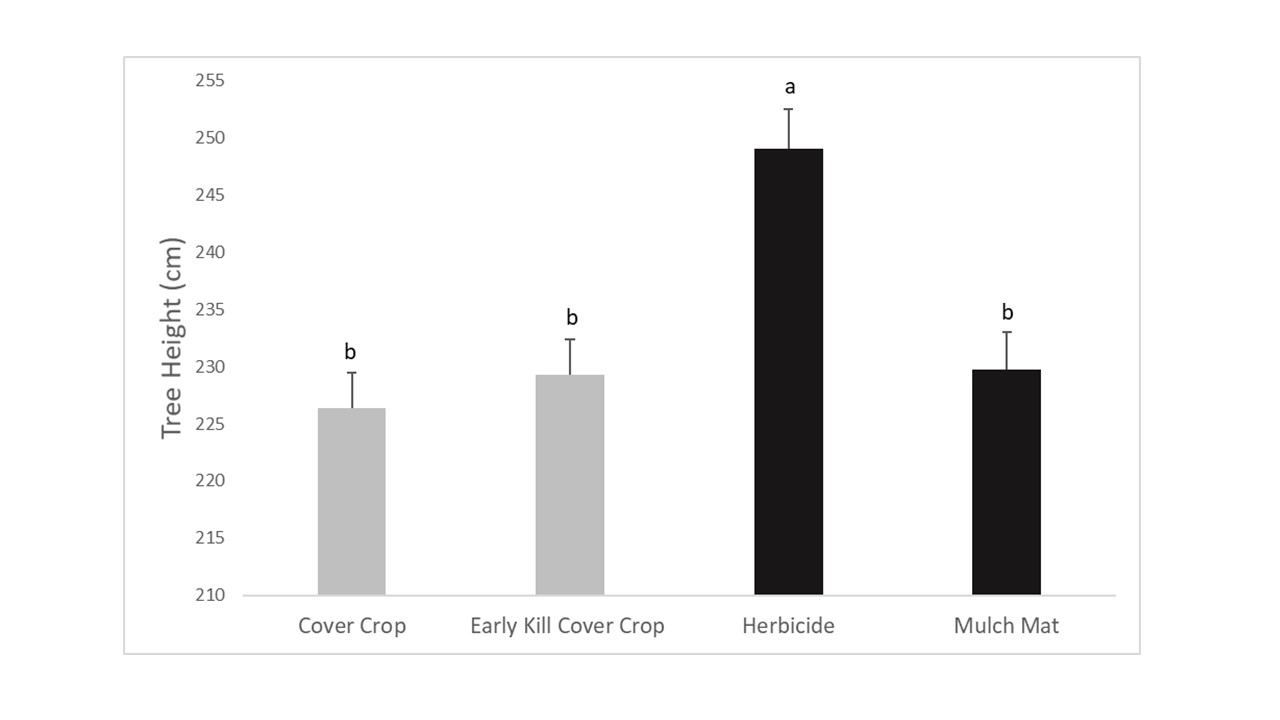
Figure 1. Final tree height after 1-yr. Values with different letters are statistically different by General Linear Model (GLM) with means separated by LSmeans adjusted Tukey analysis (P ˂ 0.05) (F = 10.12, df = 3, P = 0.0001). Treatments: 1) Cover Crop, 2) Early Kill Cover Crop, 3) Herbicide and 4) Mulch Mat. Cover crop used were crimson clover and triticale.
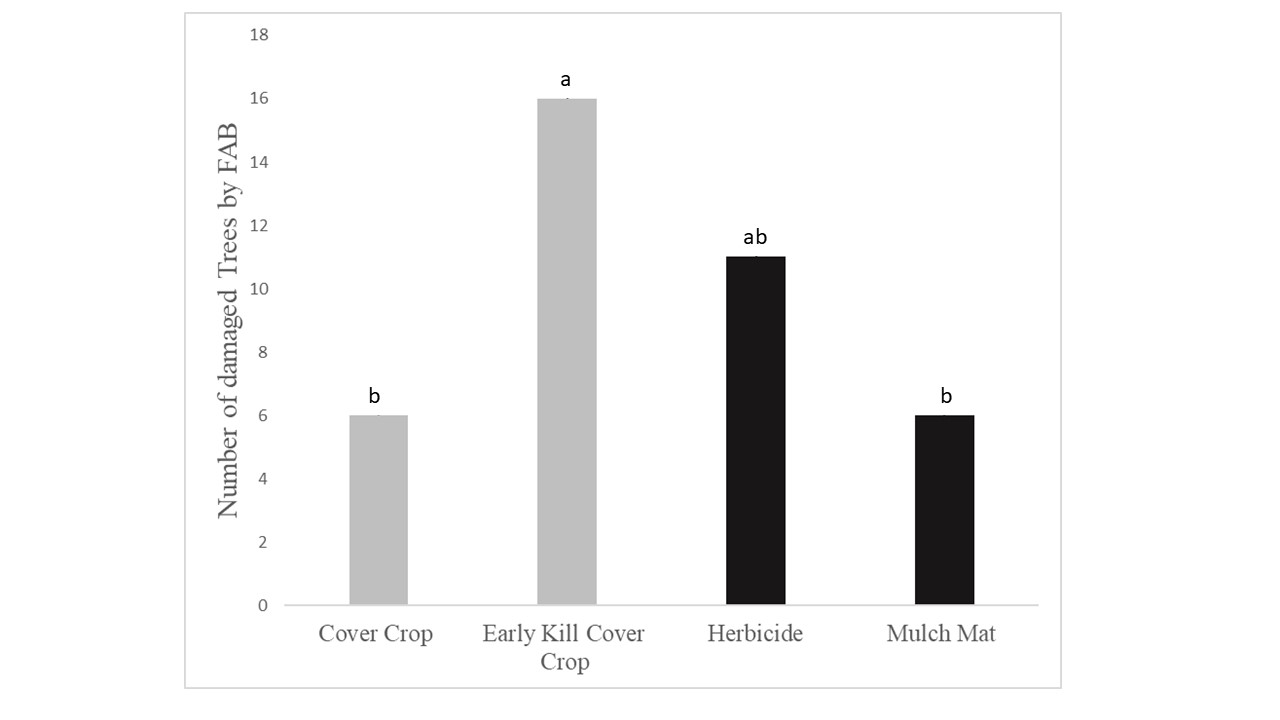
Figure 2. Total number of trees damaged by flatheaded appletree borer in treatments after 2-yr. Tree damage was analyzed by using a General Linear Model fitted to a binomial (Proc Genmod) (Chi-Square = 7.96, df = 3, P = 0.0468). Treatments: 1) Cover Crop, 2) Early Kill Cover Crop, 3) Herbicide and 4) Mulch Mat. Cover crop used were crimson clover and triticale.
(b) Height, diameter and canopy size was recorded for trees in Fall 2018. Tree rows were maintained bare with pre-emergent herbicides. The final year of growth/borer attacks (year 4) was assessed for this previous study plot. We found that by the final year of production, trees in the cover crop plots remained smaller than herbicided trees (Figure 3), however, the trees had grown more in the previous year than the herbicided trees, suggesting they would recover lost growth in time. The reduction in tree growth was most acute in the first year of establishment, after which trees in cover crop plots grew at similar rates to those with bare rows. Treatments continued to accumulate a few borer attacks each year even after the establishment phase (Figure 4).
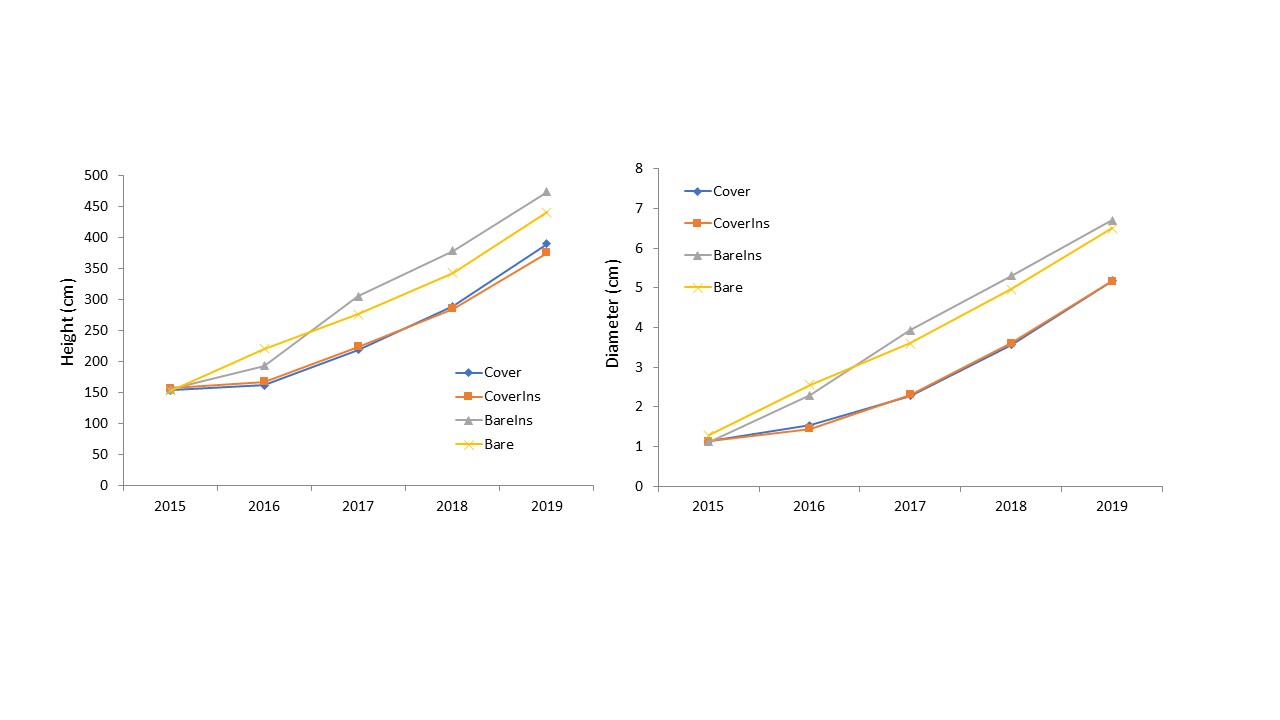
Figure 3. Tree height and caliper growth over time after 4-yr production. Treatments: 1) Herbicide + Insecticide (BareIns), 2) Herbicide (Bare), 3) Cover Crop + Insecticide (CoverIns) and 4) Cover Crop + non-insecticide (Cover). Cover crops used were winter wheat, crimson clover, and annual rye grass.
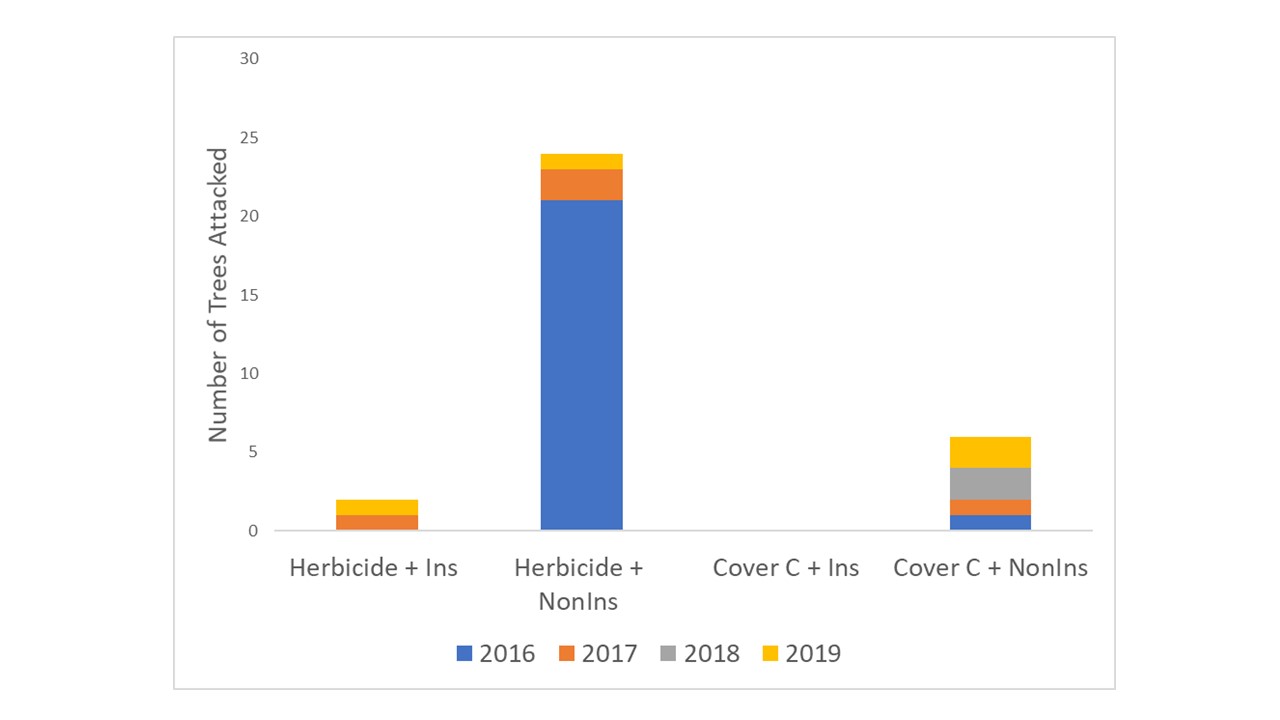
Figure 4. Total number of trees damaged by flatheaded borers in treatments after 4 yr. Tree damage was analyzed by using a General Linear Model fitted to a negative binomial distribution (Proc Genmod) (Chi-Square = 34.40, df = 3, P = 0.0001). Treatments: 1) Herbicide + Insecticide, 2) Herbicide + Non-Insecticide, 3) Cover Crop + Insecticide and 4) Cover Crop + non-insecticide. Cover crops used were winter wheat, crimson clover, and annual rye grass.
Objective 3 Discussion
Our attempts to balance tree growth with cover crop protection from borers showed that early-kill of cover crop at the end of spring did not provide the same protection from borers as the living cover crop. In fact, the application of herbicide at this time may have increased borer attraction to the early kill trees. Borers may be attracted to trees emitting some stress compounds, and while care was taken to shield tree trunks from direct contact with herbicides, chemical drift could have resulted in exposure. Additionally, borers may have been attracted to general plant odors from stressed or dying foliage, which then drew them to the vicinity of trees in this treatment. Not only did the early kill treatment fail to protect trees from borers, but it also provided no benefit to tree growth. From these studies we conclude that cover crops should be allowed to senesce naturally in fields. We will be conducting future work looking at irrigation in the first year following transplant in order to mitigate growth loss during this period. Additionally, we found that testing of the cover crop system works better in blocked trials with a group of trees grown with or without cover crops rather than individual treatments replicated across a field. Future tests will evaluate the cover crop method on a larger scale.
Objective 4
In summer, Phytophthora experimental plots were inoculated with P. nicotianae infested rice grains. Four rice grains were placed 5 cm below the surface soil every 30 cm. Rhizoctonia experimental plots were drench-inoculated with slurry of R. solani (7-day old cultures on PDA were homogenized) at a rate of 100 ml/ 0.1 m2. Non-treated, non-inoculated and inoculated plots served as controls. Selected cover crop seeds (Table 1) were seeded into the plots with 1.76 oz of coarse sand for even distribution. At the flowering stage cover crops plant were chopped and incorporated properly into 15 cm deep using ploughs.
Table 1. Selected cover crops seed and organic input rates for the TSUNRC field experiment.
|
Treatment |
Scientific Name |
Company |
Rate |
|
Amara mustard |
Brassica carinata |
Johnny’s Selected seeds |
2.3 x 10⁶seeds/A |
|
Astro arugula |
Eruca vesicaria spp. sativa |
Johnny’s Selected seeds |
8.3 x 10⁵seeds/A |
|
Mighty mustard® pacific gold |
B. juncea |
Johnny’s Selected seeds |
5.6 x 10⁵seeds/A |
|
Oilseed radish |
Raphanus sativus |
Johnny’s Selected seeds |
9.8 x 10⁵seeds/A |
|
Purple top forage turnips |
B. rapa |
Johnny’s Selected seeds |
1.8 x 10⁶seeds/A |
|
Compost cow manure |
|
Farm Fuel Inc. Freedom, GA |
50 tons/A |
|
Mustard meal |
|
Farmers Organic. Newton, GA |
968 lb/A |
Then the dedicated plots were covered for two and four weeks with 3.0-mil transparent polythene (clear poly polyethylene sheeting, Wrap Bros, Chicago, IL) with no opening at the edges. After two and four weeks polythene covers were removed from specific field plots and mixed it properly. Solarization alone- plots were covered with polythene on 3 July for six weeks and irrigated properly to increase moisture for trapping more temperature (Fig. 1). Non-treated plots served as control. Average temperature of solarized beds, cover crop incorporated solarized beds and non-treated beds were 31.03℃, 29.48℃ and 27.06℃, respectively.
Phytophthora root rot disease severity in boxwood was high experiment with non-treated, inoculated control plants showing 58.94% disease severity. All the tested cover crops- amara mustard, astro arugula mighty mustard, radish and turnips in combination with solarization (2-weeks or 4-weeks), solarization alone (6-weeks) and organic inputs (compost and mustard meal) significantly reduced root rot severity on boxwood roots compared to the non-treated control plants (Table 2). There were no significant differences among tested cover crops in combination with solarization (2-weeks or 4-weeks) compared to the other treatments in reducing Phytophthora root rot disease. There were no significant differences among treatments in plant fresh weight, plant height, and plant width (Table 2).
Table 2. Effect of solarization and organic inputs for the control of Phytophthora root rot disease of boxwood in field conditions
|
Treatment |
Phytophthora root rot severity (%)x |
Plant fresh weight (g) |
Plant height (cm) |
Plant width (cm) |
|
Amara mustard + Solarization (2 weeks) |
40.25 by |
22.00 a |
22.63 a |
10.63 a |
|
Amara mustard + Solarization (4 weeks) |
28.75 bc |
26.00 a |
23.44 a |
9.88 a |
|
Astro arugula + Solarization (2 weeks) |
32.88 b |
31.06 a |
21.19 a |
9.81 a |
|
Astro arugula + Solarization (4 weeks) |
27.50 bc |
28.44 a |
22.31 a |
10.63 a |
|
Mighty mustard® pacific gold + Solarization (2 weeks) |
37.75 b |
22.56 a |
22.63 a |
9.69 a |
|
Mighty mustard® pacific gold + Solarization (4 weeks) |
34.63 b |
25.00 a |
23.44 a |
9.94 a |
|
Radish + Solarization (2 weeks) |
29.88 b |
29.31 a |
22.81 a |
10.88 a |
|
Radish + Solarization (4 weeks) |
29.75 b |
30.50 a |
22.69 a |
11.59 a |
|
Turnips + Solarization (2 weeks) |
36.13 b |
25.19 a |
22.00 a |
9.84 a |
|
Turnips + Solarization (4 weeks) |
32.63 b |
21.19 a |
22.69 a |
9.81 a |
|
Solarization alone (6 weeks) |
28.69 bc |
26.53 a |
22.05 a |
10.00 a |
|
Compost |
36.06 b |
25.22 a |
20.94 a |
10.00 a |
|
Mustard meal |
31.63 b |
34.44 a |
24.81 a |
11.38 a |
|
Non-treated, inoculated control |
58.75 a |
28.22 a |
21.81 a |
10.28 a |
|
Non-treated, non- inoculated control |
13.63 c |
28.72 a |
24.09 a |
9.98 a |
|
P-value |
<.0001 |
0.1039 |
0.1878 |
0.2042 |
xDisease severity was based on percentage of roots affected. yValues are the means of four replicates; treatments followed by the same letter within a column are not significantly different at P<0.05.
Rhizoctonia root rot disease severity in viburnum was high with non-treated, inoculated control plants showing 68.94% disease severity. All the tested cover crops except astro arugula and radish in combination with solarization (2-weeks or 4-weeks), solarization alone (6-weeks) and compost organic input significantly reduced Rhizoctonia root rot severity on viburnum roots compared to the non-treated, inoculated control plants (Table 3). There were no significant differences among all the tested cover crops in combination with solarization (2-weeks or 4-weeks) and other treatments except astro arugula in combination with 2 weeks solarization in disease severity. There were no significant differences in plant fresh weight, root weight, plant height and plant width among treatments (Table 3).
Table 3. Effect of solarization and organic inputs for the control of Rhizoctonia root rot disease of viburnum plants in field conditions
|
Treatment |
Phytophthora root rot severity (%)x |
Plant fresh weight (g) |
Root weight (g) |
Plant height (cm) |
Plant width (cm) |
|
Amara mustard + Solarization (2 weeks) |
40.38 bcy |
28.06 a |
15.19 a |
36.63 a |
10.81 a |
|
Amara mustard + Solarization (4 weeks) |
46.88 bc |
17.38 a |
9.13 a |
27.50 a |
13.50 a |
|
Astro arugula + Solarization (2 weeks) |
59.75 ab |
14.19 a |
7.13 a |
28.88 a |
11.81 a |
|
Astro arugula + Solarization (4 weeks) |
52.50 abc |
14.88 a |
7.00 a |
30.25 a |
10.69 a |
|
Mighty mustard + Solarization (2 weeks) |
35.75 c |
24.56 a |
11.56 a |
39.25 a |
10.38 a |
|
Mighty mustard + Solarization (4 weeks) |
43.50 bc |
14.00 a |
6.00 a |
31.50 a |
11.13 a |
|
Radish + Solarization (2 weeks) |
56.00 abc |
15.25 a |
7.44 a |
29.00 a |
9.19 a |
|
Radish + Solarization (4 weeks) |
46.38 bc |
24.31 a |
12.94 a |
27.25 a |
14.75 a |
|
Turnips + Solarization (2 weeks) |
46.50 bc |
21.88 a |
13.06 a |
28.75 a |
11.50 a |
|
Turnips + Solarization (4 weeks) |
46.50 bc |
22.56 a |
11.31 a |
34.13 a |
12.94 a |
|
Solarization alone (6 weeks) |
42.75 bc |
25.97 a |
14.22 a |
35.75 a |
10.84 a |
|
Compost |
44.13 bc |
17.88 a |
7.94 a |
30.25 a |
10.56 a |
|
Mustard meal |
53.63 abc |
23.69 a |
13.31 a |
30.38 a |
9.94 a |
|
Non-treated, inoculated control |
68.94 a |
18.09 a |
10.34 a |
34.06 a |
12.16 a |
|
Non-treated, non- inoculated control |
14.56 d |
20.94 a |
11.38 a |
33.56 a |
12.69 a |
|
P-value |
<0.0001 |
0.1407 |
0.1287 |
0.2341 |
0.7237 |
yDisease severity was based on percentage of roots affected. xValues are the means of four replicates; treatments followed by the same letter within a column are not significantly different at P<0.05.
Root pieces taken from boxwood and viburnum plants were placed on Rhizoctonia and Phytophthora (PARPH-V8) selective media. According to the analysis, highest Phytophthora root rot plant pathogen recovery was observed in compost treated plants and non-treated, inoculated control plants (more than 30%); and there were no differences among treatments in Rhizoctonia root rot pathogen recovery (Table 4).
Table 4. Pathogen recovery percentages from the roots at the end of the field experiment
|
Treatment |
Pathogen recovery from roots (%)x |
|
|
P. nicotianae |
R. solani |
|
|
Amara mustard + Solarization (2 weeks) |
21.25 bcdy |
65.00 a |
|
Amara mustard + Solarization (4 weeks) |
20.00 bcd |
76.25 a |
|
Astro arugula + Solarization (2 weeks) |
13.75 bcd |
77.50 a |
|
Astro arugula + Solarization (4 weeks) |
10.00 bcd |
75.00 a |
|
Mighty mustard® pacific gold + Solarization (2 weeks) |
27.50 abcd |
73.75 a |
|
Mighty mustard® pacific gold + Solarization (4 weeks) |
13.75 bcd |
62.50 a |
|
Radish + Solarization (2 weeks) |
16.25 bcd |
63.75 a |
|
Radish + Solarization (4 weeks) |
20.00 bcd |
67.50 a |
|
Turnips + Solarization (2 weeks) |
13.75 bcd |
67.50 a |
|
Turnips + Solarization (4 weeks) |
18.75 bcd |
60.00 a |
|
Solarization alone (6 weeks) |
8.75 cd |
58.75 a |
|
Compost |
33.75 ab |
85.00 a |
|
Mustard meal |
28.75 abc |
85.00 a |
|
Non-treated, inoculated control |
47.50 a |
95.00 a |
|
Non-treated, non- inoculated control |
3.75 d |
6.25 b |
|
P-value |
<.0001 |
<.0001 |
xPathogen recovery was based on percentage of roots cultured. yValues are the means of three replicates; treatments followed by the same letter within a column are not significantly different at P<0.05.
In this study we have evaluated five selected cover crops (Amara mustard, astro arugula, turnips, mighty mustard ® pacific gold, and radish) in combination with solarization (Liyanapathiranage 2017), solarization alone and two organic amendments (compost and mustard meal) against soilborne diseases such as Phytophthora and Rhizoctonia root rot diseases. The results of these studies showed that solarization with or without cover crops can significantly reduce root rot diseases.
An integrated management approach should be used to control soilborne pathogens (Rhizoctonia and Phytophthora). Results of both on-farm and field experiments indicate that cover crops (Amara mustard, astro arugula, turnips, mighty mustard ® pacific gold, and radish) can be used in combination with solarization to control soilborne pathogens in nursery productions. Nursery producers could benefit from using solarization alone or in a combination with cover crop to control soilborne diseases.
Each Phytophthora experimental plot consisted of 4 boxwood rooted cuttings spaced 60 cm apart with 2 m between rows. Each Rhizoctonia experimental plot consisted of 5 viburnum rooted cuttings spaced 60 cm apart with 2 m between rows. Boxwood rooted cuttings and viburnum rooted cuttings were planted. Plants were fertilized with 10 g of 18-6-8 Nutricote controlled-release fertilizer. Plants were watered as needed using drip irrigation system. The herbicide (Finale 31.3 ml/L) was applied as spot treatment into the test field.
Objective 4 Discussion
Soil solarization and biofumigant mulches can reduce pathogen inoculum in soils, however, results can vary with soil type, location and target pathogen. To achieve success utilizing these methods for soilborne disease management it is important that the proper crop be used, soil temperatures be raised for a sufficient amount of time to kill the pathogen. In addition to using the appropriate biofumigant crop, the crop stand must be sufficiently healthy and vigorous to provide the added chemical benefit to the solarization process.
Although amara mustard green and astro arugula are not currently used as commercial biofumigation cover crops, according to our study they show promising results in controlling soilborne pathogens of woody ornamental plants. Further experiments will be conducted to test the ability of these Brassica cover crops to control other major pathogens in woody ornamental nursery production and assess there safety for different woody plants. This research is ongoing.
Educational & Outreach Activities
Participation summary:
Consultations. On farm consultations of soil solarization and biofumigation were conducted on 4 occasions in the summer of 2018 and 6 occasions in 2019.
Fact Sheets. Three fact sheets were developed on beneficial insects found naturally in cover crops or aided by natural habitats.
Journal Articles. Four journal articles related to cover crops were published in 2019.
Talks. Seven presentations at scientific conferences were given (3-Gonzalez, 2 - Panth, 2 - Neupane).
Eight extension talks were given by faculty to growers, landscapers and other stakeholders (1- Addesso, 3- Baysal-Gurel, 4 - Witcher).
Addesso, K. 2020. Flatheaded borer identification. Lawn and Landscape 101. Rutherford County Extension. February 13, 2020. Murfreesboro, TN.
Baysal-Gurel, F. 2019. Phytophthora Disease Management. TSU Nursery Field Day. July 25, 2019. McMinnville, TN.
Baysal-Gurel, F. 2019. Ornamental Disease Management Research Updates. Advanced Pest &Disease Workshop, WinterGreen Trade show & Conference. January 24, 2019. Duluth, GA.
Baysal-Gurel, F. 2018. Biofumigation: opportunities and challenges for control of soilborne diseases in nursery production. University of Georgia, Athens, GA. Aug 27, 2018.
Witcher, A. Cover Crops in the Nursery; Franklin County Extension Program, Morgan Franklin. 8/22/2019.
Witcher, A. Cover Crops in the Nursery; Grundy County Extension Program, Creig Kimbro. 8/29/2019.
Witcher, A. Synthetic vs Organic. Middle TN Landscape Management Short Course. Murfreesboro, TN. 1/14/2020.
Witcher, A. Weed Management Practices and IPM. South Carolina Green Conference and Trade Show, Columbia, SC. 1/21/2020
Tours. One tour of the facility during the Southern International Plant Propagators Society was conducted on Oct 21st 2018. The tour group consisted of over two hundred participants including growers, extension agents, researchers and other stakeholders. One tour of the nursery research center was held on July 25th, 2019. Fifty growers toured the labs and cover crop field plots.
Learning Outcomes
Project Outcomes
There are a few takeaways from this project regarding the usefulness of cover cropping in nursery production. The first is that we can recommend both grain and legume winter cover crops with confidence that they will benefit soil, suppress weeds, and reduce soilborne pathogen loads. Grain, legume and biofumigant cover crops all aided in suppressing soilborne pathogens which target woody plants. We showed that transplanting trees into a newly established cover crop fields in either fall or spring will not have a large impact on cover crop stand recovery. There were not major impacts in arthropod community diversity in these studies, but since the plots were so small and adjacent to one another the interpretation of this result is preliminary. We did note that some parasitoid families were more prevalent in crimson clover plots associated with flowers. This supports years of study relating increased natural enemy populations in nectar producing cover crop stands. Growers who wish to utilize cover crops in established fields may find it easier to use crimson clover or other crops that establish well with a broadcast spreader if they do not wish to invest in a narrow row drill. Triticale, and other grains require a greater soil depth to germinate well. Broadcast applications of triticale, while not significantly lower in overall biomass did allow for more weed penetration. For a more uniform stand of triticale, seeds should be drilled or the broadcast rate will need to be increased. The studies conducted on winter cover crops for protection against flatheaded borers supports prior work. Unfortunately, we did not solve the problem of tree-cover crop competition in year 1 production by killing the cover crop early. What this treatment did reveal is that herbicide applications in May could be a factor in attracting borers to nursery fields. This topic of herbicide timing and borer incidence will be investigated in future studies. We will also be investigating irrigation of newly transplanted trees to minimize competition with cover crops in the coming year. At this time, we will continue to recommend allowing the winter cover crop to senesce naturally and provide an organic mulch over the summer as a best practice for protecting trees from flatheaded borers as an alternative to insecticides.
We are continuing to publish research from this project. There is currently 1 manuscript in review and 3 in preparation from the student theses. We can add these publications after they are finalized.
Information Products
- Methods for Management of Soilborne Diseases in Crop Production.
- Management of flatheaded appletree borer in nursery production with cover crops
- Pathogenicity of Rhizoctonia solani and Phytophthora nicotianae to Brassicaceae cover crops.
- Effect of Brassica crop-based biofumigation on soilborne disease suppression in woody ornamentals
- Flatheaded Borer Management in Nurseries with Winter Cover Crops
- COVER CROPS IN FIELD-GROWN NURSERIES: IMPACTS ON TREE GROWTH, PEST, AND BENEFICIAL ARTHROPODS
- Response of Cover Crops to Phytopythium vexans, Phytophthora nicotianae, and Rhizoctonia solani, Major Soilborne Pathogens of Woody Ornamentals
- Using Cover Crops in Nursery Production
- Comparative performance of drill and broadcast winter cover crops in nursery production and their impact on arthropod communities
- Managing flatheaded borers in nursery production without insecticides
- Development of a cover crop system for management of flatheaded borers in red maple production
- Flatheaded borer ecology and management in ornamental trees.
- Impact of cover crop usage on soilborne disease suppressiveness in field nursery production.
- Management of Flatheaded Appletree Borers Using Cover Crops in Woody Ornamental Production Systems.
- COVER CROPS UTILIZED AS PART OF FLATHEADED BORER MANAGEMENT
- Cover Crops in the Nursery
- Managing Glyphosate Resistant Weeds in Horticulture Crop Production
- Impact of winter cover crop usage in soilborne disease suppressiveness in woody ornamental production system