Final report for LS20-342
Project Information
Hedgerows have been used in different fruit tree production systems to protect groves against adverse climatic conditions such has strong winds and freezing events. However, attention has shifted to the potential of hedgerows in providing shelter and additional food resources to beneficial insects, in particular natural enemies and pollinators.
Citrus and peaches are the two main fruit crop productions of Florida and Georgia. In citrus, hedgerows have been used to prevent the arrival of citrus canker spores, and to prevent wind damage on fruits and trees. We propose to improve the existing hedgerow system already present in Georgia and Florida along citrus and peaches orchards to enhance beneficial insect populations. Existing hedgerows present in cooperative farmer orchards will be enhanced by mid-size bushes, flowering vines and wildflower strips. Response of these treatments on the density and diversity of natural enemies (especially ladybeetles) and pollinators will be investigated over the course of two years. In addition, the potential reduction of fruit pests such as Asian citrus psyllids, aphids, and scales within orchards bordering these hedgerows will be measured.
The other objective will be to investigate the effect of hedgerow connectivity and architecture on beneficial insects. Previous studies demonstrated that a network of hedgerows increases pollinator density and facilitates the movement of natural enemies. We will conduct a landscape-scale survey from Florida to Georgia where ladybeetles will be collected within and adjacent to hedgerows, and their density correlated to landscape features including hedgerow size and height, connectivity with other hedgerows, or connectivity with forest patches. With GIS technology, we will correlate natural enemy’s density to hedgerow landscape architecture.
An outreach program will be developed with cooperative farmers. Field days will be organized to visit the orchards with improved hedgerows. Pre and post surveys will be conducted to better understand farmers’ willingness to erect or conserve hedgerows and any barriers to these actions.
The outputs of this project will be the improvement of hedgerows as a refuge and food source for beneficial insects and subsequent enhanced pest suppression. Additionally, an output will be farmer education related to hedgerow design and conservation.
The impacts of this project will be an increasing use of hedgerows in fruit tree production in Florida and Georgia, increased biological control in fruit orchards, the reduction of insecticide applications, and increased pollination. In addition, as an increasing number of farmers are adopting hedgerows, water and soil conservation within the region will be improved.
1- To increase diversity and complexity of existing hedgerow systems and measure their impact on pollinator and natural enemy density and diversity
Hypothesis: Addition of flowering plants to existing hedgerows will increase density and diversity of pollinators and natural enemies.
2- To assess the effects of improved hedgerows on pest abundance and rates of herbivory.
Hypothesis: Addition of flowering plants to existing hedgerows will improve biological control of major citrus and peach pests.
3- To investigate the effect of hedgerow connectivity on beneficial insect abundance and diversity.
Hypothesis: Increasing connectivity between hedgerows will increase density and diversity of pollinators and natural enemies
4- Educate growers on the need for hedgerow conservation with workshop and field days.
Hypothesis: Growers will be willing to include flowering plants in their existing hedgerows, will conserve existing hedgerows, and will plant new hedgerows to increase their connectivity.
Cooperators
- - Producer
- - Producer
- (Researcher)
- - Producer
- - Technical Advisor
Research
Objective 1: To increase diversity and complexity of existing hedgerow systems and measure their impact on pollinator and natural enemy density and diversity
Three locations have been selected for this project: Central Florida (citrus), North Florida (citrus satsuma mandarin), and Georgia (peaches). In each of these locations, the experimental setup will be adapted to the local orchard. Because we are using existing windbreak systems, we need to adapt our treatments for each specific location in collaboration with the local farmer.
Field trial in Central Florida (Citrus): cooperative farmer James Shinn
The citrus farm selected for this experiment is located in Lake Alfred, FL. Our cooperator James Shinn is the owner of half a dozen citrus groves of large size situated within a 10 mile radius. Two citrus groves with uninterrupted 0.5 miles windbreaks will be selected with one field acting as the treatment (enhanced hedgerows) and the other as a control (unenhanced hedgerows). Each grove has windbreaks that are currently made up of a single row of mature eucalyptus. All have room on each side of the windbreak to allow for the planting of flowers and vines on one side, and shrubs on the other side. In the treated field, there will be 6 treatments installed adjacent to the grove, each will be 5 grove tree rows length (row middles are 18-20 ft.), separated by two buffer rows and with treatments replicated 4 times. In this location, the following treatments will be applied: 1) hedgerow alone; 2) hedgerow + shrub; 3) hedgerow + wildflower; 4) hedgerow + shrub + wildflower; 5) hedgerow + shrub + vines; 6) hedgerow + shrub + wildflower + vines.
An additional field situated 1 mile away from the experimental groves will be used as a control to compare a grove with flower enhancement and a grove without flower enhancement.
Field trial in North Florida (Satsuma): Cooperative farmer Kim Jones.
The Satsuma grove selected for this experiment is located in Monticello FL, is 75 tree rows in total length, with each row approximately 24 trees. Along the North edge, a windbreak consisting of two rows of cypress has been erected. The current distance between the windbreak and the citrus grove is about 40 feet. According to Kim Jones, our cooperating farmer, they need 35 feet to operate tractors between the citrus grove and the windbreak, giving us 5 feet to implement our treatments. Because the cypress trees are still short in size, we will only implement vines and flower stripes in this grove. There will be 4 treatments, each 5 rows length, separated by one buffer row, and with treatments replicated 3 times. In this location, the following treatments will be applied:1) windbreak alone, 2) windbreak + vines, 3) windbreak +flower strip, 4) windbreak + vines + flower strips. An additional field situated 3 miles away from the experimental grove will be used as a control to compare a grove with flower enhancement and a grove without flower enhancement.
Field trial in Central Georgia (Peaches): Lee Dickey
Our experimental field will be located in Byron, GA. This field consists of 3-year old peaches with high population of San Jose scale. The windbreak length is situated on the northern side of the grove, reaches approximately 5 m height, and is constituted of a single row of cypress and oaks.
There will be 6 treatments, each 5 rows length, separated by one buffer row, and with treatments replicated 4 times. In this location, the following treatments will be applied: 1) hedgerow alone; 2) hedgerow + shrub; 3) hedgerow + wildflower; 4) hedgerow + shrub + wildflower; 5) hedgerow + shrub + vines; 6) hedgerow + shrub + wildflower + vines.
An additional field situated 2 miles away from the experimental grove will be used as a control to compare a grove with flower enhancement and a grove without flower enhancement.
Plant selection
Plant selection has been based on the following criteria: 1) the plants have to be native to avoid invasiveness in the landscape; 2) the plants can be grown from central Florida to central Georgia; 3) plants provide season-long resources; 4) plants are inexpensive and require low maintenance to favor adoption by growers.
Vines will be Coral Honeysuckle Lonicera sempervirens. This vine has been selected because it is adapted for Central Florida and Georgia conditions, is native to Florida, and can grow in part shade (Brown & Knox, 2007). In addition, these vines have been reported as highly attractive to pollinators and natural enemies (Harris et al., 2016), and require minimal maintenance (http://gardeningsolutions.ifas.ufl.edu/plants/ornamentals/coral-honeysuckle.html). Vines will be placed along the windbreak and supported by an inexpensive system of poles and wires or on existing fence structures. Irrigation systems will be implemented to ensure fast growing and good flowering of the vines.
Flower strips will be constituted of Coreopsis (Coreopsis auriculata). Coreopsis are native to the southeastern United States, fast growing flowers requiring low maintenance, and highly attractive to natural enemies and pollinators (Harris et al., 2016). They can be grown in both Florida and Georgia. In addition, Coreopsis produces flowers with extrafloral nectaries, which provide easily accessible nectar to natural enemies (Wackers, 2004).
Shrubs will be buttonbush (Cephalanthus occidentalis). Buttonbush are native to both Georgia and Florida, medium growing reaching 20 feet tall when mature, require low maintenance, and have no known serious insect or disease problems. Buttonbush produce white flower heads that are very attractive to bees and butterflies (Madhumita et al., 2003). . Irrigation will be provided to all new plantings to increase immediate growth.
Predatory insect density assessments
A high-power vacuum insect sampler (D-Vac Vacuum Insect Net – Model 24, Rincon-Vitova Insectaries, Ventura, California) will be used to assess the density of mobile predatory insects. This sampling device have an airflow capacity of 21.23 m3/min at the collection head with a 3.75 H.P engine. For each sample, the collection cone will be applied for 30 s onto approximately 2 m2 of the canopy of the targeted plant. For each treatment and control plot, the windbreak (that include shrub, flowers, vines, litter) and 1st and 3rd rows of the adjacent citrus/peach grove will be sampled in separate bags. The insects will be collected into mesh bags that will be replaced for each sample. Mesh bags will be brought back to the laboratory and placed in a freezer (−4 °C) for 24 h. Insect predators including ladybeetles, syrphidae and lacewings collected within each bag will be counted and identified to the lowest taxonomic unit possible under a stereomicroscope. In addition, yellow sticky traps will be deployed on the border of the windbreak, and at the 1st and 3rd rows of the citrus grove (3 sticky traps per plot). Yellow sticky traps will be changed every 2 weeks from April to November. Predatory insects will be counted and identified to the lowest taxonomic unit possible.
Pollinator insect density assessments
Bloom period duration and flower density will be measured weekly throughout the year by counting the total number of inflorescences per plot. Nectar quantity and sugar concentration from wildflowers, vines and bushes will be measured three times during the bloom period for each flowering plant in the treatment plots in order to determine each plant’s relative value to bees and other pollinators. On the day prior to sampling, in all plots in bloom, 10 inflorescences per plot will be randomly chosen and bagged to exclude insect visitors for 24 hours. The following day, bags will be removed and nectar volume per inflorescence will be measured using microcapillary tubes. Additionally, nectar from all inflorescences within a plot will be pooled and tested for sugar concentration using a low-volume handheld refractometer. This will be repeated three times for each species of flowering vine, wildflower, and shrub at each site.
To determine relative plant species attractiveness to pollinators, visitation rates will be recorded monthly to each flowering species within each plot. Each plot in bloom will be monitored for 5-mins during which time a trained observer will walk around the perimeter of the plot and record each individual pollinator visit to a flowering vine, shrub, or wildflower. Bees will be identified to groups including honeybees (Apis mellifera L.), bumble bees (Bombus spp.), and other bees (i.e. Melissodes and Lasioglossum spp.). Visitation rates by other pollinators will be recorded to group including butterfly, fly, wasp, and crawling insect (e.g. beetles). The plant species on which the pollinator was found will be recorded. Observations will be made when temperatures are at least 10 °C and with no precipitation.
Additionally, to investigate density of pollinators and syrphidae at a larger scale, experimental orchards enhanced with flowers and vines will be compared with control orchards without flower enhancement. To do so, white, blue, and yellow “bee bowls” with a 1% detergent solution will be placed on a platform at 1 m height for a period of 48 hrs deployed once per month over the year. Four sets of 3 bowls (one per color of blue, white, and yellow) will be placed within the hedgerow enhanced plots and also three rows into the crop field adjacent to the hedgerow plots. Insects from these bowls will be collected, pinned, and identified to species.
Measure of abiotic factors.
A series of measurement stations will be established on the leeward side at 1H (1H = a distance of one windbreak height), 3H, 6H, if possible 12H along a transect perpendicular to the windbreak. At least two separate transects will be established on the leeward side of each windbreak at each site. Automated weather stations will be placed at each measurement stations to measure and record windspeed, temperature and relative humidity. Windspeed will be measured using HOBO windspeed smart sensors and temperature/relative humidity will be measured using HOBO temperature/relative humidity sensor. Both the sensors will be mounted on stands at a height of 2 m from the ground. Automatic measurements will be taken every 10 seconds and hourly averages will be recorded in data logger. A reference station will be established at each site. Existing weather stations will be used as reference stations where available. (Tamang et al., 2010)
Farmer involvement:
Each treatment has been presented, discussed and approved by farmer cooperators. As mentioned earlier, each experimental design has been adapted to the individual farm operation so that the farmer can continue their operation without any disturbance. All farmer cooperators agreed to help plant the vines, shrubs, and flowers, and maintain them for the duration of the study. The PI and co-PIs visited each farm and had a meeting with each farmer to better assess the dimensions, the potential locations and the logistics associated with this project.
Statistical analyses.
As we expect that most of the data will not be normally distributed, the numbers of key natural enemies including ladybeetles and lacewings as well as pollinators will be analyzed with general linear mixed models with Poisson distribution. Fixed variables will be treatments, field, and date after treatment implementation. Blocks nested within fields will be included in the models as random variables.
Objective 2: To assess the effects of improved hedgerows on pest abundance and rates of herbivory.
A comment on our pre-proposal pointed out that adding companion plants may also attract pests. We agree that a wrong selection of companion plants can exacerbate certain pest problems. As our main objective is to increase natural enemy populations to obtain a better control of some major fruit tree pests, measurements of the density of insect pests directly in the experimental groves will be performed. We will also monitor for pests found in treatment groves (with enhanced hedgerows) and associated with the companion plants that are not found in our control groves, suggesting that they are infesting the orchard via the hedgerows.
In citrus orchards, the density of adult Asian citrus psyllid (ACP) will be measured bi-weekly from the vacuum sampling and sticky trap assessment from objective 1 (Martini et al., 2015). In addition, the density ACP nymphs will be measured bi-weekly by visually inspecting 10 developing flush per plot for psyllids.
In satsuma, the density of rust mites will be assessed bi-weekly on 1cm2 area of fruit surface taken on an individual fruit. Magnifying lenses (10X) fitted with 1-cm2 grids will be held to count mites. All motile rust mite stages present under the grid will be counted. Similarly, the number of Citrus red scale will be assessed by counting the number of female scales on the surface of the fruit. For rust mites and scales, 10 samples on the 1st, 3rd and 6th rows from each hedgerow plot (for a total of 30 orchard samples per adjacent hedgerow plot) will be sampled weekly during the fruiting season. We are opting to use nondestructive sampling methods; therefore, participating growers will not lose yield due to the experiment.
In peach orchards, San Jose scale (SJS) crawlers (the immature, mobile stage) will be sampled bi-weekly on single trees at 3 distances along two transects for each of the 6 hedgerow treatment plots. Thus, we will sample 6 trees per treatment plot for a total of 36 sampling sites (trees) per orchard. We will sample trees on the 1st, 3rd and 6th rows from the hedgerow along two transects that are perpendicular to the border (hedgerow). Based on SJS development, we will begin to monitor crawler activity at 500 degree-days (base 51oF and maximum 90oF starting February 1st) using a piece of double-sided sticky tape positioned over a strip of black electrical tape and wrapped around an infested branch. Three scale monitoring tapes will be deployed per sampling tree and will be removed and replaced on a weekly basis. We will monitor scale crawlers for 3 weeks during three main periods of activity starting at 500 degree-days, 2,000 degree-days, and 3,500 degree-days. The number of SJS crawlers on a 5 cm section of tape will be counted using a stereomicroscope and seasonal means will be compared across the 6 treatments.
Objective 3: To investigate the effect of hedgerow connectivity on beneficial insect abundance and diversity.
In order to assess how the structure and connectivity of hedgerows affects their relative benefit to beneficial insects, 30 to 50 sites between Georgia and Central Florida will be selected along a gradient of hedgerow connectivity to other hedgerows or woodland patches. Some sites will be on farms owned by our participating farmers (but will not include the experimental fields used for objectives 1 and 2). All the sites will consist of fruit tree orchards (citrus or peaches) with hedgerows. For each location, the density of ladybeetles, syrphidae and pollinators will be assessed by vacuum and bee bowl sampling as described previously. There will be 10 vacuum samples and 6 bowl samples conducted per site and repeated three times a year. Any elongated tree planting with a length of more than 20 m and a width of less than 20 m will be considered as a hedgerow. For each site, landscape information such as hedgerow length, width and height, hedgerow orientation, and percentage of urban, agricultural and natural habitats within a 250 m, 1 km, and 2 km circle radius from the sampling point will be determined. Hedgerow connectivity will be assessed by measuring the total area of uninterrupted tree patch including the hedgerow and the distance between the hedgerow and the next closest forest patch using remotely-sensed land-cover maps (Tischendorf & Fahrig, 2000; Campagne et al., 2006; Cranmer et al., 2012).
To examine the effect of local grove characteristics on ladybeetle and pollinator abundance, total grove area and hedgerow length will be calculated using Arcview®, with aerial photography. Digitized polygons will be applied manually to the sampled groves to calculate grove area and hedgerow length. For each location, the abundance and diversity of natural enemies and pollinators as measured by diversity indices will be correlated to both hedgerow connectivity metrics and to local grove characteristics. Graph theory will also be used to quantify the physical connectivity of hedgerow networks. In this method, graphs are constituted of nodes and edges. A graph is connected if a path between each pair of nodes exists. Each node is given an order depending of the number of edges which are connected to it. In our case, hedgerows will be assimilated to graph edges and intersections between these hedgerows to nodes. It is possible to distinguish four configurations of hedgerow intersections: only one edge is connected to the node, or 2, 3 or 4 edges are connected to the node. We hypothesize that an area with over 3 edges will have better biological connectivity than areas where node order is lower.
Objective 4. Educate growers to the need of hedgerow conservation, with workshop and field days.
Three field days will be organized during this project, one in central Florida, (Lake Alfred), North Florida (Quincy), and Georgia (Athens). Growers, extension agents, and industry representatives will be encouraged to attend each event. Field days will either be at the cooperative grower’s site or at a local research/extension center and include visits to orchards with improved hedgerows, presentation of the data collected from the project, and demonstration of the ecological services brought by hedgerow conservation. At the end of the workshops a survey will be conducted to assess the proportion of growers that currently have hedgerows and understand what barriers exist to enhanced hedgerow implementation.
During orchard visits, both researchers and growers will share information on the planting, maintenance, challenges, and benefits of the enhanced hedgerows. For each field day, attendees will be provided with a notebook containing handouts of presentations and copies of educational documents created to provide guidance to growers wanting to implement enhanced hedgerows (EDIS documents for FL field days, UGA Extension Publications for GA).
Results for the citrus groves
Summary of taxa sampled from different techniques
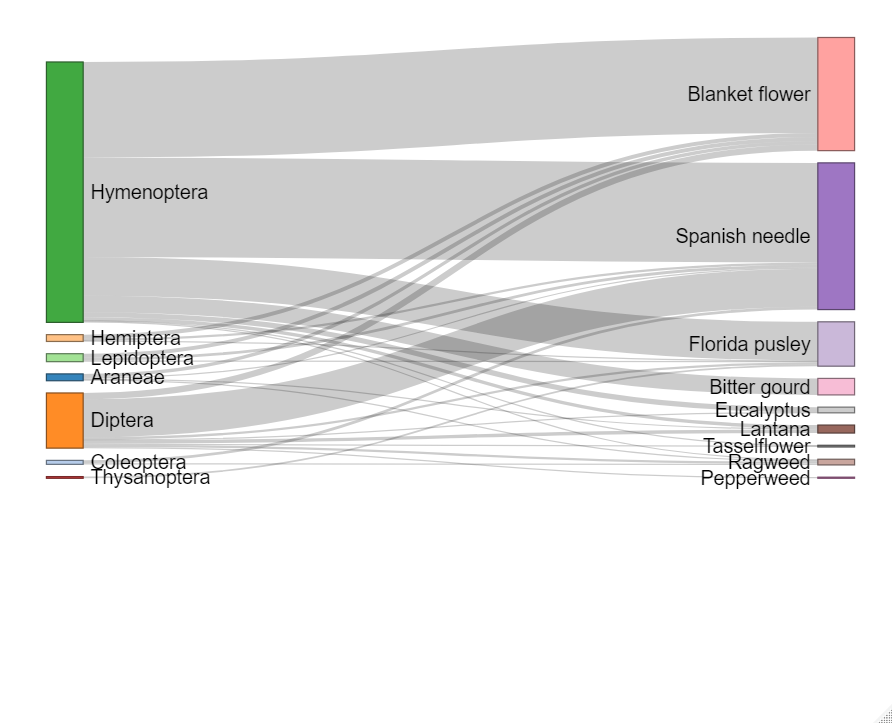
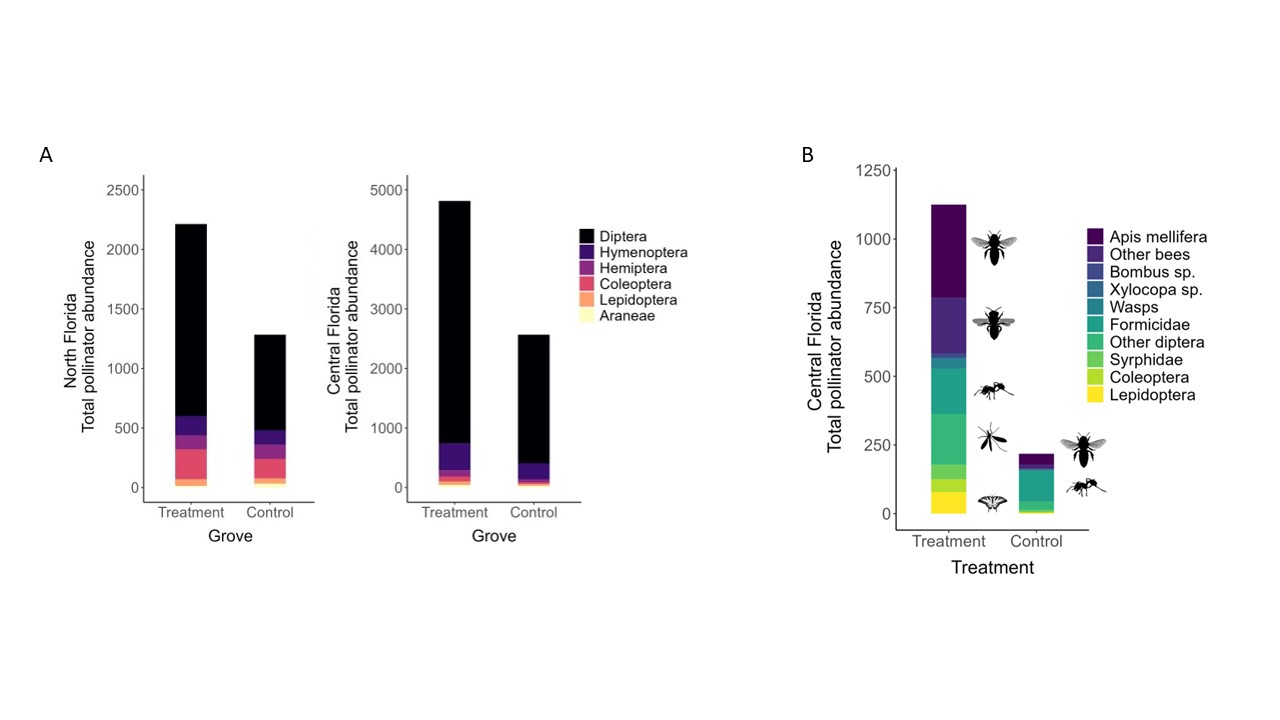
Our pan traps in North Florida collected a total of 3642 arthropods. These consisted primarily of dipterans (66%), followed by coleopterans (11%), hymenopterans (8%), hemipterans (7%), as well as lepidopterans (3%), and araneae (1%). Our pan traps in Central Florida collected a total of 7399 arthropods. Of these, approximately 84% were dipterans and 10% were hymenopterans, with a much smaller subset of samples representing hemiptera (2%), coleoptera (1%), lepidoptera (1%), araneae (1%), and other groups (Fig. 1). Major groups in the treatment groves include Apis mellifera, other bees including Megachile sp., formicids, dipterans, as well as lepidopterans. The composition of floral visitors in the control grove was dominated by ants followed by Apis mellifera.
Do floral treatments increase total bee abundance and diversity in grove-level treatments?
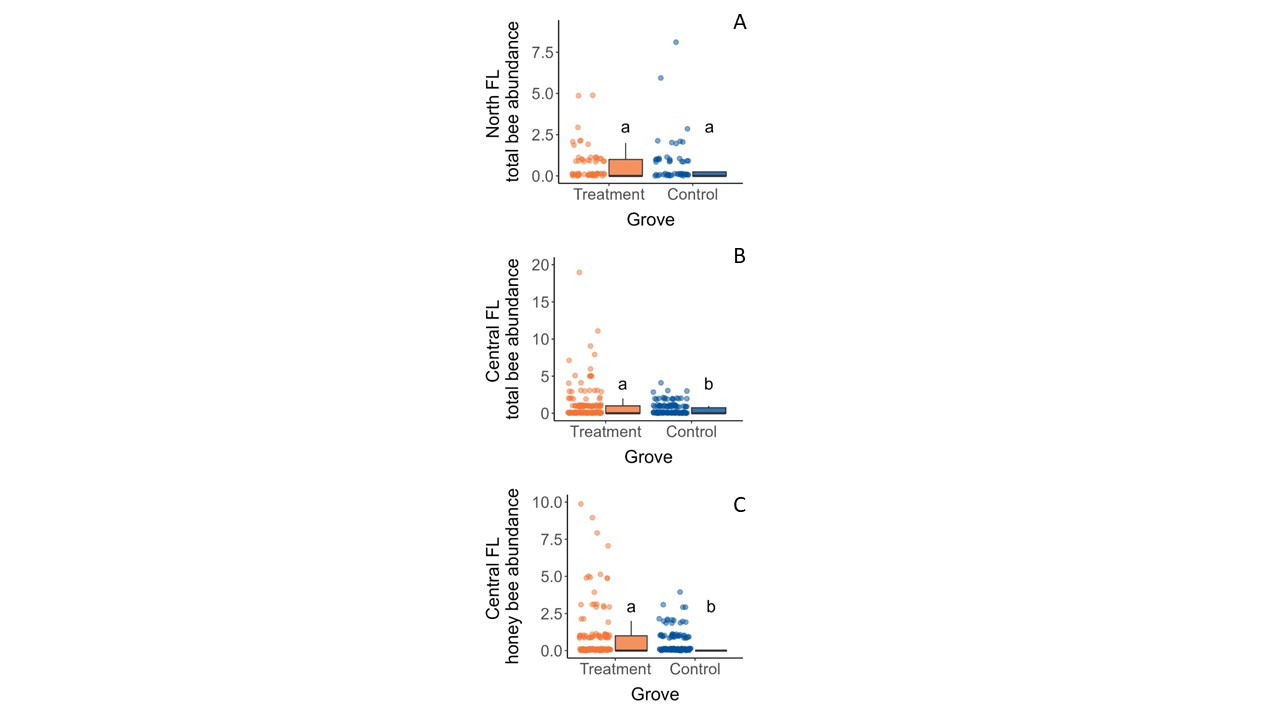
Based on specimens collected from our pan traps, we found variable trends across location on the effects of floral plantings by windbreaks on bee abundance in groves (Table 5, Figure 2). In north Florida, the grove treatment (ꭓ2 = 0.0992, df = 1, p = 0.7528) and sampling row (ꭓ2 = 6.474, df = 3, p = 0.0907) did not impact overall bee abundance, but the sampling year did (ꭓ2 = 11.8016, df = 1, p = 0.0005). Specifically, more bees were observed in the first year compared to the second year (Z= 4.408, df= 1, p < 0.0001). There were also significant interaction effects between the sampling row and sampling year (ꭓ2 = 10.4917, df = 3, p = 0.0148), largely driven by more bees collected at the windbreak in the first year than other sampling rows in the second year. In central Florida, the grove treatment was predictive of bee abundance (ꭓ2 = 8.702, df = 1, p = 0.0032). There more bees in the treatment grove compared to the control (z = -2.95, df =1, p = 0.0032) where our model predicted 1.64 times as many bees in the treatment grove compared to the control. Although there were not enough honey bees (Apis mellifera Linnaeus) present in the North Florida dataset to analyze the effects of the floral plantings on them (n=3), the proximity of both of our central Florida groves to nearby commercial bee hives allowed us to explore this question. Again, grove treatment was a significant predictor honey bee count (ꭓ2 = 6.7004, df = 1, p = 0.0096) (Table 5). Although adding the sampling row into the model improved the AIC value, it was not a significant predictor (ꭓ2 = 6.3078, df = 3, p = 0.0976). Honey bees responded similarly to bees as a group, with about 1.6 times more honey bees in the treatment grove compared to the control (Fig. 2).
Do the individual flowering treatments attract differing abundances of floral visitors?
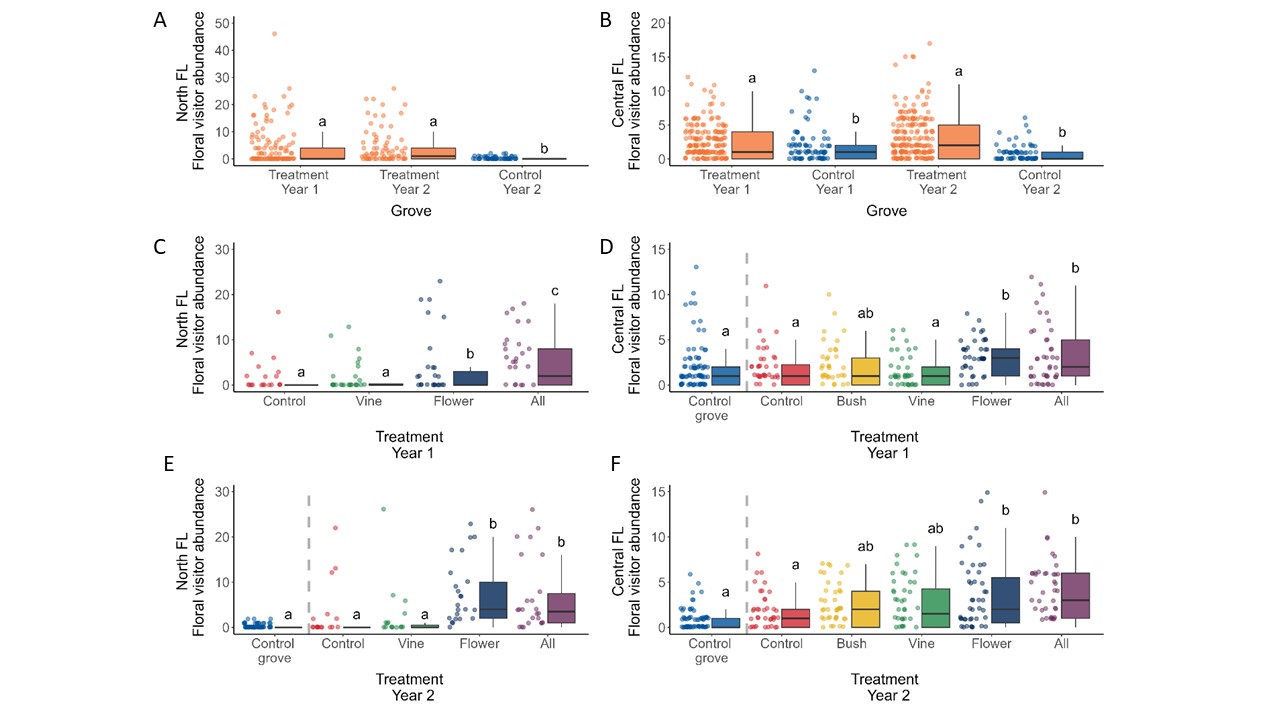
We next compared the number of arthropod visitors observed on flowers in each separate flowering treatment plot in the experiment groves as well as all control plots of the control groves (although these observations were not conducted in the control grove in North Florida in the first year). For both locations, fewer arthropods were observed on flowers in plots within the control grove compared to the treatment grove. On a treatment-level, the vine treatments containing coral honeysuckle, Lonicera sempervirens, did not differ significantly from control plots in the treatment grove nor control grove plots (Figure 3c-f). Central Florida also included treatments with buttonbush in Year 1 and Year 2, and this treatment also did not result in more floral visitors compare to the control plots. We did, however, observe a significant floral visitor increase in the herbaceous flower treatments containing blanket flowers as well as the “all flower” treatment where all flowering species were planted together (Fig. 3).
How much nectar is provided by treatment and naturally occurring flowers?
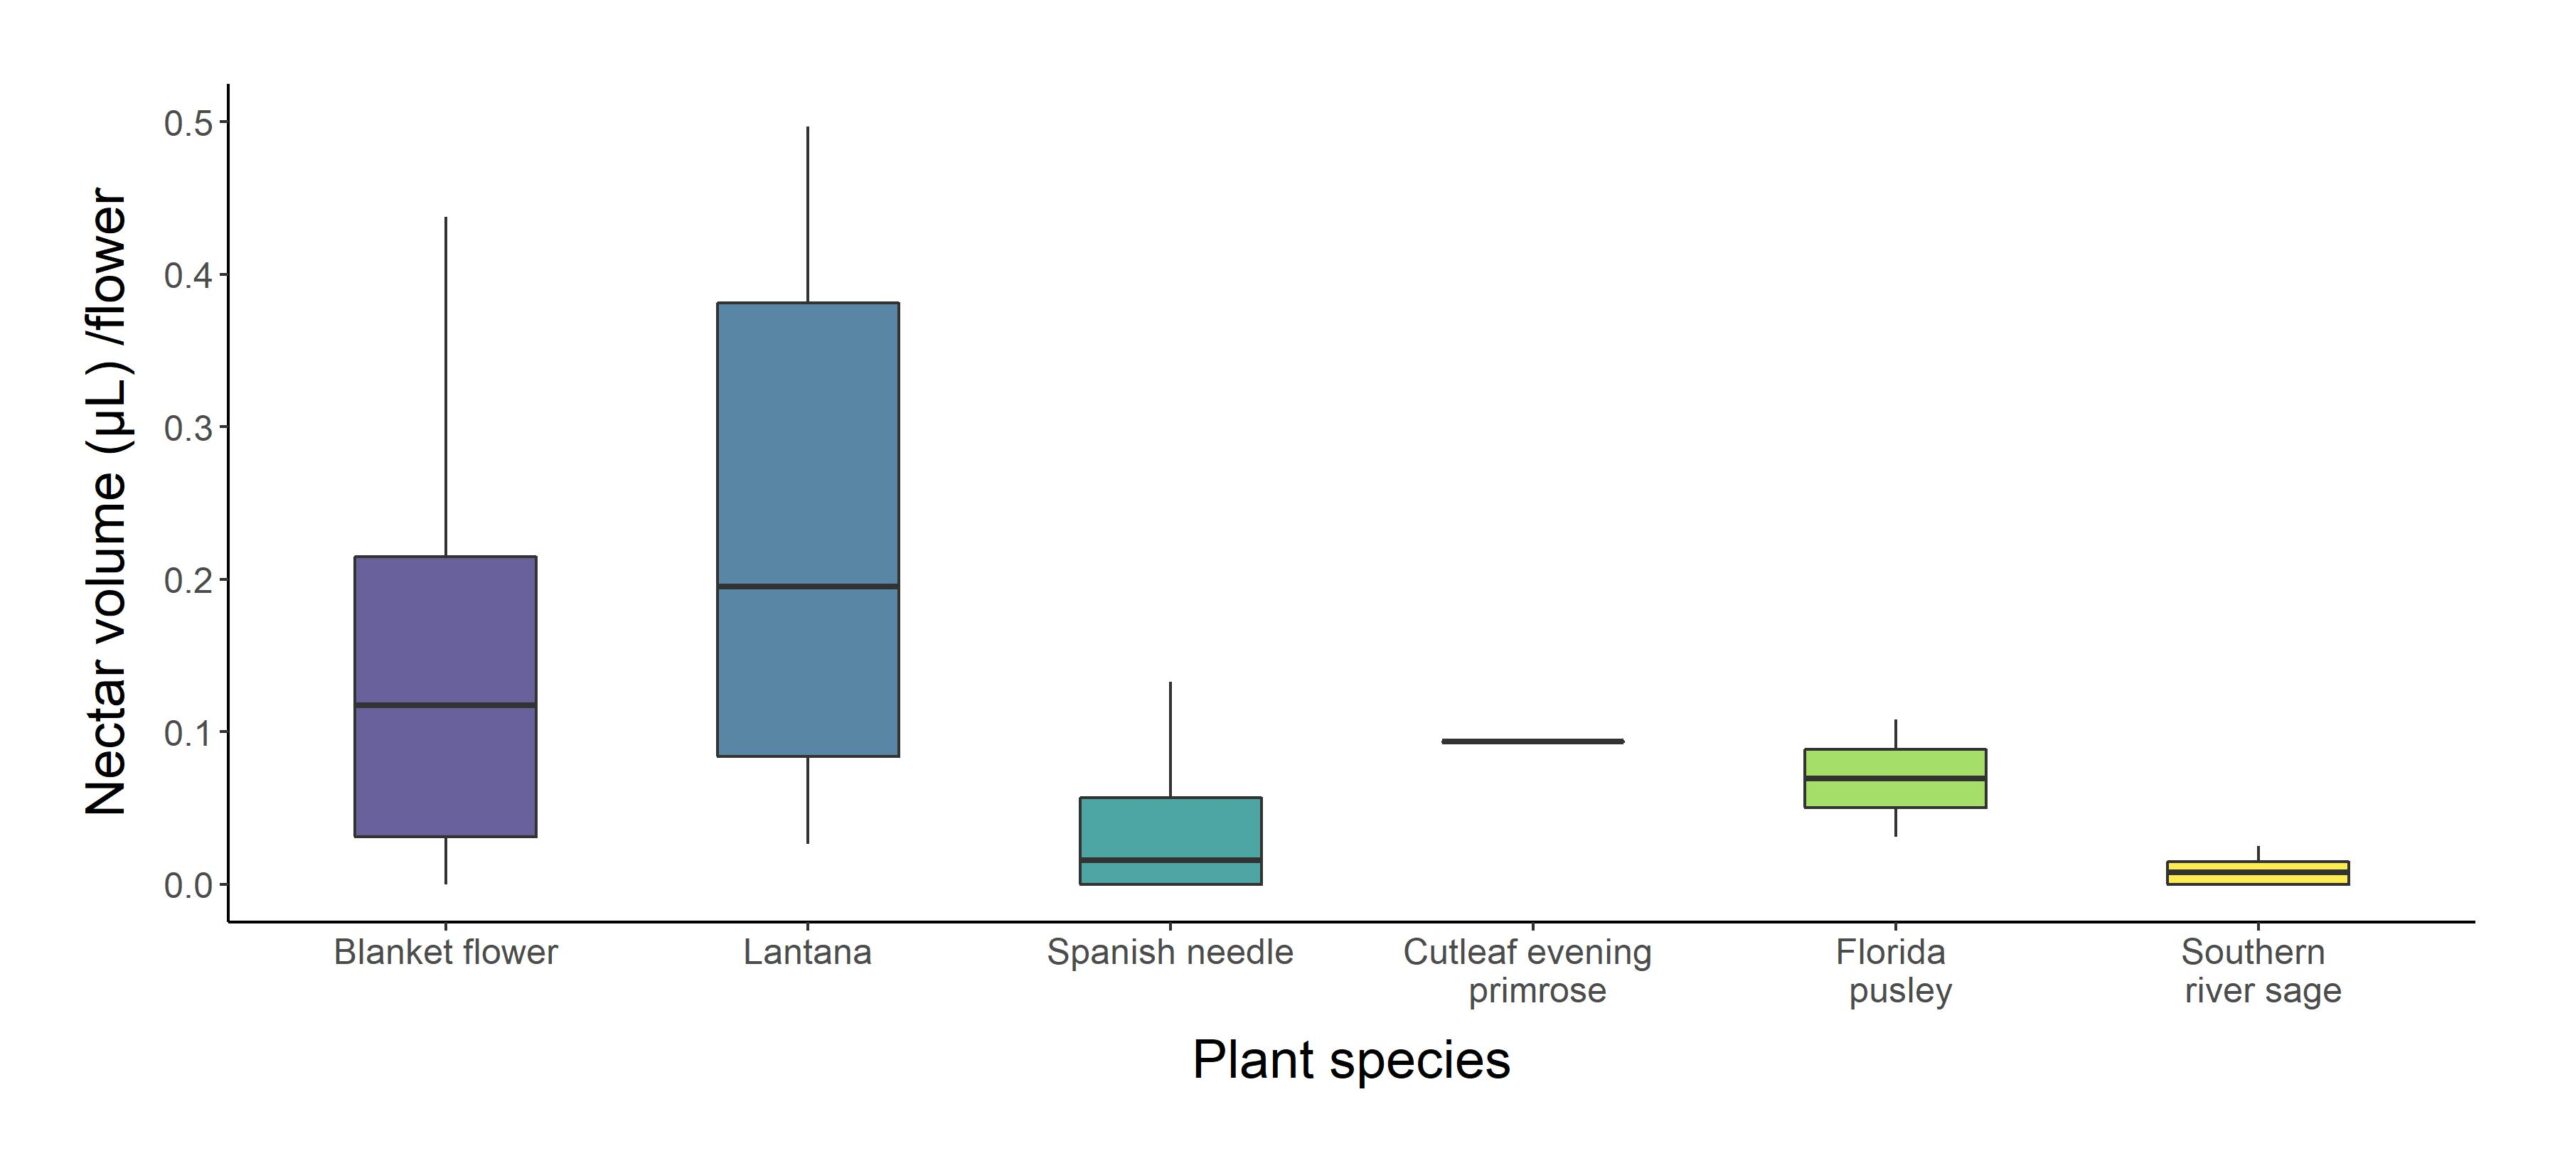
We sampled nectar from Lonicera sempervirens, Gaillardia sp., Echinacea purpurea, Lantana camara, Bidens alba, Richardia scabra, and Salvia misella (See Table S2 for values). Most species produced about 0.005-0.010 uL nectar per floret. Overall, L. sempervirens produced the most nectar by multiple orders of magnitude; it produced roughly 1000x more nectar per floret than most other species (i.e. 8.9 uL compared to 0.005-0.010 uL). However, when we account for the fact that Asteraceae such as the blanket flowers and Spanish needle in this study have composite flowers with multiple open florets (See Table S2 for values), each honeysuckle flower produced closer to 100x as much nectar.
Which factors best predict floral visitor abundance?
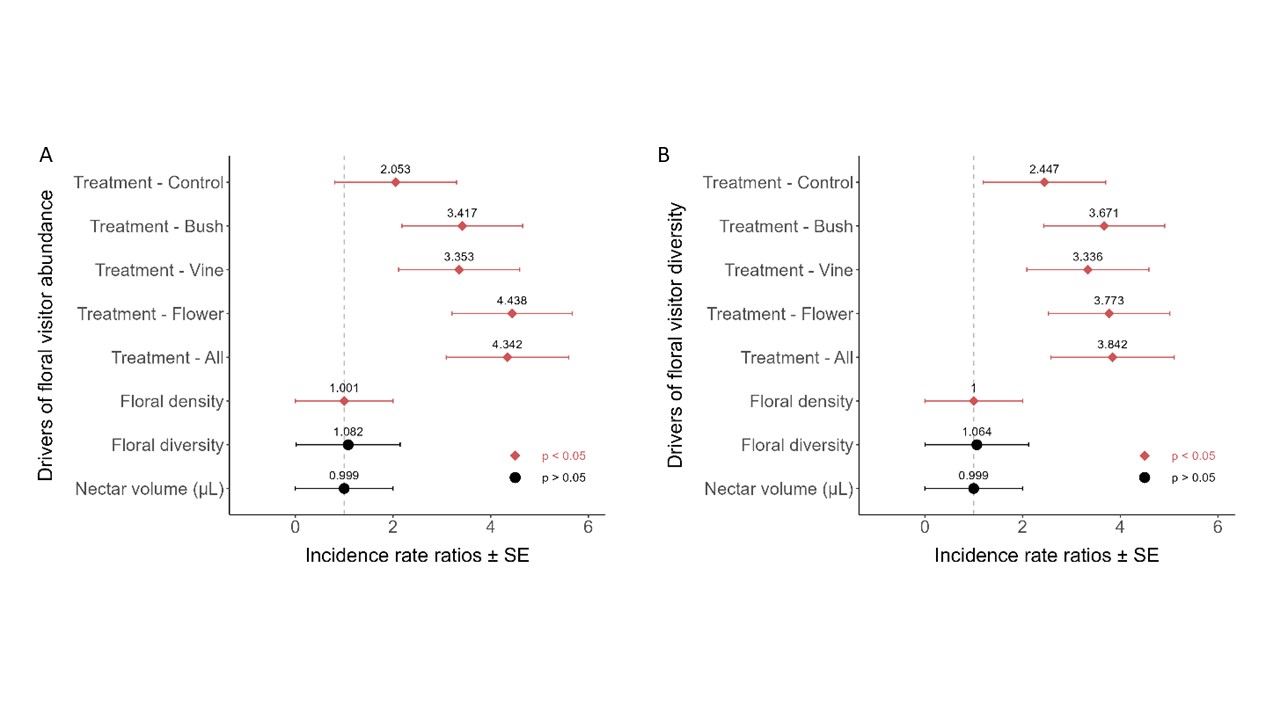
Since numerous weedy species colonized our plots, we modelled whether factors like overall floral density, plant species diversity, nectar volume, and the treatment group itself predicted the abundance and diversity of floral visitors observed. Floral visitor abundance and diversity responded similarly to these factors; treatment and floral density were significant predictors, while floral diversity present as well as the estimated available nectar volume per plot were not (Figure 4; Table X). Floral density had a relatively weak effect; our models estimate that every flower present corresponded with a 0.001 increased chance of observing an individual floral visitor or a new observed group. Every treatment in the treatment grove had higher counts of floral visitor abundance and diversity compared to the control grove, where plots containing common blanket flower (i.e. “flower” and “all flower” treatments) had over a fourfold increase in floral visitor counts and more than 3.7x as much floral visitor diversity (Fig. 4).
Which flowering species were floral visitors associated with?
To further explore the effects of floral density on floral visitation, we modelled the species-level contributions of three common plant species in this experiment and the effect of their floral density on overall floral visitor density in central Florida (Figure 5). The species were Gaillardia (common blanketflower), Bidens alba (Spanish needles), and Ambrosia artemisiifolia (common ragweed). Blanketflower had a positive but marginally significant overall effect, where the addition of each flower was associated with a 1.019x increased chance of observing a floral visitor (χ2 = 3.71, df=1, p = 0.054). Spanish needles had smaller, but clearer positive effect, where each additional flower was associated with a 1.002x increased chance of observing a floral visitor (χ2 = 5.78, df=1, p = 0.016). Lastly, there was no association between the number of ragweed inflorescences documented and floral visitor density (χ2 = 1.40, df=1, p = 0.237).
Nectar production
The highest amount of nectar was found in the vine (honeysuckle). However, those vines didn’t flower much and had therefore very little number of pollinators. If we exclude honeysuckle, the flower with the highest nectar production per flower was lantana, flowed by the blanket flowers (Fig. 5).
Predator abundance
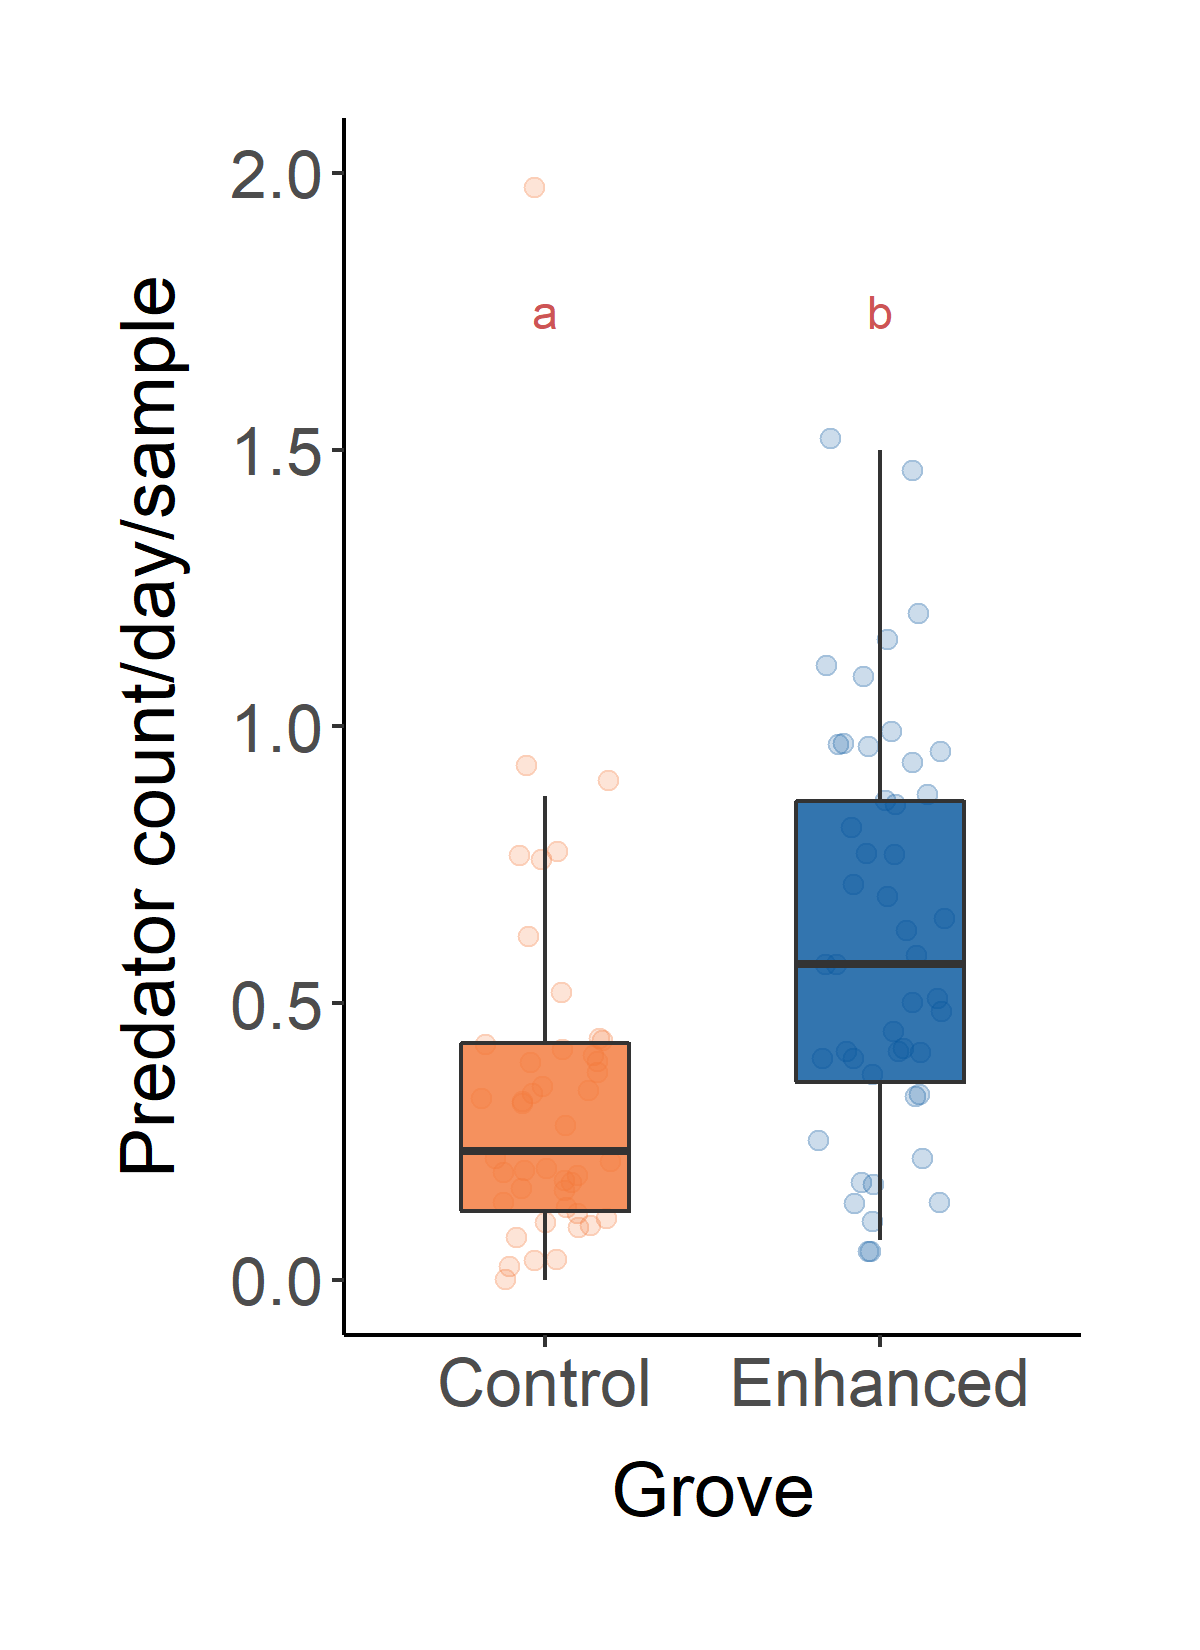
The two main predators that were collected in citrus groves were ladybeetles and syrphid. Both groups feed on nectar and pollen during the adult stage. Adding flowers significantly increased the number of predators, which may enhance biological control in citrus groves (Fig. 6).
Results for the Peach groves
Flower-Visiting Insects at Bloom
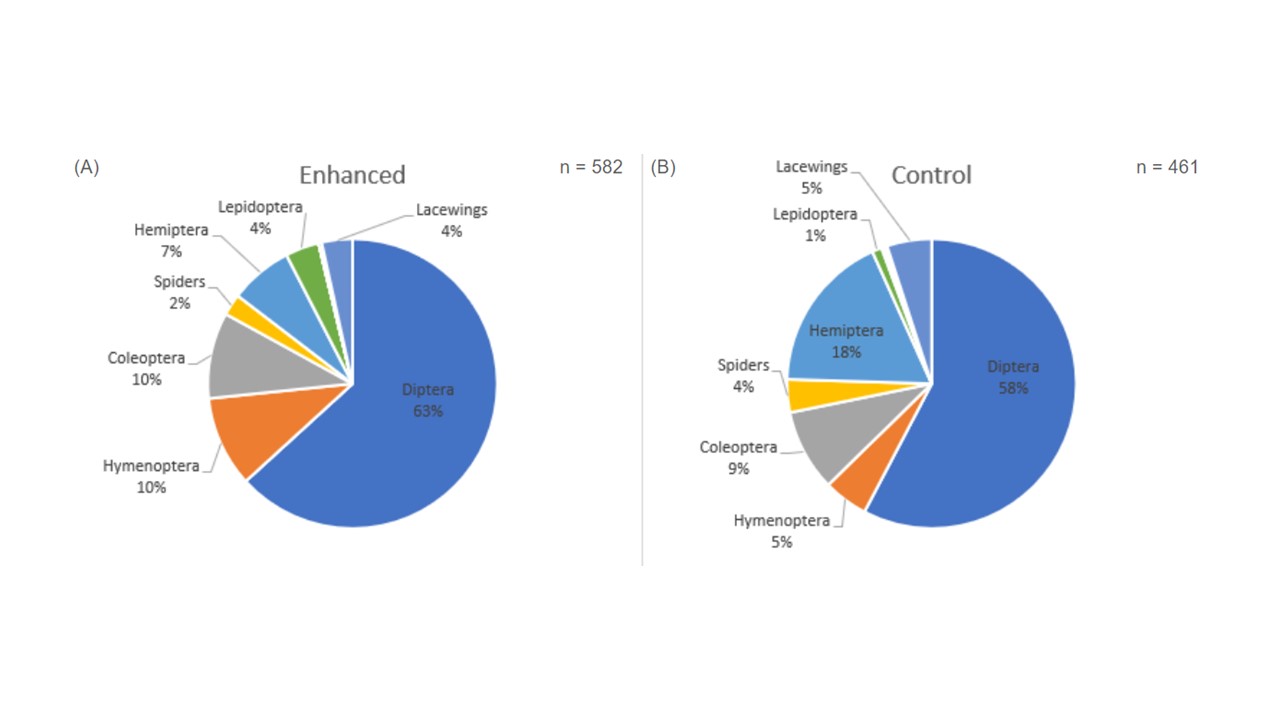
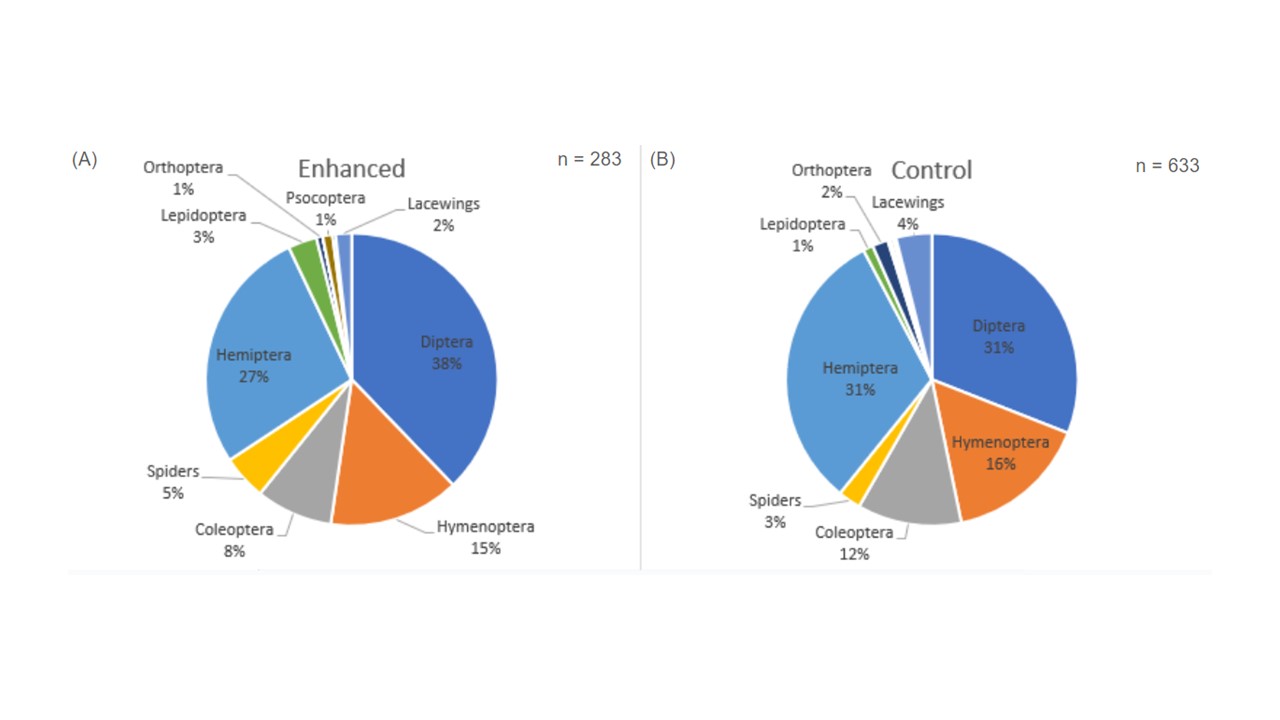
Looking at the arthropod community by order, we collected seven orders in 2021 from both the enhanced and the control orchards (Figure 1). A greater number of insects was collected in the enhanced orchard (n = 582) compared to the control orchard (n = 461), but not by a significant amount. Diptera were the dominant group in both the enhanced and control orchards this year, contributing to more than half of insects collected (63% and 58%, respectively; Figure 2.2). Diversity was low in both the enhanced and control orchards during 2021 (H’ = 3.607 and H’ = 3.867, respectively). In 2022 we collected nine arthropod orders from the enhanced orchard and eight from the control during bloom (Figure 2), which had both increased from 2021. As such there was also greater diversity in both the enhanced and control orchards (H’ = 5.175 and H’ = 5.297, respectively). Similarly to 2021, Diptera were the dominant group in both the enhanced and control orchards (Figure 2). Interestingly, in each orchard, we also observed an increase in community proportion of hemipteran and hymenopterans in 2022. Unlike 2021, though, there were significantly more insects collected in the control orchard (n = 633) in 2022 than in the enhanced orchard (n = 283). Looking at flowering-visiting arthropod distribution within the control and enhanced orchards, there were no significant differences across the sampling rows or orchard type in 2021. However, in 2022, there were significantly more flower-visiting arthropods collected in the windbreak and the first row from the control orchard than in the same locations from the enhanced orchard. However, there were no differences in arthropod abundances collected in the sixth row.
Bee Genera in Enhanced vs Control Orchards
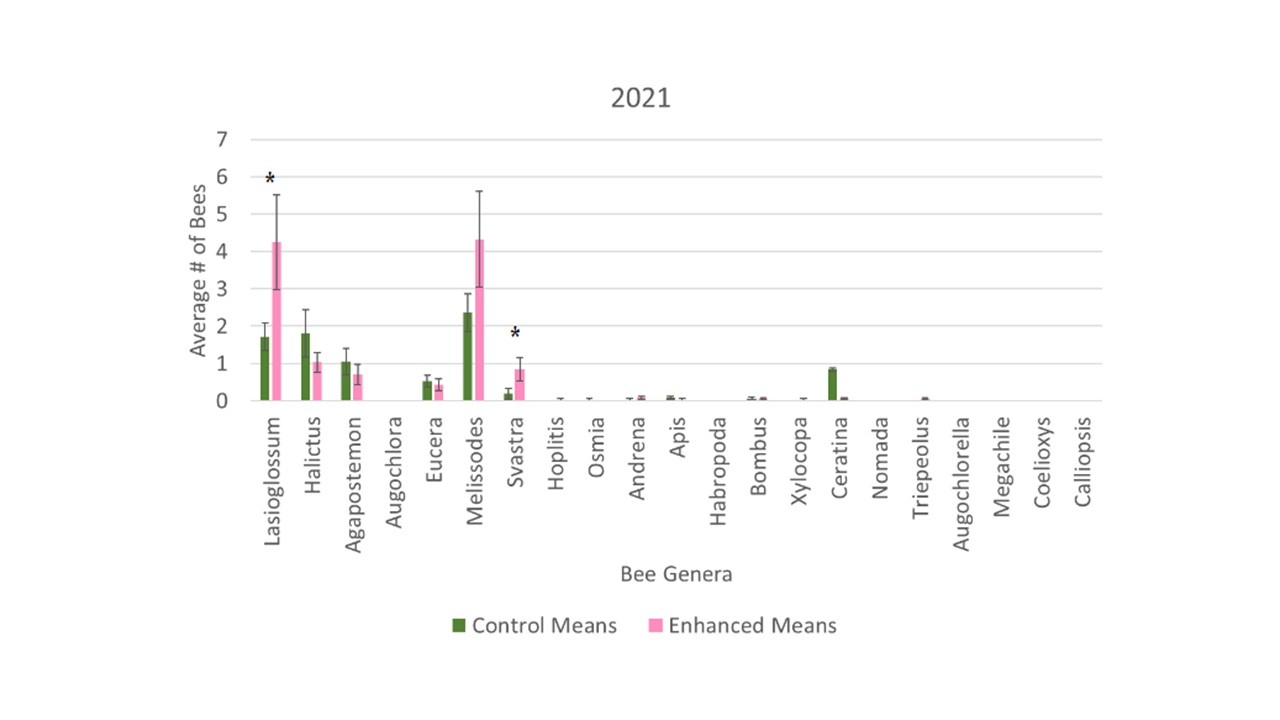
In 2021 we collected a total of 337 bees from bee bowls in the control orchards and a total of 440 bees from the enhanced. Overall, we saw a trend with a higher average bee abundance in the enhanced orchards, however the difference between the control and enhanced orchards was not significant (F1 = 3.14, p = 0.0803). When evaluating the collection data to assess whether individual bee groups expressed differences between the two orchards, both Lasioglossum and Melissodes had trends with higher abundances collected in the enhanced orchards, but Lasioglossum and Svastra were the only two genera that had significant differences (F1 = 5.46, p = 0.0220; F1 = 4.72, p = 0.0328, respectively; Figure 3).
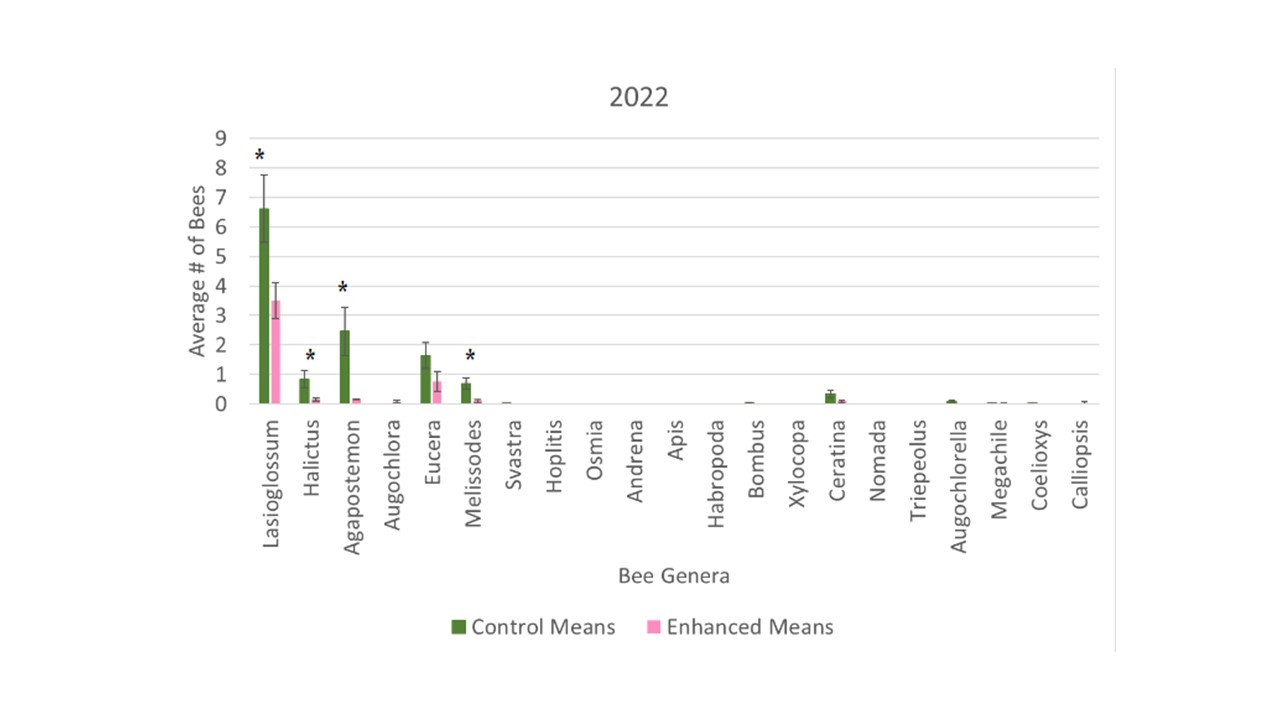
There were considerably more bees collected in the bee bowls from the control orchard in 2022 with a total of 776 bees, whereas there was only a total of 268 bees collected from the enhanced orchard. As such, looking at the averages from the total season there were significantly higher number of bees collected in the control (F1 = 14.02, p = 0.0003). This significance was driven by a few key genera. Specifically, Lasioglossum (F1 = 5.76, p = 0.0182), Halictus (F1 = 5.64, p = 0.0194), Agapostemon (F1 = 7.63, p = 0.0068), and Melissodes (F1 = 8.50, p = 0.0043) all had significantly higher numbers of specimen collected from the control orchard (Figure 4).
Bee distribution within orchards
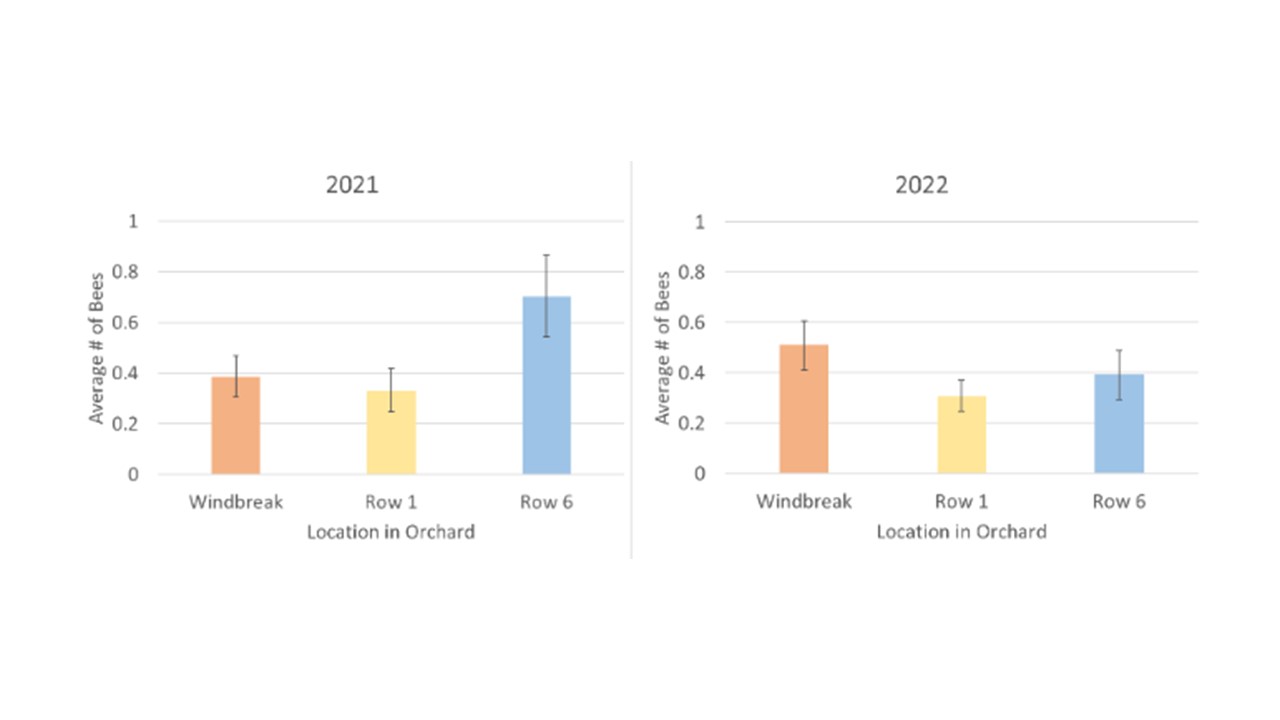
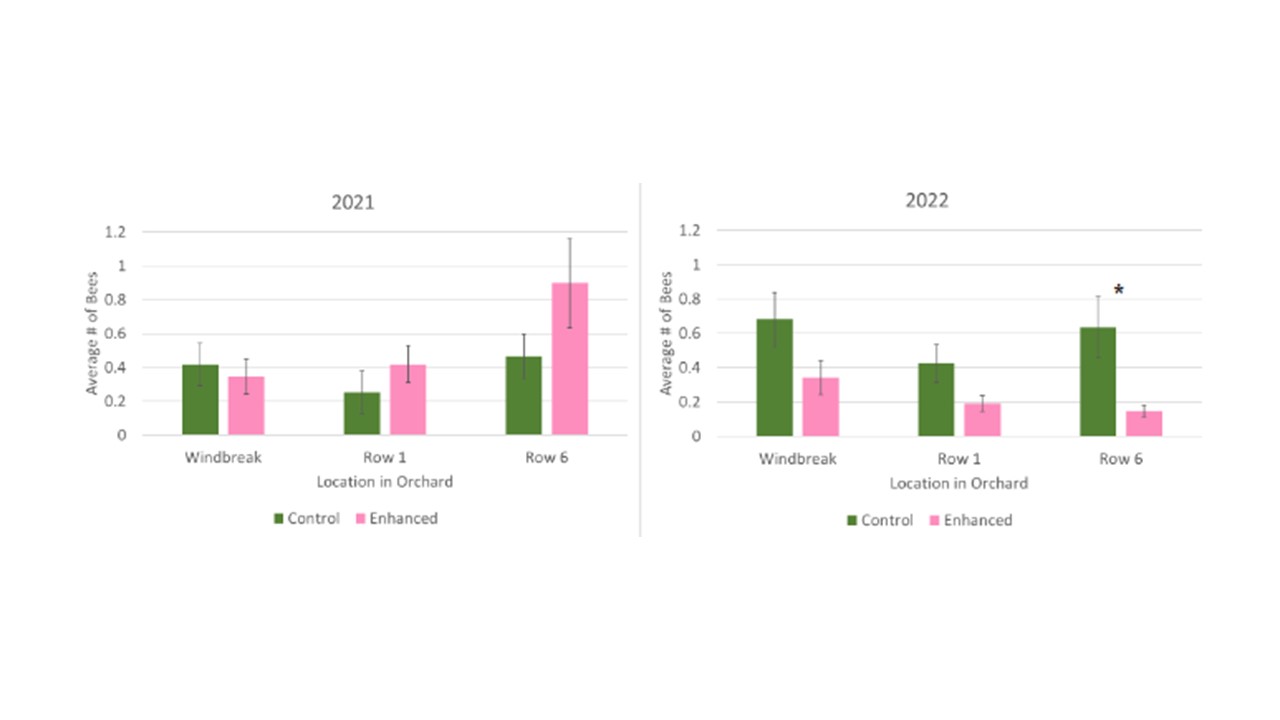
In order to determine the distribution characteristics of bees across the orchard, we assessed bee abundances at the three sample locations: windbreak, 1st row, and 6th row into the orchard. To look at overall distribution we combined the total bees from the control orchard with the enhanced orchard and assessed the averages in each location during each year. We found that there were no significant differences across the locations in either year with similar numbers of bees collected in bee bowls along the windbreak, the 1st orchard row, and 6 rows within the orchard interior (Figure 5). When we look at the average number of bees in each location, separated by the treatment orchard, we see an overall trend of a higher average bee abundance in each location in the control orchard in 2022 (Figure 6), however only the 6th row was significant (F1 = 7.69, p = 0.0090).
Total Herbivore and Natural Enemy Groups Collected
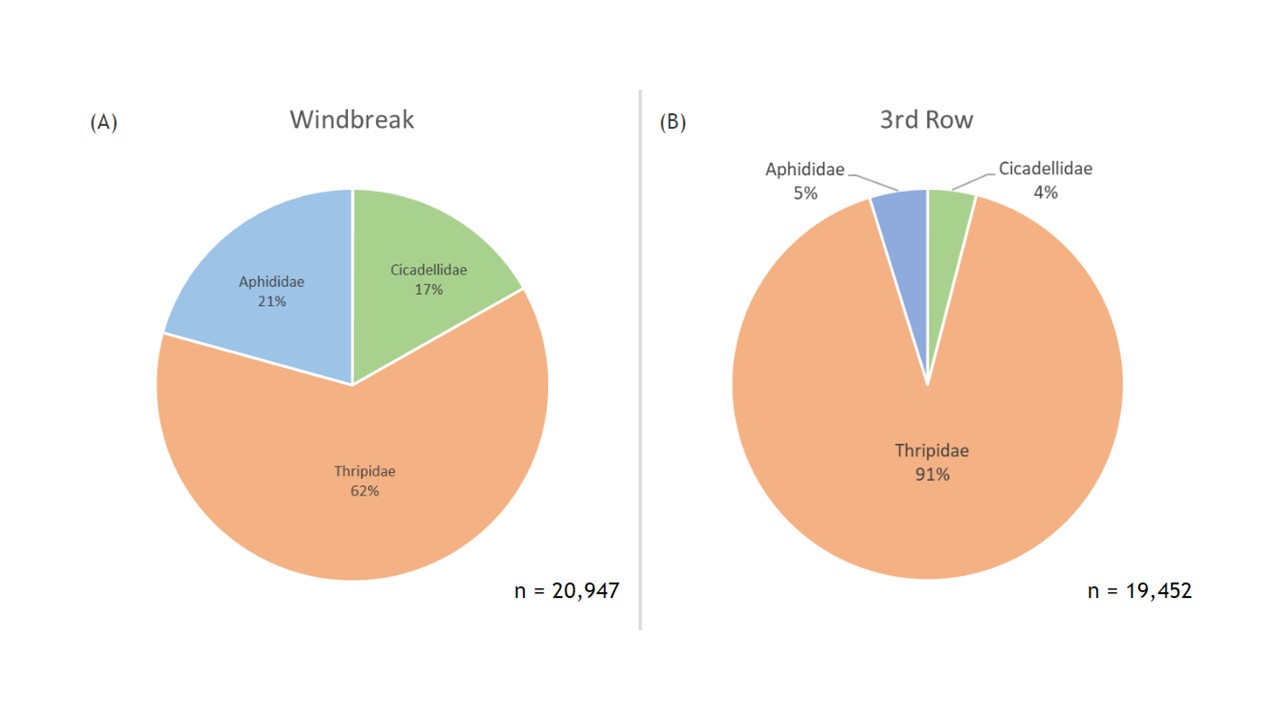
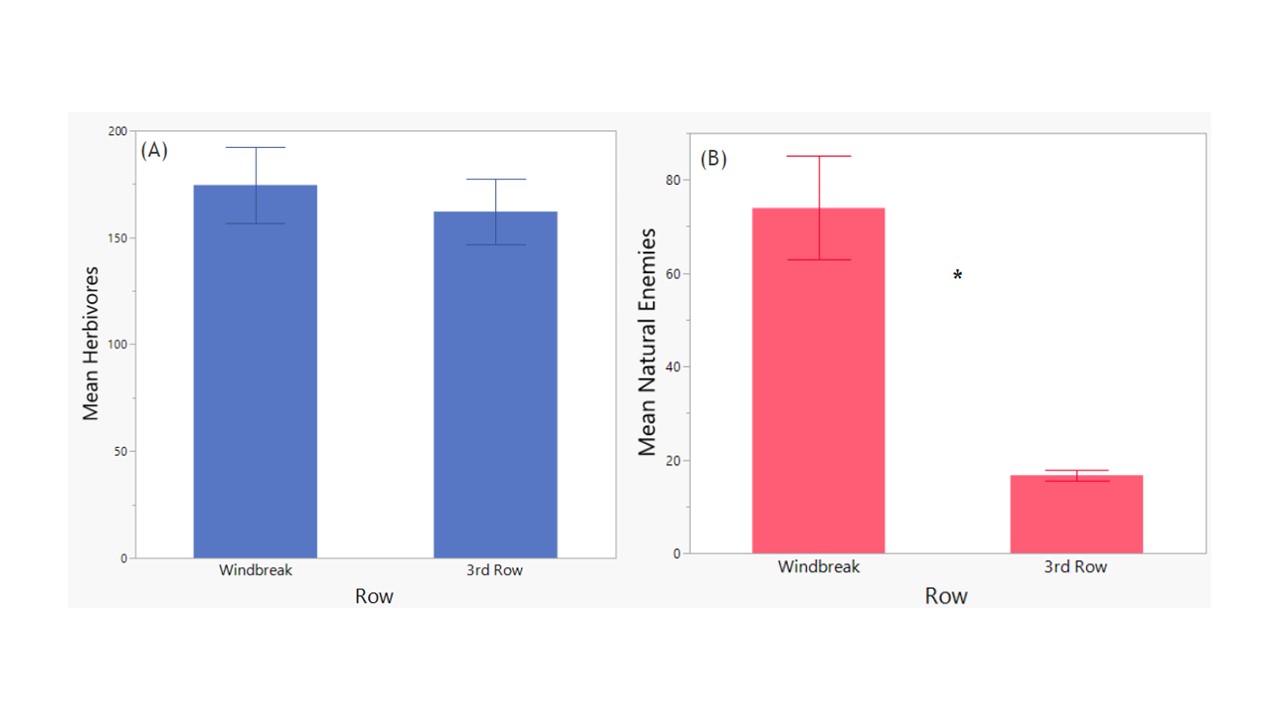
Across the entire season of trapping, combining insects from all the plots we collected 20,947 key herbivores along the windbreak and 19,452 herbivores within the 3rd row of the orchard (Figure 7). The majority of the insect herbivores were from the family Thripidae in both the windbreak and 3rd row samples, but a considerably higher percentage of herbivores were thrips within the orchard compared to the windbreak (91% versus 62%, respectively; Figure 7). However, the overall average abundances of herbivores compared between locations were not significantly different (F1 = 0.285, p = 0.5959; Figure 7).
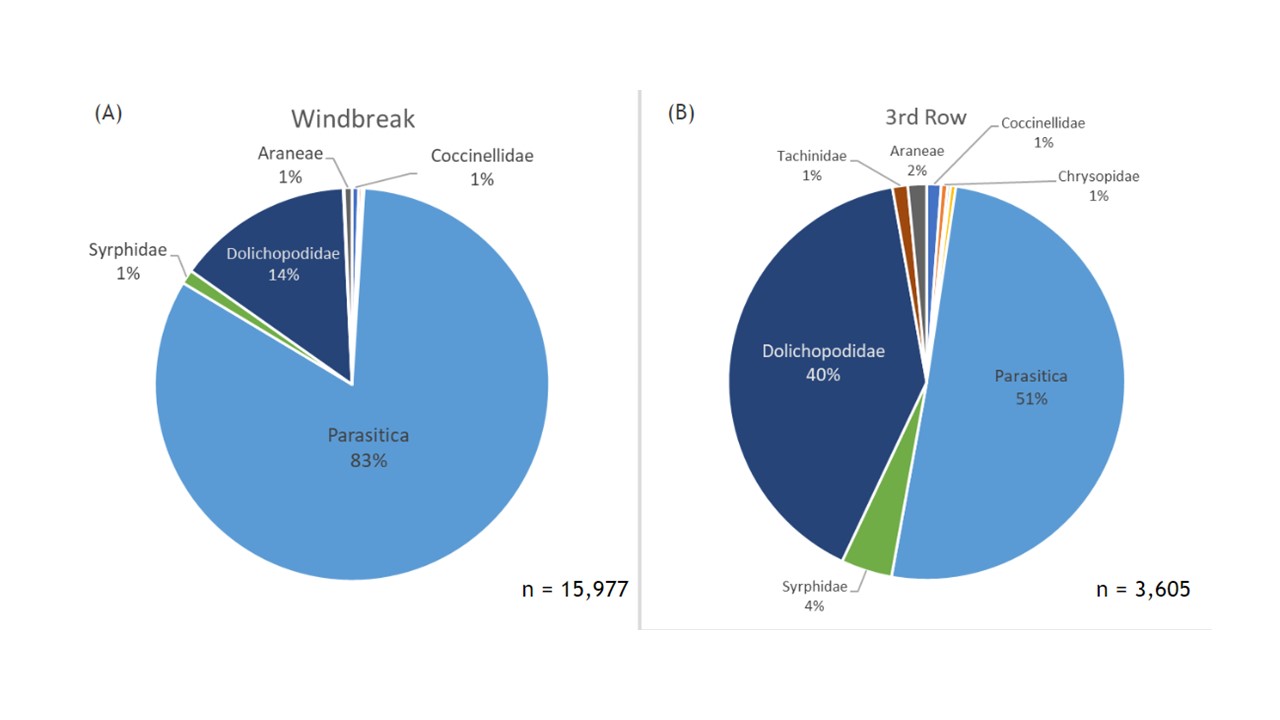
Combining insects from all the plots throughout the season we collected 15,977 key natural enemies along the windbreak and only 3,605 natural enemies within the 3rd row of the orchard (Figure 8). In both locations, parasitoid wasps (Hymenoptera: Parasitica) were the most abundant group collected, making up 83% of the community in the windbreak samples and 51% of the community within the 3rd row samples. The second most common group were the long-legged flies (Diptera: Dolichopodidae), which made up 14% of the community along the windbreak and considerably larger percent of the community at 40% within the 3rd row samples (Figure 9). Other notable predator families collected include syrphid flies (Diptera: Syrphidae), spiders (Aranaea), lady beetles (Coleoptera: Coccinellidae), and green lacewings (Neuroptera: Chrysopidae). The overall average abundances of natural enemies compared between locations was significantly higher in the Windbreak (F1 = 26.19, p = <0.0001; Figure 9).
Average Herbivores & Predators vs. Plot and Row
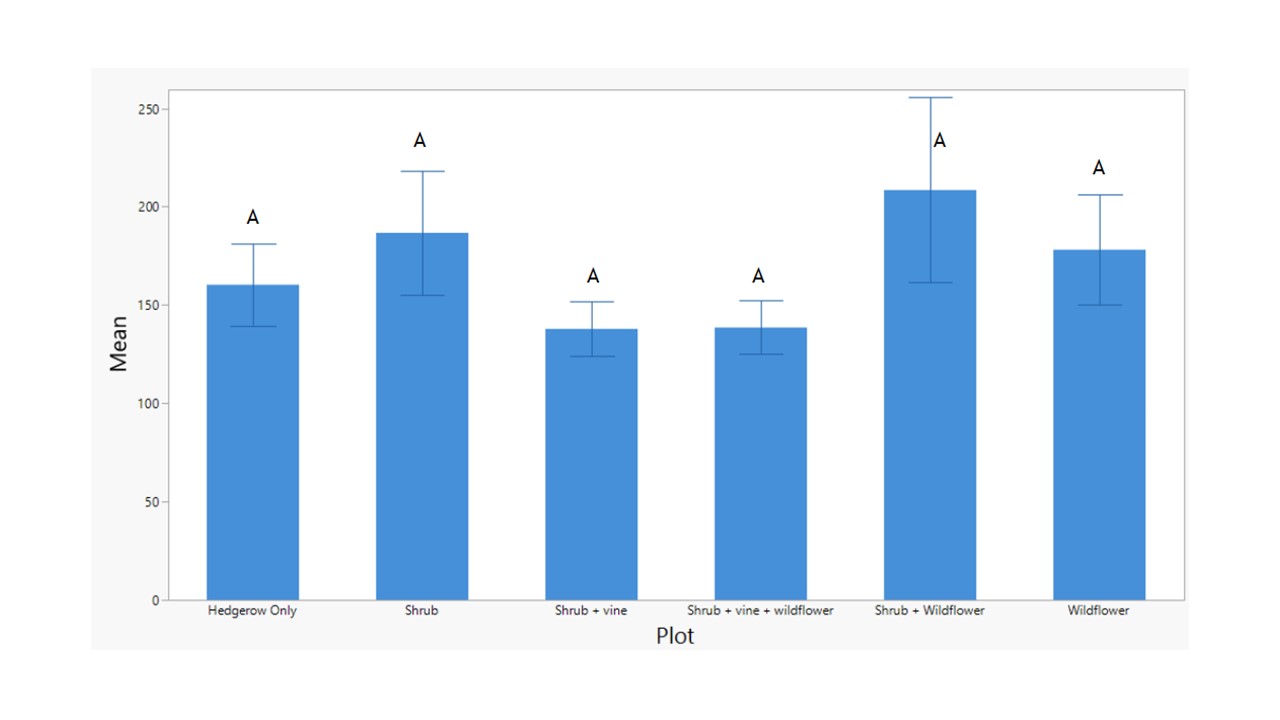
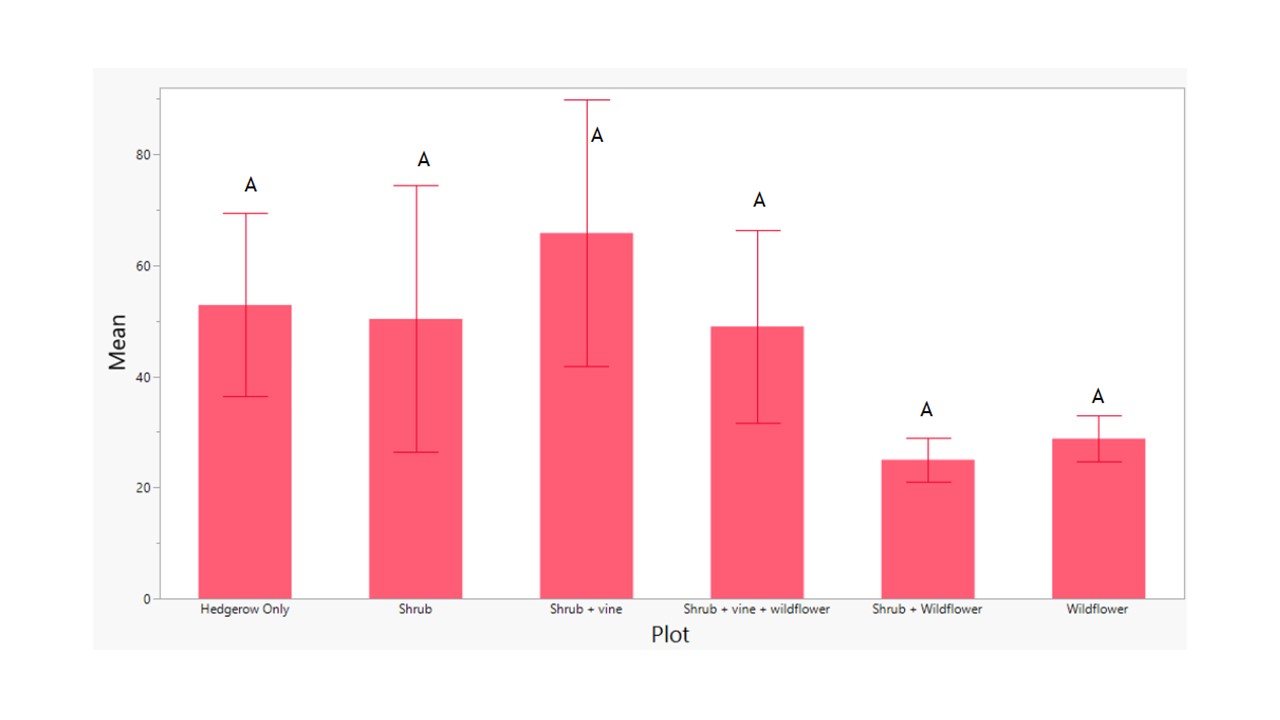
Evaluating the average abundances of herbivores and natural enemies in more detail across the flower treatments demonstrated that there were no significant differences in abundances of herbivores collected on YSTs across any of the treatments (F5 = 0.9733, p = 0.4452; Figure 10) Similarly, there were no significant differences in natural enemy abundances across the treatments (F5 = 0.8173, p = 0.5442; Figure 11).
Discussion
Overall, the addition of companion flower significantly increased the number of pollinators in citrus grove for the two years. In the peach orchard, the increase was only observed the first year. The increase of pollinators occurred mostly on the first row nearby the windbreak and decreased on the 3rd and 6th row. Flower strips (purple coneflowers and blanket flowers) provided the most increase in pollinator visit as compared to bushes or vine. Interestingly, wildflowers also provided interesting attraction to pollinators. We noticed that Spanish needle (Bidens alba), Florida pusley (two wildflowers usually considered as ‘weeds) and coreopsis significantly increased the number of visitors as compared to control. Another wildflower, sometimes considered as weed, lantana was characterized by a particular high amount of nectar per flower and could be investigated as future addition to enhance beneficial insects in fruit orchards. The groups of beneficial insects that increase the most were wild bees (Hymenoptera), ladybeetles (coleoptera), and also syrphid (Diptera). Interestingly ladybeetles and syrphid are both predators of Asian citrus psyllids and aphids and could also serve as biological control agents in citrus groves.
Education
While this was a research project, we have interacted with many growers in Florida and Georgia in the last three years. First, we provided information to the growers regarding windbreak conservation, floral resource enhancement, and pollinator conservation directly during visits and consultations with growers. In addition, in order to reach a larger audience, we published articles in professional magazines such as Cold Hardy Citrus Connection and Citrus Industry. These journals are read by citrus growers in Florida and Georgia. We organized field days and workshops directly with growers and we provided an In-Service Training to extension agents in order to educate them on windbreak and natural enemy conservation in citrus groves.
Educational & Outreach Activities
Participation Summary:
- One educational document titled "Artificial border fencing and live windbreaks for ACP management" has been published in the snapshots of the University of California extension. https://ucanr.edu/sites/scienceforcitrushealth/Research_Snapshots/S%C3%A9tamou/
- One online In Service Training has been organized for extension agents regarding management of citrus pests:
- Martini X., Diepenbrock L. In Service Training. Identification and Management of Major citrus Pests. Cold Hardy Citrus Management In Service Training. February 11, 2021. 22 attendees.
- Press articles. All are professional magazines read by citrus growers in Florida and Georgia.
- Sprague D, Martini X (2021) Scout for scale early this spring. Cold Hardy Citrus Connection. 2: 1-3
- Martini X, Sprague D. (2021) Control methods for the major insect pests of Cold Hardy citrus. Citrus Industry. 102: 20-23.
- Martini X, (2021) SSARE Grant Funded: Increasing Natural Enemies in Citrus. Cold Hardy Citrus Connection. 1: 12.
- Chuang, A. & L. M. Diepenbrock. (2022). Blanket flower plantings increase arthropod predators and pollinators in citrus groves. Citrus Industry Magazine. https://citrusindustry.net/2023/01/09/blanket-flowers-increase-arthropod-predators-and-pollinators-in-citrus-groves/
- Online articles
-
Martini X. (2022) Wildflowers may benefit citrus groves. Citrus Industry news. https://citrusindustry.net/2022/07/12/wildflowers-may-benefit-citrus-groves/
-
- Extension article
- Martini X, Price J. (2022) Citrus Pest Quick Guide : California Red Scale (Aonidiella aurantii). EDIS UF/IFAS Extension. #ENY2092
- Martini X, Burrow JD, Ray KL, Diepenbrock LM. (2022) Citrus pest quick guide: citrus whitefly. EDIS UF/IFAS Extension. #ENY20367
- Field day
- Citrus Health forum - Lake Alfred, FL - Approximately 120 participants
- Oral presentations (Extension)
-
Chuang, A. (2023). Increasing pollinators and natural enemies in groves through the addition of flowering strips, Citrus Health Forum, UF North Florida Research and Education Center, Quincy, FL
-
Chuang, A. (2023). Improving habitats for citrus grove predators, Citrus Insect, Mite, and Nematode Workshop, UF CREC, Lake Alfred, FL
-
Chuang, A. (2023). Arthropods in a changing world: responses to and impacts on humans and our environment. Kalamazoo College, Kalamazoo, MI, USA. Seminar.
-
Brett R. Blaauw. Project Updates and Management Strategies for San Jose Scale & Peach Tree Borers. 2023 Middle Georgia Peach Update. February 7, 2023, Fort Valley, GA.
-
Brett R. Blaauw. Project Updates and Alternatives to Lorsban. 2022 Middle Georgia Peach Update. February 3, 2022, Fort Valley, GA.
-
- Oral presentations (Scientific conferences)
-
Chuang A, Martini X, Mallinger R, Blaauw BR, Knox G, Liesenfelt T, Harrison M, Diepenbrock L. Wildflower plantings increase citrus grove pollinators. 2022 ESA, ESC, and ESBC Joint Annual Meeting. Vancouver, BC. November 13-16, 2022.
- Exilien R, Martini X, Diepenbrock L, Malfa K, Chuang A. Manipulating plant-based resources can maximize pest management and pollination in citrus groves. Southeastern Branch of the Entomological Society of America. Little Rock AR. March 12-14, 2023
-
Tristen Dittman & Brett R. Blaauw. 2023. Enhancing hedgerow systems in fruit tree production to improve beneficial insect diversity and abundance. Georgia Entomological Society Annual Meeting. Helen, GA.
-
Tristen Dittman & Brett R. Blaauw. 2023. Enhancing hedgerow systems in fruit tree production to improve beneficial insect diversity and abundance. Entomological Society of America – Southeastern Branch Annual Meeting. Little Rock, Arkansas.
-
Tristen Dittman and Brett R. Blaauw. 2022. Enhancing hedgerow systems in fruit tree production to improve beneficial insect diversity and abundance. Entomological Society of America – Southeastern Branch Annual Meeting. San Juan, Puerto Rico
-
Learning Outcomes
One of our growers (Kim Jones from Florida Georgia Citrus), is planning to have a row of companion flowers (purple coneflowers, blanket flowers and coreopsis) along its windbreak. During the project Mr. Kim Jones found a lot of benefit of having companion flowers: increase of pollinators, slight increase in yield, and also better visual appeal. this is important as part of is funding are also from agrotourism with people visiting his farm and buying his products.
Increasing knowledge in how to use companion flowers to increase pollinators. 30 growers reported that they plan to implement companion flowers in their citrus grove to increase pollinators.
Project Outcomes
This project aimed to demonstrate the use of companion flower to increase beneficial insects. Several outcomes can be lited from this project that can support sustainable agriculture:
- By adding new flower resources and conserving wildflowers that bring the most benefit to pollinators in term of resources, our project will contribute to a better conservation of pollinator in citrus and peach groves. Through this project we can now recommend to growers which flowers to plant, and which wildflower to conserve to enhance pollinator populations in citrus and peach groves. We received good feedback from growers and know several who decided to plant companion flowers in their groves. If a suffisant number of flowers are maintain all season in the grove this could help support population on local pollinators.
- The second point that our study show is that some wildflowers that are sometimes considered as weeds (like Spanish needles, or Florida Pusley) are in fact very good ressource for pollinators. Conservation of those wildflowers can lead to an increase of biodiversity in the orchards, and less use of herbicides by the growers.
- For growers, having these companion flowers have multiple benefits: by increasing the pollinator visits they can increase their yield significantly, also the visual appealing of their operation. Some growers use agrotourism a significant source of income and having long line of companion flowers increase the esthetic of the grove and their touristic value.
For a grower that aims to add flower resource along the hedgerow, it is imperative to include the following parameters:
- Transplant should be from endemic species to avoid any further invasion of exotic species.
- It is important to consider the space needed to operate tractors and machinery.
- Companion flowers need to receive an adequate amount of water after transplant. Growers should plan for irrigation, or the transplant should be done during a time period when rainfall is expected.
- Blanket flowers, purple coneflowers were the flowers planted that gave the best results in term of pollinator attraction.
- Wildflowers proved to be very useful and should be conserved when possible.
- Wildflowers that were the most attractive to pollinators and should be conserved in priority are Coreopsis, Spanish needles (Bidens alba), Florida Pusley (Fig. 1).
