Progress report for LS24-397
Project Information
The constant use of chemical fertilizers reduces soil health and quality, which affects plant development, productivity, susceptibility to pests and diseases, and fruit quality. Despite the known benefits of cover crops, blueberry growers in the southeast have not yet incorporated them into their production systems. The goal of this project is to develop guidelines for the use of cover crops in blueberry production systems in Georgia. We visited farms and conducted meetings with our grower cooperators to identify cover crop species best suited for blueberry production. Thus, it was decided to test nine cover crops: clover crimson, hairy vetch, clover strawberry, clover white Dutch, Kentucky 31, wrens Abruzzi rye, Lolium multiflorum, Sudan grass, and black mustard. Soil samples were collected from farms to perform soil test analysis and quantify nitrification. The Holsey’s farm had high soil pH, thus, a proper amount of sulfur was applied to reduce pH. A greenhouse trial was established to determine the germination rate for each of the cover crops, using soil from the three farms. In the upcoming month, we are planning to plant the cover crops on the commercial farms. We will measure the impact of cover crops on soil quality and plant growth, yield, and weed. Additionally, we are planning to conduct the termination trials as proposed. We will measure the impact of cover crops on soil quality and plant growth, yield, and weed. Production costs will be quantified to develop a cost-effective analysis of the use of cover crops. The analysis will focus on the financial benefits obtained in terms of increased profits and quality of life of farmers in South Georgia. The analysis will allow us to identify the environmental and economic sustainability of using cover crops. We will work with the UGA extension and community organizations to promote the results of our research and the incorporation of cover crops in blueberry systems. We will develop workshops, field days, as well as agent and grower training materials. We expect that our collaboration with community organizations, and small and minority grower’s involvement, will ensure the adoption of cover crops by blueberry growers in the state of Georgia. Thus, a large number of blueberry producers will implement the use of cover crops, making the blueberry production system more sustainable.
Our overall objective is to incorporate cover crops in blueberry production systems. Our specific objectives include:
Objective 1. Identify suitable cover crops for blueberry production system in Georgia.
Objective 2. Develop the best management practices for the incorporation of cover crops in blueberry production system.
Objective 3. Determine the impact of cover crops in soil physicochemical properties.
Objective 4. Develop educational materials and promote the adoption of cover crops.
Cooperators
- - Producer
- - Producer
- - Producer
- - Producer
Research
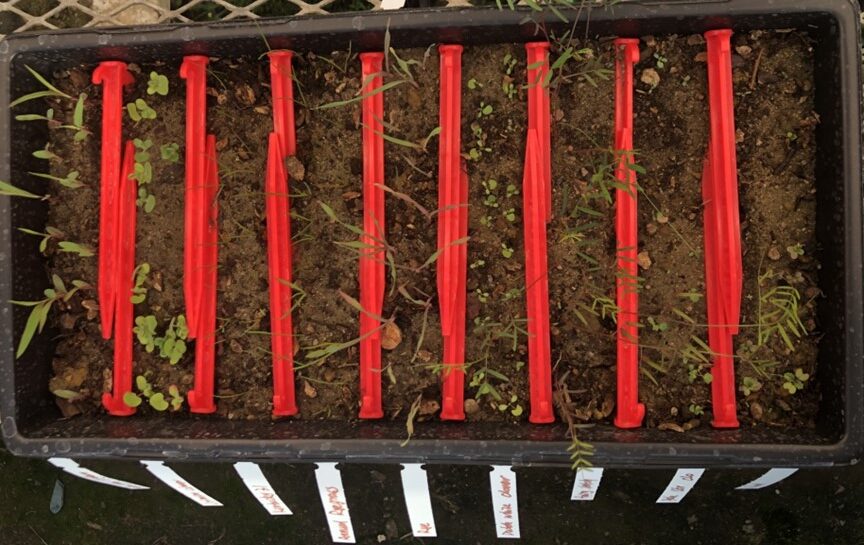
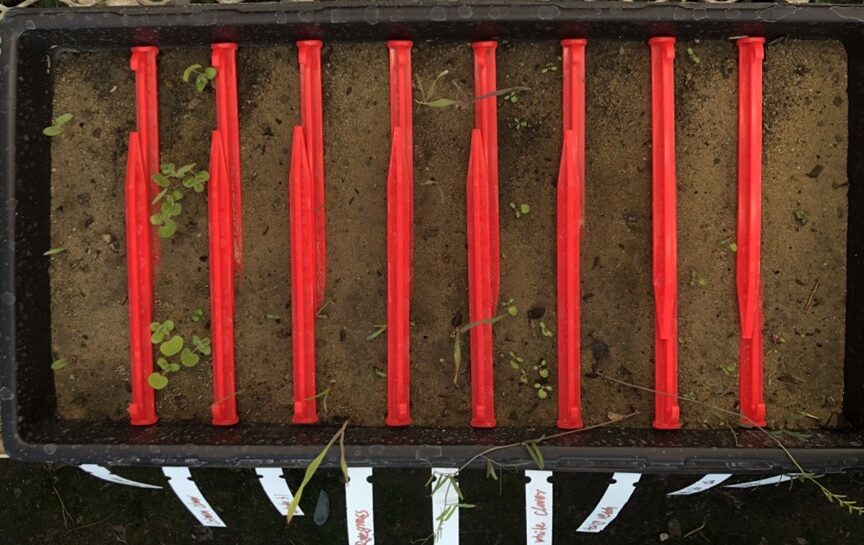
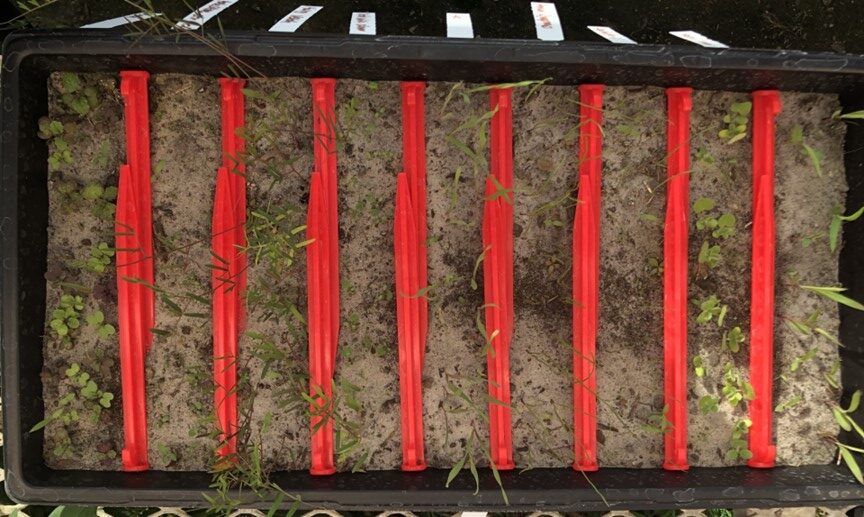
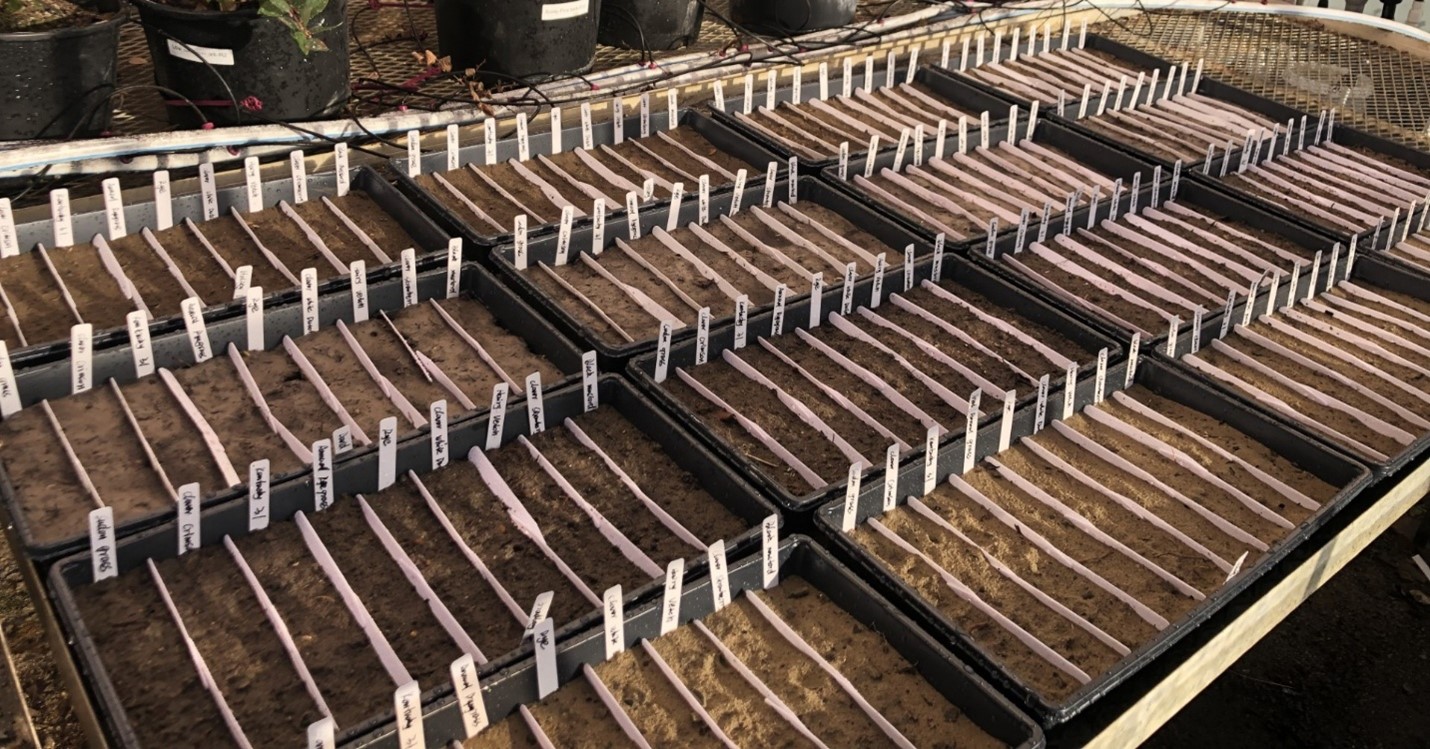
In October and November 2024, we met with cooperators to select the cover crops suitable for blueberry production. Nine cover crops were selected: crimson clover, hairy vetch, clover strawberry, clover white Dutch, Kentucky 31, Wrens Abruzzi rye, Lolium multiflorum, Sudan grass, and black mustard. Soil samples were taken from three commercial farms for soil nutrient analysis and a germination rate experiment. On November 12th, 2024, the germination test was established to test the germination rate of the nine cover crops selected using soil only from three farms located in Nahunta, Abbeville, and Pearson. The seeds were sown in a germination tray containing soil from each of the three farms ( Fig 1.). The germination trial was terminated on March 5th, using natural termination (incorporating the cover crop into to soil). Soil was analyzed after cover crop incorporation for soil organic carbon, nitrogen, phosphorus, potassium, and cation exchange capacity (results are pending). On February 24th, soil samples were re-taken to assess the soil pH at the farm located in Leesburg ( new blueberry farm). In addition, soil was used to establish a second greenhouse experiment on March 5th using soil from the same four farms (Fig. 2), to validate the germination rates using more replicates.
We communicated with growers and visited each of the farms involved in the study to decide if the cover crops would be placed in the row middle or on the raised-bed; we designed the experimental layout map layout for each of the farms accordingly. In Nahunta and Pearson, the soil samples were taken from the row middle and the raised bed.
In addition, as part of the project, soil samples were taken to conduct nitrification analysis.
Soil samples were collected from six blueberry farms in south Georgia (Table 1) in September 2024. The same sites were resampled in the spring of 2025 (February). These locations represent the major blueberry growing locations across the southern part of the state, wherein cultivation has been ongoing for over five years. All sites were chosen based on the type of blueberry grown: southern highbush blueberry. Four of the sites had the cultivar, Farthing, while the other two had Optimus. Soil samples were collected from four consecutive beds and the inter-plant zone at each location. A hand-held shovel or a post digger was used for obtaining the top 30 cm of soil at each site. Soil from within each farm site was pooled and homogenized. Subsequently, the soil was sieved using a 4 mm sieve and stored at room temperature with regular aeration by hand mixing.
Analyses of soil samples
Field moisture content was determined by weighing a sub-sample of each soil, drying and re-weighing. Soil water holding capacity was determined following saturation with water, drainage, and weight measurements. For the September 2024 collection date, the soil samples were analyzed at the University of Georgia, AESL lab. The analyses included texture analyses, pH, lime buffering capacity, organic matter concentration, soil nutrient concentration, total C, and total N measurements. Similar analyses of Spring 2025 collection date samples in currently underway.
Nitrification capacity of the blueberry cultivation soils was determined. Samples were re-wet to 50% water holding capacity. Sub-samples (300 g dry soil) from each site were transferred into 960 mL glass jars and subjected to one of two treatments. A. Control: no addition of N; B. N fertilization as [NH4)2SO4] at the rate of 6.35 mg/kg soil (n = 4). The samples were incubated at room temperature for around 100 d. Soil samples were collected from the jars at regular intervals by sampling 5 g of soil. The samples were extracted in 1M KCl by shaking for 30 min at room temperature. The KCl extractions were analyzed using the Timberline Ammonia Analyzer to determine NH4+ (ammonium) and NO3- (nitrate) concentrations. Nitrate concentrations were analyzed following reduction using zinc as a catalyst.
Table 1. Soil samples were collected from south Georgia Blueberry farms in September 2024.
|
Sample |
Location (GA) |
Cultivar grown (southern highbush blueberry) |
Initial moisture content (g g-1) |
Water holding capacity (100%; g g-1) |
|
A |
Pearson |
Farthing |
0.11 |
0.26 |
|
B |
Hoboken |
Farthing |
0.07 |
0.39 |
|
C |
Hoboken |
Optimus |
0.12 |
0.27 |
|
D |
Alma |
Farthing |
0.12 |
0.33 |
|
E |
Alma |
Optimus |
0.10 |
0.27 |
|
F |
Alma |
Farthing |
0.14 |
0.29 |
The soil texture of most farms is loamy sand, but the soil texture in Leesburg is Sandy loam ( Table 2). The soil from Pearson contains higher P and S contents than the soil from the other commercial farms. Based on the soil test report, the soil from Pearson had very high P and Fe contents, and low Mg and S content. The row-middle soil had higher nutrient contents than the raised-bed soil in Nahunta, which had high Fe content and low S content. The raised-bed soil had a low Ca concentration. The soil from Leesburg farm had high Ca concentration and soil pH, but S content was also found at a low level. However, the soil had higher nitrate-N than the soil from the other farms. The soil from the farm located in Abbeville had higher organic matter content, CEC, and Fe concentration, but low levels of K, Mg, and S (Table 3). Sulfur was incorporated into the soil at the Leesburg farm to reduce soil pH before planting blueberries and cover crops, soil pH and other soil properties were analyzed ( Table 4).
Sudan grass and clover strawberry had lower germination rates in the soil from the Nahunta farm, Lolium multiflorum, Wrens Abruzzi rye, and Black mustard had higher germination rates. In the soil from the Pearson farm, the overall germination rate of the nine cover crops was lower compared to the germination rates obtained using soil from the other commercial farms. Sudan grass, Hairy vetch, and Black mustard had lower germination rates. Clover white Dutch achieved the highest germination rate in the soil from Abbeville, while Black mustard showed the lowest germination rate (Table 5).
Table 2. Soil texture from each of the commercial farms.
|
Location |
Soil texture |
|
Nahunta |
Loamy sand |
|
Pearson |
Loamy sand |
|
Leesburg |
Sandy loam |
|
Abbeville |
Loamy sand |
Table 3. Initial soil test results from soil samples taken in November 2024 from the four commercial farms involved in the project. Soil used for the first germination trial.
|
Location |
P (lbs/a)
|
K (lbs/a)
|
|
Mg (lbs/a)
|
|
Ca (lbs/a)
|
pH
|
CEC (meq/100g)
|
BS-K (%)
|
BS-Mg (%)
|
BS-Ca (%)
|
BS-H (%)
|
S (lbs/a)
|
Fe (lbs/a)
|
OM (%)
|
NitN (ppm)
|
|
Nahunta plant bed |
22.73 |
27.45 |
|
75.00 |
|
329.45 |
4.61 |
5.97 |
0.59 |
5.20 |
13.80 |
80.41 |
3.45 |
89.64 |
1.70 |
0.17 |
|
Nahunta row middle |
37.96 |
62.13 |
|
85.29 |
|
747.25 |
5.14 |
6.24 |
1.29 |
5.75 |
29.67 |
63.28 |
5.96 |
108.50 |
1.72 |
0.57 |
|
Pearson plant bed |
250.50 |
73.58 |
|
44.08 |
|
433.33 |
4.59 |
4.52 |
2.07 |
3.97 |
23.66 |
70.29 |
4.50 |
85.08 |
0.64 |
0.10 |
|
Pearson row middle |
193.62 |
72.54 |
|
59.31 |
|
493.54 |
5.30 |
4.12 |
2.32 |
5.85 |
29.96 |
61.86 |
6.08 |
82.77 |
0.67 |
0.38 |
|
Leesburg |
119.00 |
109.00 |
|
97.00 |
|
1512.00 |
6.30 |
6.30 |
2.20 |
6.40 |
59.80 |
31.60 |
3.00 |
28.00 |
1.28 |
4.91 |
|
Abbeville |
91.00 |
46.25 |
|
74.92 |
|
665.17 |
4.73 |
6.79 |
0.86 |
4.27 |
23.38 |
71.48 |
3.75 |
100.58 |
2.02 |
1.23 |
CEC: Cation exchange capacity, BS-K: Base saturation-K, BS-Mg: Base saturation-Mg, BS-Ca: Base saturation-Ca, BS-H: Base saturation-H, OM: Organic matter, NitN: Nitrate-N.
Table 4. Soil test results from soil samples taken in February 24th, 2025 from the four commercial farms involved in the project. Soil used for the second germination trial.
|
Location |
P (lbs/a)
|
K (lbs/a)
|
Mg (lbs/a)
|
Ca (lbs/a)
|
pH
|
CEC (meq/100g)
|
BS-K (%)
|
BS-Mg (%)
|
BS-Ca (%)
|
BS-H (%)
|
S (lbs/a)
|
Fe (lbs/a)
|
OM (%)
|
NitN (ppm)
|
|
Nahunta |
18.67 |
33.33 |
34.67 |
201.67 |
5.57 |
2.03 |
2.13 |
7.20 |
25.13 |
65.53 |
14.67 |
52.00 |
0.55 |
1.41 |
|
Pearson |
76.33 |
31.33 |
22.67 |
204.67 |
4.47 |
1.83 |
2.20 |
5.10 |
27.67 |
65.00 |
20.33 |
67.00 |
0.54 |
1.20 |
|
Leesburg |
142.00 |
104.00 |
65.00 |
989.67 |
5.47 |
5.27 |
2.53 |
5.10 |
46.87 |
45.47 |
18.67 |
51.67 |
1.31 |
7.96 |
|
Abbeville |
136.67 |
43.67 |
46.67 |
458.00 |
4.93 |
3.93 |
1.40 |
4.97 |
29.07 |
64.57 |
52.67 |
202.67 |
1.30 |
3.38 |
Table 5. Germination rate of nine cover crops using soil from the three commercial farms involved in the project ( first germination trial).
|
Cover crops |
Nahunta (%) |
Pearson (%) |
Abbeville (%) |
|
Sudan grass |
56 |
8 |
48 |
|
Clover crimson |
70 |
36 |
64 |
|
Kentucky 31 |
86 |
32 |
76 |
|
Lolium multiflorum |
94 |
40 |
76 |
|
Wrens Abruzzi rye |
92 |
20 |
68 |
|
Clover white Dutch |
84 |
40 |
84 |
|
Hairy vetch |
84 |
8 |
60 |
|
clover strawberry |
58 |
20 |
52 |
|
Black mustard |
92 |
8 |
36 |
Soil samples collected from the blueberry cultivation sites in south GA were largely classified as Sandy soils or Sandy loam soils (Table 6). For samples collected in September 2024, the soils displayed pH with a range of 4.17 (E) to 5.29 (C) (Table 7). Initial organic matter ranged from around 1.2 % (C) to around 3.5% (D). The initial carbon concentration of the soils ranged from 0.6 % (C) to 2.1 % (D), while N concentration varied by about 3-fold from 0.033 % (C) to 0.097 % (F). Analyses of samples collected in Spring 2025 are currently underway.
Table 6. Soil texture analysis from soil samples collected in September 2024.
|
Sample |
Sand (%) |
Silt (%) |
Clay (%) |
Soil type |
|
A |
88.7 |
7.34 |
3.96 |
Sand |
|
B |
90.5 |
7.77 |
1.73 |
Sand |
|
C |
93.95 |
3.64 |
2.41 |
Sand |
|
D |
89.32 |
8.49 |
2.19 |
Sand |
|
E |
87.37 |
8.61 |
4.02 |
Sand |
|
F |
73.37 |
12.42 |
14.215 |
Sandy loam |
Table 7. Initial soil analyses for samples collected in September 2024
|
Sample |
pH |
Organic matter (%) |
Carbon (%) |
Nitrogen (%) |
Phosphorus (mg/kg) |
Potassium (mg/kg) |
|
A |
5.09 ± 0.2 |
1.87 ± 0.3 |
1.07 ± 0.3 |
0.07 ± 0.01 |
98.6 ± 9.0 |
35.3 ± 1.9 |
|
B |
5.20 ± 0.1 |
3.42 ± 0.3 |
2.06 ± 0.4 |
0.09 ± 0.02 |
33.6 ± 1.9 |
85.0 ± 5.2 |
|
C |
5.29 ± 0.1 |
1.23 ± 0.3 |
0.58 ± 0.2 |
0.03 ± 0.01 |
57.8 ± 7.3 |
15.5 ± 0.7 |
|
D |
4.18 ± 0.1 |
3.48 ± 0.1 |
2.13 ± 0.3 |
0.07 ± 0.01 |
7.68 ± 0.7 |
36.4 ± 1.0 |
|
E |
4.17 ± 0.0 |
2.31 ± 0.0 |
1.47 ± 0.1 |
0.06 ± 0.01 |
9.07 ± 2.2 |
36.1 ± 7.0 |
|
F |
4.29 ± 0.1 |
2.96 ± 0.6 |
1.83 ± 0.3 |
0.10 ± 0.01 |
57.0 ± 6.0 |
65.1 ± 4.4 |
Nitrification analyses:
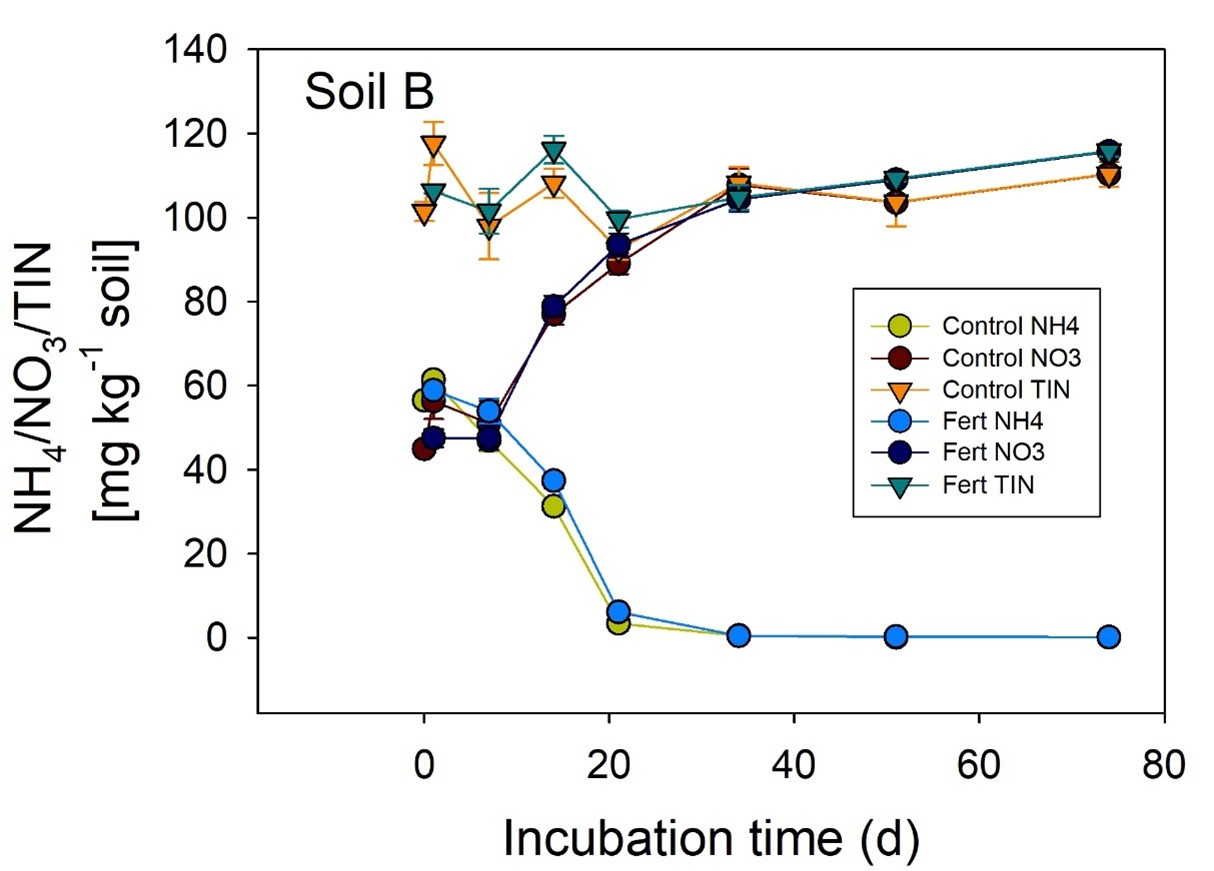
Analysis of net nitrification indicated that all blueberry soils displayed nitrification capacity. An example of net nitrification analysis is presented in Figure 1 (Soil B). Total inorganic N (TIN) remained largely unchanged over the period of incubation in control and fertilizer-added samples. Ammonium (NH4) concentration in the samples declined steadily between 7 and 21 d of incubation. A complementary increase in nitrate (NO3) concentration was noted during the same period. These data indicate potential nitrification in blueberry cultivation soils even under acidic conditions.
Education
We met in person and online with grower cooperators to receive their input on what would be the ideal cover crop. In addition, Mr. David Lake provided empirical information on which of the cover crops performed well in his field. We met individually with growers in their farm, particularly with Mr. Holsey to guide him on the preparation of his field for blueberry production. The individual grower meeting took place in October and November, 2024.
Educational & Outreach Activities
Participation summary:
We visited each commercial farm in this study on October 16, 17, 24, 2024, and November 5, 2024. We are in constant communication with each of our grower cooperators,.
Learning Outcomes
cover crops
Soil health
Project Outcomes
We are still in the initial stages of the project, however, growers who are not participating in the study are interested in the project and ask to be part of it.