Final report for ONC20-070
Project Information
Transportation is a major expenditure for small farmers in order to access markets. Farmers often transport goods in less-than-full truckloads and this inefficiency reduces farmer profitability and generates negative environmental externalities (asset underutilization). While shared transportation among farmers is one solution, accurately calculating marginal costs is too difficult for most farmers. Mainstream delivery companies do not calculate cost-sharing allocations or consider small farmers’ needs and vehicle requirements. The lack of scale-appropriate tools to measure and allocate transportation costs is a major barrier to collaboration and reduces farmer participation in shared transportation partnerships.
With participation from farmers and food hubs throughout Iowa and Minnesota, this project aims to develop an open-source, data-driven cost estimation tool to accurately estimate transportation costs and allocate those costs fairly among collaborators. Project partners will identify cost factors relevant to small farmers and the inputs necessary for accurate marginal cost calculation. A multicultural farmer collaboration will also identify potential barriers to tool implementation, accessibility and usability by non-native English speakers and farmers with little technology experience. Our goal is to encourage and increase farmer participation in shared transportation to reduce transportation-related costs and increase farmer profits.
- Conduct preliminary interviews with 4 farmers and 4 food hub managers in Iowa and Minnesota on cost factors of transportation and delivery.
- Develop a survey based on the initial interview feedback and partner with the food hub network to distribute the survey to at least 20 food hub farmer vendors.
- Use a mobile application to collect real-time data from farmers on fuel usage, vehicle maintenance, and other costs.
- Design a cost estimation tool based on the inputs gathered and validate tool’s accuracy by conducting usability studies and follow-up discussions with food hubs and farmers regarding implementation barriers.
Cooperators
- (Researcher)
- (Researcher)
- (Researcher)
Research
described in other sections of report.
described in education sections.
Educational & Outreach Activities
Participation summary:
During the first year of the project we have conducted 8 interviews with our food hub and farm project partners about their shipping and transportation operations. We conducted a survey of 24 additional farms and food hubs in Iowa and Minnesota. During the survey University of Minnesota and Iowa Valley RC&D published social media posts about the project. In February 2021 we hosted a meeting with Dr. Caroline Krejci at the University of Texas in Arlington. Dr. Krejcki's research time shared their work on a Southern SARE Research and Education project. Our two projects exchanged information about our projects and committed to meeting quarterly and involving future food hub networks from other parts of the Country. Dr. Mittal and Jason Grimm shared information about the project at the Great Plains Growers Conference in February 2021. Jason Grimm, shared information about the project and the survey with the Iowa Food Hub Managers Working Group.
Learning Outcomes
Project Outcomes
Iowa Valley RC&D and its research and farmer partners conducted in-depth interviews to understand transportation related challenges for farmers and food hubs. Three farmers (Wallace Farms, Organic Greens, Cala Farms) and five food hubs (FarmTable Delivery, Good Acre, North Iowa Fresh, Sprout, Shared Ground Farmers Cooperative) from Iowa and Minnesota participated in the interview. Project research identified challenges that are impacting economic, environmental and social sustainability aspects of individual farms and the regional food system.
Major challenges identified for farmers included:
Economic
- Farmers identify they lack time and knowledge to adequately determine delivery costs involved in making deliveries so that they can appropriately allocate costs to their customers.
Environmental
- Many farmers expressed they lack storage on their farm resulting in immediate transportation of produce upon harvest due to food safety reasons and loss of product.
Social
- Farmers shared that they struggle to find someone who is trustworthy to drive for them so that they can focus more on on-farm operations and scale their businesses.
Major challenges identified for food hubs included:
Economic
- Food hubs identified the high operating cost of their trucks due to less-than truckload deliveries (two of the five hubs have rented to avoid any maintenance expenditures).
- Food hubs identified frequent truck breakdowns/reliability of truck creating additional costs.
Environmental
- Many food hubs expressed they often made deliveries when their trucks were not full and were an inefficient use of fuel.
- Food hubs expressed the need for refrigeration on delivery vehicles to reduce waste and maintain product quality during transportation.
Social
- Driver burn out created social impacts on the food hub business owners and the families involved.
Two of the three farmers who were interviewed and multiple farmers selling through the three food hubs had participated in shared transportation on an informal basis, however, they expressed willingness to collaborate with other farmers in a formal system which benefits all the participants.
Based on the inputs from the preliminary interviews, a survey was rolled out to a larger group of farmers for understanding their current transportation related challenges, their willingness to participate in transportation collaboration, and challenges and benefits of transportation collaboration.
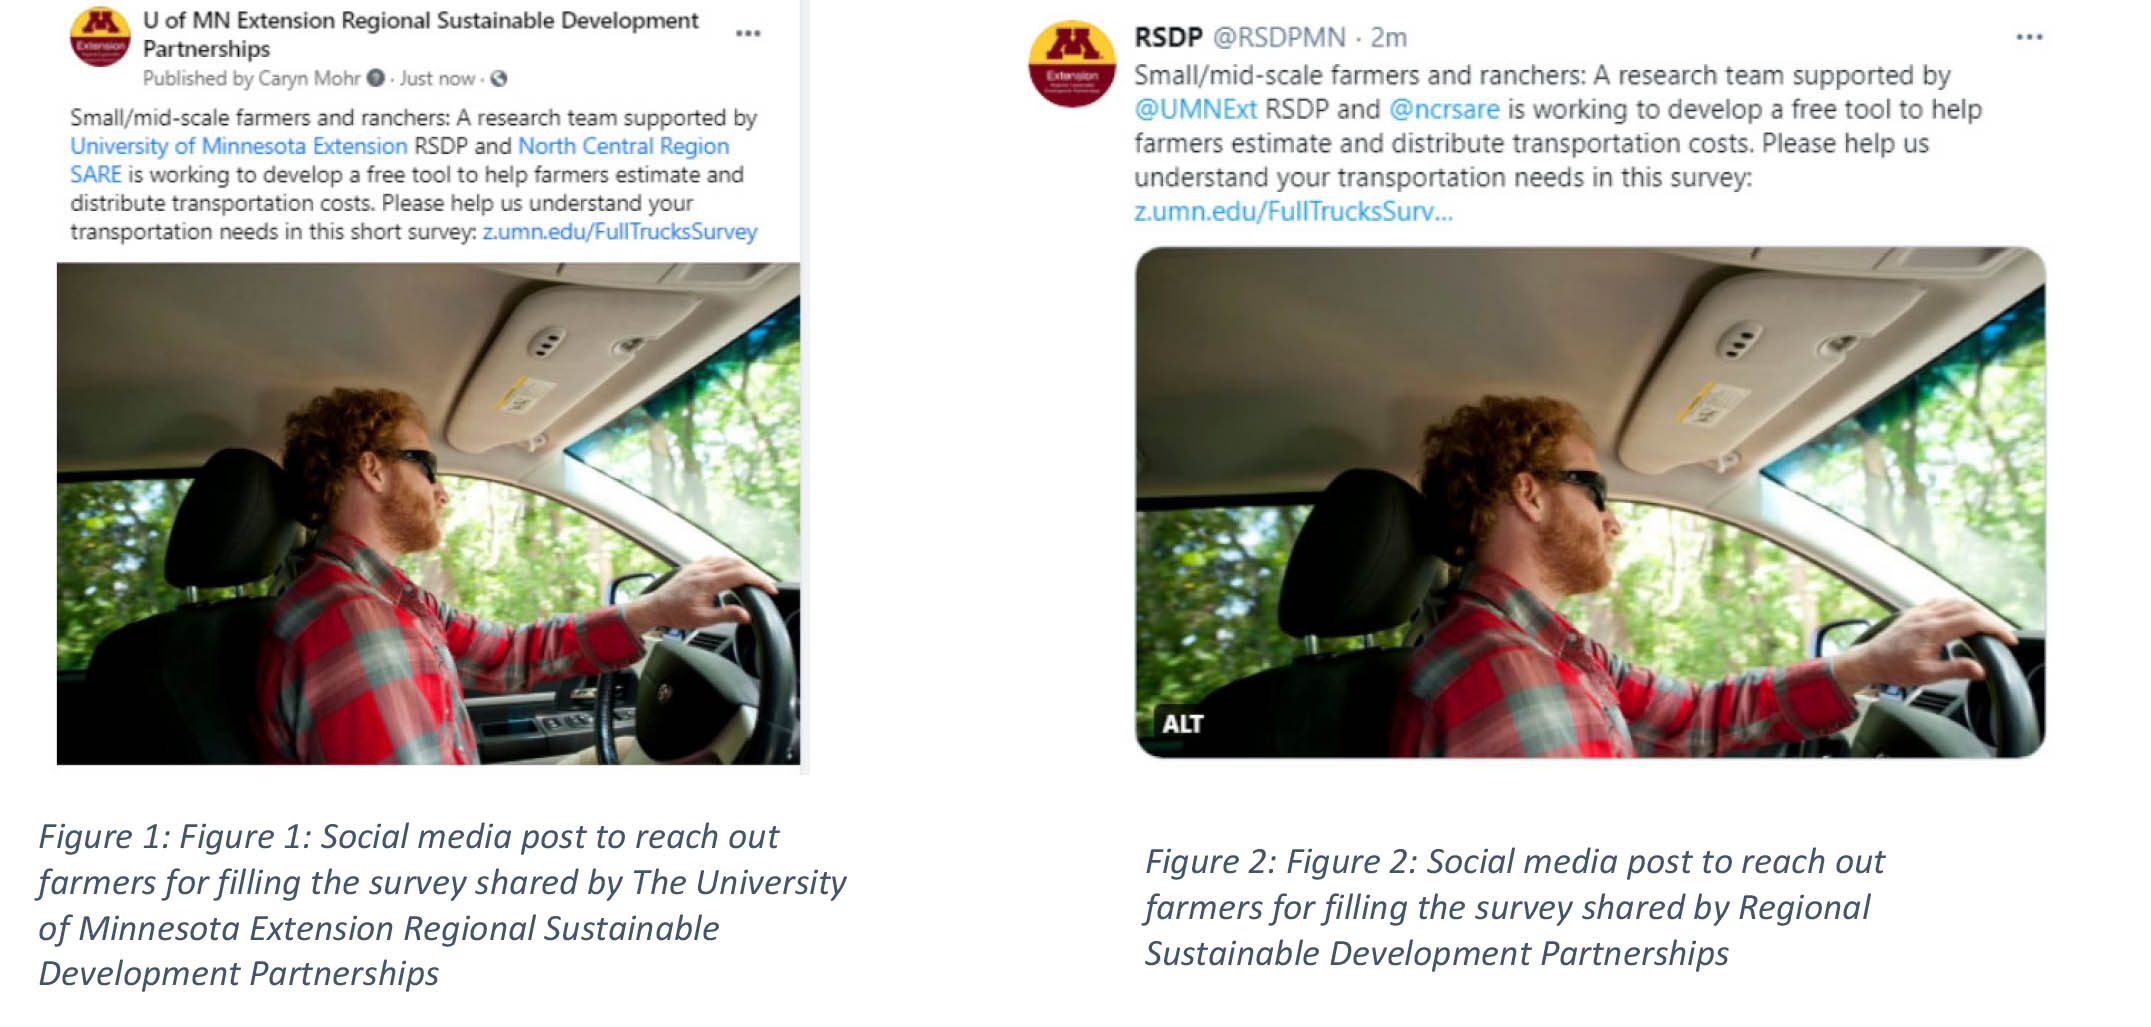
The survey was rolled out by Iowa Valley RC&D, The University of Minnesota Extension, and all the participating food hubs to their farmer vendors. Multiple listservs were used to reach a greater number of participants including Sustainable Ag Events and Jobs Listserv and Practical Farmers of Iowa Listserv. The survey link was also published and promoted through various social media channels as shown in the below snapshots (Figure 1 and Figure 2).
 A total of 32 farmers across Iowa and Minnesota participated in the survey. Around 77% of the farmers mentioned that they provide transportation services to their customers with around 60% of them spending up to 5 hours on transportation each week. Most of the farmers are at 80-100% vehicle capacity during peak season and at around 20-40% capacity during the non-peak season. Also, the majority of the farmers who did their own transportation did not pay themselves for the cost involved.
The survey revealed several obstacles for farmers to participate in transportation collaboration. A lack of trust between potential partners can be the most difficult impediment to overcome because farmers will need to share sensitive information with each other during the collaboration process. Farmers are concerned about losing autonomy over their products and depending on others can be too risky, especially with the possibility of incorrect or late shipments. Farmers are also hesitant to collaborate because they do not want to sacrifice the customer interactions that they gain from making their own deliveries. Transportation collaboration may also require a large investment of time in order to establish a partnership. The farmers’ lack of time and inability to see the overall benefits of collaboration hinder their desire to collaborate at all. Additional costs that appear in the short run from transportation collaboration also makes farmers hesitant to pursue collaboration. SWOT analysis of the survey results based on the perception of farmers on transportation collaboration is presented in Appendix 1 of this report.
Despite the challenges identified by farmers for collaboration, 12 farmers mentioned they collaborate with other farmers on transportation. Only 10% of the farmers responded that they do not perceive the benefits of transportation collaboration. The major benefits for transportation collaboration perceived included reducing transportation costs (20 respondents), time savings (20 respondents), leads for other potential collaboration such as bulk orders (14 respondents), and labor savings (13 respondents).
The preliminary interviews and survey done with the farmers helped identify the importance of transportation collaboration among farmers. In addition, some farmers aggregate products from multiple other farmers and sell to either retail or wholesale customers. In particular for these farmers, transportation cost becomes an important part of the total aggregating cost and splitting fairly among the farmers becomes critical. Therefore, to scale the collaboration and make it work sustainably between the farmers, the cost of collaboration should be fairly allocated between the participating members.
In the second phase of the project the research team wanted to develop a tool to help farmers and food hubs determine the costs of distribution so that the costs could be shared with all the members collaborating on transportation. To achieve this objective in the project, a tool based on Google Spreadsheet was developed to allow farmers to split the transportation cost when collaborating with other farmers. The Shapley Value algorithm based on the concept of game theory, was used to allocate cost between the participating members in a collaborative network. Shapley Value method allocates cost corresponding to the average marginal cost of a customer. The marginal cost for a particular customer can be obtained by looking at the costs of all collaborations without the customer and observing the change in cost after adding the customer. For example, suppose Farmer A is providing hauling service to Farmer B and Farmer C. Therefore, considering Farmer B and Farmer C, Farmer A could be involved in three possible collaborations:
1) Farmer B and Farmer C
2) Farmer B
3) Farmer C
Suppose the total cost to haul products for Farmer B and Farmer C is $40, for Farmer B alone is $25, and for Farmer C alone is $30. Then average marginal cost for Farmer B will be ($40 + $25 - $30)/2 = $17.5. Similarly, average marginal cost for Farmer C will be ($40 + $30 - $25)/2 = $22.5. Therefore, Farmer A should charge $17.5 from Farmer B and $22.5 from Farmer C when he is hauling for both of them together.
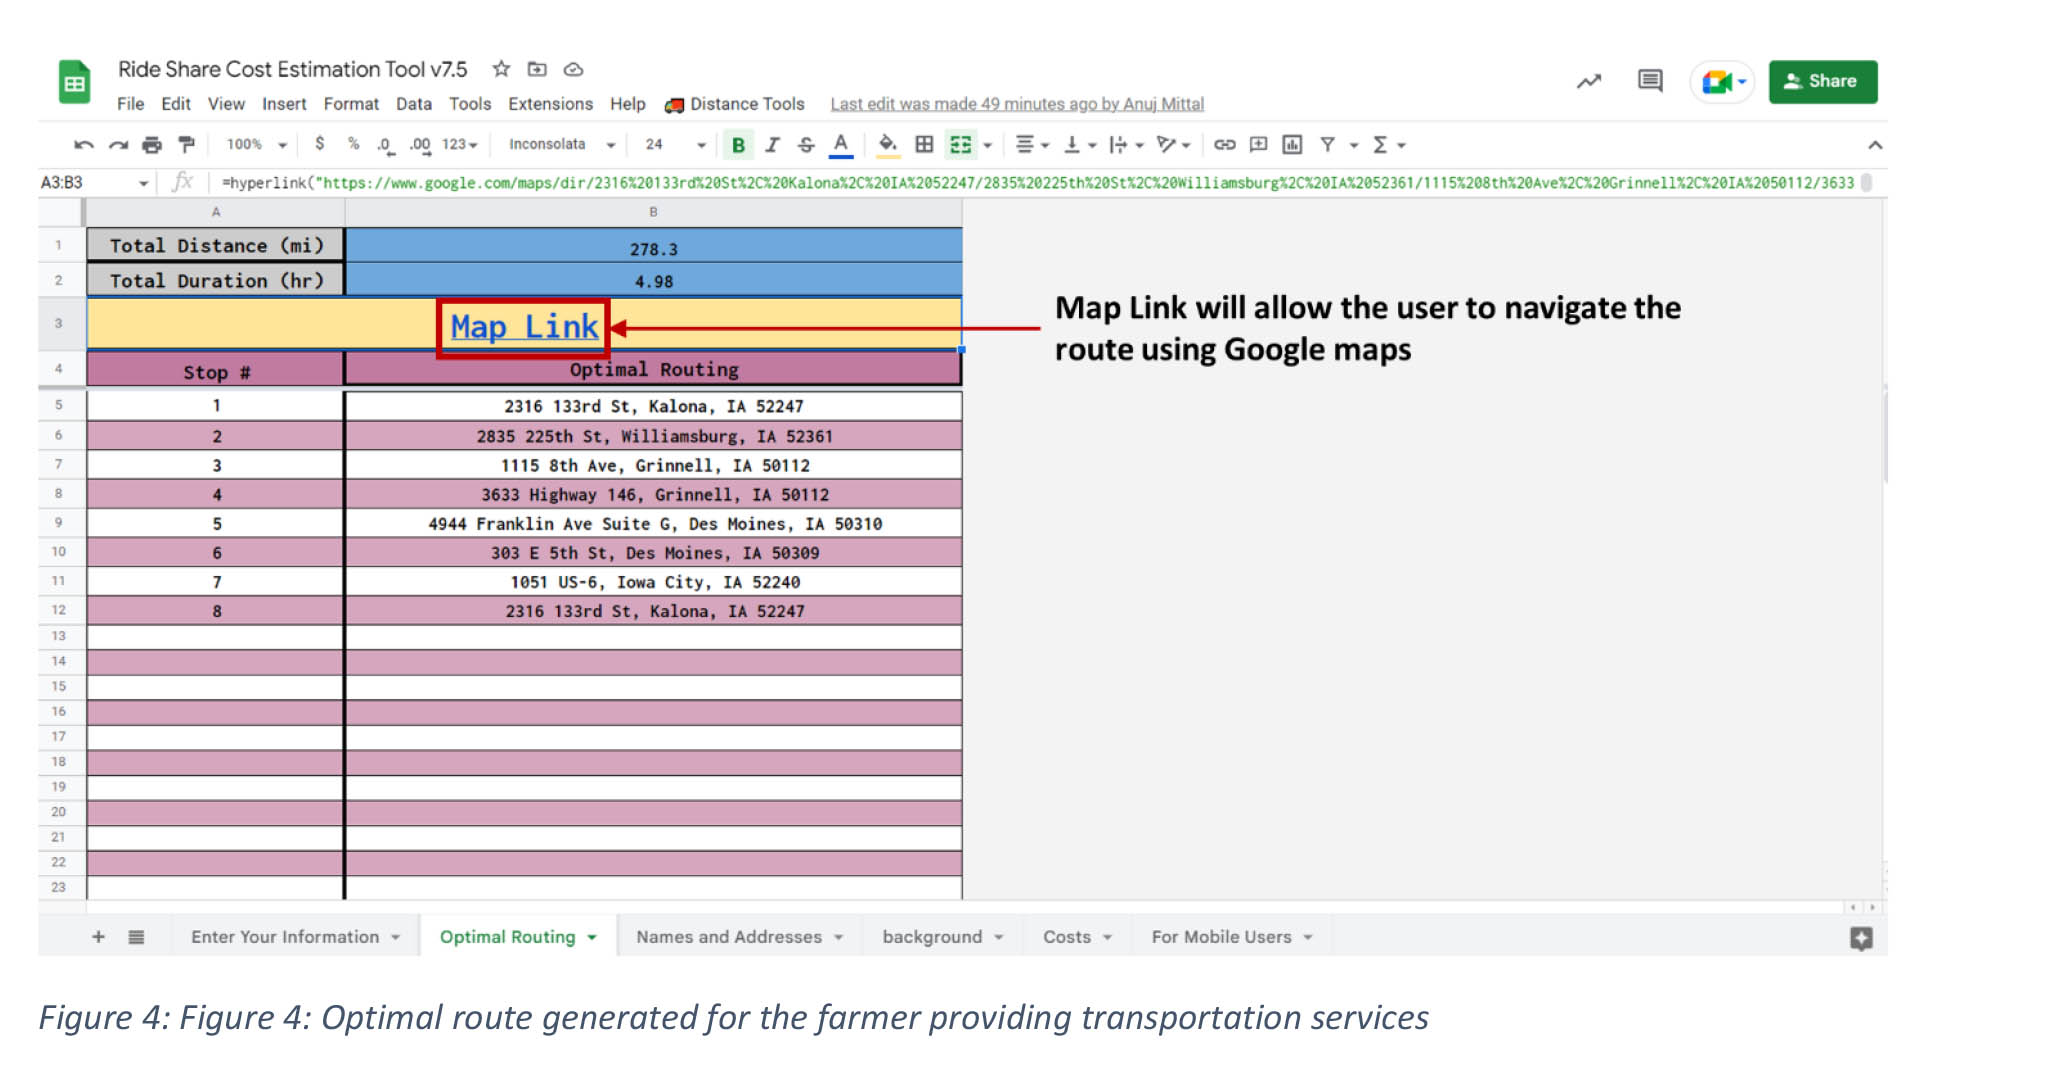
The spreadsheet-based tool first allows farmers to enter the pick-up and drop-off locations of all the farmers where he/she needs to visit as shown in Figure 3. If a particular farmer has multiple pick-ups or drop-offs, each will need to be entered as a separate entry. Also, if a farmer drops off its own product, an entry needs to be made for his/her products in the spreadsheet also. Upon entering all the pick-up and drop-off locations, ‘Find Optimal Route’ button on the top will help find the optimal route satisfying the constraint that for a particular drop-off, pick-up needs to happen first.
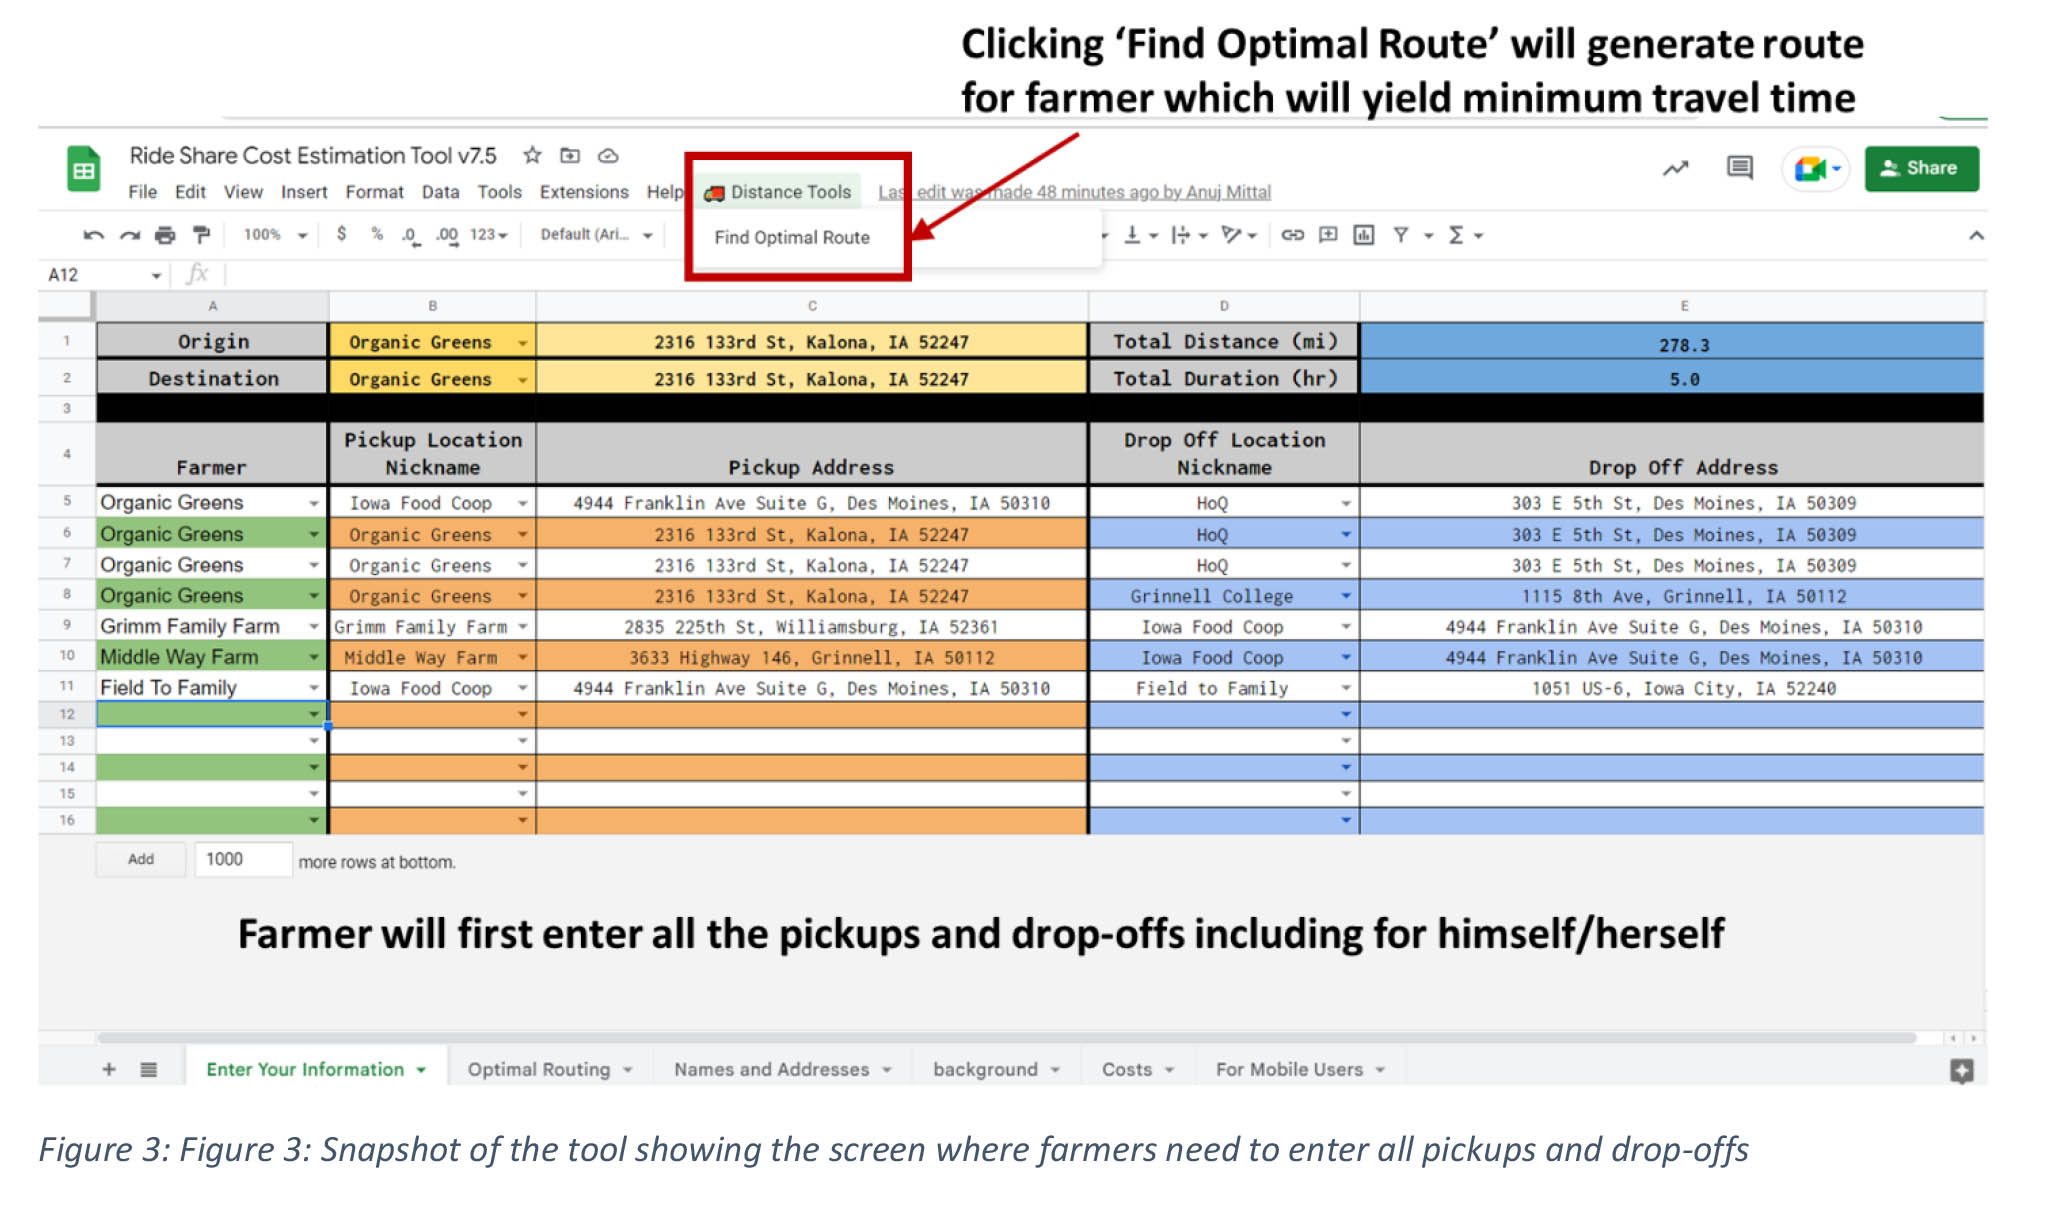
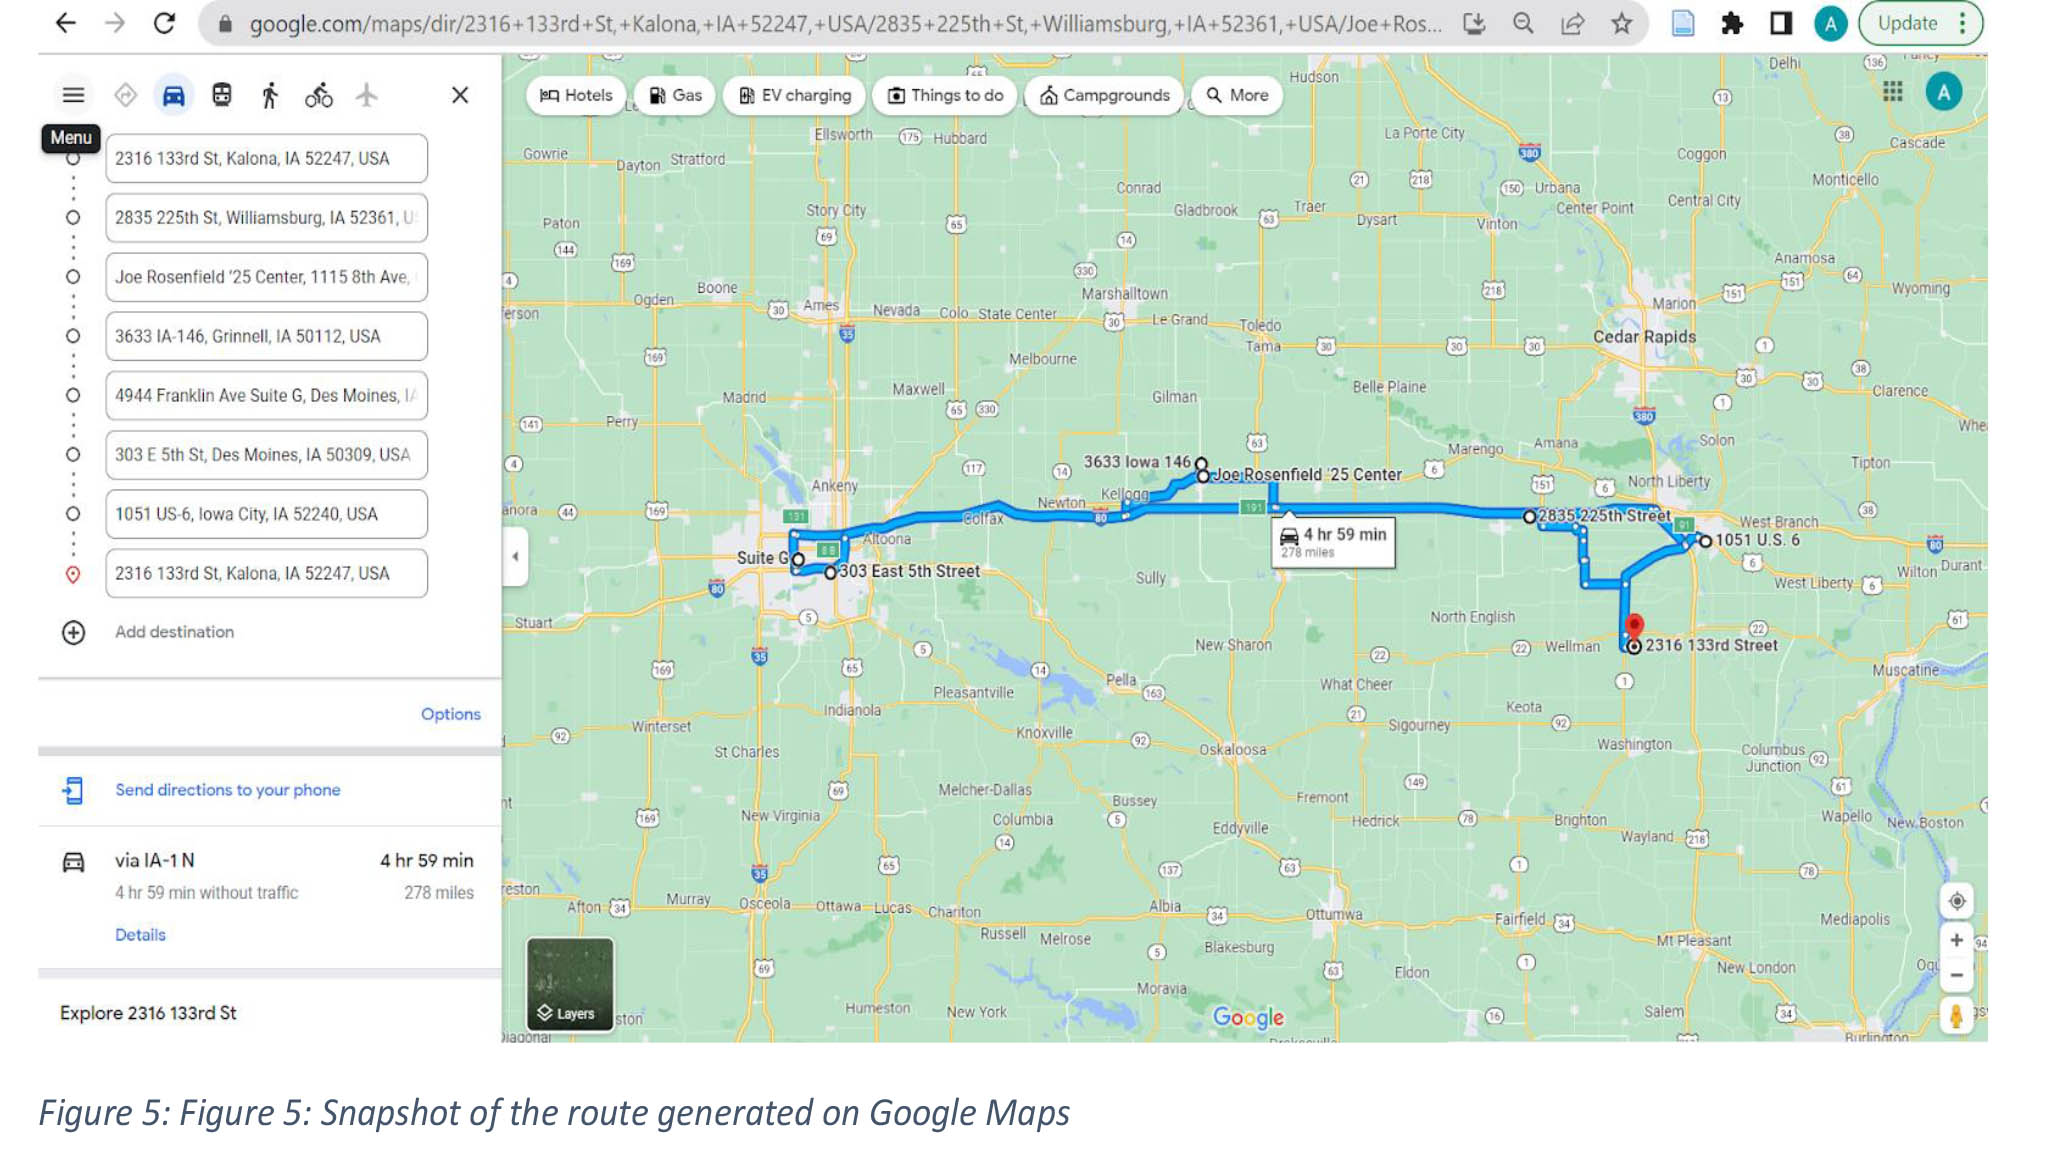
Figure 4 shows the optimal route that the farmer needs to take along with a link to the Google map which helps in navigating the route stop-after-stop. Figure 5 shows the navigation route in Google Maps.
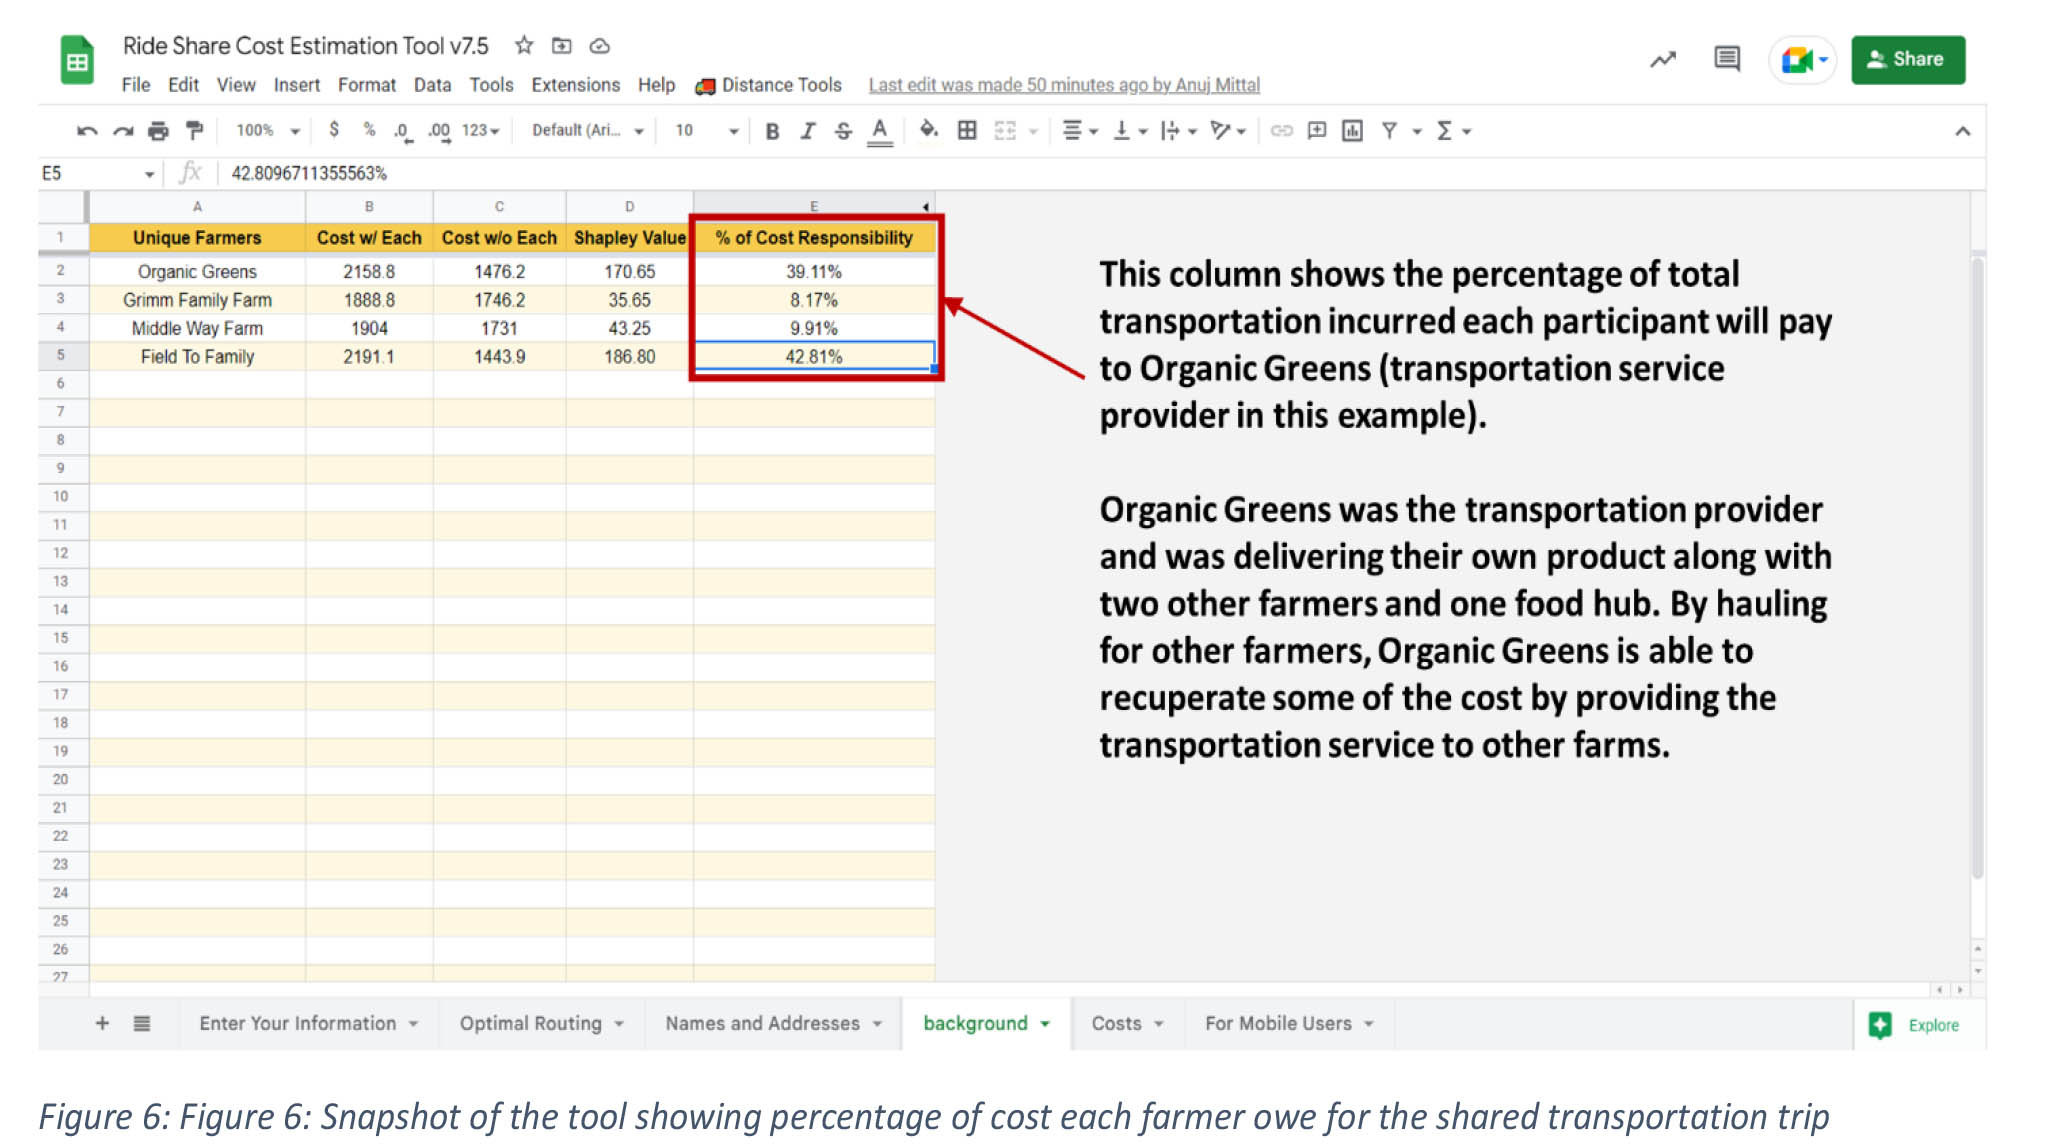
The tool also allows farmers to split the transportation cost based on the Shapley Value algorithm as described above. Figure 6 shows the percentage of total cost each farmer owes to Organic Greens who is the transportation service provider in the test use case.
The above tool can not only be used by farmers but also by any other participant types for example, food hubs, who collaborate with other food hubs on transportation. For example, in the Iowa Food Hub Network, multiple food hubs collaborate with each other to reduce the overall transportation cost. More details on the Iowa Food Hub network can be found here: https://sites.google.com/site/ifhnetwork/
A short video of the tool can be accessed using this link. The most recent version of the tool will be available on the Iowa Valley RC&D website at the project webpage: https://iowavalleyrcd.org/rftransnetwork/
Iowa Valley RC&D and their project partners believe that shared transportation collaborations can help improve the sustainability of farms and food hubs in the regional food system. With the assistance of the google spreadsheet tool it will help to fairly determine the cost of delivery so that the costs can be shared between collaborators and help reduce burnout of farms or food hubs who provide these services to others. Shared transportation will allow farms to spend more time on their farms and produce more products or improve other inefficiencies. Shared transportation will also help food hubs and farms fill their delivery vehicles to capacity each week so that fossil fuel efficiency is increased. Long term social sustainability will take longer to develop with shared transportation collaborations. New collaborations though have the opportunity to develop more trust amongst partners because costs can be shared fairly and new partnerships can form to develop deeper relationships between collaborators. These deeper relationships have the opportunity to create support structures when in tough times another partner can support someone struggling; leading to sustainability of the whole network instead of just individuals.
Appendix 1
We distributed a survey to farmers in Iowa and Minnesota in winter 2021. The survey was distributed online via Qualtrics. 32 farmers responded to the survey. The survey results were analyzed to understand how farmers perceived transportation collaboration as strengths, weaknesses, opportunities, and threats (SWOT analysis).
Strengths
The survey revealed that farmers have certain strengths which could increase their desirability for transportation collaboration.
Most farmers provide transportation so they could potentially have a need and desire for collaboration. 24 out of 32 farmers currently provide transportation for delivering products to their customers. 21 of those 24 farmers said that either they or members of their family make deliveries. 21 farmers own their own delivery vehicle, which indicates they have maintenance expenses. Only 2 rent their delivery vehicles. 17 farmers use a pick-up truck, and 10 farmers use some type of a van. 5 farmers have a box truck.
Only 5 out of 23 farmers add a transportation fee to their deliveries and most of these are a low cost. 12 out of 22 farmers have a minimum quantity before making a delivery, and these minimums range from $50 to $250.
Many farmers already collaborate with other farmers. 12 out of 27 farmers collaborate with other farmers. 9 farmers aggregate products at their farms; 6 aggregate products from their farms at another farm; and 14 farmers do not aggregate. One farmer said that he/she is interested in providing transportation and distribution for products from more farmers.
Weaknesses
The weaknesses that could inhibit more collaboration revolve around the challenges of collaboration. Some farmers require refrigeration, which might make collaboration more difficult.
Farmers also recognize several challenges to transportation collaboration. The survey listed 5 potential challenges, and each challenge received at least 9 farmers agreeing with the statement. The challenges include: a lack of customer interaction, concern over products being delivered correctly, lack of similar farms in the area available for collaboration, extra time involved in collaboration, and extra costs involved in collaboration. Farmers suggested other challenges such as timing and schedule issues, cross contamination, insurance, and other regulations that may be unknown.
When we asked for open-ended comments about transportation collaboration, one lamb farmer explained that he/she reached out to others to wholesale his/her products to them, and they could do a retail markup, but there was not much interest in that kind of collaboration.
Some farmers have refrigeration requirements for products while in transit. This could make transportation collaboration more difficult. 5 require refrigeration, 2 require a freezer, and 8 use coolers or insulated containers. 7 out of 22 farmers answered that their vehicles have refrigeration capability. 8 farmers answered that no temperature controls were required.
Transportation collaboration may require that the correct type of equipment is available. Although 12 farmers do not use equipment for making deliveries, 8 farmers use a dolly, 6 use a hand cart, 4 use a pallet jack, and 1 uses a lift gate.
The farmers in the survey do not generally have very sophisticated methods for tracking their time or expenses for transportation if they track them at all. 10 out of 23 farmers do not track transportation costs and time. 5 of them use paper logs, 4 use Microsoft Excel, and 4 use QuickBooks or another accounting application. Due to this lack of tracking, farmers may not truly understand how much they are spending in terms of time and money on transportation.
Opportunities
Farmers realize that they can achieve a lot of benefits from transportation collaboration. The survey listed 4 potential benefits of transportation collaboration, and each benefit received at least 13 positive agreements from the farmers. These benefits are: reducing transportation costs, saving time, saving labor costs, and leading to other types of collaboration. Two other farmers wrote that transportation collaboration could help them reach more or different customers. Only 3 farmers did not see any benefits of collaboration.
No consensus exists among the survey respondents on the ideal numbers of farmers in collaboration. 11 believe 2-4 farmers in collaboration was ideal, 8 believe 5-7 farmers in collaboration was ideal, and 3 believe 8 or more farmers in collaboration was ideal.
During the non-peak season, the farmers’ vehicles are not very full, which suggests they might have the ability to collaborate more. 14 out of 17 farmers’ vehicles are less than 50% full during non-peak season. In the open-ended comments, a couple of farmers explained that climate change and the COVID-19 pandemic restrictions have made it more difficult to send full trucks with produce, especially to warehouses in cities. The COVID pandemic inspired some of the survey respondents to make more home deliveries.
Threats
Threats are external elements that may make it more difficult or challenging for farmers to collaborate.
Most farmers do not spend a large amount of time driving in support of farm operations, and 11 out of 22 farmers estimated that they spend less than 5 hours per week, and 5 estimated that they spend between 5 and 10 hours per week. However, 6 farmers spent 15 hours or more driving. The number of days that each farmer makes deliveries is quite variable and also depends on the season. One farmer makes deliveries in 5 or more days of the week in the summer and fall. 2-6 farmers make deliveries on 3 or 4 days, depending on the season. 2-7 farmers make deliveries on 2 days, and 7-12 farmers make deliveries on 1 day.
During the peak season, many farmers’ vehicles are very full, which may indicate an obstacle to transportation collaboration because farmers are not traveling much with less-than-truckloads full. 14 out of 23 farmers have trucks that are 70% or more full during peak season.
The farmers in the survey expressed virtually no desire to pursue opportunities with 3rd party logistic (3PL) providers. Only one farmer chose to respond to the question about the benefits of using a 3PL, and it would reduce the fatigue of managing transportation. In terms of challenges of using a 3PL, most of the farmers selected multiple challenges with the top challenges identified as: lack of customer interaction; not appropriately scaled for small farms; concern over products being delivered correctly; and high delivery cost of a 3PL.
The Goggle Spreadsheet Cost Allocation tool developed as part of this project has just begun to be used among 4 food hubs who are collaborating on transportation in Iowa. Two Iowa Specialty Crop Block Grants are assisting with trucking costs and the cost to establish aggregation nodes in Iowa. Weekly, four food hubs are sharing inventory with each other. The four food hubs are purchasing from each other and two food hubs are providing delivery services to participants in the network. Real time cost tracking along with the Cost Allocation Google Spreadsheet have assisted in fairly invoicing all partners involved with their part of the delivery cost.
The research team during the project tenure identified that there are a lack of supporting apps out there to allow farmers to outsource transportation services. The project investigators worked with a research team at The University of Texas at Arlington on a project sponsored by Southern SARE to identify whether the current crowd-shipping apps would be suitable for farmers to outsource transportation services. A total of 400 apps were evaluated for farmer suitability by requesting quotes for delivery service from each app, based on typical shipping requirements of two farmers in Texas. The responses and quotes that were received, as well as feedback from the two case study farmers, indicate that most existing platforms are unlikely to meet the needs of farmers to outsource transportation. The platforms are not built for small - medium farms and typically were not built for perishable/frozen goods. The shipping estimates were very expensive. However, considering the farmers interest in outsourcing transportation to other farmers, a tech enabled solution/an app tailored to the specific needs of farmers would help farmers address some of their transportation-related challenges. Future funding or studies could assist with developing a software or app (like Uber or Lift) but for farmers to schedule deliveries that could be done by other farmers, food hubs or individual entrepreneurs.