Final Report for ONE11-145
Project Information
This project worked with four case study farms to identify and develop a means of marketing channel performance assessment for livestock producers. Farmers have many marketing opportunities, from direct marketing such as farmers’ markets to wholesale such as restaurants or commodity markets. Many farms are operating in multiple channels but lack the record keeping or means of analysis to gauge which channels are working best and which should be discontinued. Through case study work and data collection trials we were able to develop a programmed Excel spreadsheet that requires minimal record keeping for short, “snapshot” time periods but still provides valuable decision making information for producers. In addition, the project resulted in a tool that aids farmers in developing pricing for each cut of meat that ensures profitability in a given channel.
Introduction:
This project was pursued due to the success I experienced with the original Marketing Channel Assessment Tool (MCAT) which I developed for use with fresh fruit and vegetable farms. Using MCAT, a simple data collection process leads to meaningful conclusions for small farms for evaluating their current marketing channel utilization and planning improvements. The idea behind this project was to develop a similar data collection methodology that would work for farms marketing livestock products including meat and cheese. What we found is that since livestock products are fundamentally different in perish-ability and the nature of product volume, the farm strategy is less about channel selection than about price and inventory management. This outcome came as a bit of a surprise. Some degree of strategic channel selection is still an important part of improving the efficiency of marketing labor, however, more than with vegetables, we found that livestock farms can utilize the price of individual products to improve channel performance. A marketing channel assessment tool was developed for use by livestock producers which ranks the performance of their channels for 6 performance factors, using 7 measurements. The measurements are: amount of marketing labor required, risk, sales volume, lifestyle preferences, price, demand for entire carcasses, and degree of whole carcass demand.
Develop a simple data collection and analysis system for use by livestock farmers to evaluate the relative performance of the various marketing channels they utilize: As a result of this project, I have developed a “beta” version of the Livestock Marketing Channel Assessment Tool (LMCAT) which includes a programmed Excel spreadsheet and easy-to-use data collection forms. There were factors, explained throughout this report, which complicated the development of the tool and the logic of what data to track. These factors were anticipated, and did slow the development of the tool, however, I feel they were overcome, resulting in a useful tool which compares marketing channel performance and includes a component to aid producers in developing pricing for individual cuts. Simplicity was achieved since minimal record keeping is required to use the tool, and record keeping is only required for a short period of time, from 1-4 weeks.
Aid farms in channel selection: We developed the tool and worked with the case study farms in order to aid them with channel selection. The tool that we developed aids farms in evaluating the performance of a maximum of six marketing channels based on seven performance factors: marketing labor required, risk, sales volume, lifestyle preferences, price offered, ability to sell the whole carcass, and percent of total carcass demanded.
Identify “snapshot” data to track: Going into this project, I was wondering if we would end up tracking data by time (one week, one month) or by individual head of livestock. The result is somewhere in the middle, where the LMCAT asks farms to input all the cuts yielded from one, typical head of livestock, but also to track sales and marketing information for any number of weeks, from 1-4.
Develop a programmed Excel spreadsheet for easy data entry and analysis: We have completed this objective and believe that the “beta” version of the spreadsheet is unique and valuable to producers wishing to measure and improve their marketing. We will test this tool on additional farms and make changes as needed.
Complete a final analysis for each case study farm: Initial data collection at the beginning of the project was conducted with each case study farm. Using that data and the LMCAT developed at the end of the project has resulted in two of the farms getting a full analysis. Of the four farms, three offered an adequate degree of cooperation to complete a in-depth analysis of their marketing. The cheese producer, Finger Lakes Farmstead Cheese, was relatively easy to work with, but ultimately, I focused on a tool that was not easily applicable to cheese products, so the real emphasis is on meat products. That said, types of cheese and their quantities and prices could possibly be entered as cuts of meat using the LMCAT. As the project developed, I choose to concentrate on meat products once it became clear that it wouldn’t be useful to develop a tool that worked for both meat and cheese.
Cooperators
Research
This project allowed the in-depth investigation of how livestock marketing farms evaluate their marketing channel performance. Going in to it, I knew that there would be confusion, as expressed in the proposal, and working with the case study farms and their real-world data has led the development of a Livestock Marketing Channel Assessment Tool. One of the major goals for the project was to identify factors for marketing channel assessment and ways to measure them. The factors we were trying to identify had certain criteria: 1) They need to be easily measured, without excessive record keeping, 2) they needed to apply to all channels, and 3) they needed to be truly important to the farmer. Working with the case study farms and with data collected from their farms led to the identification of the factors.
If you are a farmer, selling meat and analyzing your options, how do you go about it? This is the place I started from, and I began with interviews with each of the four case-study farmers. From that point I developed a first draft for data collection and tried it out with one farm, Birdsall Beef. Using a second draft, I collected labor and sales data from the other 3 farms as well as a second round with Birdsall Beef. Getting the farms to complete the data collection was difficult, and in most cases, took many phone calls, emails, and a visit. Even such, data from Autumn’s Harvest farm was basically unusable since they have never furnished sales data due to “being too busy” and forgetting.
While working on this project, I found that any attempt to analyze the performance of an individual channel was incomplete without tracking individual products and their prices. A good example of this comes from the farm that I worked most closely with, Heather Birdsall, Birdsall Beef. In the first data collection trial, we simply collected miles traveled and hours of marketing labor along with total daily sales for each marketing channel. However, upon reviewing the invoices, I realized that this analysis was incomplete since the restaurant channel was mainly buying high value cuts such as tenderloin and prime rib. This reveals a weakness in the total “performance” of the restaurant channel since it is unsustainable for the farm to maintain sales of high end cuts without proportional sales of all other cuts. Thus, tracking of cuts and prices for each channel became important.
After discussion with Birdsall Beef, we tracked additional weeks along with specific cut, pounds, and price data. After a thorough analysis and construction of full carcass pricing for each channel, we concluded that any channel could be made to perform as needed by simply adjusting the pricing. This methodology is just as important as channel analysis and led to the development of the optional price analysis component in the tool. To realize the goal “to aid producers with decision making information and best marketing channel selection”, it is also necessary to aid them with setting prices for each channel.
It was impractical to consider product pricing with vegetable farms since typical mixed vegetable farms produce 40 or more crops, and then have further diversity in how the product is sold, from CSA shares, to different units for one crop, such as bunches, pounds, and bushels. Many vegetable farmers have the perspective that the mix of vegetables is the product in any given channel and thus, individual product prices are less important than overall channel performance. For example, a low profit or “loss leader” crop may still be grown and brought to market, just because it is important to offer and part of a whole channel strategy. In the case of livestock products, there is a diversity of cuts and packaging, however, it is manageable and important to look at individual product prices.
As indicated in my annual report, this project presented set-backs as well as unexpected results. The further I delved into the decision making factors that I heard in interviews and worked with the data the more I was steered towards analyzing product pricing. It took until the very end of the project to fully realize the implications and the best means for analysis.
There are fundamental differences between livestock and produce when it comes to marketing channel selection, price, and decision making, which we anticipated, but which made a simple adaptation of the existing Marketing Channel Assessment Tool impractical. Work on this project was instrumental in clarifying and defining these differences and their impacts on decision making. As a result, six factors were identified, with one factor, “ability to sell the whole carcass” requiring two different ranked measurements. The factors are as follows:
Price: Comparing channels means finding a way to compare whole animal/whole carcass channels such as conventional commodity sales, livestock auctions, small value-added brands (such as Hardwick Beef & Pinelands Natural beef), and freezer trade with channels that involve sales by-the-cut, such as farmers’ markets, restaurants, and others. To make this comparison useful, we must develop a price equivalent. The simplest price to find for all channels is the hot-carcass weight (HCW) price. HCW pricing is the industry standard pricing method. Also, for live animal channels where a HCW is not readily available, a simple calculation will reveal the estimated HCW, which can then be entered into the spreadsheet.
Despite the simplicity of using the HCW price, a channel-specific HCW equivalent is difficult to calculate since some channels only demand certain cuts, and thus farms have not developed pricing for every cut in the carcass. High Point Farm, for example, only submitted prices for six cuts in the “restaurant” channel, thus calculating a hot carcass weight equivalent price is problematic. This was solved by assuming that a channel will consume all of each cut (from 1 typical head of livestock) for each cut that the farm has created a price, and then calculating a weighted average retail price, and working backwards to find a HCW equivalent. Since this price will only reflect the cuts used in that channel, it is a little weak, since, for example, the restaurant channel mainly demands high value cuts, however, I think the two separate ranks which reference the ability to sell all cuts compensate for that weakness.
Additionally, commodity market based channels, such as auctions, small brand and commodity sales base pricing on fluctuating market prices while channels such as meat CSA, farmers’ market, and freezer trade tend to have steady pricing for several months, or even years, at a time. Therefore, comparisons of market-priced channels represents only a “snapshot” in time.
Ability to sell the whole carcass: Interacting factors such as weight, gross sales volume, and price per pound (for either HCW (hot carcass weight) or retail weight), are very important to compare the relative performance of different channels, however, these factors are not immediately comparable across channels. In part, they are not comparable because product weight is animal specific, not channel specific. Gross sales in one channel may reflect whole carcass sales while another channel’s gross sales might reflect sales of only a handful of cuts. Since some channels only consume certain cuts, one head of livestock cannot be easily tracked through each channel for comparison sake. In an attempt to account for this, a ranking for “Sells whole carcass?” was added to the channel comparison.
Additionally, a score for selling the whole carcass captures the degree of inventory management required. Inventory management includes elements of marketing labor and risk. Early in the project, I had considered that “degree of inventory management” might be a factor which would be important to measure and rank, however this score addresses it. So, a metric was added specifically to measure whether or not a channel demands all cuts. Therefore, a channel such as the restaurant channel would score worse than a whole carcass channel such as commodity or freezer trade.
In addition to the “yes” or “no” metric of “sells whole carcass?” a rank was created for “% of carcass demanded by channel” to further measure the degree to which a channel consumes all cuts. This way, this very important factor had sufficient weight in the overall assessment, since selling the entire carcass is critical to sustainability and always cited by farmers that sell meat by the cut.
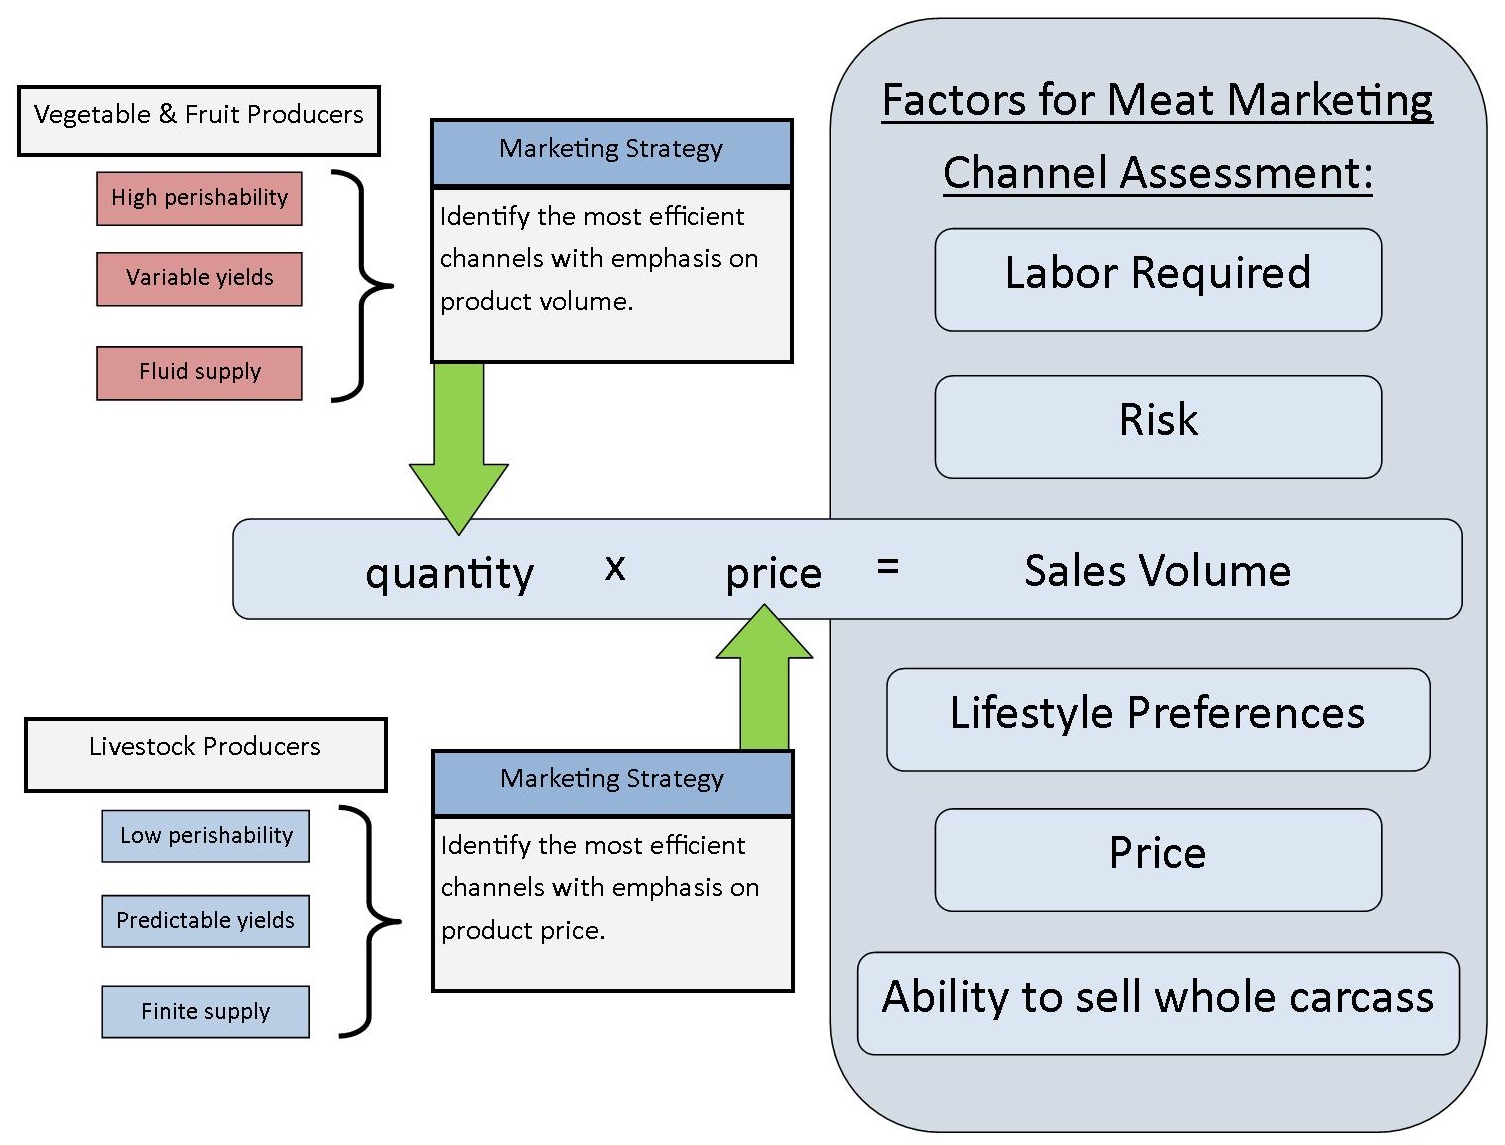
Sales Volume: The sales volume factor for livestock farmers is quite different than for produce growers. The difference in the approach can be explained by the differences in two important, interacting factors which change the role and importance of the “sales volume” assessment factor: product volume and product perish-ability. When working with produce growers we learned that one important factor of channel performance was the volume of product that the channel could consume in a set period of time (one week). We called this factor “sales volume” and, because tracking the prices and quantities sold for individual crops was too complicated, we simply tracked gross sales for each channel on each day of the studied week. Underlying this factor was an accounting for price and volume of product. In other words, sales volume (gross sales) = quantity (of all products sold in the channel) X price. This was a simple way to capture the relative prices offered in the various channels and simultaneously track the relative volumes as dollars of gross sales.
Figure 1 (attached as jpg file): Livestock producers and produce growers emphasize different parts of the sales volume factor due to differences in the perish-ability and product volumes of their relative goods.
Another difference between the system used for produce versus livestock producers is that livestock products are more finite, meaning, there is a clear number of pounds of product while with produce, the quantity available is a bit less clear. Due to culls, sorting, sizing, and spoilage, produce growers expect to put up to 10% of their harvest into the compost pile, regardless of which channel they are using. In addition, farms only harvest enough product to satisfy the anticipated demand of each channel. Additional product may be ready in the fields, but if there is not a ready market for it, they choose not to harvest it as this would be a waste of labor. Thus, price is a less valuable component of decision making for producer growers. Rather it is more a question of how much labor is invested for a given dollar amount of sales, under the assumption that more product could be mustered if the channel demanded it. With livestock products, the total number of pounds and the pounds of a certain cut are limited, and more tenderloin cannot simply be harvested to accommodate demand.
Meat which is properly packaged and frozen has a shelf life of at least 18 months making it basically imperishable since we assume all meat is sold in a much shorter period. Therefore there is less emphasis on timing than with fresh market produce. It is still important for farms to sell all cuts from the carcass proportionately and in a timely manner so that they are not backlogged with certain cuts.
Additionally, with the livestock, the harvest can be more reliably planned to maintain constant supplies over time. Given the long shelf life of frozen meat, there is no rush or pressure for farms to find channels that consume the entire supply in a very short period.
Given the important differences in product perish-ability and product volume, a simple adaptation of the existing MCAT was insufficient. Since the importance of the “quantity” part of the sales volume equation has been dramatically reduced, we are left, primarily, with “price”. The issue of price was complicated by deciding to track the prices of all products (individual cuts in many cases). Since a channel may only demand desirable cuts which are a small portion of the total carcass, price is used by farms as a strategy to regulate inventory.
Risk, Lifestyle preference, and Labor Required: The remaining factors of risk, lifestyle preferences and amount of marketing labor required remain the same from the produce MCAT to the livestock MCAT. These are factors for assessing channel performance and were all cited as important by the case study farms. Risk and lifestyle preference are not measured factors, but rather are just ranked by the farmer. “Labor required” is a measurement of the number of labor hours each channel demands during the study period. The “risk” ranking captures farmer perceptions on channel financial or business risk. Financial/business risk is defined as the probability of lost or lower-than-expected sales. Examples of risks include: buyer back-out, bad weather (such as for farmers’ markets), price risk, competition, and dependency on access to a USDA-inspected slaughterhouse to name a few. “Lifestyle preferences” reflect how well each channel fits the farmers’ overall enjoyment of work in each channel. Lifestyle preferences are unique to the individual and can relate to a channel's labor requirements, the stressfulness of the work, how and what people are interacted with, or the style and presentation of products, etc.
Development of a pricing tool: While working with the interviews and data, I realized that, rather than choosing channels based on performance alone, a price structure can be developed for each channel to justify participation in the channel. This line of thinking was also a fundamental difference in the decision making of the participating livestock farmers as compared to vegetable farms. The price tool uses weight data for individual cuts entered as part of the LMCAT along with additional cost data. It then asks the farm to enter the desired mark-up (profit above marketing costs) and calculates a weighted average price per pound. The farmer can than experiment with the price on individual cuts until the desired profit is reached.
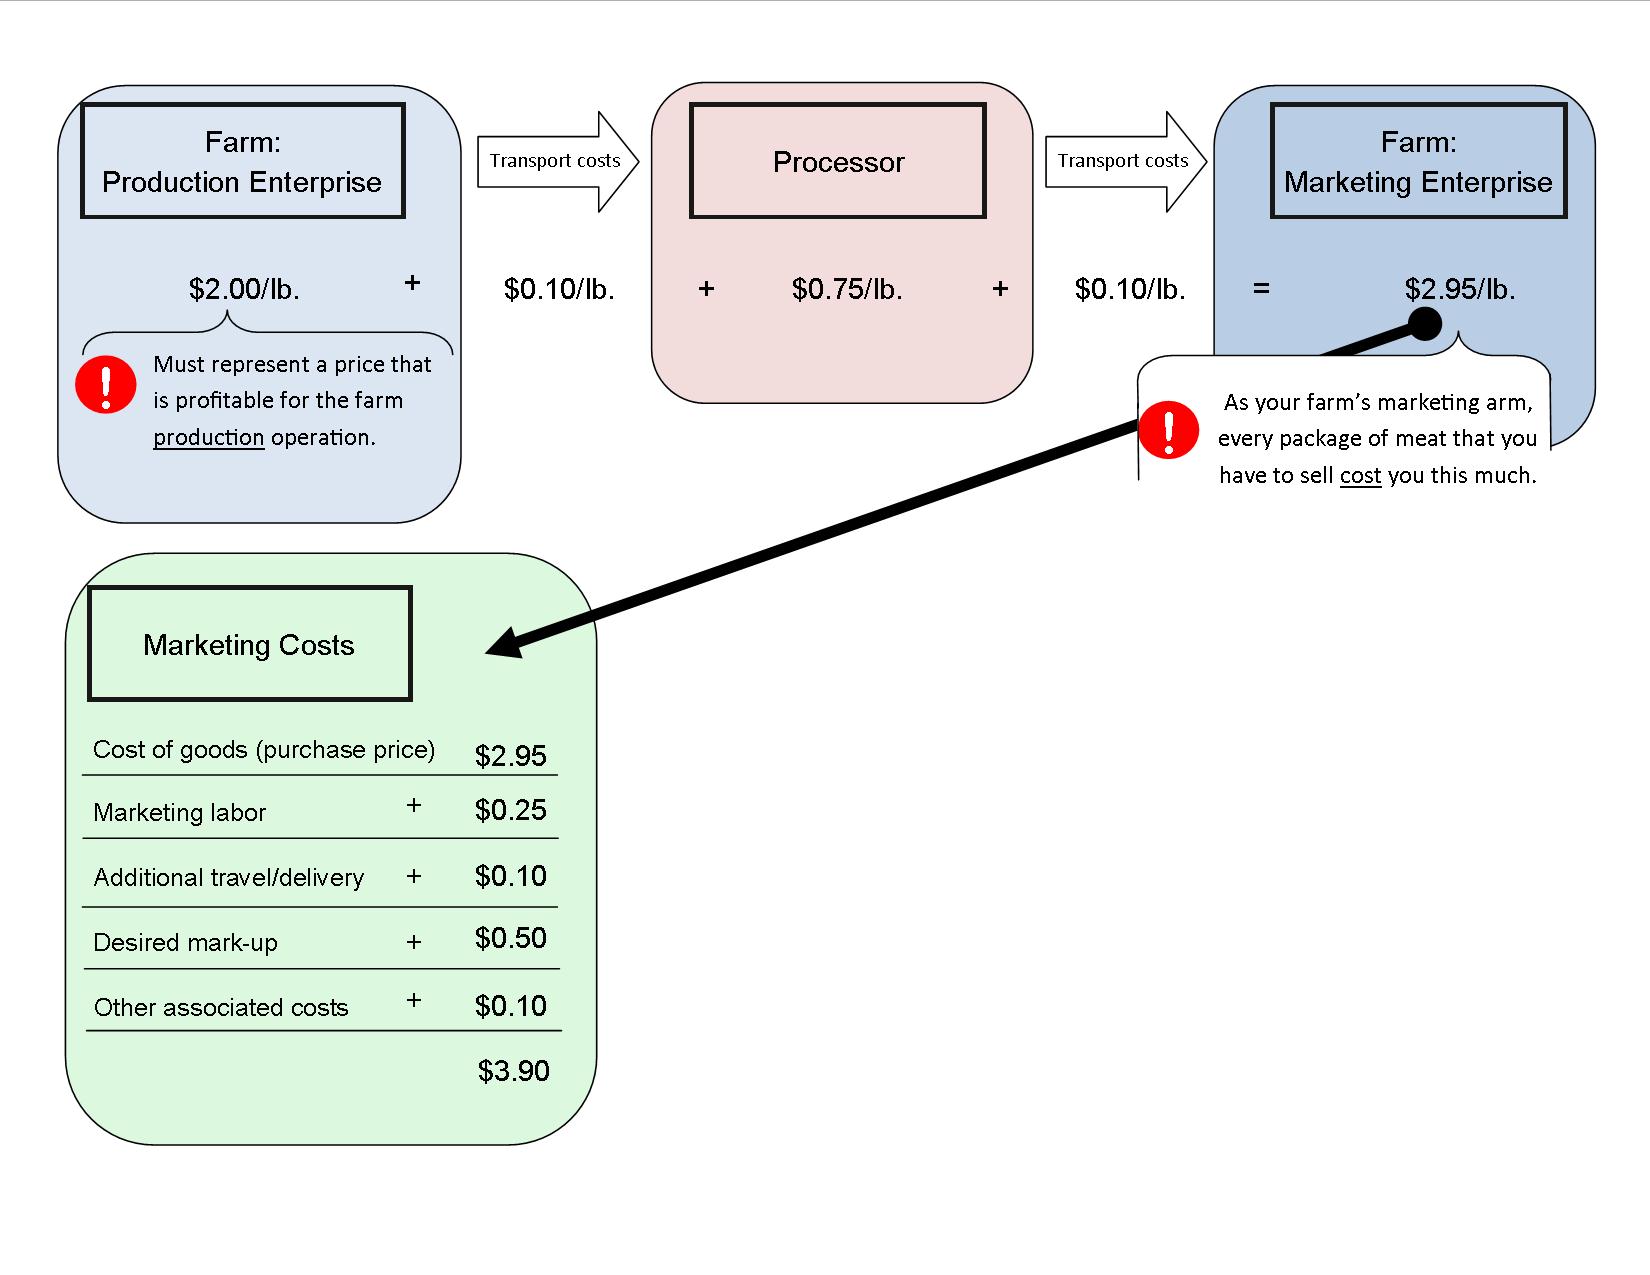
Overall, direct marketing livestock producers struggle over how to price their products. Many consider production costs but not necessarily their marketing labor and costs when formulating a “cost plus mark-up based” price. In addition, the relative yield and desirability of individual cuts further complicates pricing for farmers. For the purposes of developing a price that pays the farm for both their harvested livestock and their marketing costs, I have begun to teach farms to think of their farm as two operations, one that produces finished livestock products and one that purchases those products and then markets them to customers.
Figure 2 shows results of data collection to properly price a package of meat. The project helped develop a better way to teach farmers how to set their pricing based on a cost plus mark-up system, helping to ensure their profitability in both production and marketing operations.
The reason behind this is because it makes accounting for marketing labor in price calculations seem more reasonable to the farm. Part of the LMCAT includes a price calculator to aid farmers in formulating the price which a given channel must pay in order to deliver the desired returns. This price calculator was a more important development than the marketing channel ranking tool for the case study farm with which I worked most closely (Birdsall Beef). In her situation, she was more interested in improving her existing channels rather than exploring new channels. This approach made sense, especially in light of the new found importance of price and the ease of collecting cut-specific price and weight data from invoices.
Education & outreach activities and participation summary
Participation summary:
Now that this new tool has been developed, I expect to begin promoting it and teaching it throughout the coming years. Thanks to the SARE project, “Increasing freezer trade sales for livestock producers” (SARE project # ONE12-153) I will be teaching several “Strategic Marketing for Livestock Producers” classes in the coming year and the outcome of the project will be a key component in the curriculum.
While the final results were not done until later in the project than expected, I still intend to implement a thorough outreach campaign with the findings. Early findings indicated that the freezer trade channel was one of the best performing channels, showing a balance in dollars of profit for each head of beef marketed and dollars of sales for each hour of marketing labor. This result along with the fact that freezer trade was one of the best ways for consumers to buy has led to other projects. Additionally, these early findings were shared in outreach during the project period including: the New England Cooperative Extension Annual In-service, the Cornell Cooperative Extension Agriculture and Food Systems Annual In-service, CT Cooperative Extension’s offering of the “Strategic Marketing for Livestock Producers”, Groundswell Center for Local Food & Farming’s Farm Business Planning Class, as well as future articles in the Cornell Dyson School’s Smart Marketing publication and the Cornell Small Farms Quarterly newspaper, among others.
Project Outcomes
Farmer Adoption
The work that I did with Birdsall Beef was the best success of the four case study farms. Heather, of Birdsall Beef, had been questioning the performance of her sales to restaurants and farm stores since they seemed marketing labor intensive and commodity prices for both feeder calves and finished cattle were at historic highs. After initial data collections and analysis, and many discussions with Heather, I suggested that we could formulate prices for each cut in order to determine the channel-specific pricing required to meet the farm’s needs. We started by entering the farm’s current pricing into the pricing calculator that I developed. It was determined that current prices were not meeting the farm’s needs nor were they competitive with commodity channels, so a few changes were made, mainly to the ground beef price. Birdsall Beef implemented the new pricing during the project period. Most of their restaurant customers continued to buy from them in the same fashion however one began to buy less ground beef. Overall, Heather was happy with the results, feeling that each sale she made from that point on was “worth it” because it met her needs and remained competitive with commodity prices.
Two other case study farms, High Point Farms and Finger Lakes Farmstead Cheese Company, were interested in the findings, but had already adjusted pricing to better suit their needs by the time the data collection period began. Therefore, those two farms were satisfied with the results of their changes and felt confident in their current marketing channel mix.
The fourth farm, Autumn’s Harvest Farm, is the farm that would have benefited most from utilization and adoption of this methodology, however, they were the least responsive during the project period. After repeated, failed attempts to collect data I visited the farm to discuss some ways for them to continue on with the project. The visit resulted in some data collection that week, however it was incomplete and lacked the pertinent invoice information needed to create useable results. The visit also revealed that, as was known during the proposal development, the farm was over-committed to production and marketing activities. They cited “busy-ness” as the reason that they repeatedly failed to collect the requested information. Specifically, the farm was processing cut-to order fresh meat for restaurants and spending labor time on delivering small orders. While this is the farm that could have benefited the most from the study, their need for marketing changes was the very reason they could not cooperate more. I will continue to try to work with the farm even after the project period is over.
Areas needing additional study
Now that a Livestock Marketing Channel Assessment Tool has been developed in conjunction with four case study farms, usage of the tool on more farms is needed. This project’s goal was to identify the factors for assessment specifically for livestock farms, to develop a means to measure each factor, and a system for inputting such data so a final ranking resulted. The goal was not to collect data on multiple farms nor was it to identify the top performing channels. However, these are areas that need to be studied further to benefit livestock farmers.