Final report for ONE17-307
Project Information
Determining a nitrogen (N) credit for cover crops and soil organic matter when calculating an N fertilizer application rate for corn remains a key uncertainty. Here we propose and test a method of quantifying the N supply to corn from cover crops and soil organic matter using a simple system of equations based on biogeochemical theory that predicts the yield of an unfertilized corn crop. The difference between the yield that can be achieved without fertilization and the yield goal of the site is used to determine the N fertilizer requirement. The equations require inputs of soil sand and clay concentration, soil organic matter concentration, cover crop N content and carbon:nitrogen (C:N) ratio, and corn yield potential. Because these inputs can vary spatially within a field, we developed a method to integrate spatial variation in soil texture, cover crop N content, and corn yield potential into a variable rate fertilizer prescription. Soil was mapped with an electrical conductivity sensor to determine soil texture zones, cover crop canopy was mapped with a normalized difference vegetation index (NDVI) sensor to determine cover crop biomass N content zones, and historical combine yield maps were used to determine corn yield potential zones. The equations to predict an N fertilizer recommendation assume that each bushel of corn yield requires 1.2 pounds of N uptake by the corn plant, however an appropriate value for the efficiency with which applied fertilizer is taken up by the plant is not known. Therefore experiments were conducted that compared variable rate N fertilizer recommendations developed using N fertilizer efficiencies of 100%, 75%, and 50%. These variable rate prescriptions were compared to the typical method of N fertilizer recommendations according to the Penn State Agronomy Guide, which calls for 1.0 pound of nitrogen for each bushel of expected corn yield, minus credits for previous legume crops and/or residual manure history. Experiments were conducted in 4 locations in 2019. Nitrogen fertilizer rates increased as the efficiency factor decreased from 100% to 75% and 50%. In two locations, the Agronomy Guide N fertilizer rate was greater than the 50% efficiency, one location the Agronomy Guide N rate was between the 75% and 50% treatments, and at the final location the Agronomy Guide recommendation was between the 100% and 75% treatments. At all locations, corn yields generally increased as N fertilizer rates increased up to a plateau point. The 50% efficiency treatment had the most satisfactory results at achieving maximum corn yields and used less N applied than the traditional Agronomy Guide recommendation at two sites but used more N applied than the Agronomy Guide recommendation at the other two sites. Results suggest that the efficiency level to use in the system of equations that optimizes corn yield and N use may vary across sites, however, revealing an important area for future research to determine how to adjust the efficiency factor for a specific site.
Our goal is to decrease N pollution in the environment and increase farmer profitability by improving nitrogen use efficiency (NUE) in corn production. Our research question is whether the spatially explicit crediting of biological N supply from cover crops and soil organic matter when calculating a variable rate N fertilizer prescription can improve fertilizer NUE.
The first objective is to use precision agriculture technologies to map cover crop biomass N content and delineate soil sampling zones for the measurement of soil organic matter and soil texture. The second objective is to use the maps of cover crop biomass N, soil organic matter, and soil texture to calculate spatially explicit biological N supply credits. The third objective is to use the map of biological N supply credits to calculate variable rate N fertilizer prescriptions and measure whether NUE improves and overall corn yields can be maintained by using a variable rate application compared to the standard practice of a fixed N rate.
Nitrogen management poses myriad challenges to the sustainable production of corn. In typical corn production systems, N fertilizer is the most expensive input, the largest contributor to greenhouse gas emissions, the nutrient most limiting to crop growth, and the nutrient with the most pathways to become a pollutant in the environment (4). Research and extension efforts in recent decades have focused on various methods to improve N fertilizer management, especially the 4 R’s- the right rate, in the right form, in the right place, at the right time. However, between 2003 and 2011, there was an overall decline in the acreage receiving appropriate N fertilizer management in the Chesapeake Bay watershed and a 9% increase in the commercial N fertilizer application rate (5).
Concurrent with research on improved N fertilizer management, precision agriculture technology rapidly evolved. Precision agriculture uses the ability for global position satellite (GPS) receivers to interface with machinery controls and crop and soil sensors to record data and vary management practices, such as fertilizer application rates, within a field. While improved N fertilizer management was an early promise of precision agriculture, widespread success and implementation of precision N fertilizer management in corn has been elusive (6). One reason for the lack of success and adoption of these fertilizer N management practices is that N fertility recommendations that take into account the ecological factors controlling N cycling are not well developed.
Despite current limitations in N fertility recommendations, the advent of the soil health movement in mainstream agriculture has led to increasing farmer interest in using cover crops to recycle N and build soil organic matter (7). Along with this interest has come the need to credit the N supply potential from cover crops and soil organic matter when calculating fertilizer N application rates. Recently, methods to predict N supply from cover crop residues and soil organic matter have been developed from research experiments across Pennsylvania (2, 3). There is potential for these methods to be paired with precision agriculture technologies to develop field maps of biological N supply that could inform variable rate N fertilizer applications.
Predicting N mineralization from soil organic matter and cover crop residues has been a long standing topic in soil science research and is a crucial component to improving fertilizer NUE (8). There are many soil tests that have been proposed as indices of the N mineralization potential of soil organic matter and our understanding of the controls on N mineralization from cover crop residues is strong (9). However, our ability to predict relevant agronomic outcomes, such as corn yield response, based on N mineralization from soil organic matter and cover crop residues is either weak or has not been tested under real environmental conditions. To overcome the gap between laboratory studies and field studies, we recently used a large dataset of corn yield responses from research station and on-farm experiments across Pennsylvania to develop and calibrate equations to predict N supply from soil organic matter and cover crops (2, 3).
These equations are designed to predict the unfertilized yield of a corn crop based on easily measurable variables, specifically total soil carbon (C) concentration (a measure of organic matter), soil texture, cover crop biomass N content and cover crop biomass C:N ratio (see supplemental attachment). The equations are formulated on well understood processes of N mineralization and the most recent advances in scientific understanding of soil C dynamics, with coefficients calibrated to capture regionally-specific environmental controls on decomposition and N losses. The equation to predict N supply from soil organic matter reflects the relatively new understanding that soil organic matter is stabilized not by its chemical recalcitrance, but by sorption to the surfaces of mineral particles (10). Thus, soil organic matter decomposition and N mineralization is adjusted in the equation based on soil texture, with silt and clay reducing N supply because of their increased surface area relative to sand.
Because the variables needed to predict N supply from cover crops and soil organic matter in these equations are easily measured, but could vary across the scale of a field, there is an opportunity to use existing precision agriculture technologies to create field maps of biological N supply potential. Soil ECa sensors (e.g., Veris model 3100) are currently used by fertilizer suppliers in Pennsylvania to map fields and delineate soil sampling zones that correspond to differences in soil chemical and physical characteristics, including soil texture. Crop canopy sensors measuring normalized difference vegetation index (NDVI) and logging to a GPS receiver are commercially available, and we have previously calibrated these sensors to predict cover crop biomass N content (11). Some fertilizer companies in Pennsylvania already have the equipment to offer variable rate fertilizer application services and could use N fertilizer prescriptions that include spatially explicit N credits from soil organic matter and cover crops.
References
- K. G. Cassman, A. Dobermann, D. T. Walters, Agroecosystems, nitrogen-use efficiency, and nitrogen management. Ambio. 31, 132–140 (2002).
- C. M. White, D. M. Finney, A. R. Kemanian, J. P. Kaye, A Model–Data Fusion Approach for Predicting Cover Crop Nitrogen Supply to Corn. Agron. J. 0, 0 (2016).
- C. White, A. Kemanian, J. Kaye, in Annual Meeting, Soil Science Society of America: Phoenix, AZ. 9 November 2016. (2016).
- G. P. Robertson, P. M. Vitousek, Nitrogen in Agriculture: Balancing the Cost of an Essential Resource. Annu. Rev. Environ. Resour. 34, 97–125 (2009).
- NRCS., Impacts of Conservation Adoption on Cultivated Acres of Cropland in the Chesapeake Bay Region, 2003-06 to 2011. United States Dep. Agric. Nat. Resour. Conserv. Serv. Washington, DC (2013).
- T. A. Doerge, Variable-Rate Nitrogen Management for Corn Production- Success Proves Elusive. Int. Plant Nutr. Inst. Site Specif. Manag. Guidel. SSMG-36.
- S. Groff, Mixtures and cocktails: Soil is meant to be covered. J. Soil Water Conserv. 63, 110A–111A (2008).
- A. J. Franzluebbers, Should Soil Testing Services Measure Soil Biological Activity? Agric. Environ. Lett. 1, 0 (2016).
- H. H. Schomberg et al., Assessing Indices for Predicting Potential Nitrogen Mineralization in Soils under Different Management Systems. Soil Sci. Soc. Am. J. 73, 1575 (2009).
- M. W. I. Schmidt et al., Persistence of soil organic matter as an ecosystem property. Nature. 478, 49–56 (2011).
- C. M. White, Using Cover Crop Mixtures to Reduce Nitrate Leaching and Supply Nitrogen to Corn: Models to Inform Adaptive Management (2015).
- C. M. White, A. R. Kemanian, J. P. Kaye, Implications of carbon saturation model structures for simulated nitrogen mineralization dynamics. Biogeosciences. 11, 6725–6738 (2014).
Cooperators
Research
2018 Corn Growing Season
Two variable rate nitrogen experiments were established, one in a Penn State Farm Services field in State College, PA (hereafter referred to as the State College location) and another in a field on Ed Quigley's dairy farm in Spruce Creek, PA (hereafter referred to as the Spruce Creek location). At the State College location, a triticale cover crop was planted after corn silage harvest. Corn silage was harvested on 26 September 2017, a burndown herbicide was applied to control weeds on 1 October 2017, and the Hy Octane triticale variety was drilled on 7.5 inch row spacing with a seeding rate of 90 lbs/acre on 5 October 2017. At the Spruce Creek location, cereal rye was planted after corn silage harvest in September 2017.
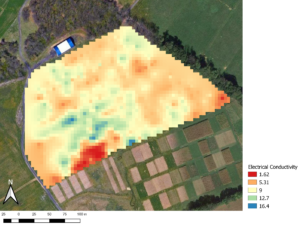
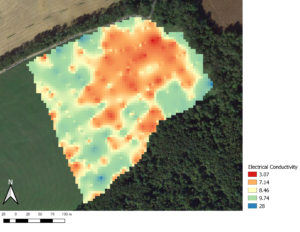
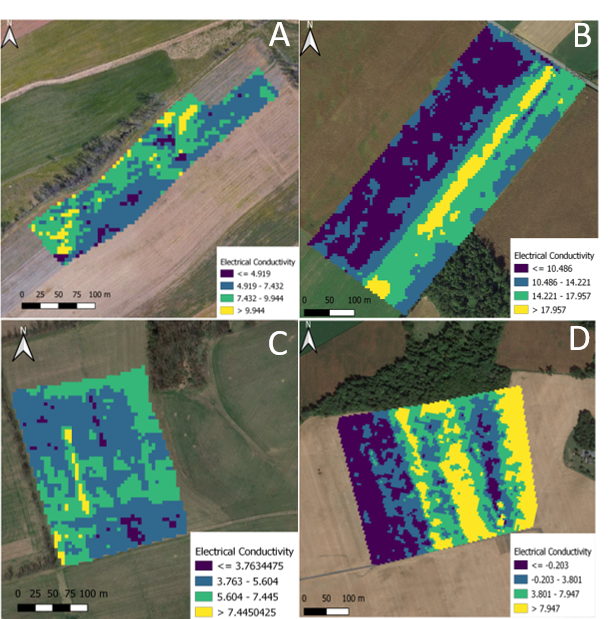
Both fields were mapped with an electric conductivity (EC) sensor (Veris 3100) using a 50' pass width and a driving speed of ~ 10 miles/hr. The sensor logged georeferenced EC measurements for the 0-1' and 0-3' depth ranges at a frequency of 1/sec. An EC map of each field was created by interpolated EC measurements using kriging in SAS 9.4 (Figures 1 and 2).
Soil samples were collected from 24 points in the State College field on 17 November 2017 and from 24 points in the Spruce Creek field on 26 June 2018. A stratified random sampling approach was used to determine sampling points that were representative of the range of mapped EC values. Each soil sampling point was georeferenced (< 2 meter GPS accuracy) and a composite sample of 8 cores (3/4" diameter, 8 inch deep) was collected from random spots within a 5' radius of the georeferenced point. Soil samples were air dried, ground in a flail mill, sieved to < 2 mm, and sent to the Penn State Agricultural Analytical Services Lab to measure nutrients, soil organic matter and soil texture.
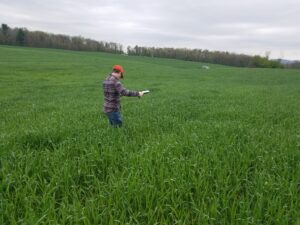
In the spring, cover crops were terminated with herbicides on 8 May 2018 at the State College location and 3 May 2018 at the Spruce Creek location. During the cover crop burndown, two Greenseeker sensors (RT200 sensor package, Trimble, Inc., Sunnyvale, CA) were mounted on the spray boom to map cover crop NDVI throughout the field. Measurements were mapped using the Farmworks Mobile software installed on a tablet PC. Measurements were logged with georeferenced coordinates every 10 feet of forward motion of the sprayer. Sprayer passes were made on 90 foot widths at the State College location and 60 foot widths at the Spruce Creek location. Prior to cover crop burndown, cover crop biomass samples were collected from eight 0.25 square meter quadrats evenly distributed across each field. Cover crop biomass was weighed, ground, and analyzed for carbon and nitrogen contents.
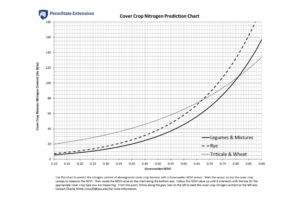
Maps of cover crop NDVI were interpolated with kriging in SAS 9.4 and NDVI values were converted to cover crop biomass N content using a previously established calibration equation (Figures 5, 6, 7).
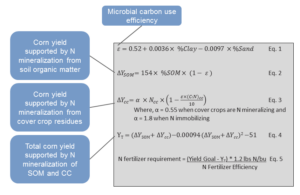
At each site, maps of cover crop biomass N content and soil EC were overlaid and clusters with similar biomass N content and soil EC were identified to be used for calculation of variable rate N fertilizer prescriptions that credited N availability from cover crops and soil organic matter. Cover crop and soil organic matter N credits were calculated within each cluster using measurements of soil texture and soil organic matter from the 24 soil sampling points, cover crop biomass N content from the Greenseeker NDVI maps, and cover crop C:N ratio from the 8 cover crop biomass sampling points. The N credits were calculated using the equations presented in Figure 8.
Equation 1 first calculates a microbial carbon use efficiency based on the soil texture. As clay content increases or sand content decreases, microbial carbon use efficiency, or the fraction of decomposed carbon that is assimilated into microbial biomass, increases. An increasing carbon use efficiency will ultimately translate into less N mineralized from the decomposition of cover crop residues and soil organic matter.
Equations 2 and 3 calculates the credits from soil organic matter and cover crop residue decomposition. Note that the carbon use efficiency calculated in Eq. 1 is used in both Eq. 2 and Eq. 3. The N credits calculated in Eq. 2 and Eq. 3 are expressed as levels of corn yield that can be achieved without supplemental N fertilizer applied. In Eq. 2, as soil organic matter increases, the corn yield increases. In Eq. 3, as cover crop biomass N content increases and as C:N ratio decreases, the corn yield increases. Note that if the C:N ratio increases above a critical threshold (defined as 10/ε), the N credit from cover crops will become negative due to immobilization of N.
In Eq. 4, the N credits from soil organic matter and cover crops are added together and then adjusted to account for a quadratic yield response to N availability. The result of Eq. 4 predicts the corn yield that could be supported by N mineralization of cover crop residues and soil organic matter without the addition of any supplemental N fertilizer.
Equation 5 determines the required amount of supplemental N fertilizer by taking the difference between a fully fertilizer yield goal for the site and the yield that can be achieved without N fertilizer, multiplying that difference by a factor of 1.2 lbs N required per bushel of yield, and dividing by a fertilizer efficiency (efficiency value between 0 and 1). The factor 1.2 lbs N/bushel is the quantity of N physiologically required by the corn plant to produce the biomass needed for a bushel of grain. It is known that N fertilizer is not always recovered by a crop with 100% efficiency, therefore the physiological N requirement is modified by an expected fertilizer efficiency value to determine the rate of N fertilizer to apply to meet the physiological N requirement. In our experiment, we tested N fertilizer rates developed assuming 100% efficiency, 75% efficiency, and 50% efficiency of N fertilizer recovery to determine what efficiency level should be used when crediting N availability from soil organic matter and cover crops as we do in this process. In the experiments, we also included a standard N fertilizer recommendation based on the Penn State Agronomy Guide, which is 1 lb N fertilizer per bushel of expected yield, minus any N credits from residual manure history or previous legume crops. Neither location had an N credit from a previous legume crop, but the State College site had a 20 lbs N/ac credit from a frequent manure history (2-3 out of 5 years) and the Spruce Creek location had a 35 lbs N/ac credit from a continuous manure history (4-5 out of 5 years). The target corn yield used in the development of N fertilizer rates was 165 bu/ac at the State College site and 250 bu/ac at the Spruce Creek site.
Variable rate N fertilizer prescriptions were developed for each zone as described above. At each site, a fixed amount of N fertilizer was applied prior to corn planting based on existing farm management practices and the remaining N fertilizer needed according to the prescription was applied as a variable rate sidedress application of 30% urea ammonium nitrate (UAN) solution. At the State College location, 65 lbs N/ac was applied as UAN solution used for the herbicide carrier in the burndown application (19.5 gal/ac UAN solution). At the Spruce Creek location, 50 lbs N/ac as urea was spun onto the cover crop on 3 April 2018 and 65 lbs N/ac was applied as UAN solution used for the herbicide carrier in the burndown application (19.5 gal/ac UAN solution). Because of relatively sparse cover crop growth at the Spruce Creek site and the limited amount of N uptake in the biomass, we credited the 50 lbs N/ac of urea as fertilizer applied to the corn rather than as N recycled through cover crop residues and credited in Eq. 3. The sidedress application used to apply the remaining N requirement was applied with a 30 foot wide boom sprayer equipped with TeeJet flexible orifice nozzles and drop tubes spaced on 60" centers, dribbling a band of UAN solution between every other corn row. In both locations, fertilizer treatment plots (consisting of the 100%, 75%, and 50% fertilizer efficiency comparisons and an Agronomy Guide rate) were applied in a randomized block design with treatment strips running the length of the field. In each treatment strip, the variable rate prescription for the appropriate treatment (100%, 75%, or 50% efficiency level) was loaded into Farmworks Mobile. Based on the location of the sprayer in the field, Farmworks Mobile sent the N fertilizer rate for that prescription zone to a Raven 450 sprayer control console, which adjusted the control valve on the sprayer to apply the specific rate of UAN solution. For the fixed rates of N used in the Agronomy Guide treatment, the sprayer controller was manually set to the necessary rate.
To measure N status in the corn during the growing season, earleaf samples were collected between tasseling and silking growth stages from 25 plants in each treatment plot on 31 July 2018 at State College and 1 August 2018 at Spruce Creek and measured for N concentration. The late season corn stalk nitrate test was used at the end of the growing season to measure N status of the corn. At approximately the 1/2 milkline growth stage (7 September 2018 and 11 September 2018 at State College and Spruce Cree locations respectively), 15 plants in each treatment strip were sampled by cutting 8" sections of stalk from 6" to 14" above the ground. Samples were further cut into 2" segments, dried, ground and measured for nitrate concentration. To determine whether N fertilizer rates that credited soil organic matter and cover crops could achieve similar yields as the Agronomy Guide recommendation, corn yields were measured at the end of the season. At the State College site, corn grain was harvested with a 12 row combine and at Spruce Creek corn silage was harvested with an 8 row silage chopper. The mass of either grain or silage harvested from each treatment plot was measured on trucks driven over pad scales. Moisture content was determined on subsamples of grain and silage and reported yields are adjusted to 15.5% moisture for grain and 65% moisture for silage.
2019 Corn Growing Season
Four variable rate nitrogen experiments were established, one at the Russell E. Larson Agricultural Research Center near Pennsylvania Furnace, PA, one in a field on Bill Hoover’s farm near Warriors Mark, PA, one in a field on Dean James’s farm near Danville, PA, and one in a field on Leslie Bowman’s farm near Chambersburg (hereafter referred to as the Rock Springs, Warriors Mark, Danville and Chambersburg locations, respectively). At the Rock Springs location, a cereal rye cover crop was planted after corn silage harvest. Corn silage was harvested in September 2018 and cereal rye was drilled on 7.5-inch row spacing at a rate of 90 lbs/acre on 9 October 2018. At the Warriors Mark location, a cover crop mixture was planted on 15 August 2018. The cover crop mixture of oats, triticale and tillage radish was drilled on 7.5-inch row spacing at rates of 30 lbs/acre, 10 lbs/acre, and 1 lb/acre, respectively. At the Danville location, a cereal rye cover crop was planted on 26 October 2018 after soybean harvest. The cereal rye cover crop was planted on 15-inch row spacing at a rate of 55 lbs/acre. At the Chambersburg location, a cover crop mixture was planted on 10 October 2018. The cover crop mixture of wheat and crimson clover was drilled on 7.5-inch row spacing at rates of 57 lbs/acre and 3 lbs/acre, respectively.
In the spring prior to cover crop termination, the four study fields were mapped with an apparent electrical conductivity (ECa) sensor (GSSI Profiler EMP-400) towed behind a UTV (utility terrain vehicle) using a 30′ pass width and a driving speed of ~ 10 miles/hr. The sensor logged georeferenced ECa measurements once per second at a frequency of 15 kHz. An ECa map of each field was created by interpolated ECa measurements using b-spline interpolation in QGIS (Figure 9).
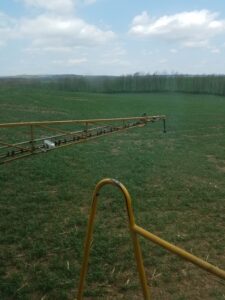
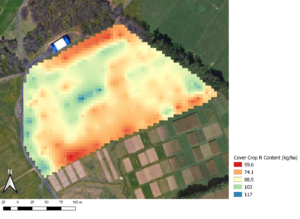
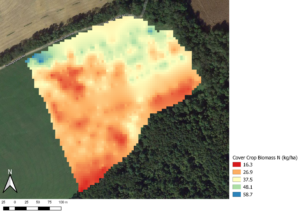
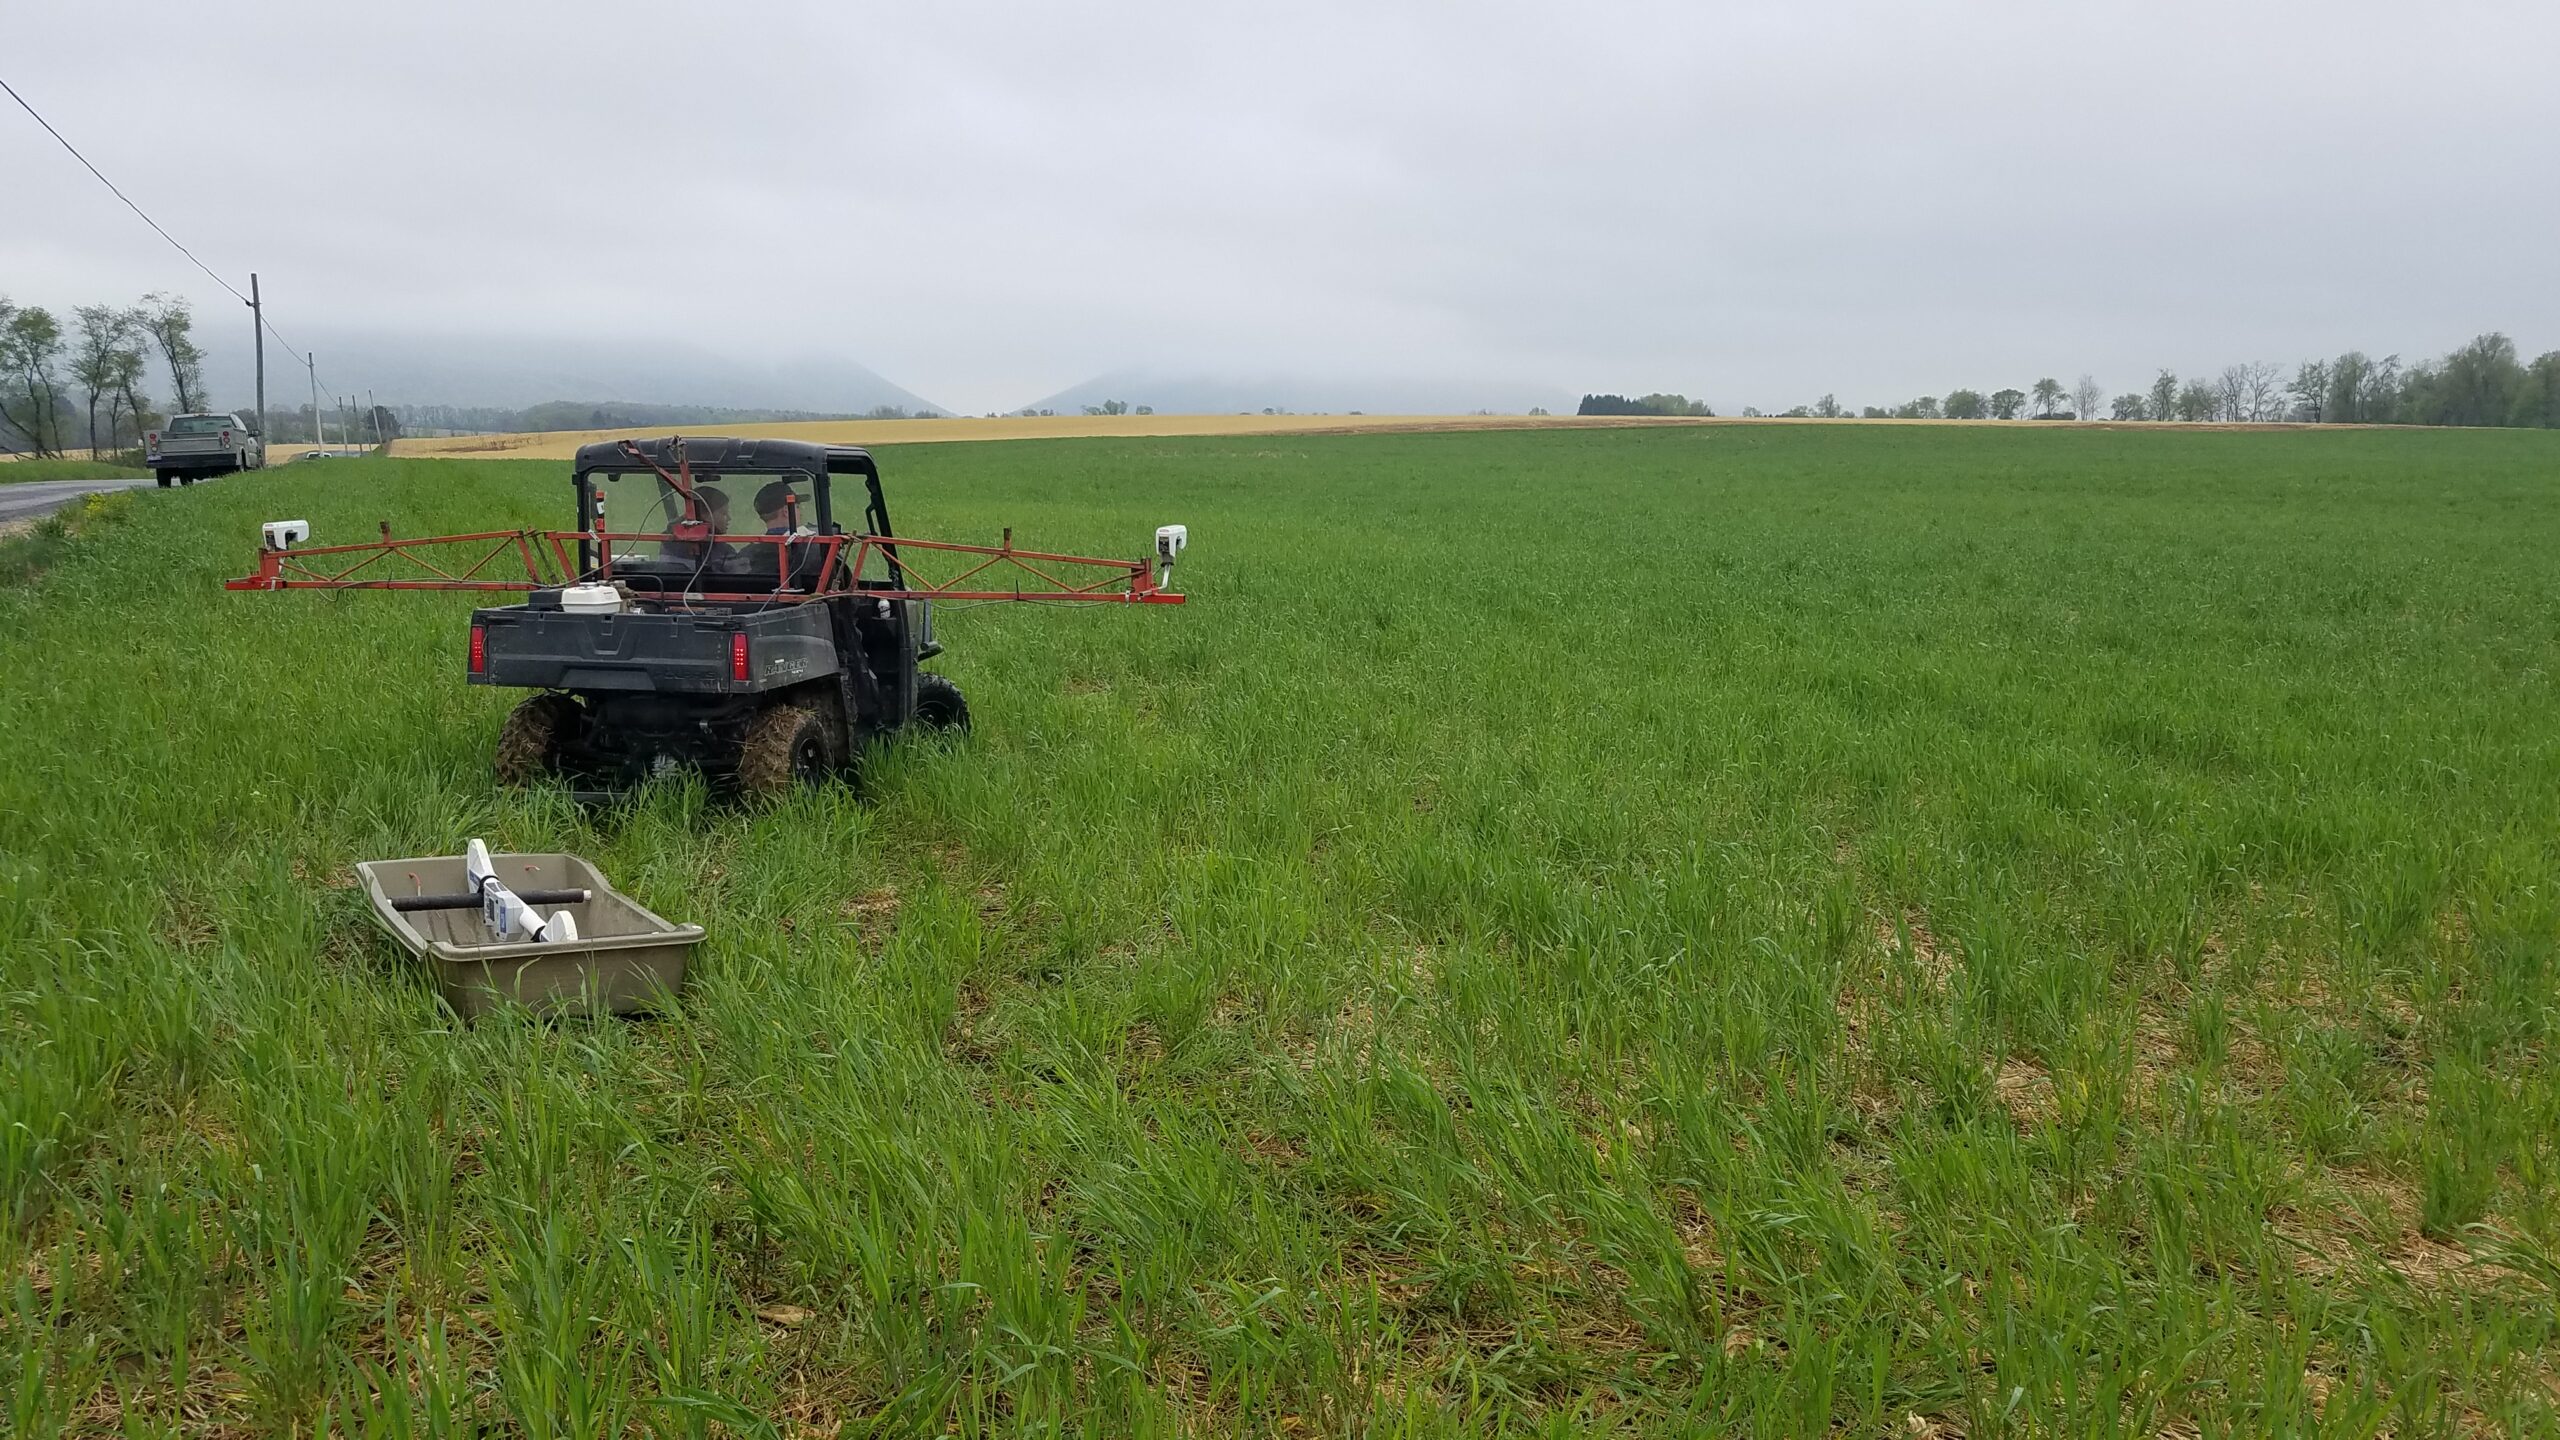
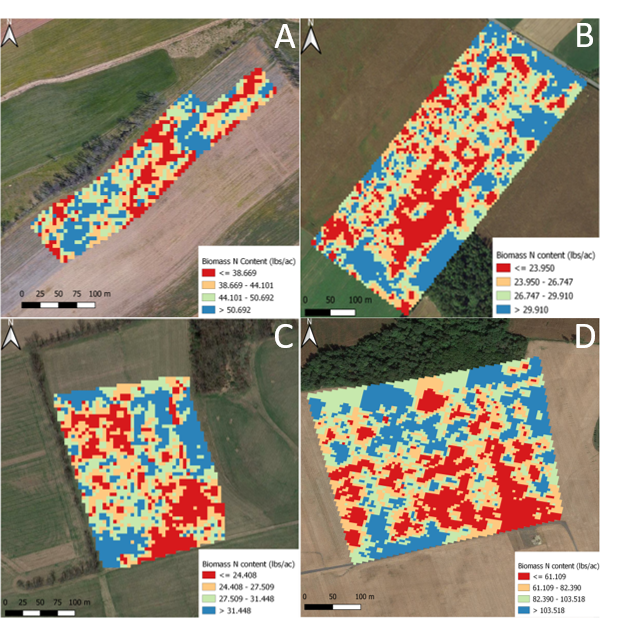
The four study fields were also mapped with two NDVI sensors (Greenseeker RT200 sensor package, Trimble, Inc., Sunnyvale, CA) mounted on a 15’ boom fixed to the UTV used to tow the ECa sensor (Figure 10). Measurements were made on 30’ passes at a driving speed of ~10 miles/hr. Measurements were mapped using a precision farming software installed on a tablet PC. Measurements were logged with georeferenced coordinates every 10 feet of forward motion of the UTV. Measurements of NDVI were converted to cover crop biomass N content using a previously calibrated equation (Figure 5). A cover crop biomass N content map of each field was created by interpolated biomass N content values using b-spline interpolation in QGIS (Figure 11).
After the ECa and cover crop biomass N content maps were created for each field, the fields were separated into three zones base on ECa for soil sampling and four points were selected within each zone to collect samples from. Each soil sampling point was georeferenced (< 2-meter GPS accuracy) and a composite sample of 12 cores (3/4″ diameter, 8-inch-deep) was collected from random spots within a 10′ radius of the georeferenced point. Soil samples were air dried, ground in a flail mill, sieved to < 2 mm, and sent to the Penn State Agricultural Analytical Services Lab to measure nutrients, soil organic matter and soil texture.
Next, the fields were separated into zones based on cover crop biomass N content in 10 lbs N/ac increments (i.e., 5-15 lbs N/ac). A stratified random sampling approach was used to determine sampling points that were representative of the range of mapped biomass N content values. Twelve cover crop biomass samples were collected from 0.25 square meter quadrats distributed across each field. Cover crop biomass was dried, weighed, ground, and analyzed for carbon and nitrogen contents.
At the Rock Springs location, soil ECa was mapped on 11 April 2019 and soil samples were collected on 23 April 2019. Cover crop biomass N content was mapped, and cover crop samples were collected on 30 April 2019. In order to reduce delays in field operations and travel to locations other than Rock Springs, field mapping, soil, and cover crop sampling were performed on one day at each location. Mapping and sampling were performed at the Warriors Mark location on 1 May 2019, the Danville location on 16 May 2019, and the Chambersburg location on 3 May 2019.
Cover crops were terminated with herbicides on 1 May 2019 at the Rock Springs location, 7 May 2019 at the Warriors Mark location, 23 May at the Danville location and 9 May at the Chambersburg location. Corn was planted on 8 May 2019 at the Rock Springs location, 3 May at the Warriors Mark location, 21 May at the Danville location and 9 May at the Chambersburg location.
At each site, the maps of cover crop biomass N content and soil EC were overlaid and clusters with similar biomass N content and soil EC were identified to be used for calculation of variable rate N fertilizer prescriptions that credited N availability from cover crops and soil organic matter. Cover crop and soil organic matter N credits were calculated within each cluster using measurements of soil texture and soil organic matter from the soil sampling points, cover crop biomass N content from the NDVI maps, and cover crop C:N ratio from the cover crop biomass sampling points.
The N credits were calculated by zone using the equations presented in Figure 8 in a similar manner as in the 2018 experimental year. Similarly to in 2018, we tested N fertilizer rates developed assuming 100% efficiency, 75% efficiency, and 50% efficiency of N fertilizer recovery to determine what efficiency level should be used when crediting N availability from soil organic matter and cover crops as we do in this process. In the experiments, we also included a standard N fertilizer recommendation based on the Penn State Agronomy Guide. The Chambersburg location had a 20 lbs N/ac manure credit, and no sites had previous legume credits. In 2019, the target corn yield used in the development of N fertilizer rates was based on yield maps of each field from previous years of corn production, therefore the target yield varied spatially across each field, which is a departure from our methods in 2018. The field average target yield was 152 bu/ac at the Rock Springs location, 187 bu/ac at the Warriors Mark location, 181 bu/ac at the Danville location and 237 bu/ac at the Chambersburg location.
Variable rate N fertilizer prescriptions were developed for each zone as described above. At each site, a fixed amount of N fertilizer was applied prior to corn planting based on existing farm management practices and the remaining N fertilizer needed according to the prescription was applied as a variable rate sidedress application. A 30% N urea ammonium nitrate (UAN) solution was used at the Rock Springs location, a 28% N UAN solution was used at the Warriors Mark location, a 30% N UAN solution was used at the Danville location and a 25% N UAN solution was used at the Chambersburg location. At the Rock Springs location, 30.7 lbs N/ac was applied as ammonium sulfate and 3.4 lbs N/ac was applied as ammonium polyphosphate for starter fertilizer. At the Warriors Mark location 60.3 lbs N/ac was applied as UAN solution used for the herbicide carrier in the cover crop termination application. At the Danville location 65 lbs N/ac was applied as a combination of UAN and ammonium thiosulfate for starter fertilizer. At the Chambersburg location 52.5 lbs N/ac was applied as a custom granular blend for starter fertilizer. The sidedress application used to apply the remaining N requirement at the Rock Springs location was applied with a 15-foot-wide boom sprayer equipped with TeeJet flexible orifice nozzles and drop tubes spaced on 60″ centers, dribbling a band of UAN solution between every other corn row. The sidedress application used to apply the remaining N requirement at the Warriors Mark location was applied with a 20-foot-wide boom sprayer equipped with TeeJet flexible orifice nozzles and drop tubes spaced on 60″ centers. At the Danville location, the sidedress application used to apply the remaining N requirement was applied with a 40-foot-wide boom sprayer and drop tubes spaced on 30” centers, except for the 75% fertilizer efficiency which used drop tubes spaced on 60” centers. At the Chambersburg location, the sidedress application used to apply the remaining N requirement was applied with a 60-foot-wide boom sprayer and drop tubes spaced on 60” centers. In all locations, fertilizer treatment plots (consisting of the 100%, 75%, and 50% fertilizer efficiency comparisons and an Agronomy Guide rate) were applied in a randomized block design with treatment strips running the length of the field. In each treatment strip, the variable rate prescription for the appropriate treatment (100%, 75%, 50% efficiency, or Agronomy Guide level) was loaded into a precision farming software. Based on the location of the sprayer in the field, the software sent the N fertilizer rate for that prescription zone to a sprayer control console, which adjusted the control valve on the sprayer to apply the specific rate of UAN solution.
To measure N status in the corn during the growing season, earleaf samples were collected between tasseling and silking growth stages from 25 plants in each treatment plot on 23 July 2019 at the Rock Springs and Warriors Mark locations, 30 July 2019 at the Danville location and 19 July at the Chambersburg location and measured for N concentration. The late season corn stalk nitrate test was used at the end of the growing season to measure N status of the corn. At approximately the 1/2 milkline growth stage, 15 plants in each treatment strip were sampled by cutting 8″ sections of stalk from 6″ to 14″ above the ground on 17 September 2019 at Rock Springs, 11 September 2019 at Warriors Mark, 26 September at Danville and 3 September at Chambersburg. Samples were further cut into 2″ segments, dried, ground and measured for nitrate concentration.
To determine whether N fertilizer rates that credited soil organic matter and cover crops could achieve similar yields as the Agronomy Guide recommendation, corn yields were measured at the end of the season. At the Rock Springs location, corn grain was harvested with a 6 row combine, at the Warriors Mark, Danville and Chambersburg locations, corn grain was harvested with an 8 row combine. The mass of grain harvested from each treatment plot was measured using a weigh wagon equipped with a digital scale system at the Rock Springs and Warriors Mark locations, trucks driven onto truck scales at the Danville location and a seed tender equipped with load cells at the Chambersburg location. Moisture content was determined on subsamples of grain and reported yields are adjusted to 15.5% moisture.
2018 Results and Discussion
Due to issues with lodging at harvest and a realization that our yield targets in the 2018 growing season were excessive compared to actual yields, there were few significant differences in yield between treatments across the experiments. We also are hesitant to report and interpret earleaf N and stalk nitrate N results from 2018 because the yield targets were excessive, and it was not a good test of the N recommendation system. This is one of the reasons why we repeated the trials in 2019. In 2019, rather than rely on farmer chosen yield goals for use in the N recommendation equations, we used historical yield monitor data, which gave us a spatially variable yield goal based on previously collected data, and removed some of the biases that may go into a farmers chosen yield goal.
2019 Results and Discussion
Nitrogen fertilizer prescription rates varied across the sites in 2019 (Table 1). We hypothesized that the Agronomy Guide N fertilizer recommendation would be the highest of the N rates, however this was only true at the Rock Springs and Danville locations. At the Warriors Mark location, the 50% fertilizer efficiency resulted in a greater average N rate than the Agronomy Guide, and at the Chambersburg location both the 50% and 75% fertilizer efficiencies had greater average N rates than the Agronomy Guide. This was surprising to us, because typically the Agronomy Guide N recommendations are thought to be conservative, meaning they protect against yield losses by usually recommending more N than is actually required. We hypothesized that better accounting for N availability from N mineralization would allow us to lower the N rates. However, Agronomy Guide N recommendations were not built to account for the potential for N immobilization from cover crop residues, nor were they designed to be adjusted based on soil texture, which is a known control on N mineralization. The sites that had higher N recommendations using our new system of equations than the Agronomy Guide had soil textures that were fairly clayey and also high cover crops with relatively high C:N ratios.
| Average Total N Rate (lbs N/ac) | ||||
|---|---|---|---|---|
| Location | ||||
| Treatment | Rock Springs | Warriors Mark | Danville | Chambersburg |
| Agronomy Guide | 160 | 185 | 193 | 109 |
| 50% Efficiency | 130 | 217 | 100 | 154 |
| 75% Efficiency | 98 | 150 | 87 | 145 |
| 100% Efficiency | 66 | 110 | 65 | 104 |
Table 1. Average total nitrogen rate applied in each of the N fertilizer rate treatments at each location.
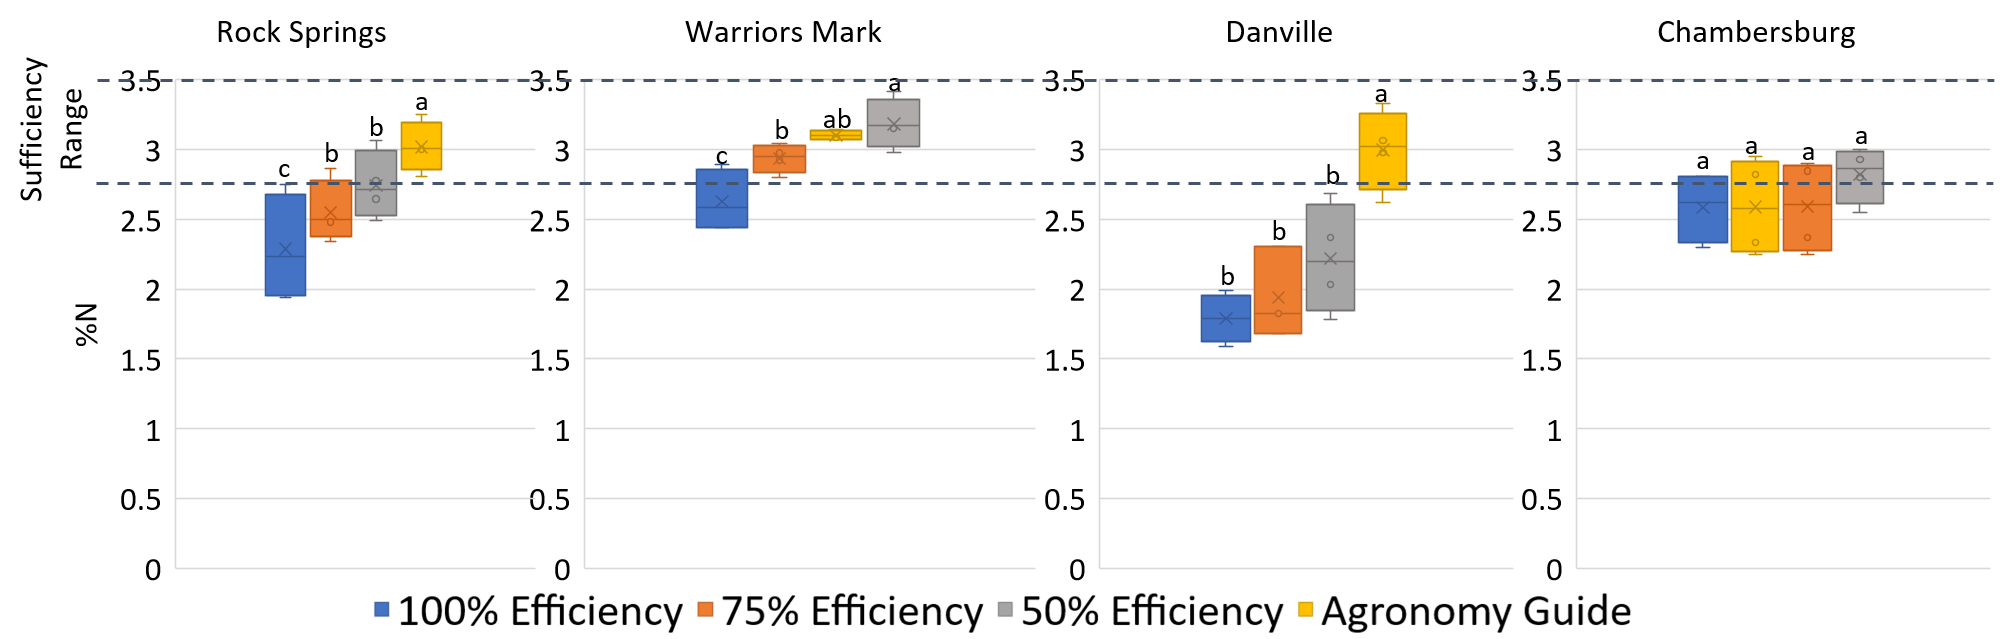
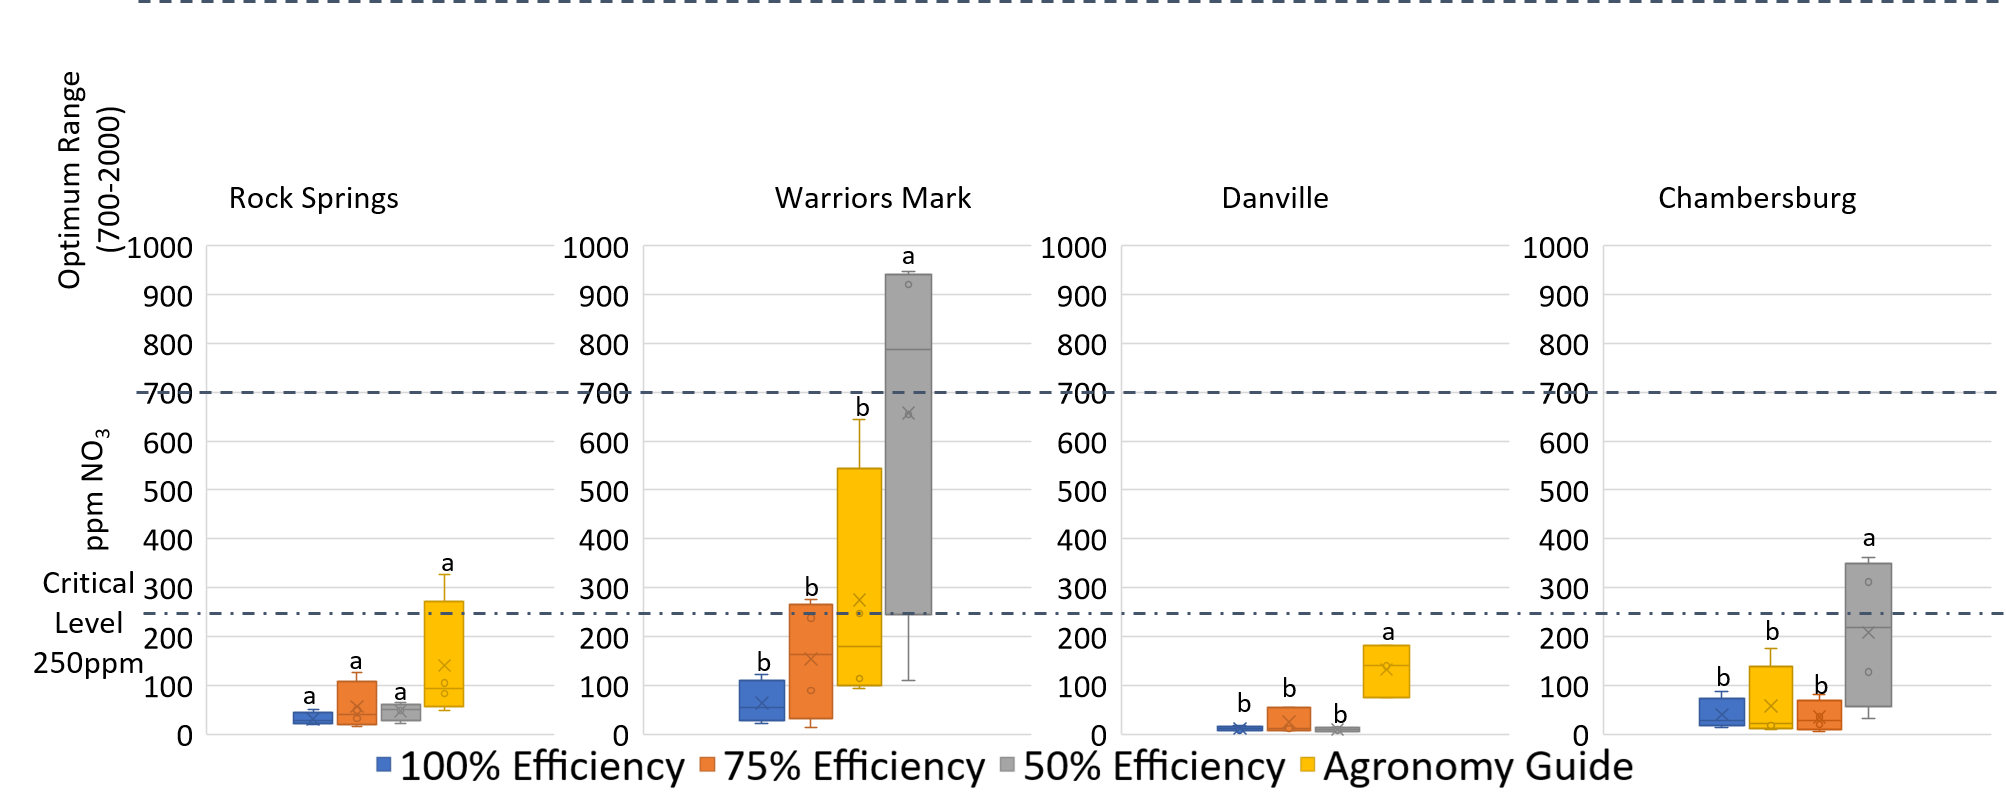
Earleaf nitrogen content increased with increasing N rate at 3 of the 4 locations (Figure 12). At the Rock Springs location, the Agronomy Guide treatment had the greatest earleaf %N and was also the only treatment whose average value was in the sufficiency range. At the Warriors Mark location, the 50% efficiency treatment had the greatest earleaf N content, although it was not statistically greater than that in the Agronomy Guide treatment. The Agronomy Guide, 50% efficiency and 75% efficiency treatments all had average earleaf N content in the sufficiency range. At the Danville location, the Agronomy Guide treatment had the greatest earleaf %N and was the only treatment whose average N content was in the sufficiency range. At the Chambersburg location, there was no statistical difference in earleaf N content between any of the treatments. However, the average %N in the 50% efficiency treatment was in the sufficiency range, while the other 3 treatments’ means were below the range.
For corn stalk nitrate concentration, at the Rock Springs location there were no statistical differences (Figure 13). At the Warriors Mark location, the 50% efficiency treatment had greater average corn stalk nitrate concentration than the other 3 treatments. At the Danville location, the Agronomy Guide treatment had greater average corn stalk nitrate concentration than the other 3 treatments. At the Chambersburg location, the 50% efficiency treatment had greater average corn stalk nitrate concentration than the other 3 treatments. Except for the Agronomy Guide and 50% efficiency treatments at the Warriors Mark location, all of the treatments had average corn stalk nitrate concentration below the critical level.
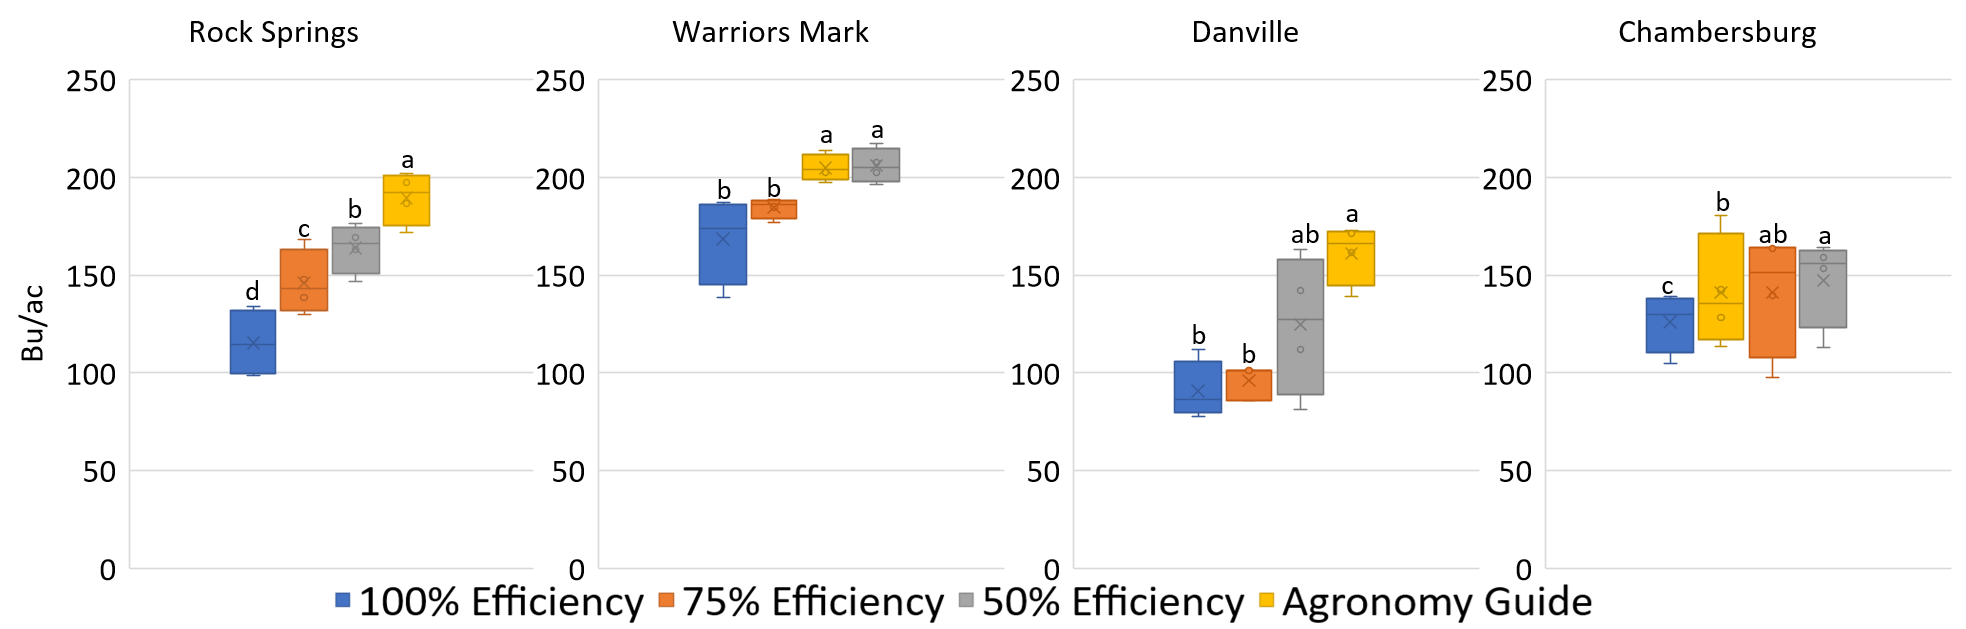
For corn grain yield, at all locations except Rock Springs, the 50% efficiency treatment had statistically similar or greater corn grain yield than the Agronomy Guide treatment (Figure 8). These results suggest that efficiency factors greater than 50% may result in insufficient N rates applied to meet the yield potential.
At the Rock Springs location, corn grain yield was greatest in the Agronomy Guide treatment and decreased with decreasing N rate. At this site, an efficiency factor less than 50% would have been needed to have an N application that sufficiently met the crop N requirements. At the Warriors Mark location, the 50% efficiency treatment had average corn grain yield similar to that in the Agronomy Guide treatment, despite receiving an additional 32 lbs N/ac. This means that an efficiency factor greater than 50%, but less than 75% could potentially have been used. At the Danville location, the 50% efficiency treatment had average corn grain yield similar to that in the Agronomy Guide treatment, but which was numerically 40 bu/ac less than the Agronomy Guide treatment. At Danville, the 50% efficiency treatment received 93 less lbs N/ac than the Agronomy Guide treatment. These results make it unclear whether the 50% efficiency rate was really sufficient, or whether an efficiency factor less than 50% should have been used to maintain sufficient N availability. At the Chambersburg location, the 50% efficiency treatment had average corn grain yield greater than the Agronomy Guide treatment and received 45 lbs N/ac more. It is unclear at this site whether we reached the plateau point of the corn yield response to N additions to determine whether the 50% efficiency rate was truly sufficient to meet the yield potential of the site.
This project demonstrated that it is possible to adapt commercially available precision agriculture equipment to map cover crops and soil texture and use the maps to develop variable rate fertilizer N prescriptions. The research sought to additionally refine the new equations used to calculate an N fertilizer requirement by testing different levels of the fertilizer efficiency term to determine what efficiency factor should be used to result in a nitrogen rate that was sufficient to meet the yield potential at the site. We found that at a 50% efficiency (as compared to 75% or 100% efficiency) performed better across of number of sites, however there is uncertainty as to whether this efficiency factor should be even lower in some cases. Additional research will focus on better methods for determining what efficiency factor to use on site specific conditions. Farmers that participated in this research are excited about continuing to improve this N recommendation system, but with some remaining uncertainty in what efficiency factor to use in the equations, have not widely adopted it on their acreages.
Education & outreach activities and participation summary
Participation summary:
This methods used in this project were the topic of a 1 hr field day presentation at the Penn State Extension Agronomic Diagnostic Clinic (July 18 and 19, 2018), attended by 75 ag service providers, including extension educators, NRCS, and private consultants.
Results from the project were presented at the Pennsylvania 4R Alliance Fall Field Day (October 4, 2018) in Hershey, PA, attended by 60 ag service providers and 20 farmers.
Results from the project were presented as a Water Insights Seminar on the campus of Penn State (October 9, 2018), organized by the Environmental and Natural Resources Institute at Penn State, attended by 15 faculty members, graduate students, and professional staff.
Results from the project were presented at the Northeast Soil Testing Workgroup Meeting in Milford, PA (October 11, 2018), attended by 15 researchers and extension specialists from Land Grant Universities in the Northeast.
Results from the project were presented at the New York Certified Crop Advisors Conference in Syracuse, NY (November 27, 2018) attended by 70 ag service providers and the Mid-Atlantic Crop School in Ocean City, MD (November 21, 2019) attended by 200 ag service providers.
Results from the project were disseminated via a poster presentation at the Agronomy Society Annual Meeting in Baltimore, MD and the Northeast Cover Crop Council Annual Meeting in State College, PA (both November 2018)
A presentation about this project was given at three Penn State Extension Crop Conferences in Union, Bradford, and Indiana Counties in winter 2019, reaching 85 farmers and a twilight meeting in Sunbury, PA in August 2019 reaching 100 farmers.
An online web application was also developed that allows users to input information about the cover crops and soil at their site and use the equations to develop an N fertilizer recommendation.
Power point presentation slides with results from the 2018 research sites
Learning Outcomes
Yield responses to applied nitrogen fertilizer on their own fields. How to use greenseeker sensors to estimate cover crop N.
Project Outcomes
One additional outcome of the grant was that two graduate students were able to be recruited with funds from the Penn State Plant Science department to conduct the on-farm work of the project. In addition to the on-farm work, they were able to replicate the study at the research station. The Greenseeker equipment purchased with Northeast SARE funds was used for mapping the cover crop NDVI at the research station but other expenses (time and analytical costs) were paid for separately.
Results from this project were also used to develop a multi-state multidisciplinary grant proposal to the USDA Sustainable Agricultural Systems initiative ($10 million proposal) focused on nutrient use efficiency in the Chesapeake Bay that was funded, with approximately $500,000 of the grant allocated to advancing the N recommendation system that credits cover crops and soil organic matter. Collaborations in Maryland and Delaware have also been fostered based on the concepts of this NE-SARE project, for which a research proposal to the 4R Research Fund has been developed (PI, Charlie White, Co-PIs Gurpall Toor and Amy Shober). The 4R Research Fund proposal was not funded, but this same team went on to develop an NRCS-CIG proposal to test various in-season adaptive N management tools that was funded. The NRCS-CIG grant includes the cover crop and soil organic matter N crediting system tested in this research as one of the components, with approximately $220,000 allocated to Penn State to advance the work. Finally, two National Fish and Wildlife Foundation grants were funded to focus on building a soil health coalition in Pennsylvania, one activity of which is to continue testing and validation the new N recommendation system through on-farm trials.
There were two aspects that surfaced during the process of conducting this research which informed how we modified research in later years of this project and moving forward. The first aspect is in how to determine a yield goal for a particular field. This is a critical issue because the N recommendation is very heavily weighted on the yield goal for the site. In the first year of the project, we asked farmers what they thought the yield goal should be at the site. Both on-farm collaborators provided yield goals that were significantly greater than was actually achieved at the sites. Because of the high yield goals, our N prescriptions were also high, and we exceeded crop need for N and did not see any differences between treatments. So I think our N recommendations will only every be as good as our prediction of what the yield will be at a site, which poses a real challenges. I think some farmers may tend to be overoptimistic in what their yield potential is at a site, or take the best yielding area of a field and extrapolate it out to the whole field. In the second year of the study, rather than asking farmers for their "feeling" of what the yield goal was on each field, we asked for historical yield maps so that we could make the decisions about the yield goals based on the data. This led us to project yield goals that were much closer to what was actually achieved at the site.
The other aspect of our methods that proved to be elusive was determining the correct fertilizer efficiency to use in the equations. We were expecting that fertilizer efficiencies close to 100% could be achieved through improved crediting of cover crops and soil organic matter. However, in the second year of our study, our results suggested that 50% efficiency provided the best results, but that this factor may need to be even lower. There is also evidence to suggest from our other research work that this efficiency factor may depend on how large of a yield gap there is between fertilized and unfertilized corn yield predictions in our equations. Further research should focus on how to best determine the fertilizer efficiency in a recommendation system like the one we tested here.