Final report for ONE21-391
Project Information
This project aimed to determine if mycorrhizae could be incorporated into either edge of or in field studies in an organic farm that includes crop rotation and tilling in order to contribute to increased crop yield and P mitigation.
In year 1 methods involved growing out viable endemic mycorrhizae and publishing a guide on how to do so while also experimenting with a haphazard technique (lower effort and economic output for farmer) of inoculation on the edges of tilled fields in how it may affect crop yield, soil, and water P concentrations. Year 2 methods involved comparing this endemic mycorrhizae to commercial mycorrhizae and no mycorrhizae in field trials involving growing parsley in plots of polyculture cover crops. We aimed to determine if treatment effected crop yield, soil, and water P.
Results from year 1 indicated that the haphazard technique of inoculation was ineffective and that growing mycorrhizae in pot cultures from nearby wild areas is an economically accessible and low time commitment endeavor that is worth the investment as is indicated in the the Growing Local Mycorrhizal Inoculum, A Guide and Insights from a Field Trial. we published (Kolba et al., 2022). Other notable findings from year 1 are that land management strategies do affect P concentrations across the landscape. The lowest P concentrations in soil and water were in the most wild, untouched areas of the farm while the highest P concentrations in soil and water were in the tilled fields where P had been applied for several years in the past. Results from year 2 indicated that applying endemic mycorrhizae in field trials did not result in any statistically significant differences in soil, water, or crop P concentrations nor in crop yields among the three treatments. While there were several trends discussed in the data section of this report, the overall conclusion is that mycorrhizae fungi are most effectively applied in agricultural endeavors where the land is not going to be tilled and where soil structure is needed to mitigate P runoff, minimize erosion, and increase green infrastructure stability.
Our assessment of the usefulness of the results is context dependent.
Growing endemic mycorrhizae. Organic farms that are focused on production using typical tillage (subsoil, disk, cultivate) and seed bed preparation may not benefit from applications of mycorrhizae. However, mycorrhizae grown from soils in wild buffers surrounding farm fields could be applied to rejuvenate fields when they are being converted to no-till management or to production of perennial fruit, nut, and shrub production. This may improve field resilience.
Application of endemic mycorrhizae. For agricultural operations such as our partner farm, Diggers’ Mirth, which is a commercial vegetable farm focused on production and are working in fragile floodplains (prone to flooding once or twice per decade; i.e. summer 2011 and 2023), application of mycorrhizae is minimally effective. Together extensive tilling and the inevitable flooding of their fields likely destroys mycorrhizal communities through tearing apart below ground networks and killing the above ground hosts. However, if endemic inoculum could be protected from multiple stressors, fields may become more resilient. We suggest that any endemic mycorrhizae be applied in areas where they have a chance to develop. This may occur in perennial areas of the farm not prone to tillage nor fertilization and where robust above ground floral communities flourish so these areas can serve as endemic mycorrhizal banks.
Phosphorus mitigation via mycorrhizae. Results from both years (year 1 experiment involving the haphazard inoculation technique and year 2 comparing commercial, vs endemic vs control) suggest that phytoremediation of P through harvesting one crop, even when enhanced by mycorrhizae, cannot effectively reduce P in one season. Research by others indicates it would take several seasons to see noticeable effects when conditions allow (i.e. no tilling, no flooding..) (Meals et al., 2010; Hamilton, 2012; Sharpley et al., 2013). Similarly, while polyculture cropping most likely increases mycorrhizal inoculation, it is not practical for production farms.
Findings from this research to better match the Intervale’s (land area in which this farm is nested) management practices and site specificity could focus on areas that this and other farms are willing to dedicate to perennials. If flora was cyclically harvested annually (i.e. edible fruit, nuts, herbs, willow sprigs..), P can be removed over time (Rubin and Görres, 2022a). In this way mycorrhizal networks can continue to grow without being disturbed, P can be removed each year, floral species can endure floods, and communities can harvest various food, medicine, and materials. This suggests longer term research into mycorrhizae’s effects in these farm ecosystem areas needs to occur.
Citations
Gerdemann, J.W., Nicolson, T.H., 1963. Spores of mycorrhizal Endogone species extracted from soil by wet sieving and decanting. Transactions of the British Mycological Society 46, 235–244. doi:10.1016/S0007-1536(63)80079-0
Hamilton, S.K., 2012. Biogeochemical time lags may delay responses of streams to ecological restoration. Freshwater Biology 57, 43–57. doi:10.1111/j.1365-2427.2011.02685.x
Kolba, L., Rubin, J., Görres, J., 2022. Growing Local Mycorrhizal Inoculum, A Guide and Insights from a Field Trial. NESARE, Burlington VT.
Johnson, N.C., 2010. Resource stoichiometry elucidates the structure and function of arbuscular mycorrhizas across scales. New Phytologist 185, 631–647. doi:10.1111/j.1469-8137.2009.03110.x
Johnson, N.C., Graham, J.H., 2013. The continuum concept remains a useful framework for studying mycorrhizal functioning. Plant and Soil 363, 411–419. doi:10.1007/s11104-012-1406-1
Meals, D.W. et al., 2010. Lag Time in Water Quality Response to Best Management Practices: A Review. Journal of Environment Quality 39, 85–96.
Rubin, J.A., Görres, J.H., 2022a. The effects of mycorrhizae on phosphorus mitigation and pollinator habitat restoration within riparian buffers on unceded land. Restoration Ecology 31, e13671. doi:10.1111/rec.13671
Rubin, J.A., Görres, J.H., 2022b. Effects of mycorrhizae, plants, and soils on phosphorus leaching and plant uptake: Lessons learned from a mesocosm study. PLANTS, PEOPLE, PLANET 4, 403–415. doi:10.1002/ppp3.10263
Rubin, J.A., Görres, J.H., 2021. Potential for Mycorrhizae-Assisted Phytoremediation of Phosphorus for Improved Water Quality. International Journal of Environmental Research and Public Health 18, 7. doi:10.3390/ijerph18010007
Sharpley, A., Jarvie, H.P., Buda, A., May, L., Spears, B., Kleinman, P., 2013. Phosphorus Legacy: Overcoming the Effects of Past Management Practices to Mitigate Future Water Quality Impairment. Journal of Environmental Quality 42, 1308–1326. doi:10.2134/jeq2013.03.0098
Project Objectives
After exploring the field, our farm partner cropping/tilling schedule, and learning that our intended inoculation technique of just applying soil from a wild area (hereafter referred to as: haphazard inoculation) is not a best practice, we revised our initial objectives and work plan.
Our original objectives were:
Overarching objective: to facilitate mycorrhizal colonization of tilled soils by creating “mycorrhizal banks” from where mycorrhizae spread into fields and increase crop phosphorus efficiency.
Specific Objectives:
- Test whether mycorrhizae spread into a field from the mycorrhizal bank
This will be tested by extracting and counting mycorrhizal hyphae in soil at different distances from the bank. This will offer information on optimal spacing between banks. We hypothesize mycorrhizae are more abundant close to banks but will spread further over time.
2. Test whether plant phosphorus (P) content varies with distance from mycorrhizal banks.
We hypothesize plant P decreases with distance from banks and is positively correlated with mycorrhizal hyphal counts.
3. Test whether soil (WEP-SRP) water extractable P varies with distance from bank edges and whether it is correlated with mycorrhizal densities and plant P uptake.
We hypothesize: a. water extractable P concentrations will be lower closer to banks b. mycorrhizal hyphal densities will be higher closer to banks. C. plants closer to banks will have increased P uptake.
4. Test how much P is in coppiced woody vegetation grown in the mycorrhizal bank.
We hypothesized based on mesocosm studies we conducted it will vary between species.
Our updated objectives were:
Overarching objectives:
- to facilitate mycorrhizal colonization of tilled soils by creating “mycorrhizal banks” (from adjacent wild buffers) of polyculture cover crops in which parsley is planted to test for P uptake efficiency
- to grow endemic mycorrhizae from wild buffers adjacent to the field for the farm to incorporate in year 2.
Year 1 field research tested:
- Effect of wild buffer inoculum (haphazard technique) on mycorrhizal bank in terms of mycorrhizal populations (spore counts, root colonization, extra radical hyphal length) by gathering baseline and end of harvest season data on mycorrhizal populations in N vs S wild buffers adjacent to field (from which mycorrhizal inoculum was gathered) and from corresponding N vs S field banks.
- Effect of mycorrhizal bank (haphazard inoculated) on soil P (TP & Mehlich-3), & WEP-SRP concentrations by gathering baseline beginning and end of harvest season data in N & S wild and field buffers
- Effect of mycorrhizal bank (haphazard inoculated) on parsley P uptake by testing whether plant P content varies within bank treatment (inoculated vs uninoculated areas via haphazard technique)
Year 1 Greenhouse research tested:
1.Effect of N wild buffer soil vs S wild buffer soil on inoculum viability by growing pot cultures of endemic mycorrhizae from buffers on either side of the field and testing viability at harvest.
Year 2: Field Research compares the effect on parsley yield, P uptake, WEP-SRP, and soil P concentrations (TP & Mehlich-3) of wild cultured endemic mycorrhizae to commercial mycorrhizae and no mycorrhizae. The mycorrhizal bank we installed in year 1 remained surrounding the field but was not part of our research.
Year 2 Field trials tested:
- Is there a difference in the soil P between the endemic, commercial and control plots?
- Is there a difference in the water P between the endemic, commercial and control plots?
- Is there a difference in the plant P between the endemic, commercial and control plots?
- Is there a difference in the colonization of the parsley roots between the endemic, commercial and control plots?
Original objectives were changed because the farm’s tilling cycle would kill mycorrhizae growing into the field and the haphazard technique of inoculation was not considered effective. So we instead installed perennial cover crop banks on the field edges, applied the haphazard inoculation technique to see if it works and tested soil (TP & Mehlich-3) and water (WEP-SRP), mycorrhizae, and parsley P within this context, while growing endemic mycorrhizae from the wild buffers for year 2. We eliminated the objective of woody shrubs since this was not practical for the farm machinery access needed. Justin Geibel and VYCC originally slated to participate in the project were replaced with intern support planting, scything banks installed along the field edges, and assisting with sampling.
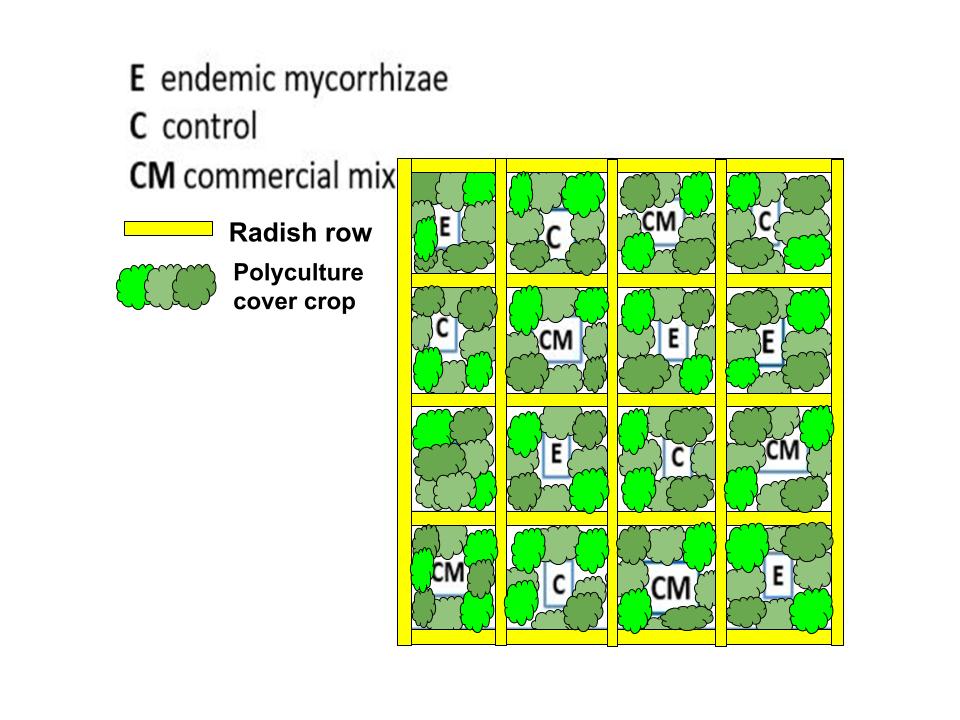
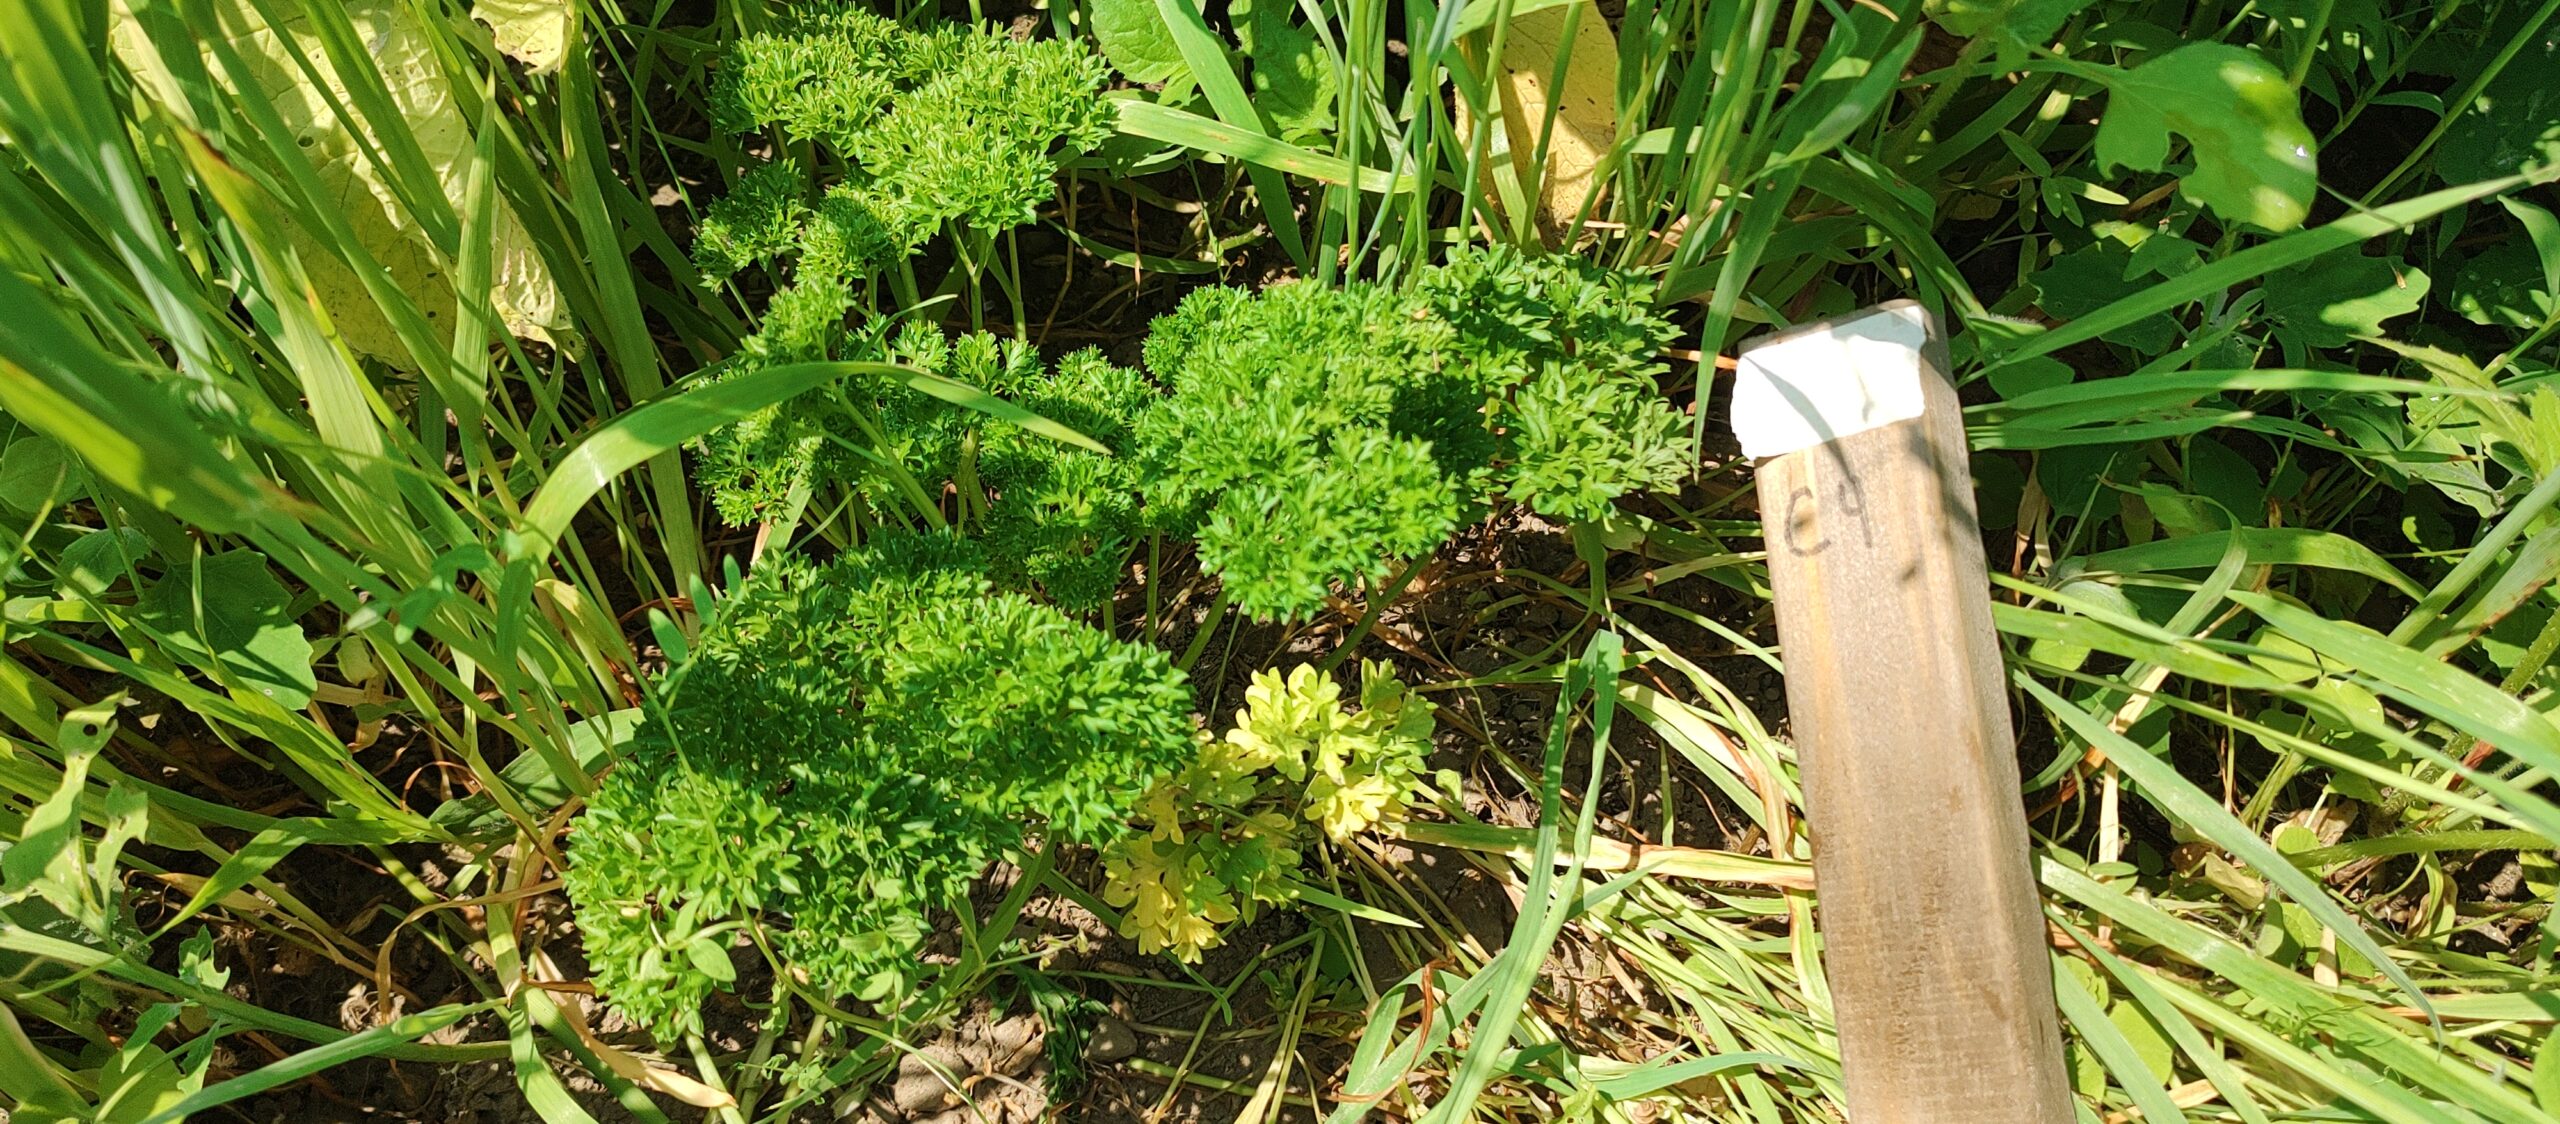
Attached is for Year 1 the revised mycorrhizal bank design (Image 1), greenhouse endemic inoculant growing design (Image 2), and Year 2 field research trials (Image 3).

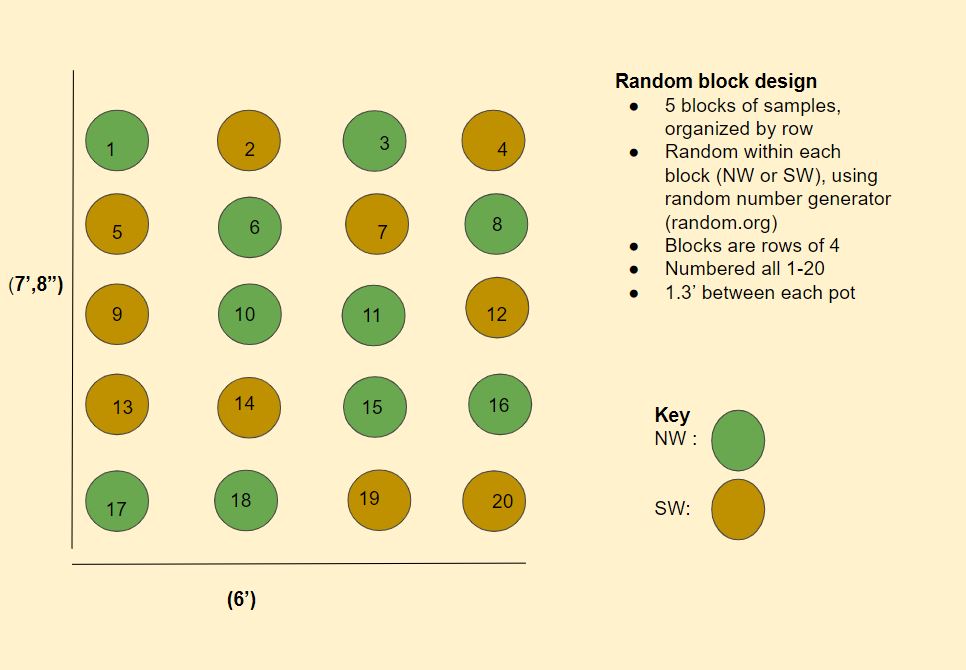
Image 3. Year 2 Field research design.
Mycorrhizae is an important part of agroecosystems although modern agriculture, including some forms of sustainable agriculture, impedes their effects. They affect mineral nutrition, crop disease resistance and drought tolerance and yet they are not promoted in agriculture (Plenchette et al., 2005). They are symbionts with over 80% of crop plants (Gosling et al., 2006). Plants provide photosynthetic carbon compounds to mycorrhizal fungi and in return the fungi provide nutrients that are difficult for the plant to access. Phosphorus (P), a macro-nutrient needed in relatively large amounts for plant growth, is involved in the exchange between the plant and the mycorrhizal symbionts. However, phosphorus also gets tightly bound to Fe and Al oxides and upon application quickly becomes unavailable. Promoting mycorrhizae can help increase P accessibility by extending the roots’ reach within the soil, by promoting decomposition and in facilitating desorption of phosphorus.
The low availability of P in soil is one part of the phosphorus story. The other is that P is often exported to water bodies as eroded sediments. In the water column of a lake P can cause algal blooms which malaffect aquatic trophic web health, impair drinking water quality and decrease recreational value of the water. Often toxic blue-green algae are part of the blooms necessitating beach closures. Mycorrhizae can help reduce soil phosphorus and thus lower the risk of P water contamination (Rubin and Görres, 2021).
One problem that we address is that many agroecosystems, in particular those that are tilled, have lower mycorrhizal densities which reduces the level of services they are able to provide. Short of transitioning fields to no-till systems, mycorrhizal crop plants may encounter fewer mycorrhizae rendering the symbiosis less effective. This then lowers the P use efficiency of the plants which in turn holds more P in the soil to be available for polluting lakes and streams through soil erosion. We propose to test the idea of mycorrhizal reserves, or banks, i.e., set aside lands that are maintained as a diverse natural community likely to support a diverse mycorrhizal community. These reserves will allow mycorrhizae to spread and recolonize fields after events that reduce mycorrhizal densities: such as tillage, fallow or flooding. This principle has been demonstrated in lands covered in mine tailings (Johnson, 1998) but has not been used in agriculture.
Our farm partner, Diggers’ Mirth, has recently transitioned away from using high phosphorus composted chicken manure, and has fields excessive in P. This affords us the opportunity to test several research questions regarding mycorrhizal reserves. While originally, we were going to test how far into the field do mycorrhizae expand from the edge of the reserve, we realized this is no longer possible since their intermittent tilling practices (according to other studies and the literature) will kill mycorrhizae. A previous mesocosm research project we conducted in preparation for this project (Rubin and Görres, 2022) indicated that plant mycorrhizal symbiosis can still occur in excessive P conditions. We were curious to know three things. 1. Can soil from wild buffers laden with arbuscular mycorrhizal plants effectively inoculate a bank created on the field edge planted with a cover-crop polyculture? 2. Do endemic mycorrhizae grown from wild buffers adjacent to the field affect P cycling in soil, soil water, and parsley crop? 3. How will soil P, water P, and parley P uptake differ between treatments in which soil is uninoculated, or inoculated with endemic or commercial mycorrhizae?
Our objectives aim to refine arbuscular mycorrhizae cultivation techniques for farmer use, to investigate effects of endemic mycorrhizae on soil P, soil water P, and parsley P uptake, to better understand how mycorrhizae can support farms in P cycling efficiency, and to discern if mycorrhizae can be applied in field trails effectively to furthur this understanding.
Sources Cited
Gosling, P., Hodge, A., Goodlass, G., Bending, G.D., 2006. Arbuscular mycorrhizal fungi and organic farming. Agriculture, Ecosystems & Environment 113, 17–35. doi:10.1016/j.agee.2005.09.009
Johnson, N., Anne--Cressey McGraw, 1998. The role of vesicular-arbuscular mycorrhizae in the reclamation of taconite mine tailings. Agriculture, Ecosystems & Environment 21, 135–142.
Plenchette, C., Clermont-Dauphin, C., Meynard, J.M., Fortin, J.A., 2005. Managing arbuscular mycorrhizal fungi in cropping systems. Canadian Journal of Plant Science 85, 31–40. doi:10.4141/P03-159
Rubin, J.A., Görres, J.H., 2021. Potential for Mycorrhizae-Assisted Phytoremediation of Phosphorus for Improved Water Quality. International Journal of Environmental Research and Public Health 18, 7. doi:10.3390/ijerph18010007
Rubin, J.A., Görres, J.H., 2022. Effects of mycorrhizae, plants, and soils on phosphorus leaching and plant uptake: Lessons learned from a mesocosm study. PLANTS, PEOPLE, PLANET 4, 403–415. doi:10.1002/ppp3.10263
Cooperators
- (Educator and Researcher)
- - Producer
- (Educator and Researcher)
Research
In year 1
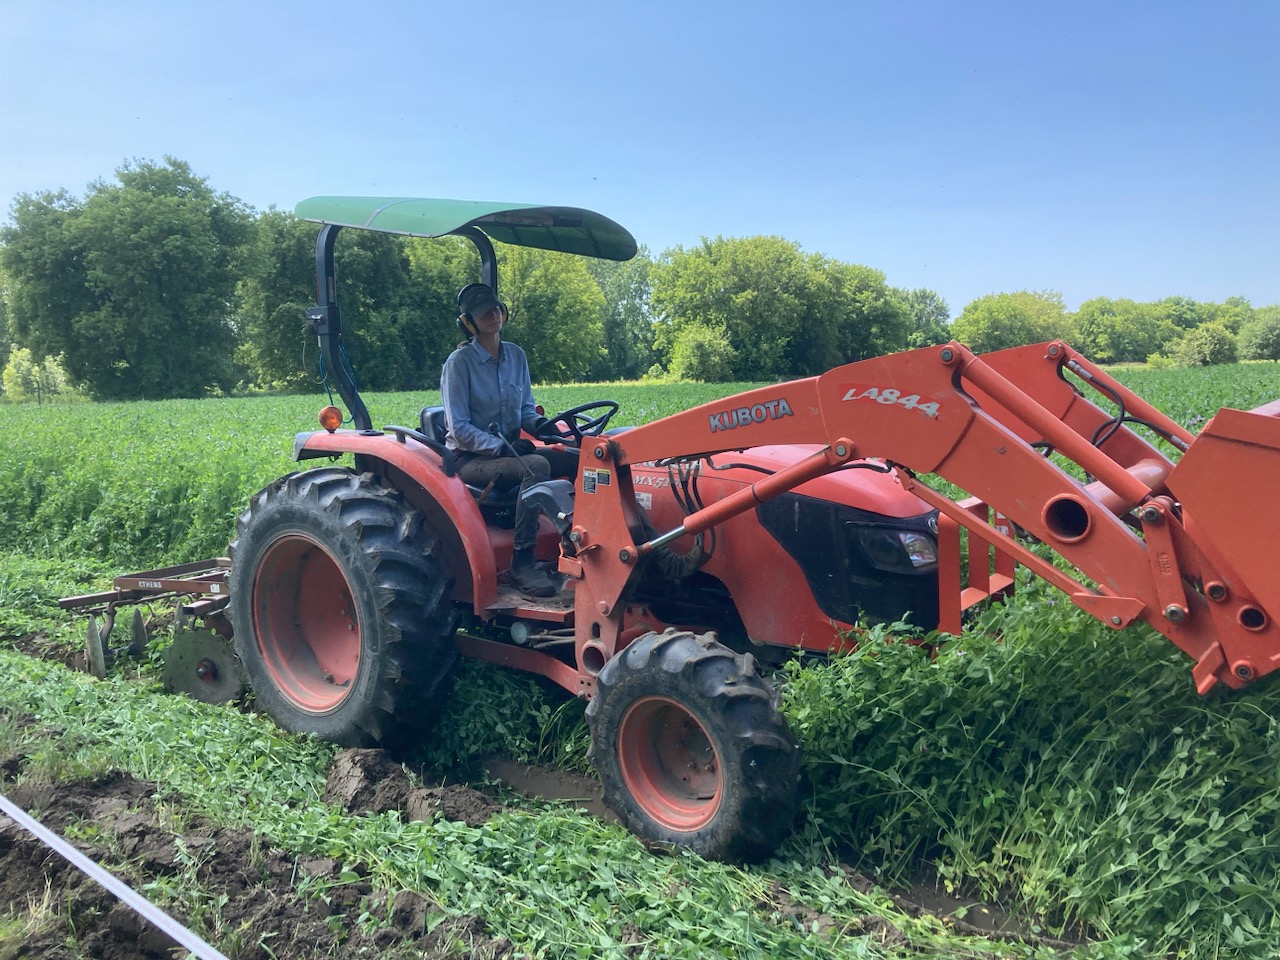
The revised research plan was to establish mycorrhizal banks of polyculture cover crops on the North and South sides of a field. The field we selected (44.501 N, -72.325 W) is located on Winooski series very fine sandy loam. Soil in the Winooski series is moderately well drained. The area is level and becomes flooded occasionally in the spring time when heavy rains and snow melt coincide. The field is conventionally plowed and prepared with 4 foot wide seed beds stretching perpendicular from the edge of the planned mycorrhizae bank. The field is amended with organic fertilizers. The crops grown in the field this year were lacinato and green kale brussel sprouts, nappa cabbage, daikon, and baby bock choi which incidentally are all nonmycorrhizal.
Year 1 Field Installation & Testing
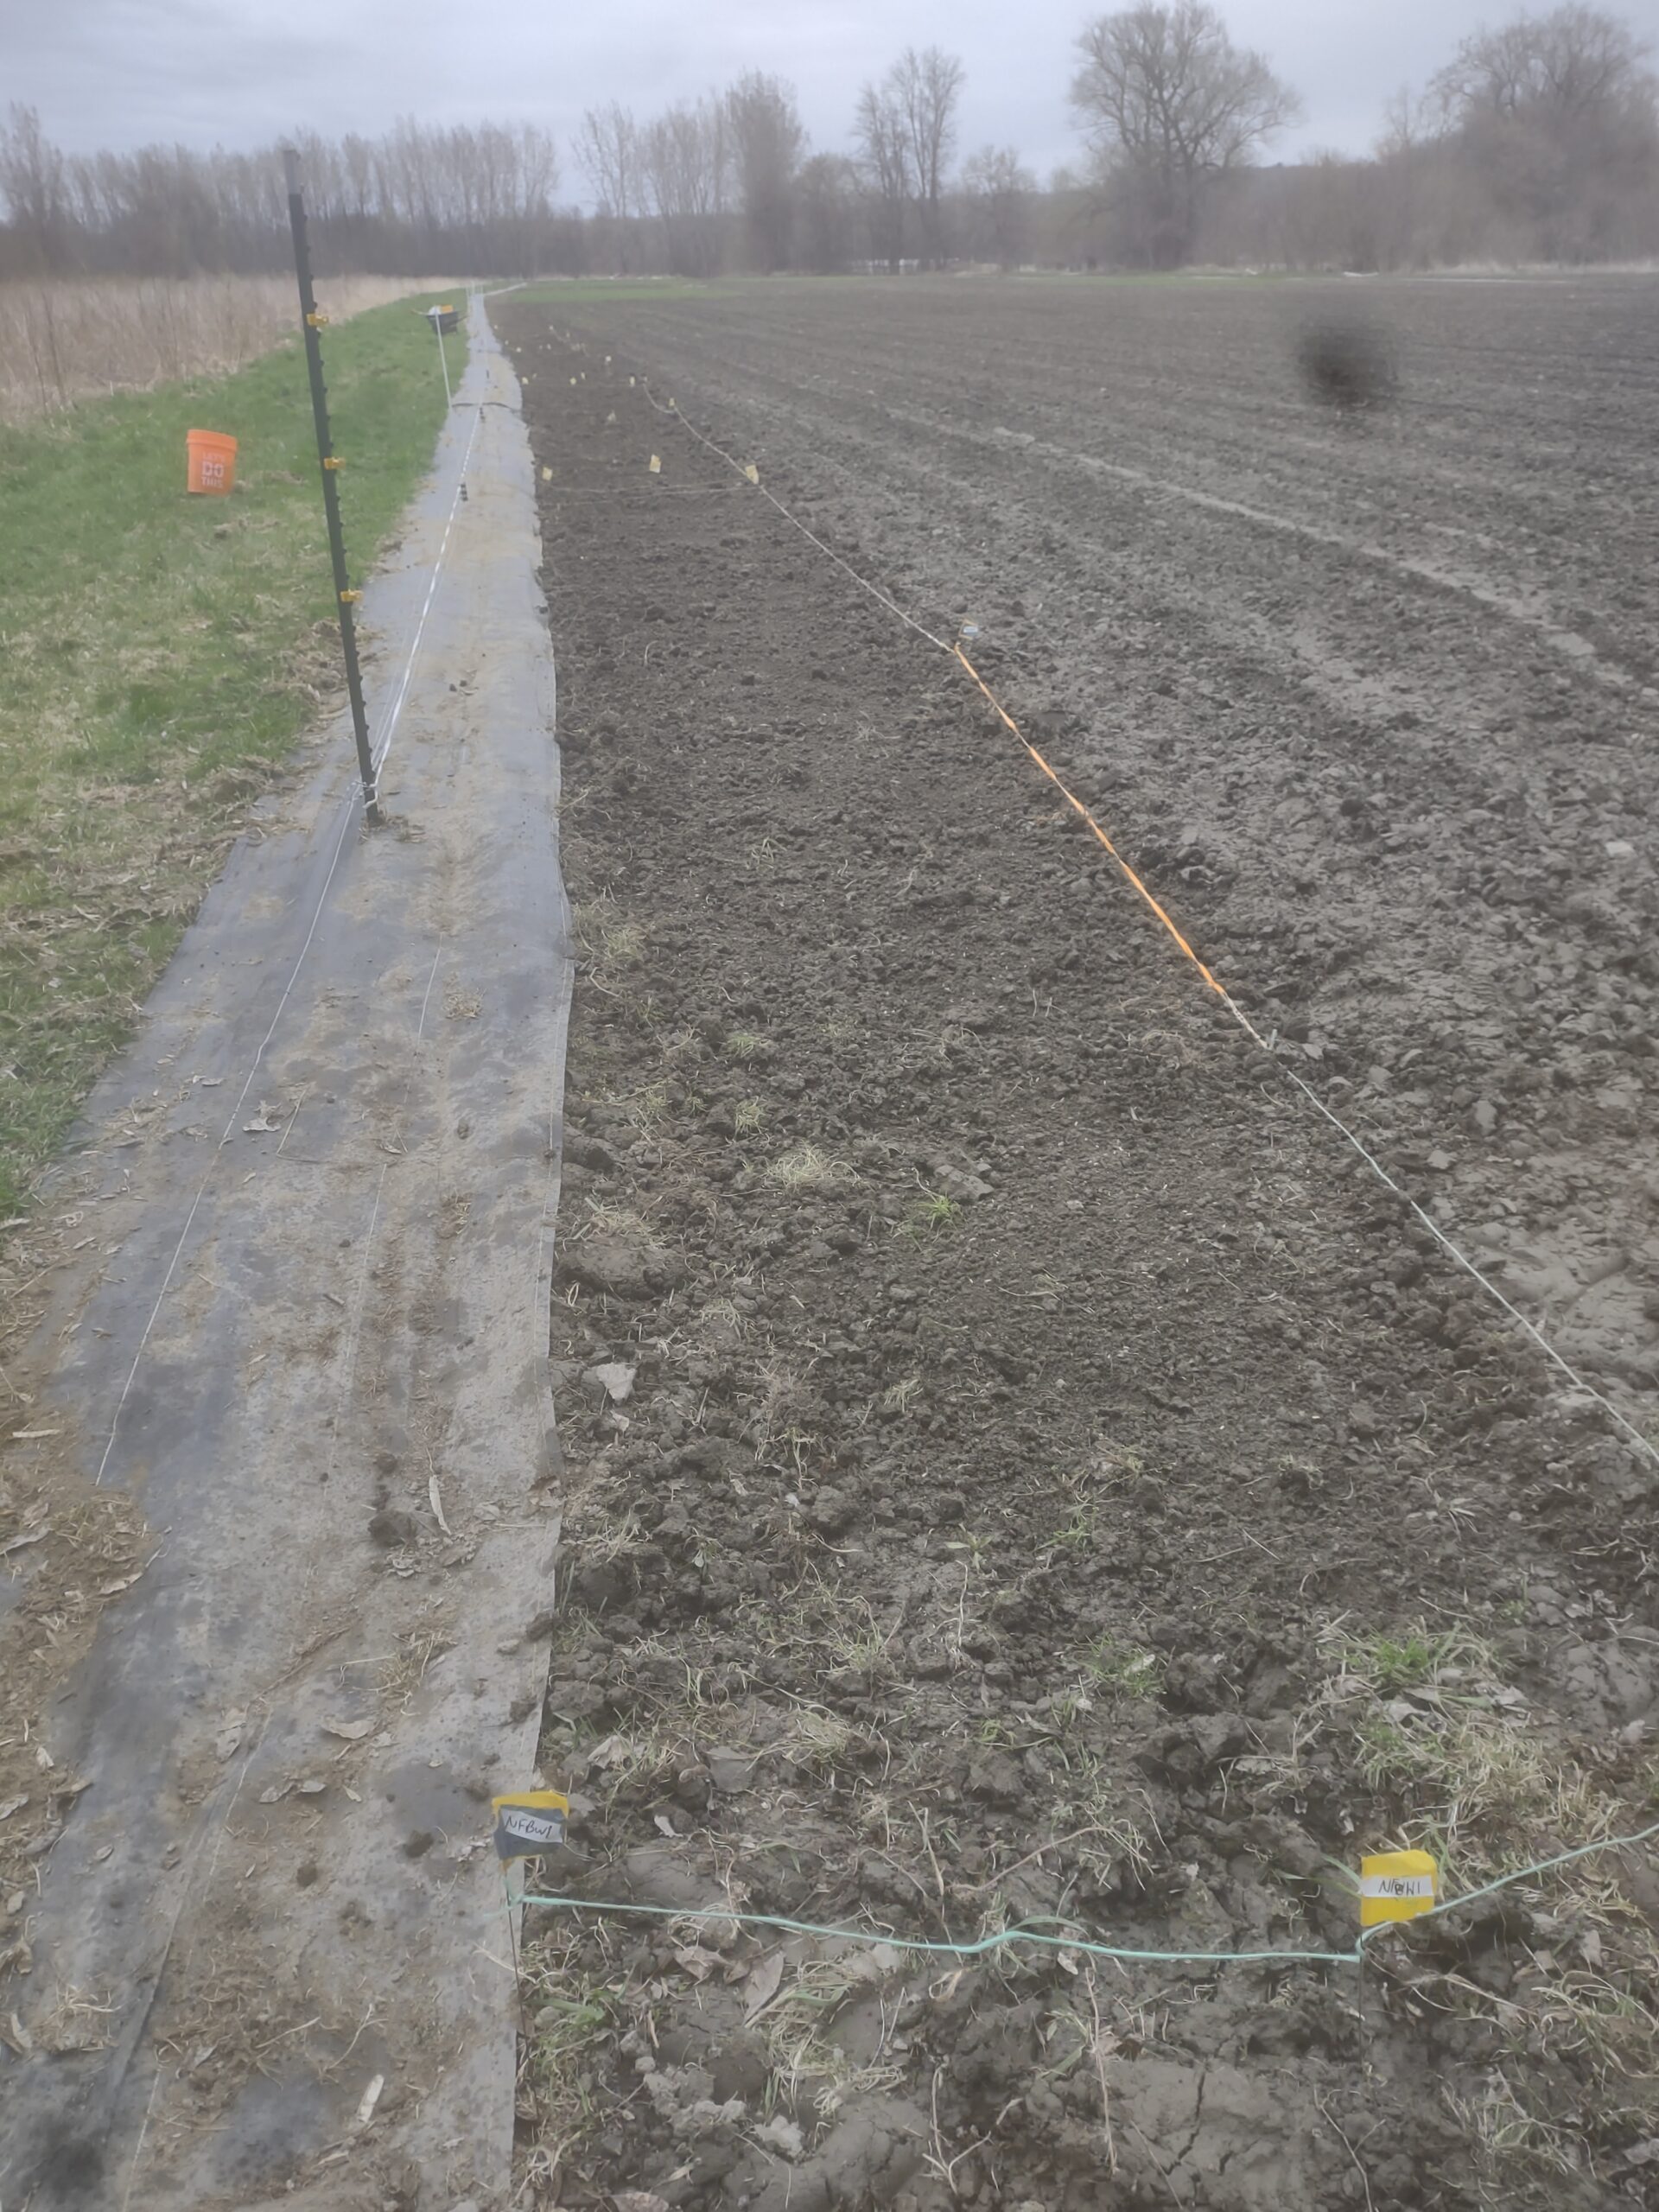
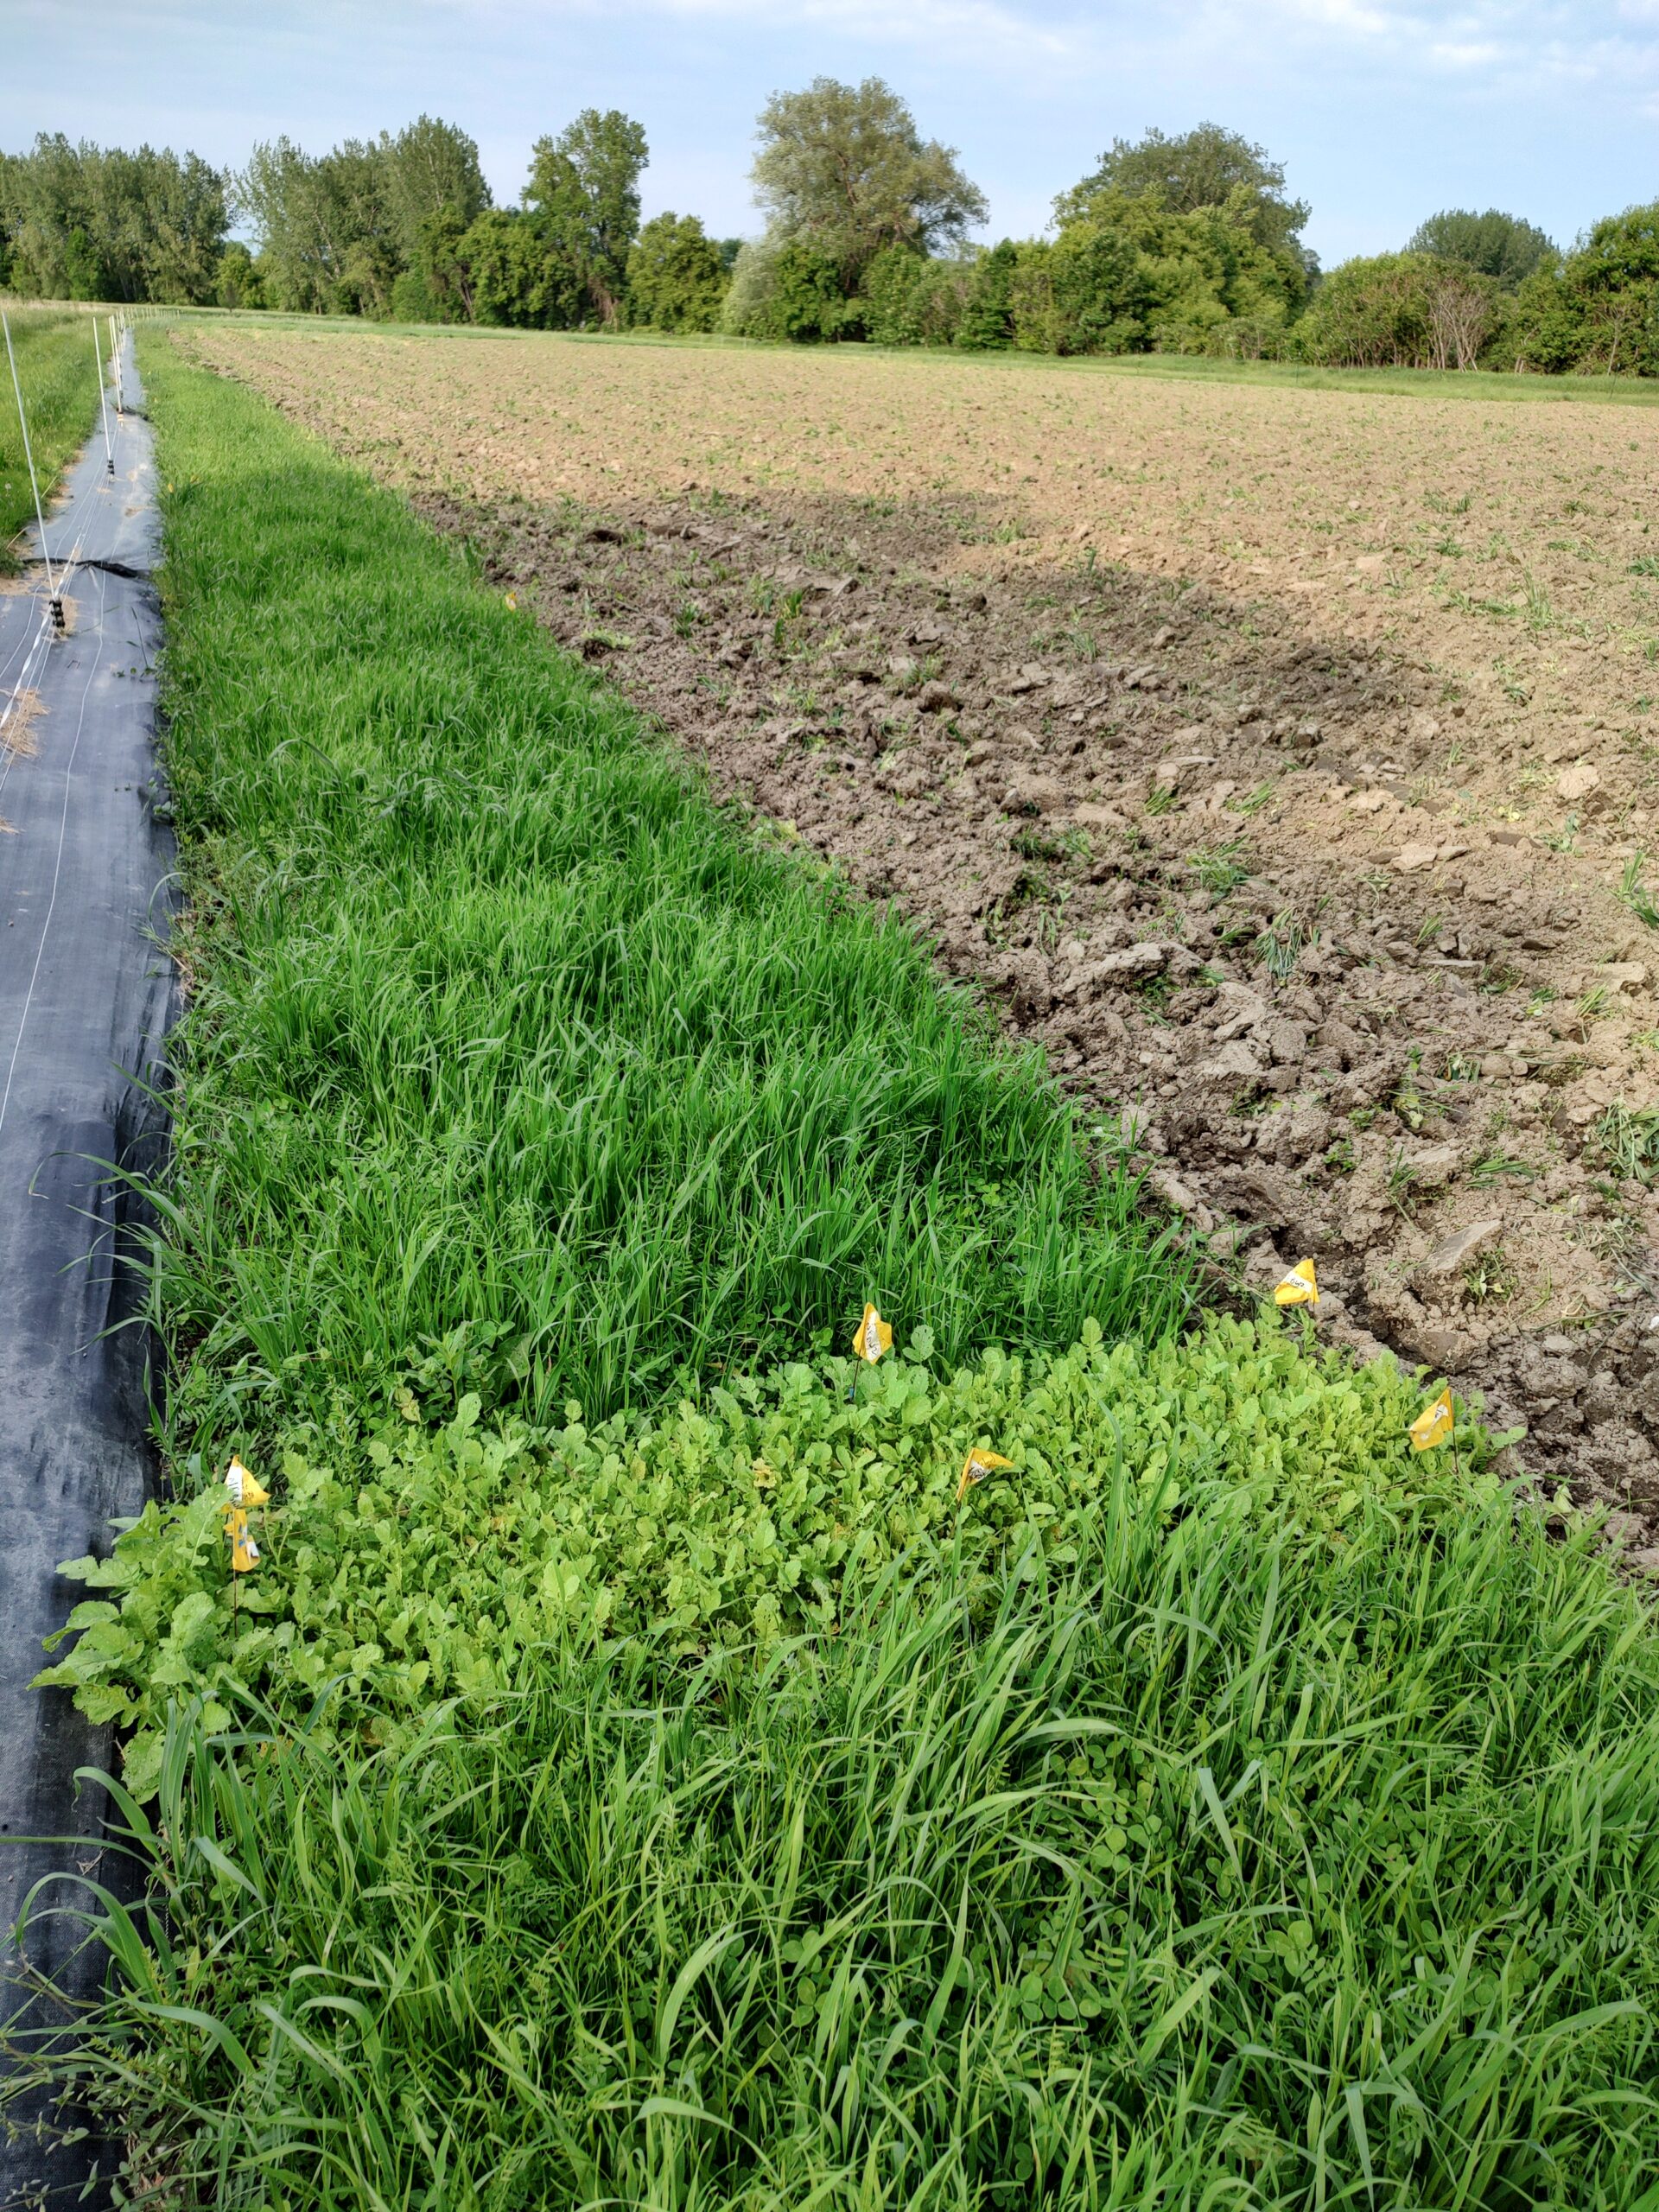
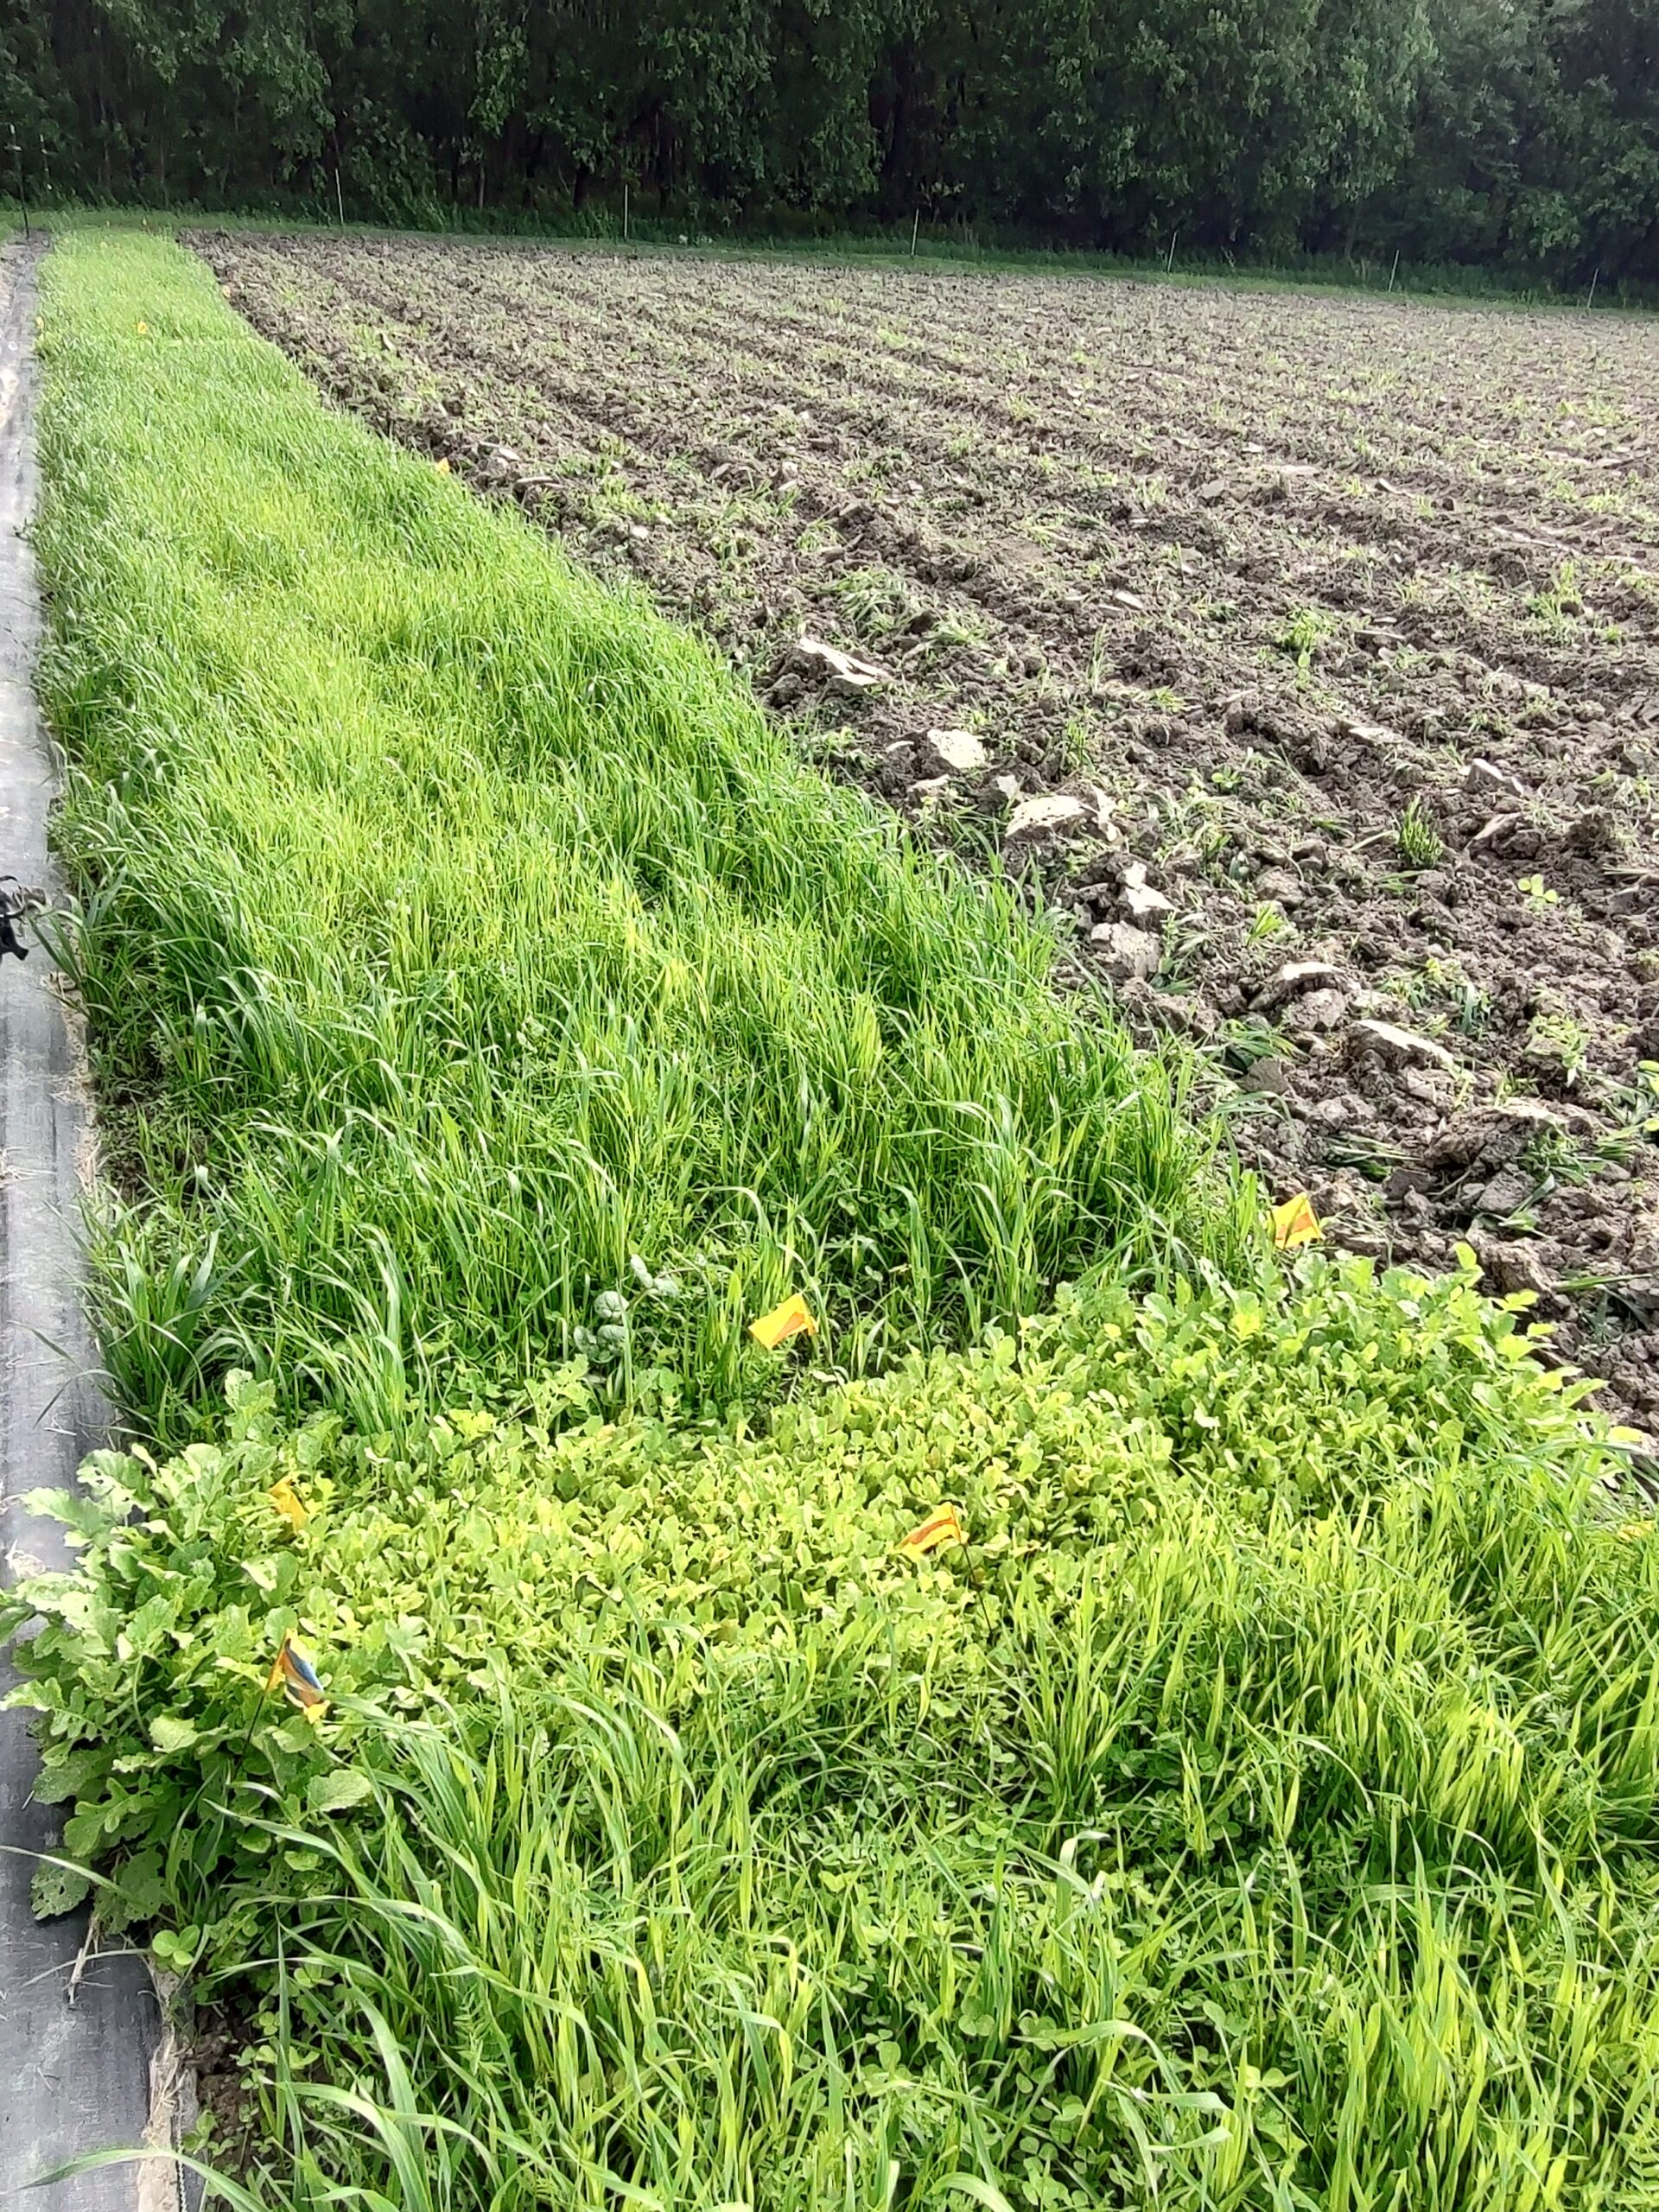
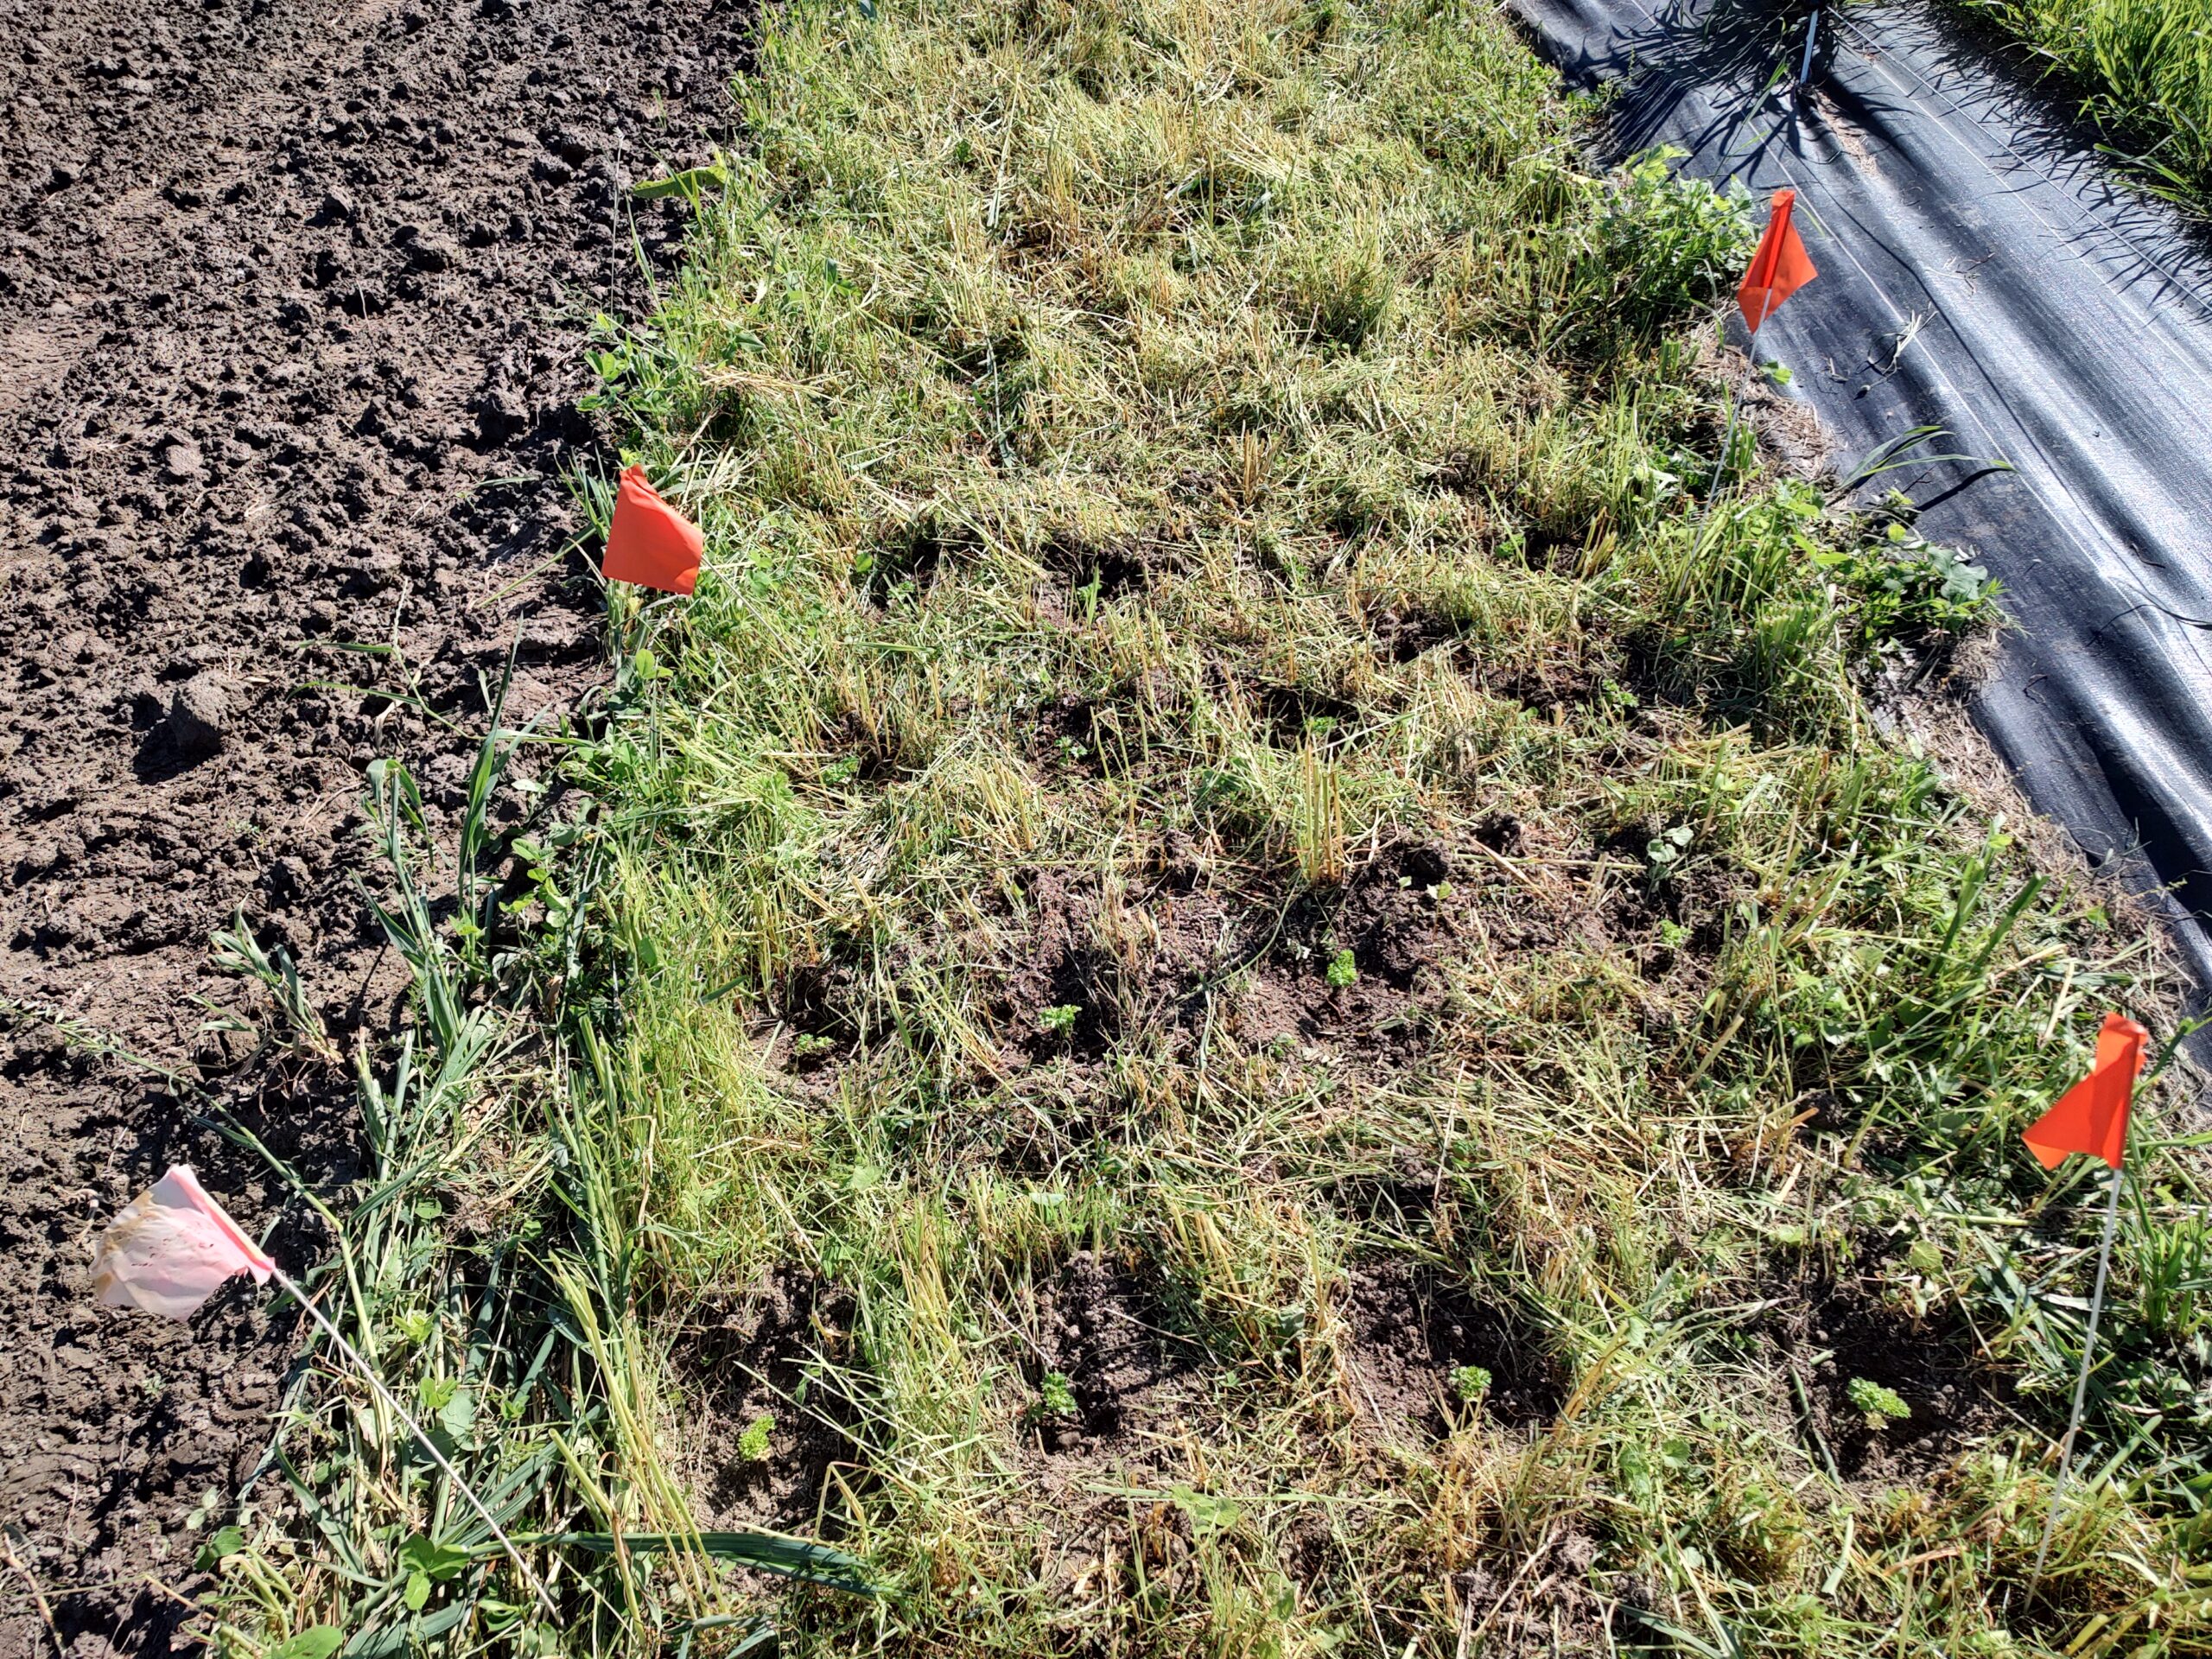
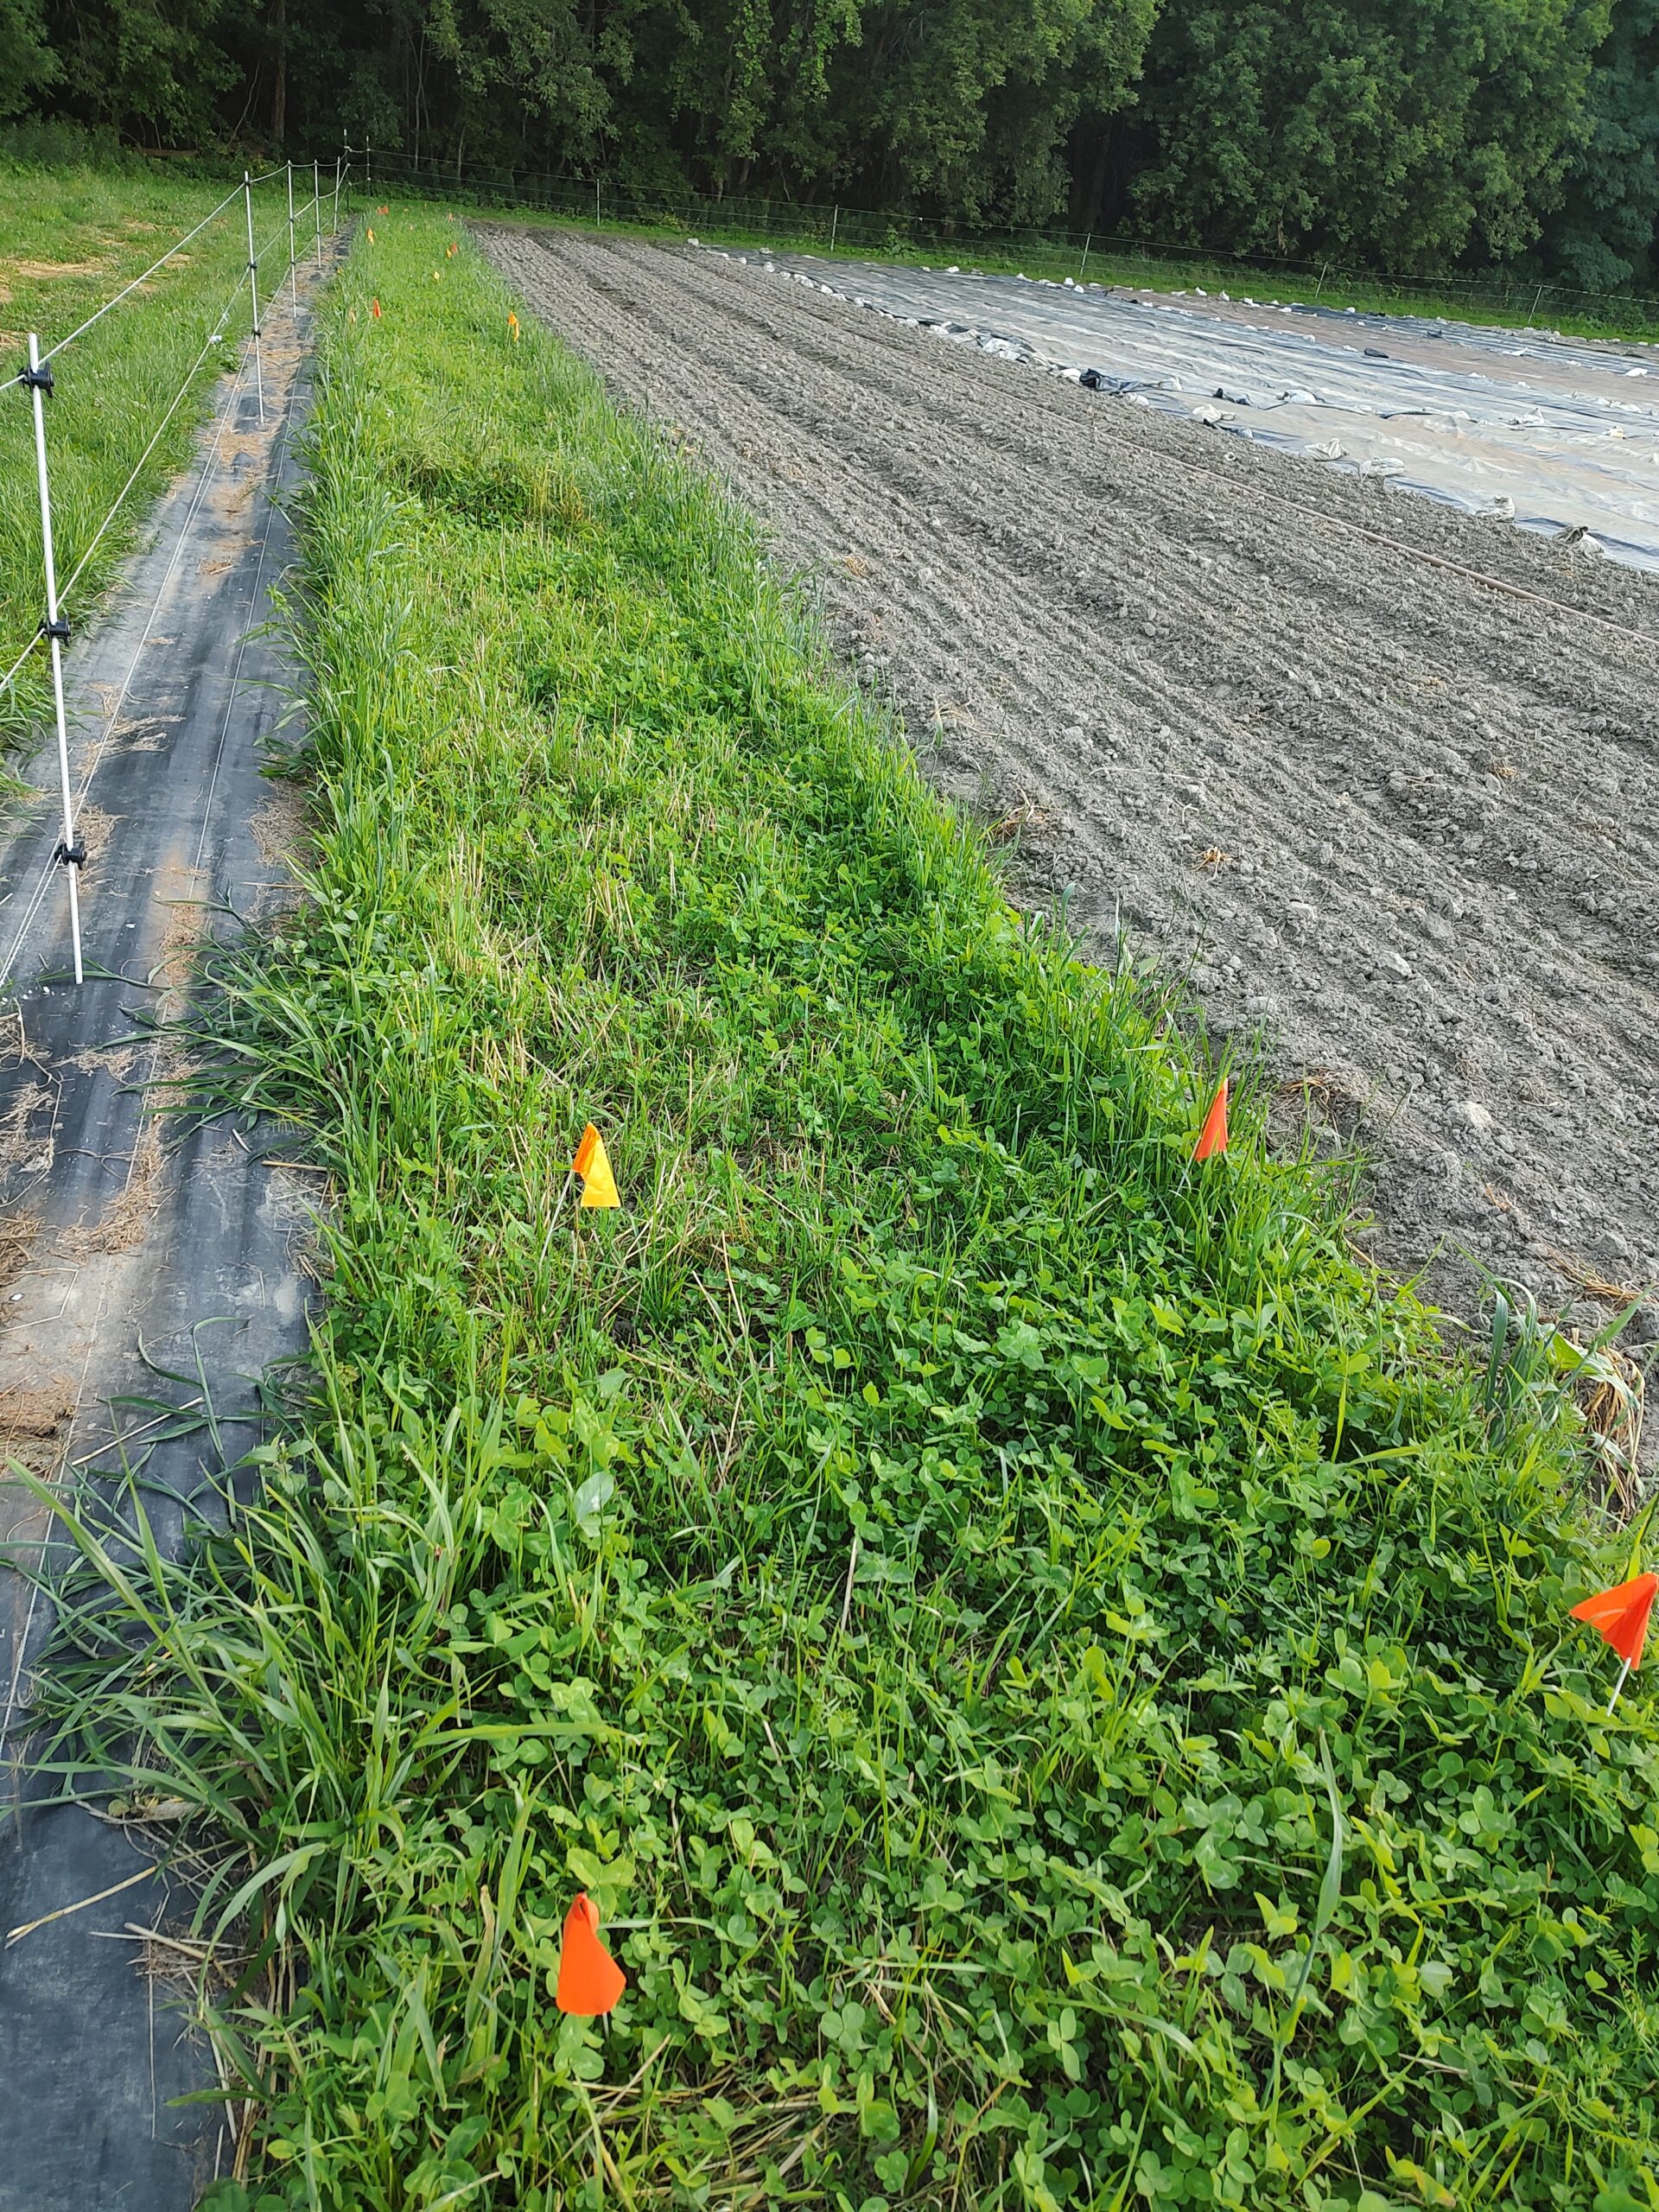
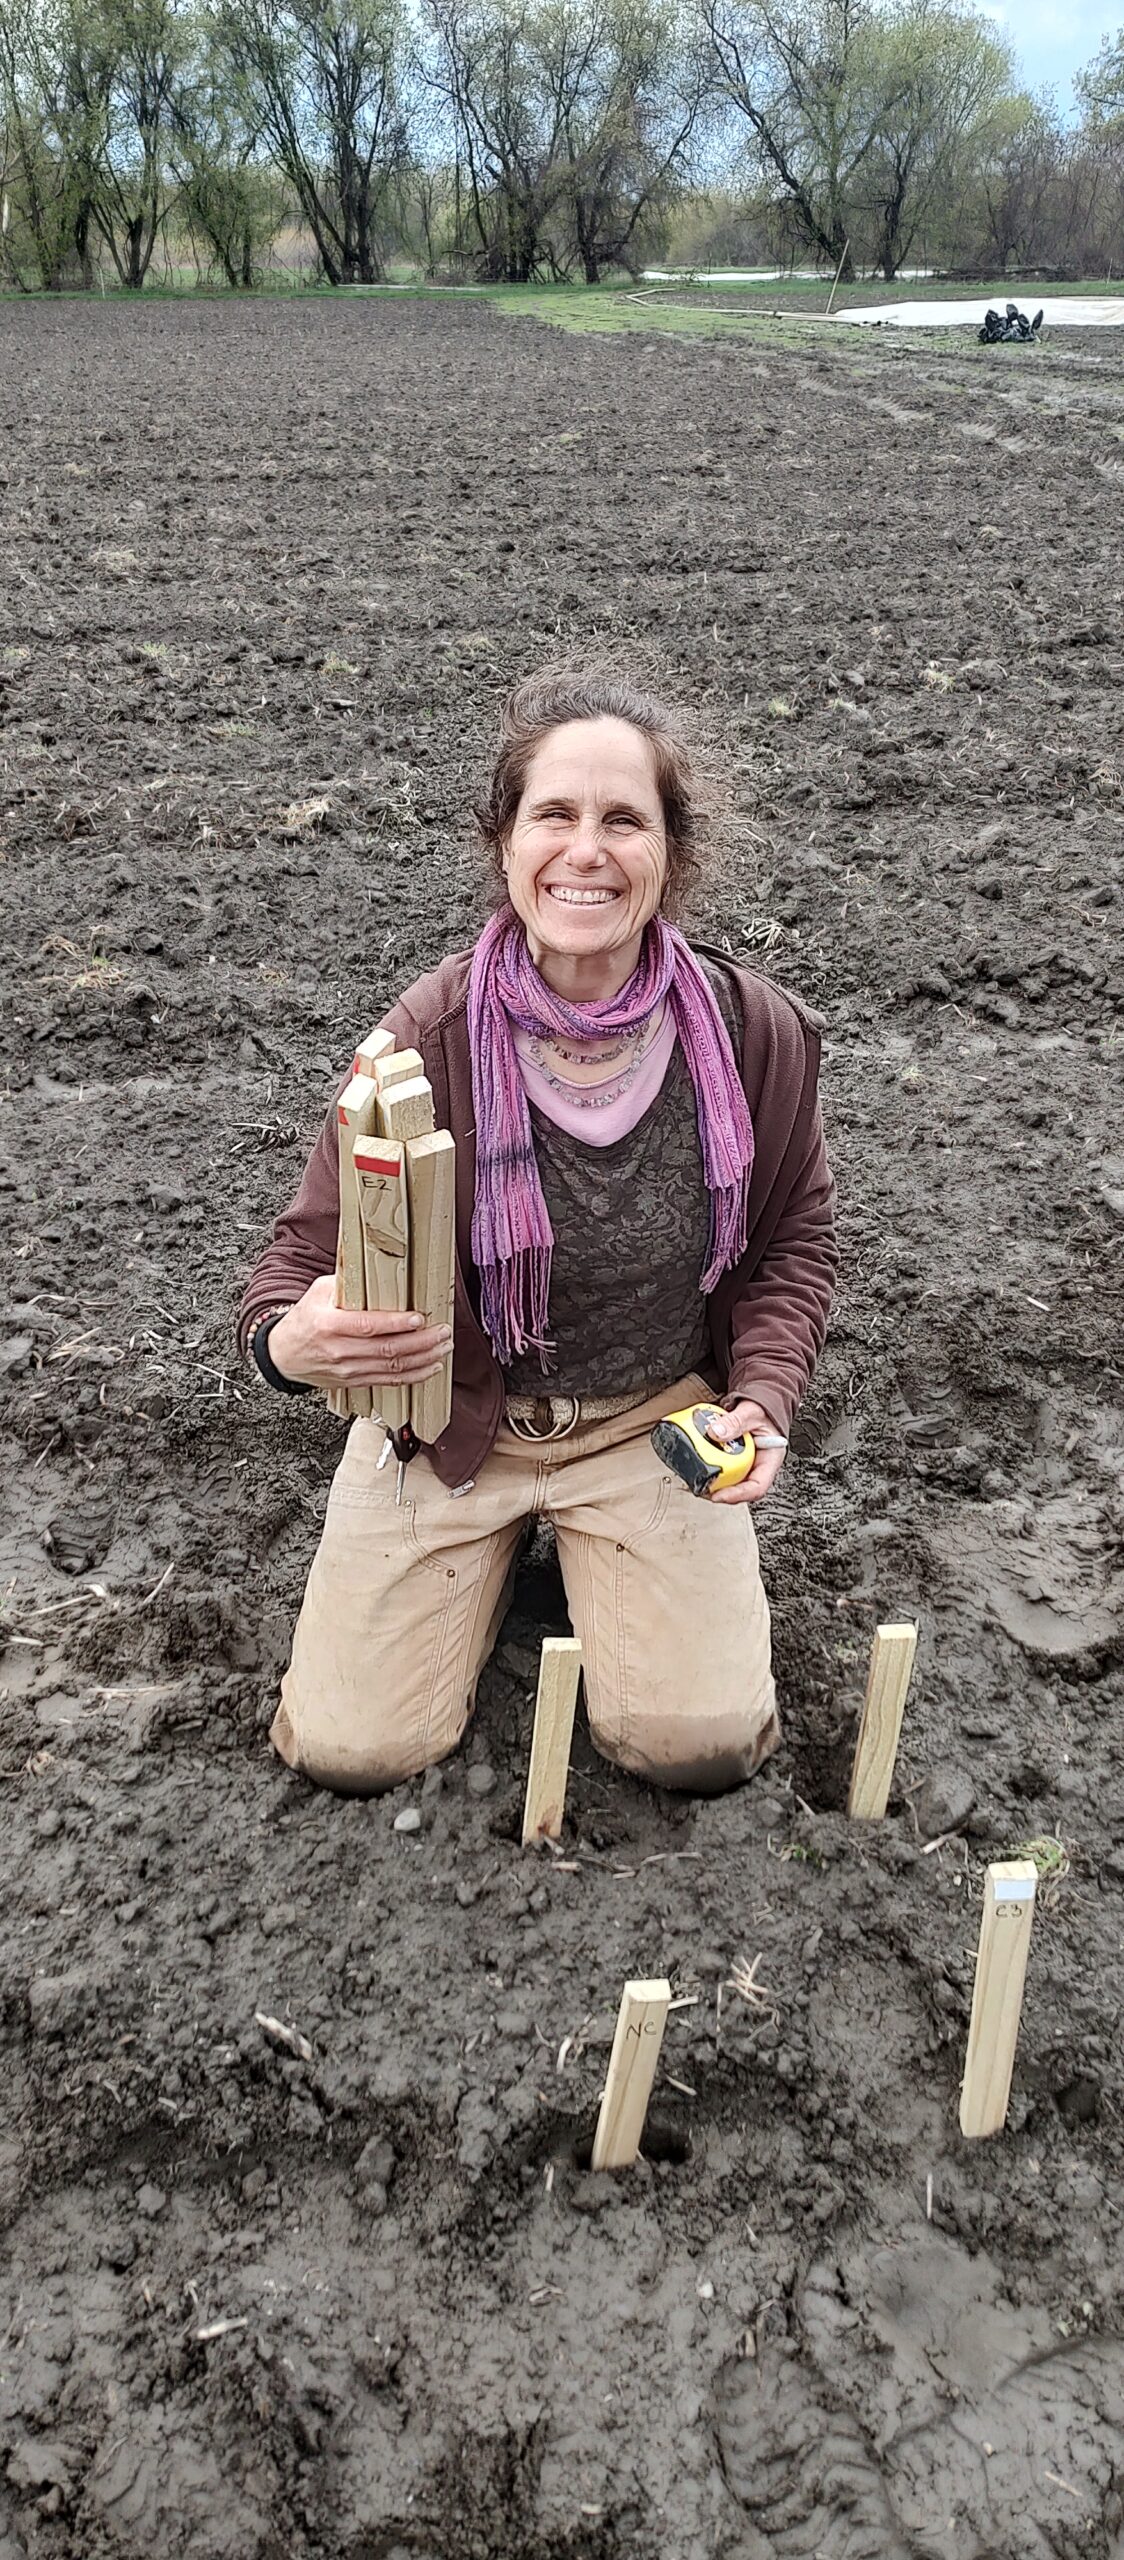
As indicated in the design (Image 1), the mycorrhizal bank is 5 ft wide and 970 ft long on the North and South Sides of the field. In year 1 field research objective 1, testing the haphazard technique of wild buffer inoculation involved first measuring out the mycorrhizal bank areas, gathering initial composite soil samples to test for Mehlich-3 extractable P, Total P, WEP-SRP ( SOPs avaialable upon request). The areas on both sides of the field (Images 4 & 5)
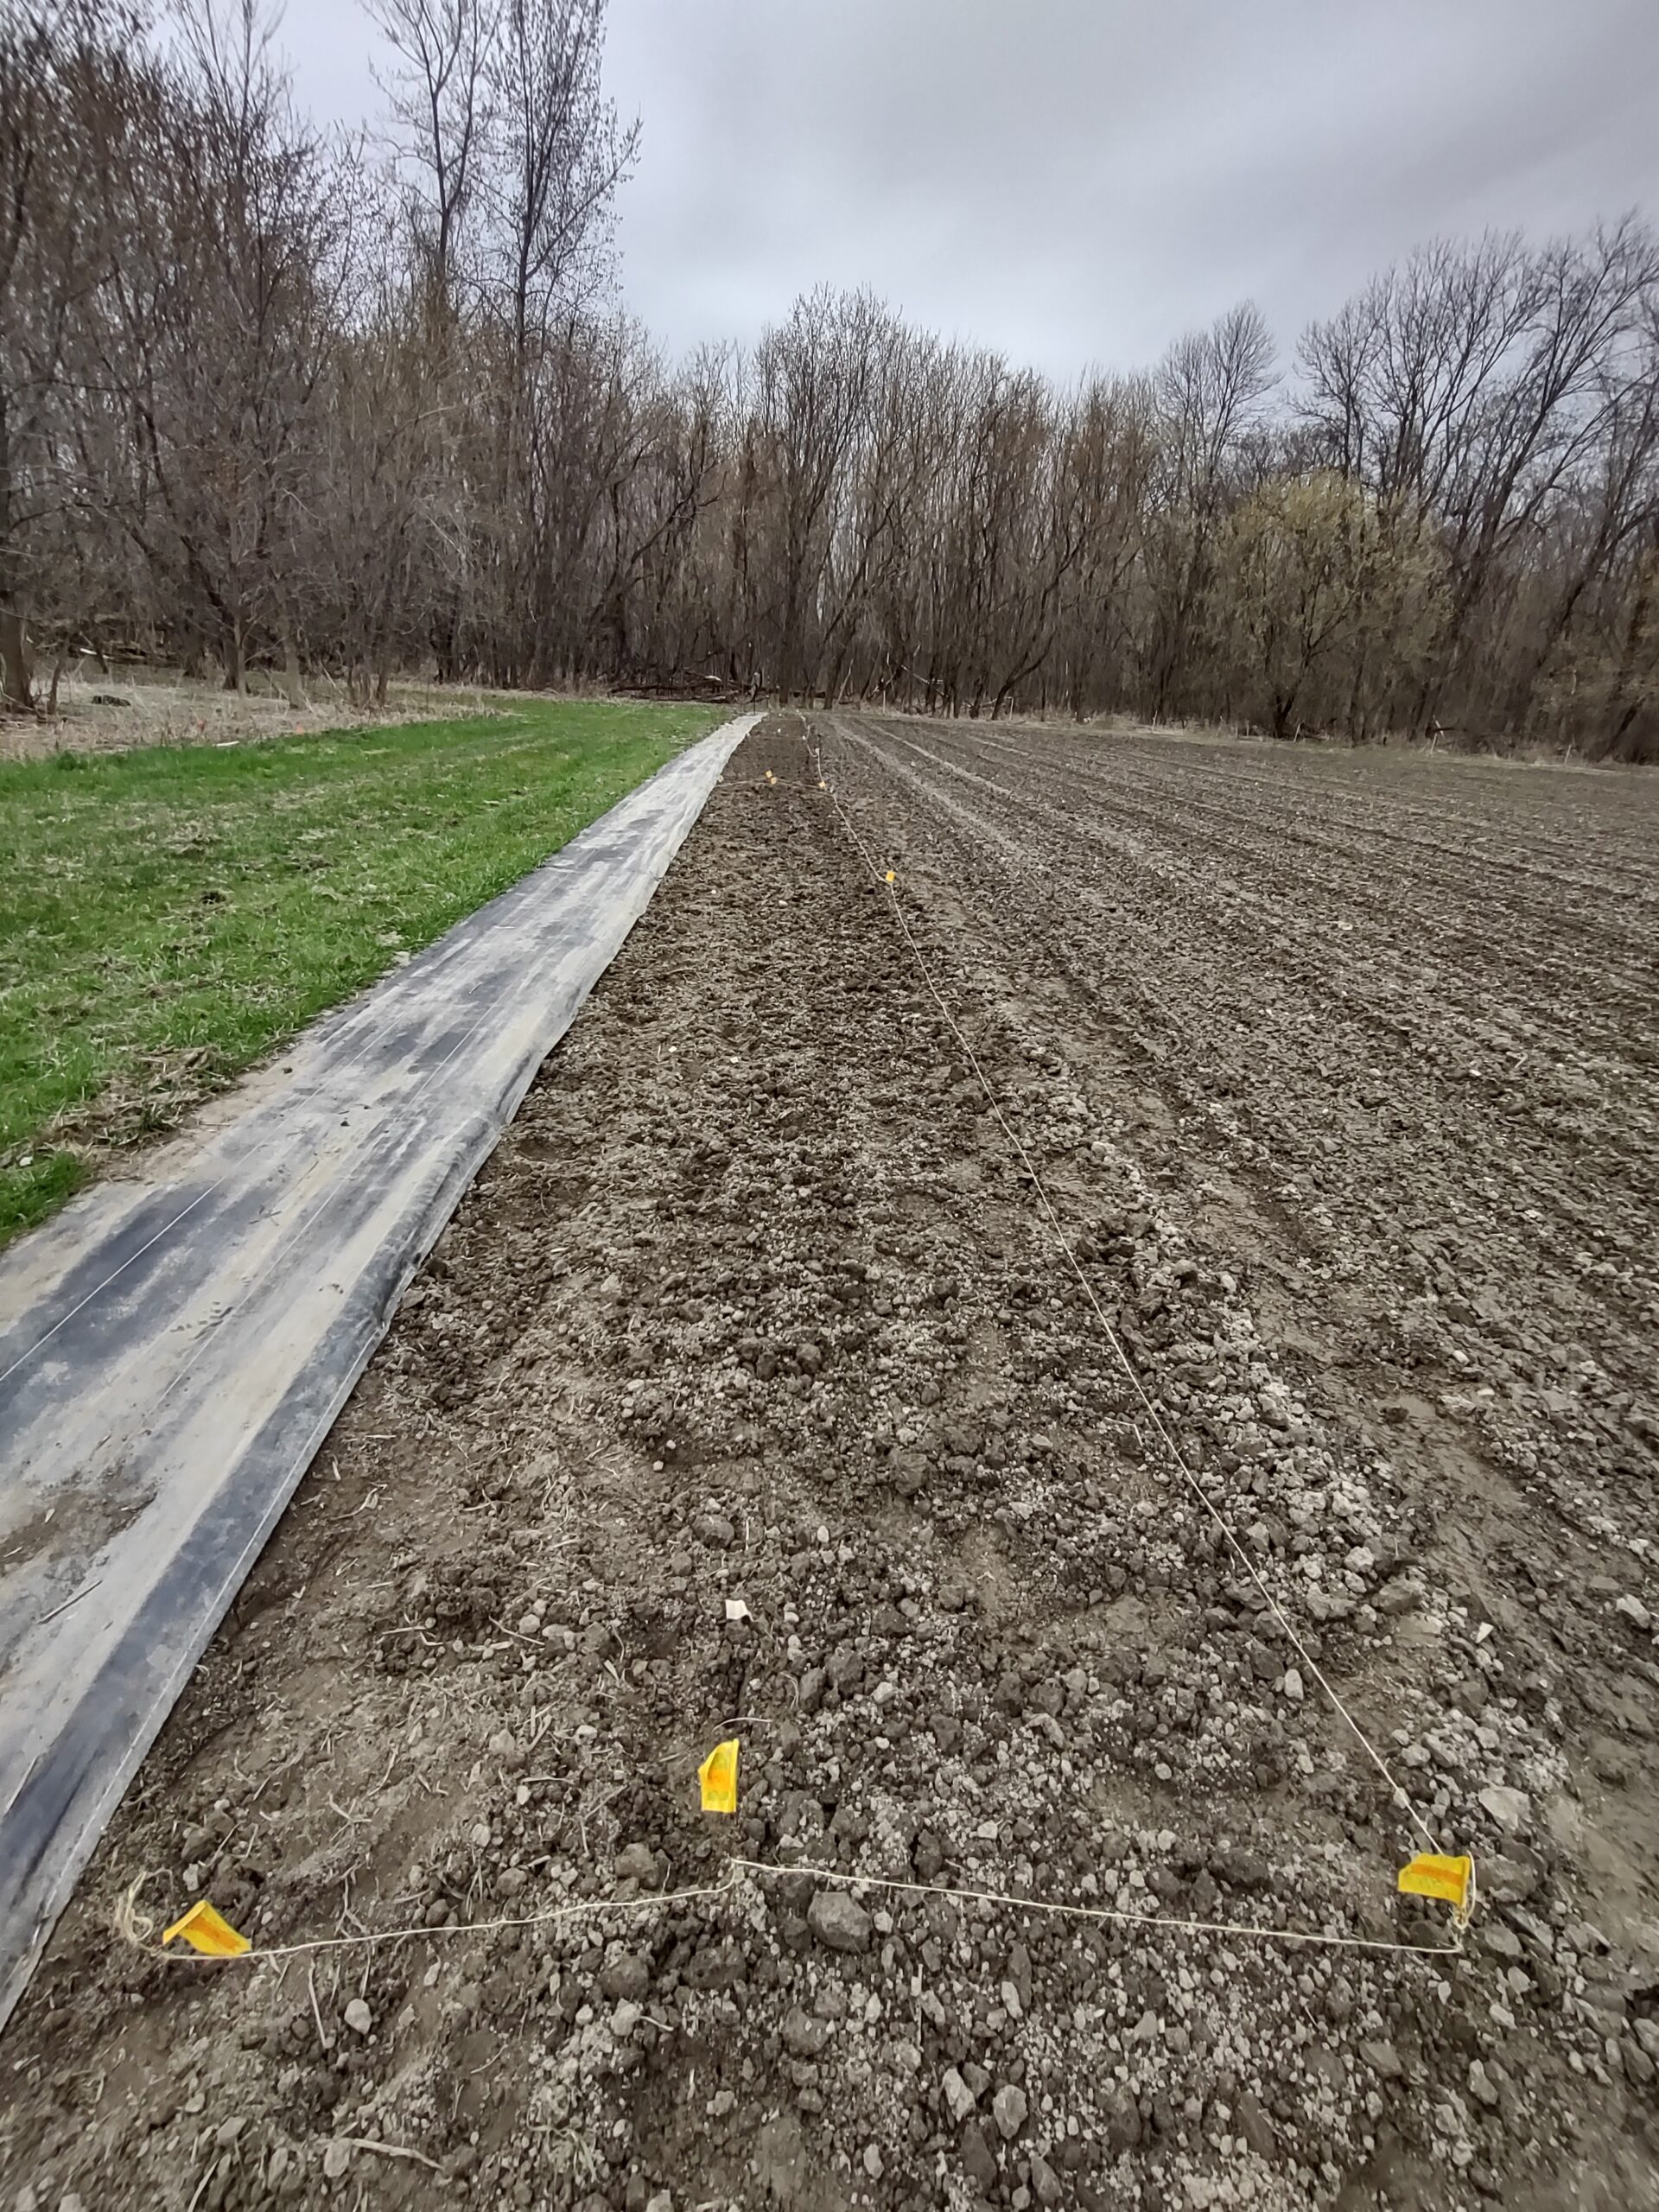
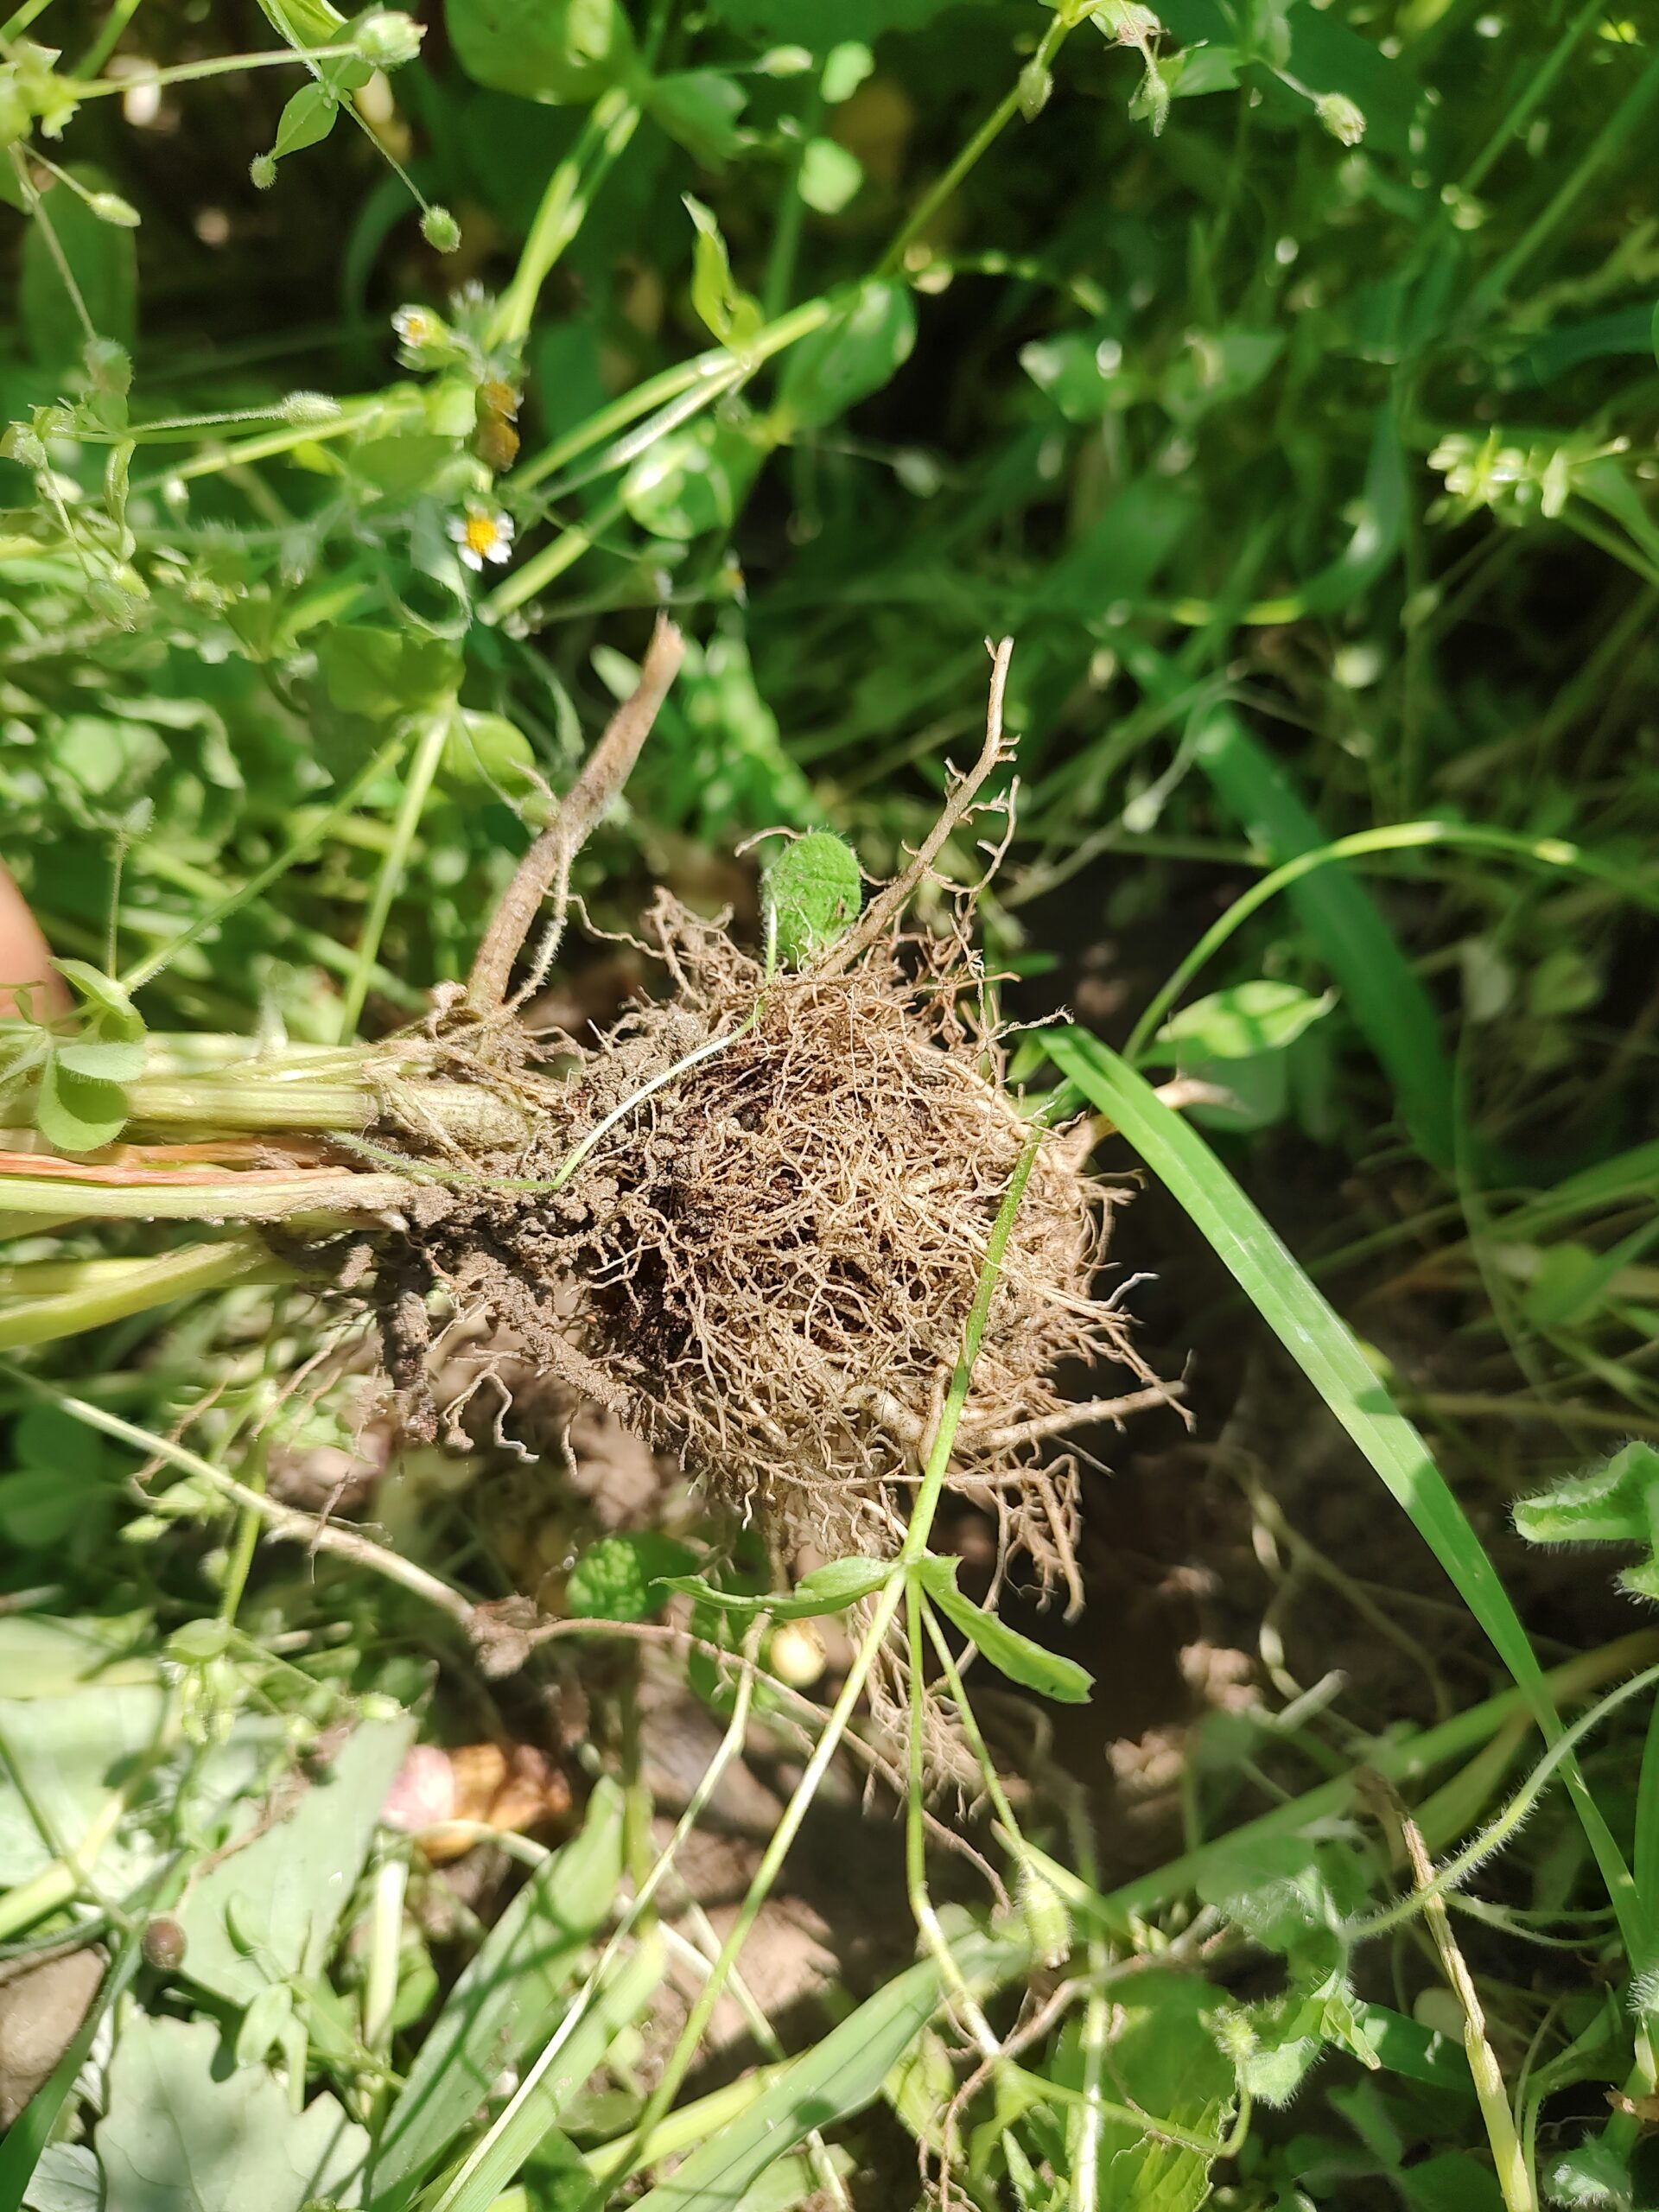
were then raked evenly and divided into 4 sections 238 ft long, flagged and separated by 1 ft wide strips that were planted with radish which serve as a buffer since radish does not partner with mycorrhizae. An area in both the N & S adjacent wild buffers to the field of 40’x 5’ was measured out (Images 5 & 6). Thirty sterilized trowels of soil were gathered into a 5-gallon bucket designated for the direction and mixed. Some of this soil was processed to determine Mehlich, WEP-SRP, & TP concentrations, mycorrhizal spore counts, hyphal length, and DNA. To determine mycorrhizal root colonization, roots of plants (i.e. weeds in the field, herbaceous or shrub roots from wild buffers, parsley crop) were dug up, and put in clean labelled bags.
For Mehlich 2 gloved handfuls of soil from each bucket were placed in labelled clean plastic bags and submitted to UVM’s Agricultural and Environmental Testing Lab (AETL) who shipped it to University of Maine’s Soil Testing lab (NE Coordinating Committee for Soil Testing, 2011) for Mehlich-3-extractable nutrient concentration analysis.
For WEP - SRP, 25 g of fresh soil were dried. 2 grams of dry soil were sieved (2mm mesh), put in a 40-ml centrifuge tube with 20 ml of distilled water, shaken at 25 rpm for one hour, centrifuged at 6000 rpm for 10 minutes and filtered through a 0.45 μm nylon 33 mm syringe membrane filter (Fisherbrand, Suwanee, GA, USA) into labelled centrifuge tubes to prepare the sample for SRP measurement. This was submitted to UVM’s Agriculture Environment Testing Lab (AETL) where SRP concentration was determined colorimetrically on a Lachat Quick Chem Series 2 (Hach, Loveland, CO, USA) (US EPA, 2015) at 880 nm.
For TP the remaining dried soil was sieved. 1.5 grams added to a labelled scintillation vial were submitted to AETL and analyzed, using Microwave assisted digestion utilizing Nitric acid (U.S. Environmental Protection Agency, 1996) followed by ICP analysis (Avio 200, Perkin-Elmer Corp., Shelton, CT, USA).
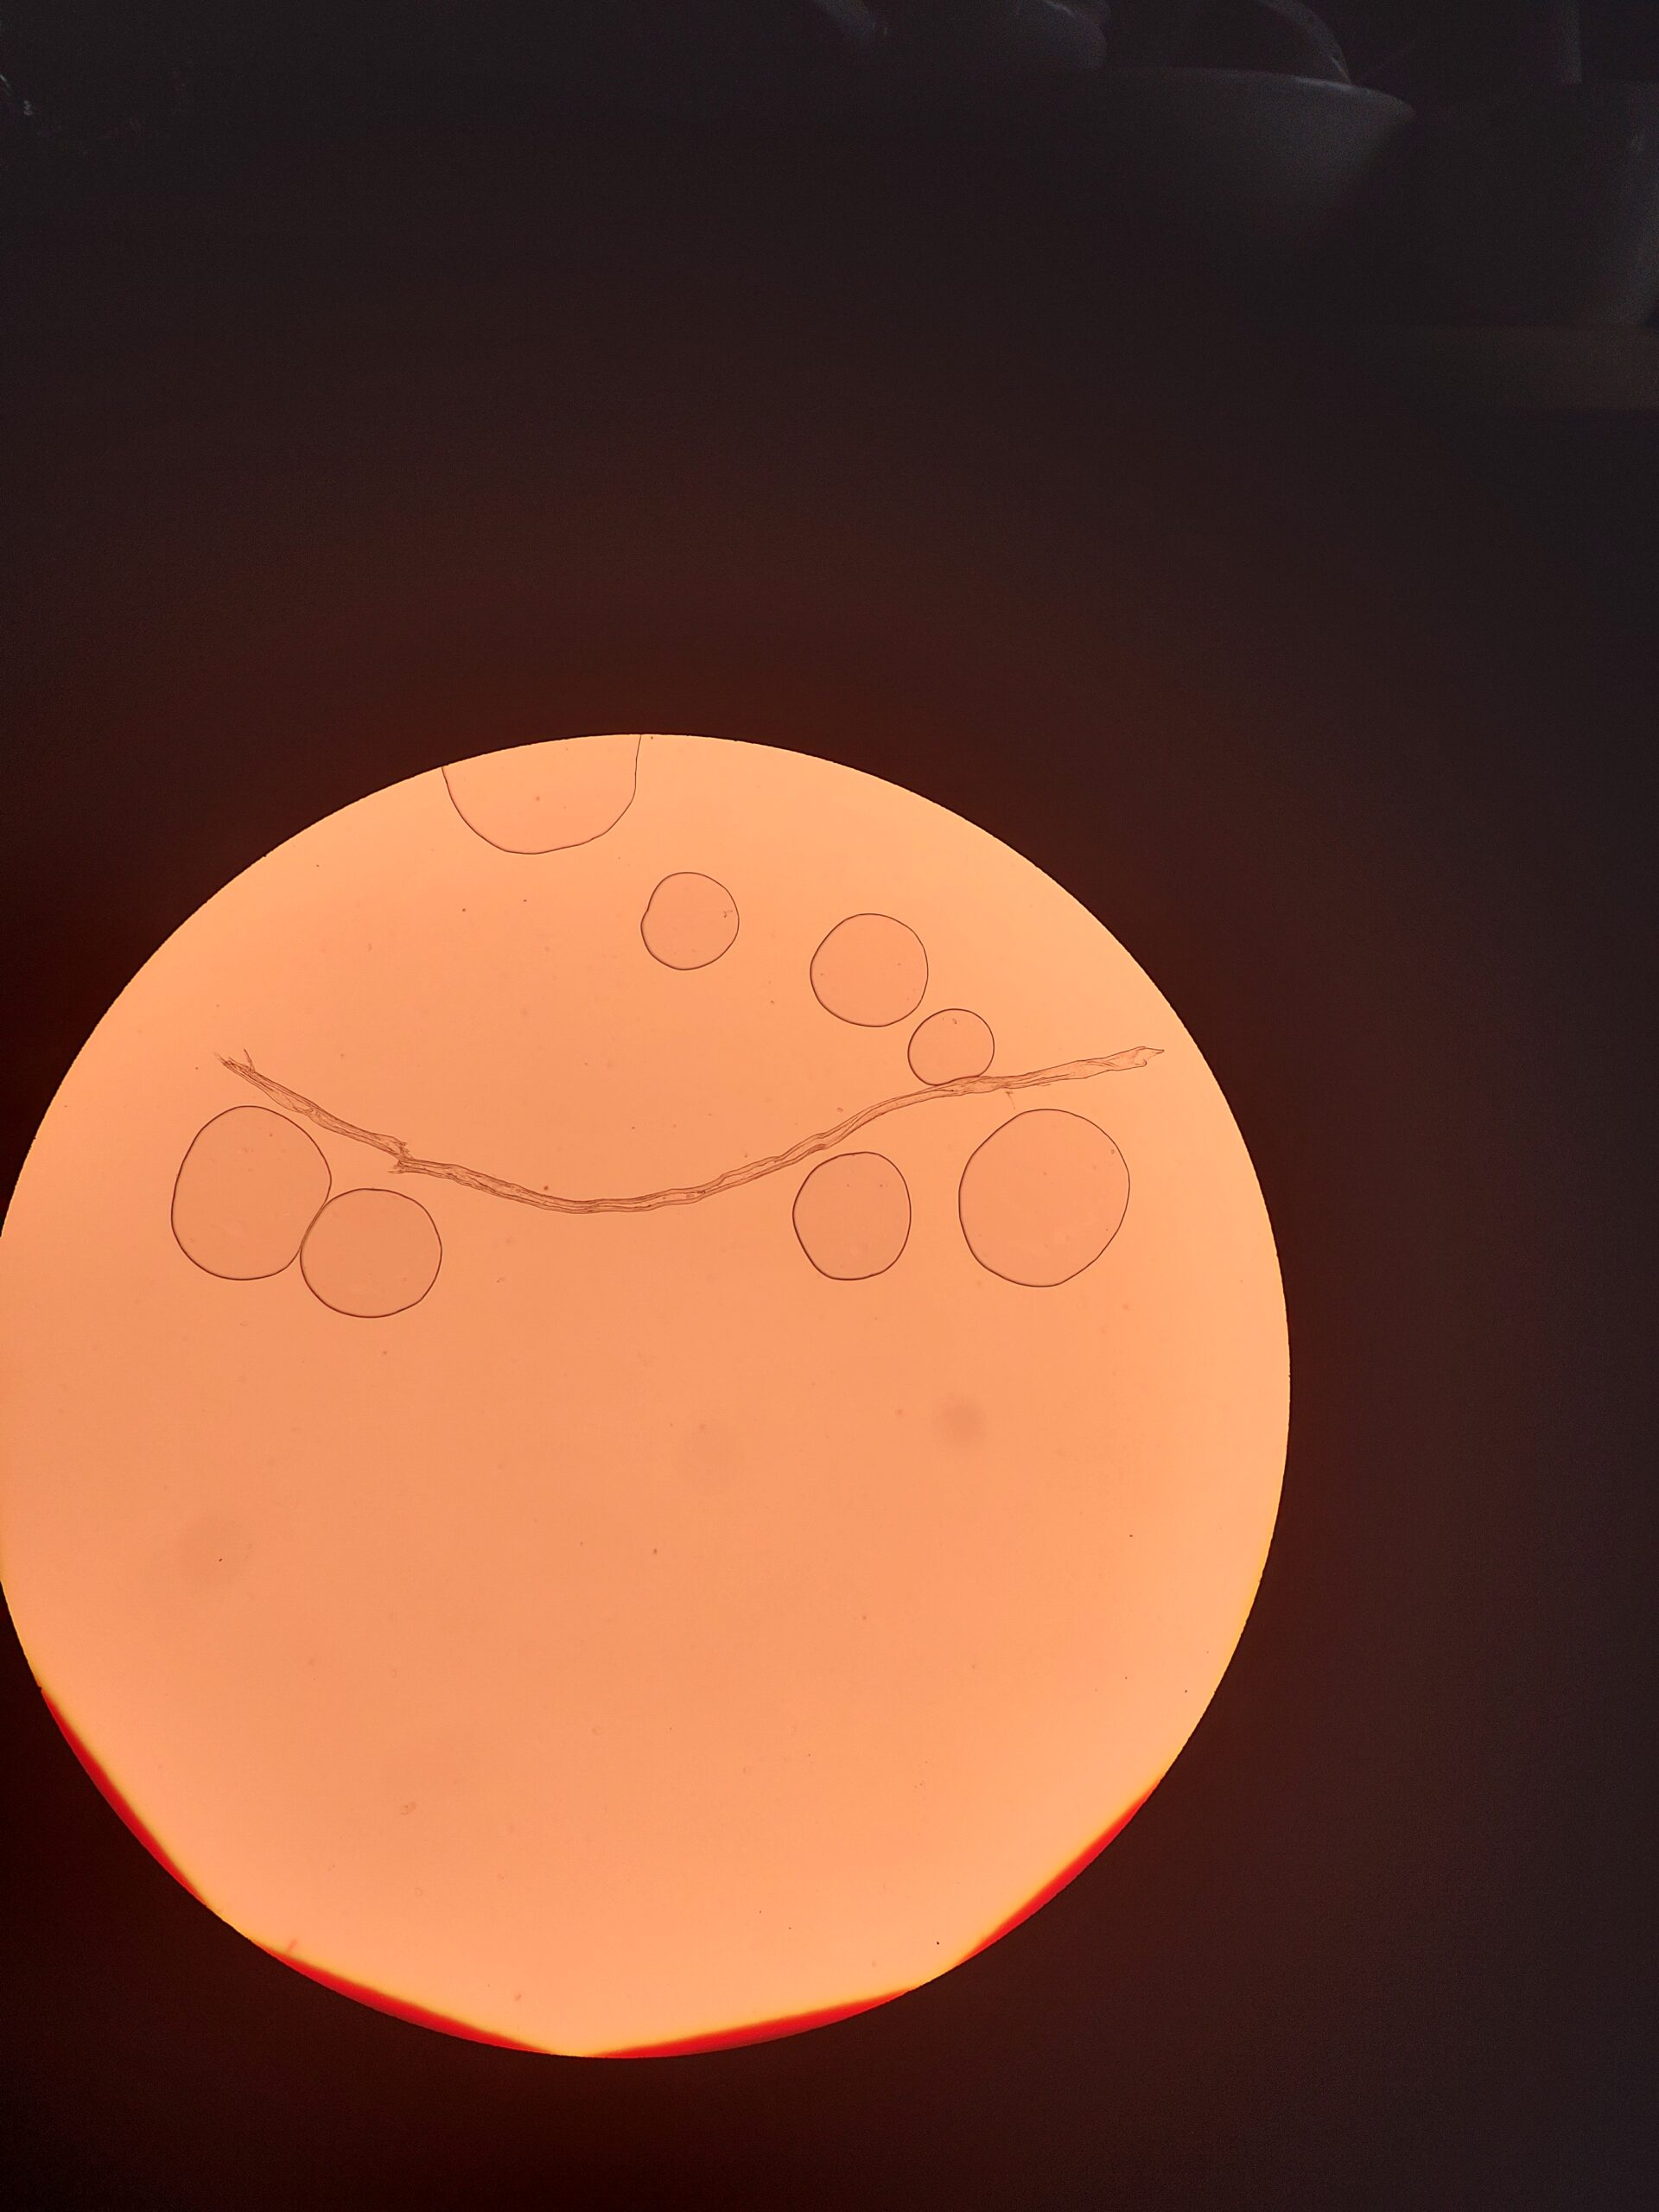
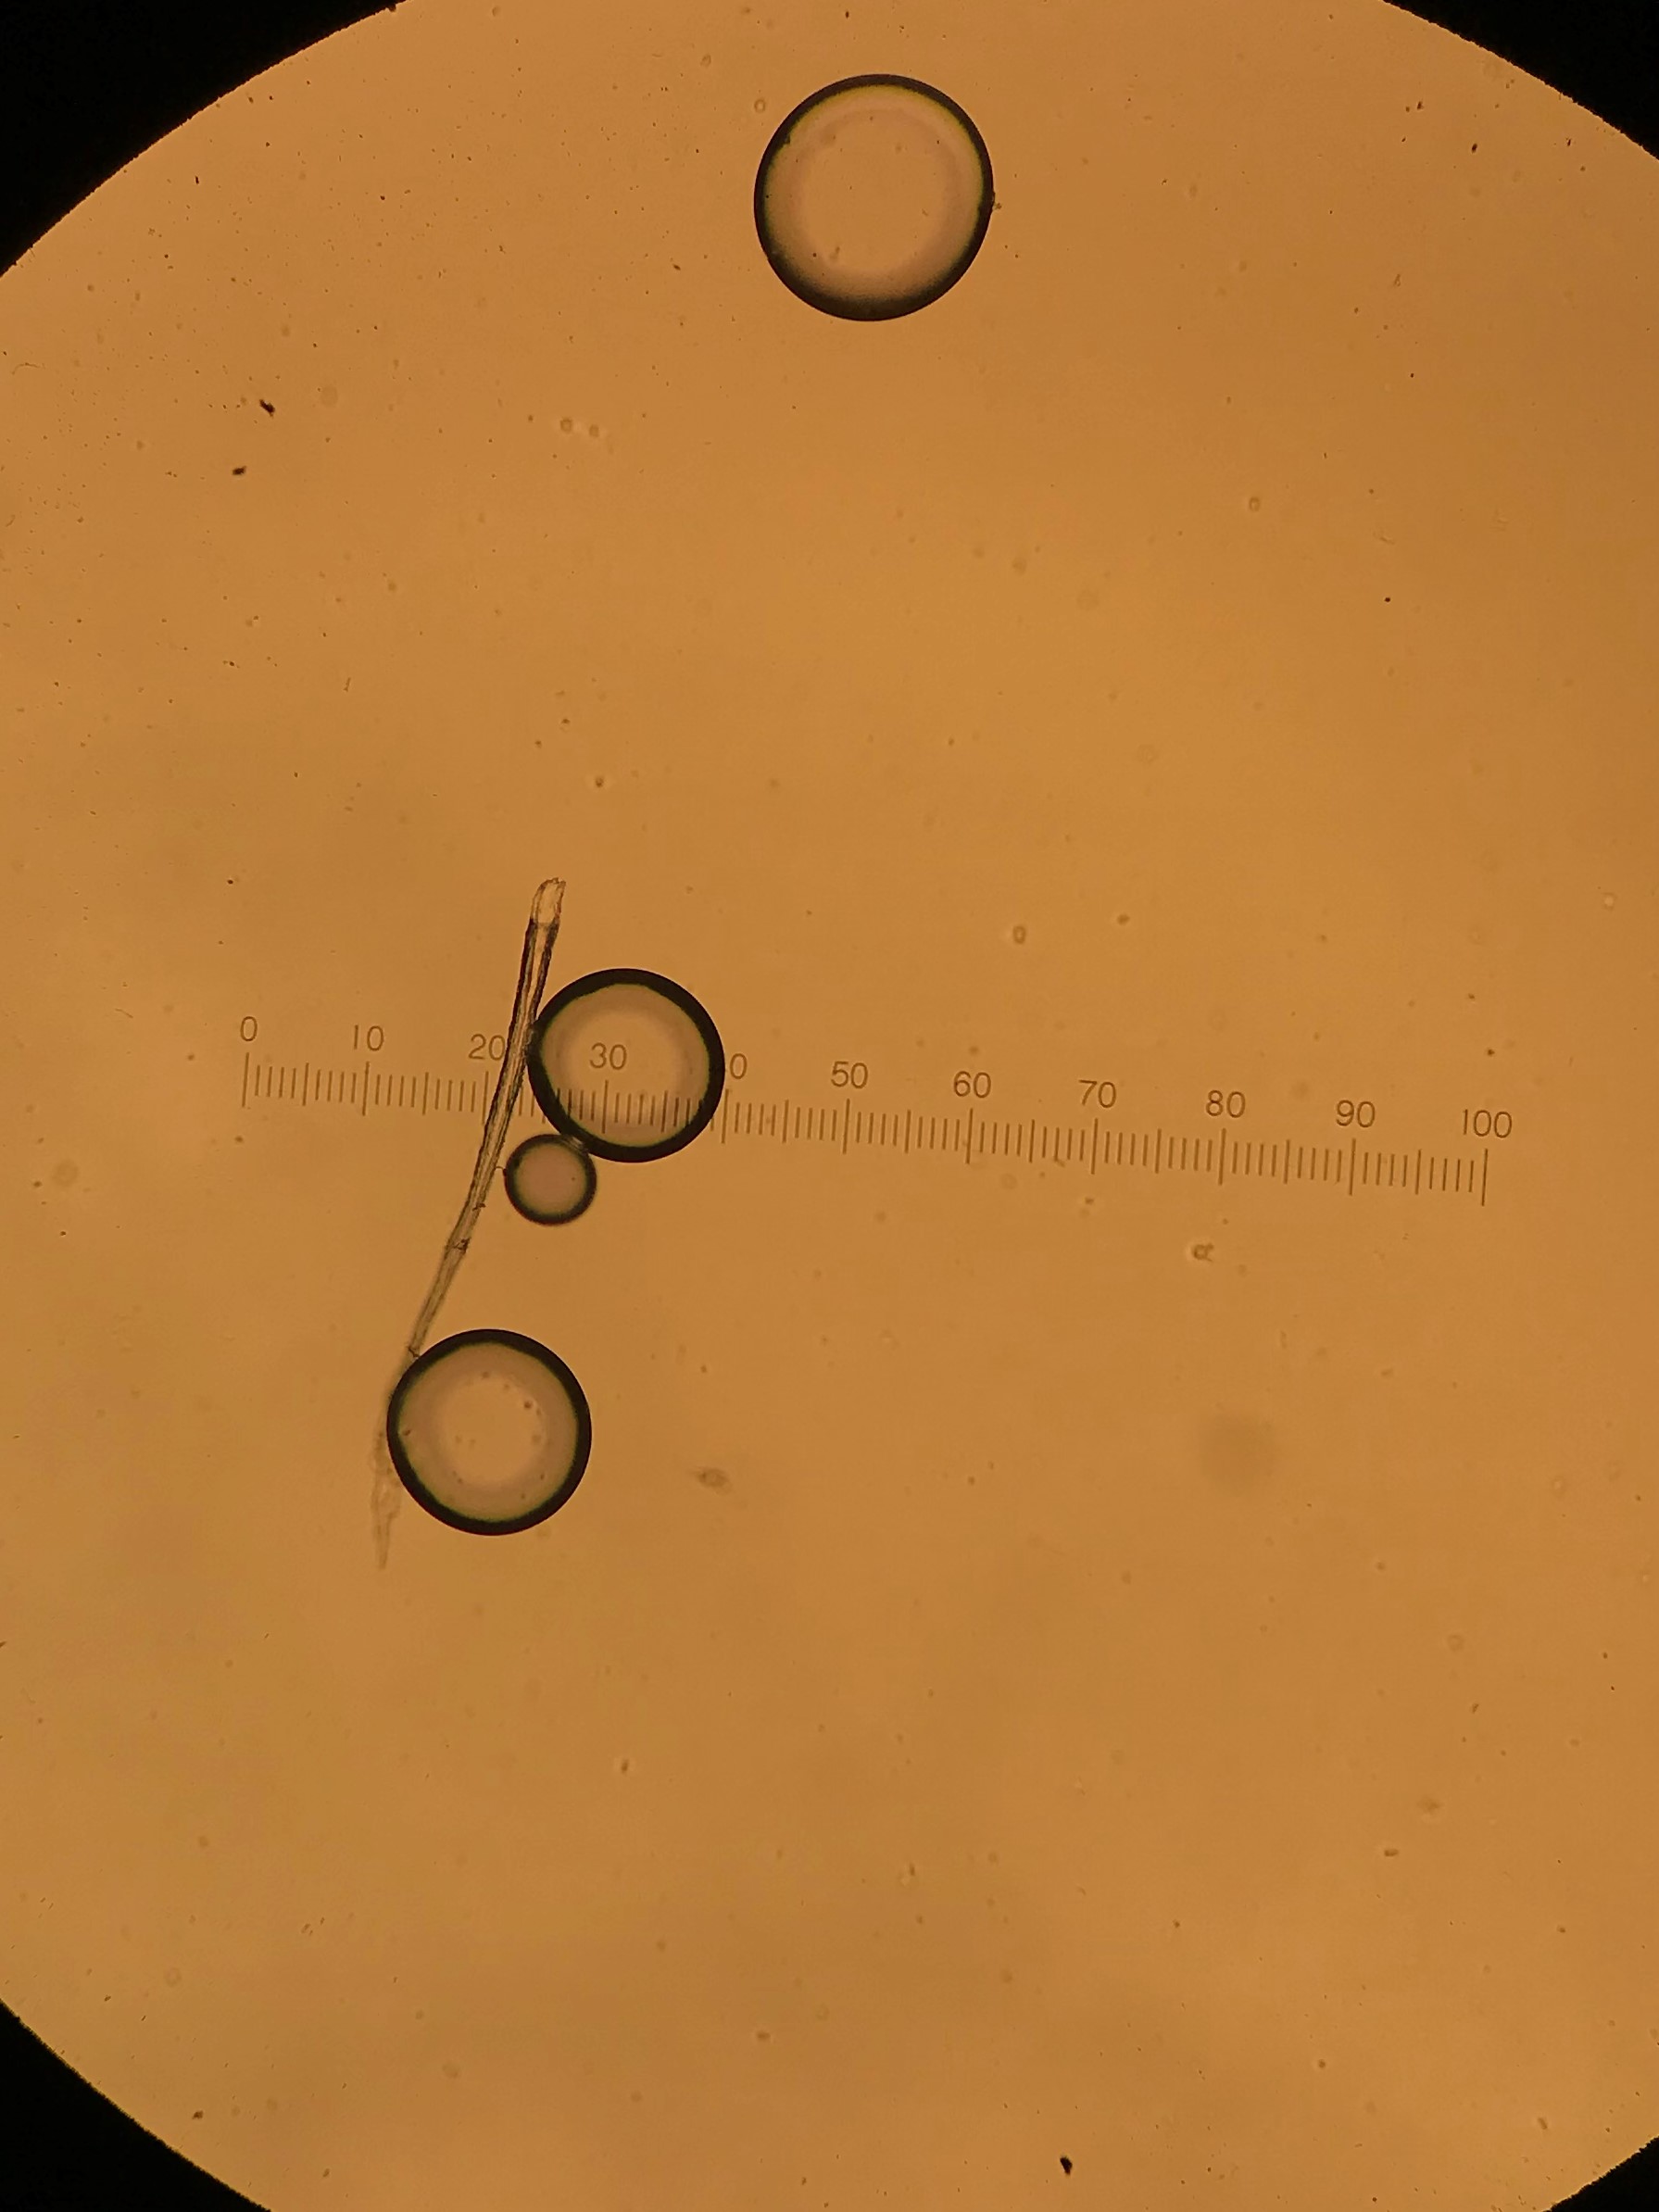
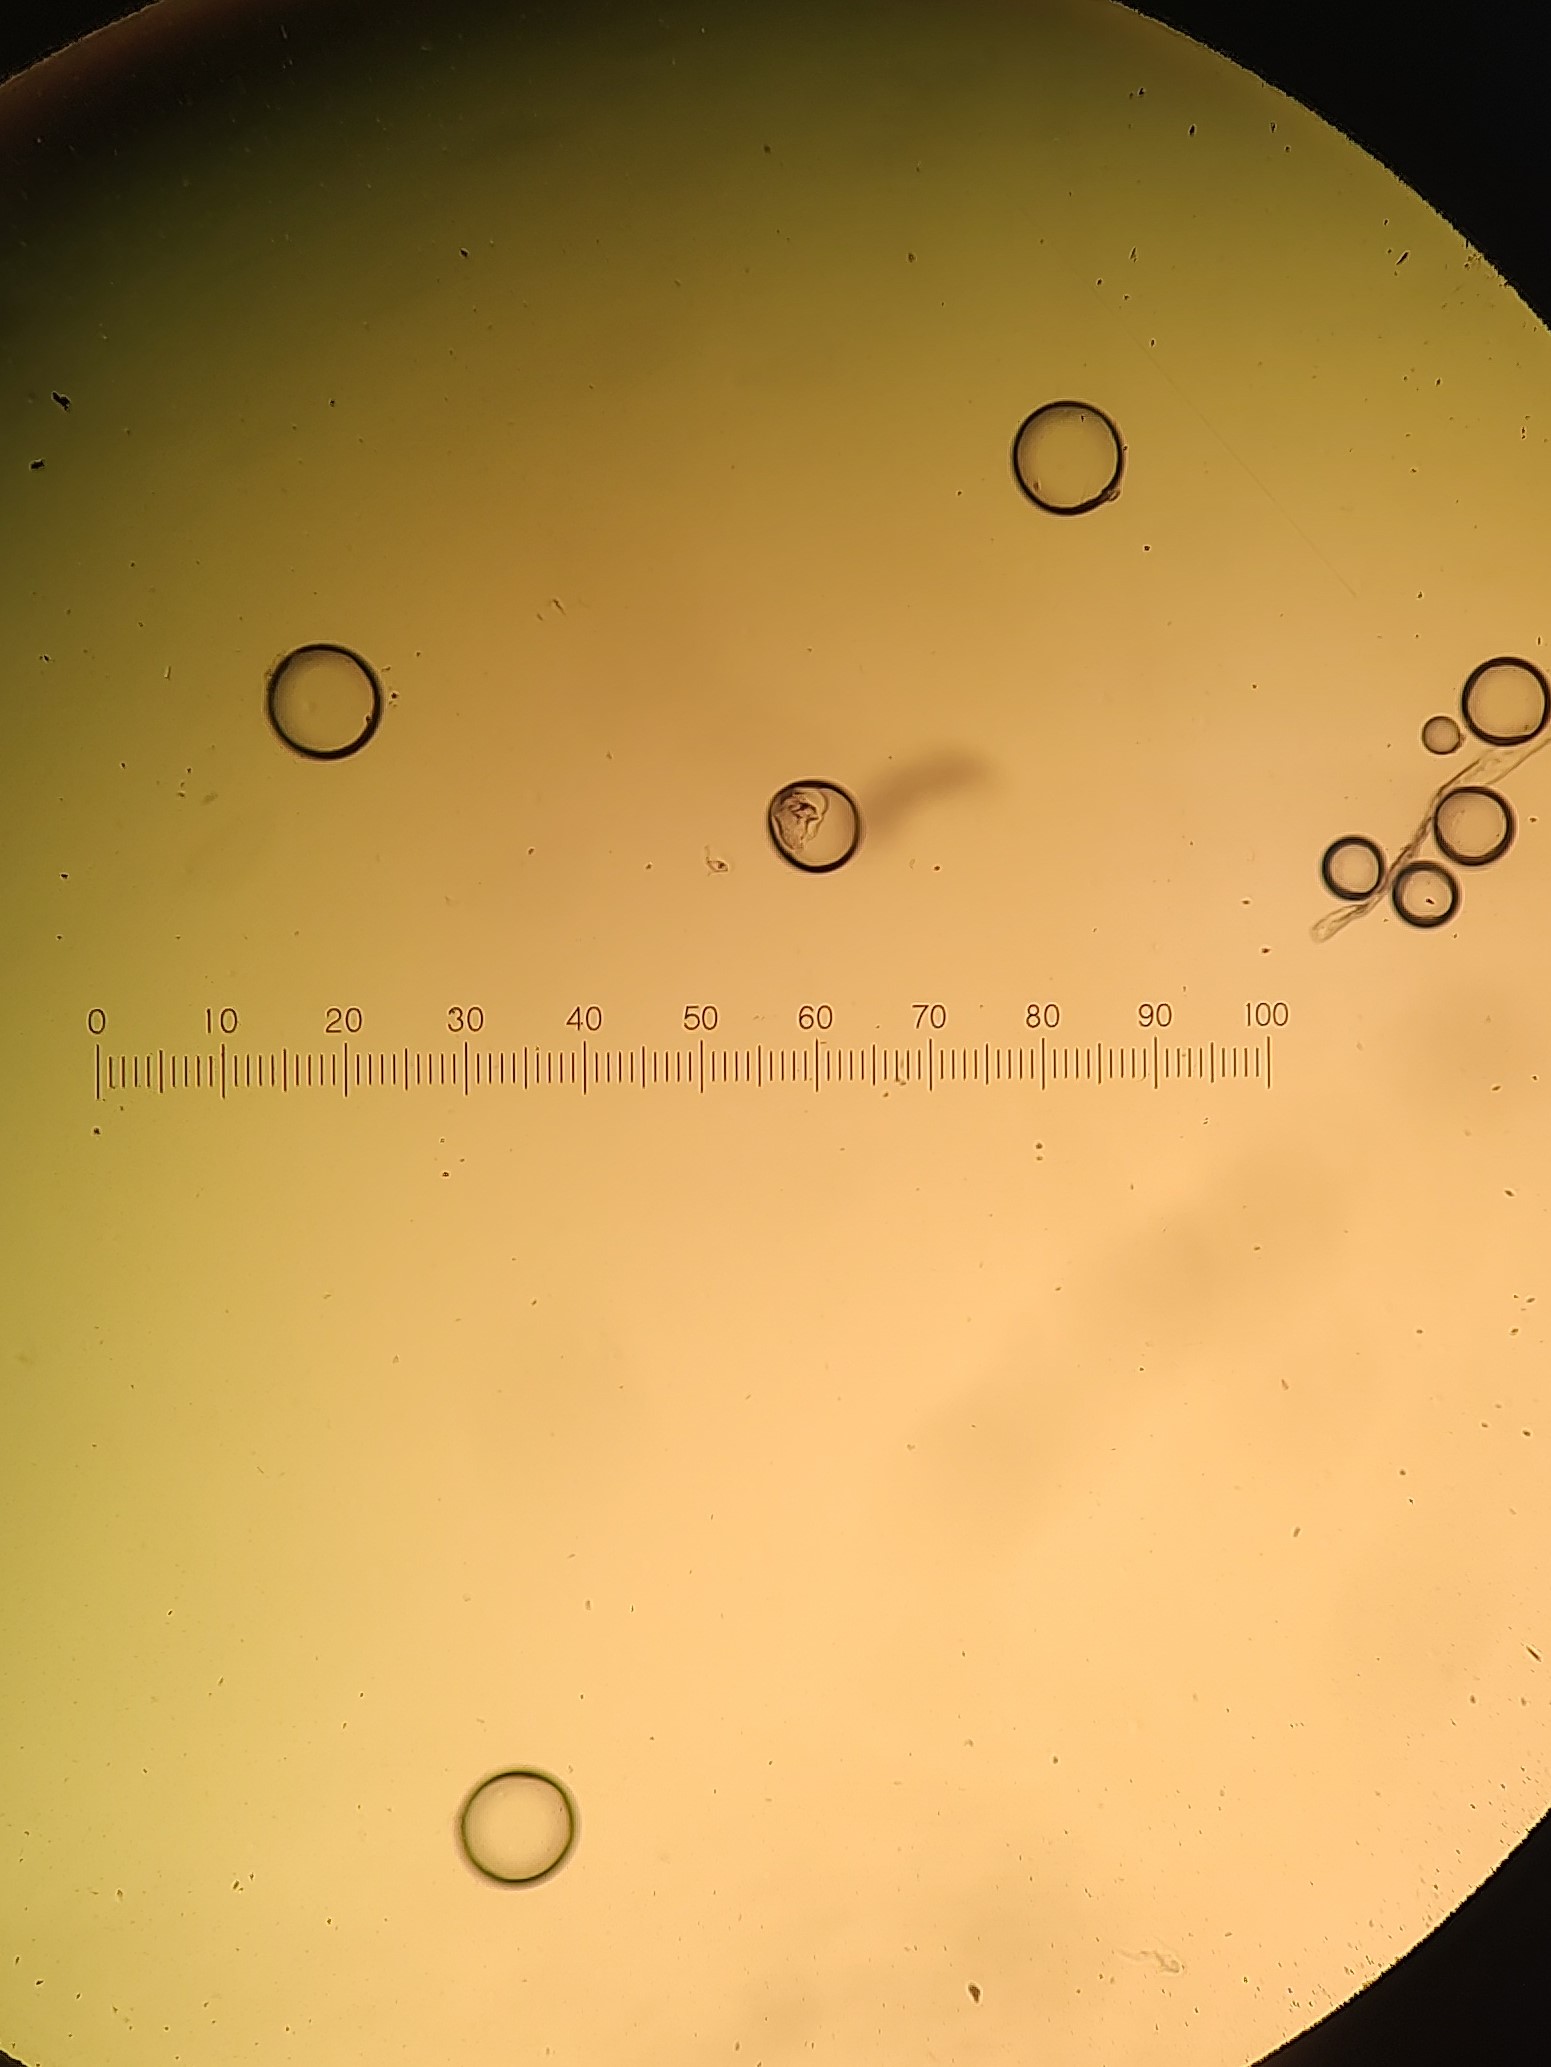
Mycorrhizae presence was determined through enumeration of extra radical hyphae length, spore density, and root colonization percentage. Microscope slides for extra radical hyphal counts were prepared through a modified soil extraction using sodium metaphosphate, soil stirring, dilution, and vacuum pumped through a .2 µm filter stained with acid fuchsin (Juice, 2016 unpublished). Hyphal length was determined using the line intersect method described by Tennant (1975). Spores were extracted through modified protocols involving 25 g of soil, soap, a blender, sieves, sugar solution, and centrifuging to obtain 50 ml of supernatant spores in solution. 0.5 ml of the solution is pipetted onto a clean, labelled slide and counted under a microscope. Spore density (Images 6,7,8) was calculated from the counts, dilution and amount of soil used (Gerdemann and Nicolson, 1963).
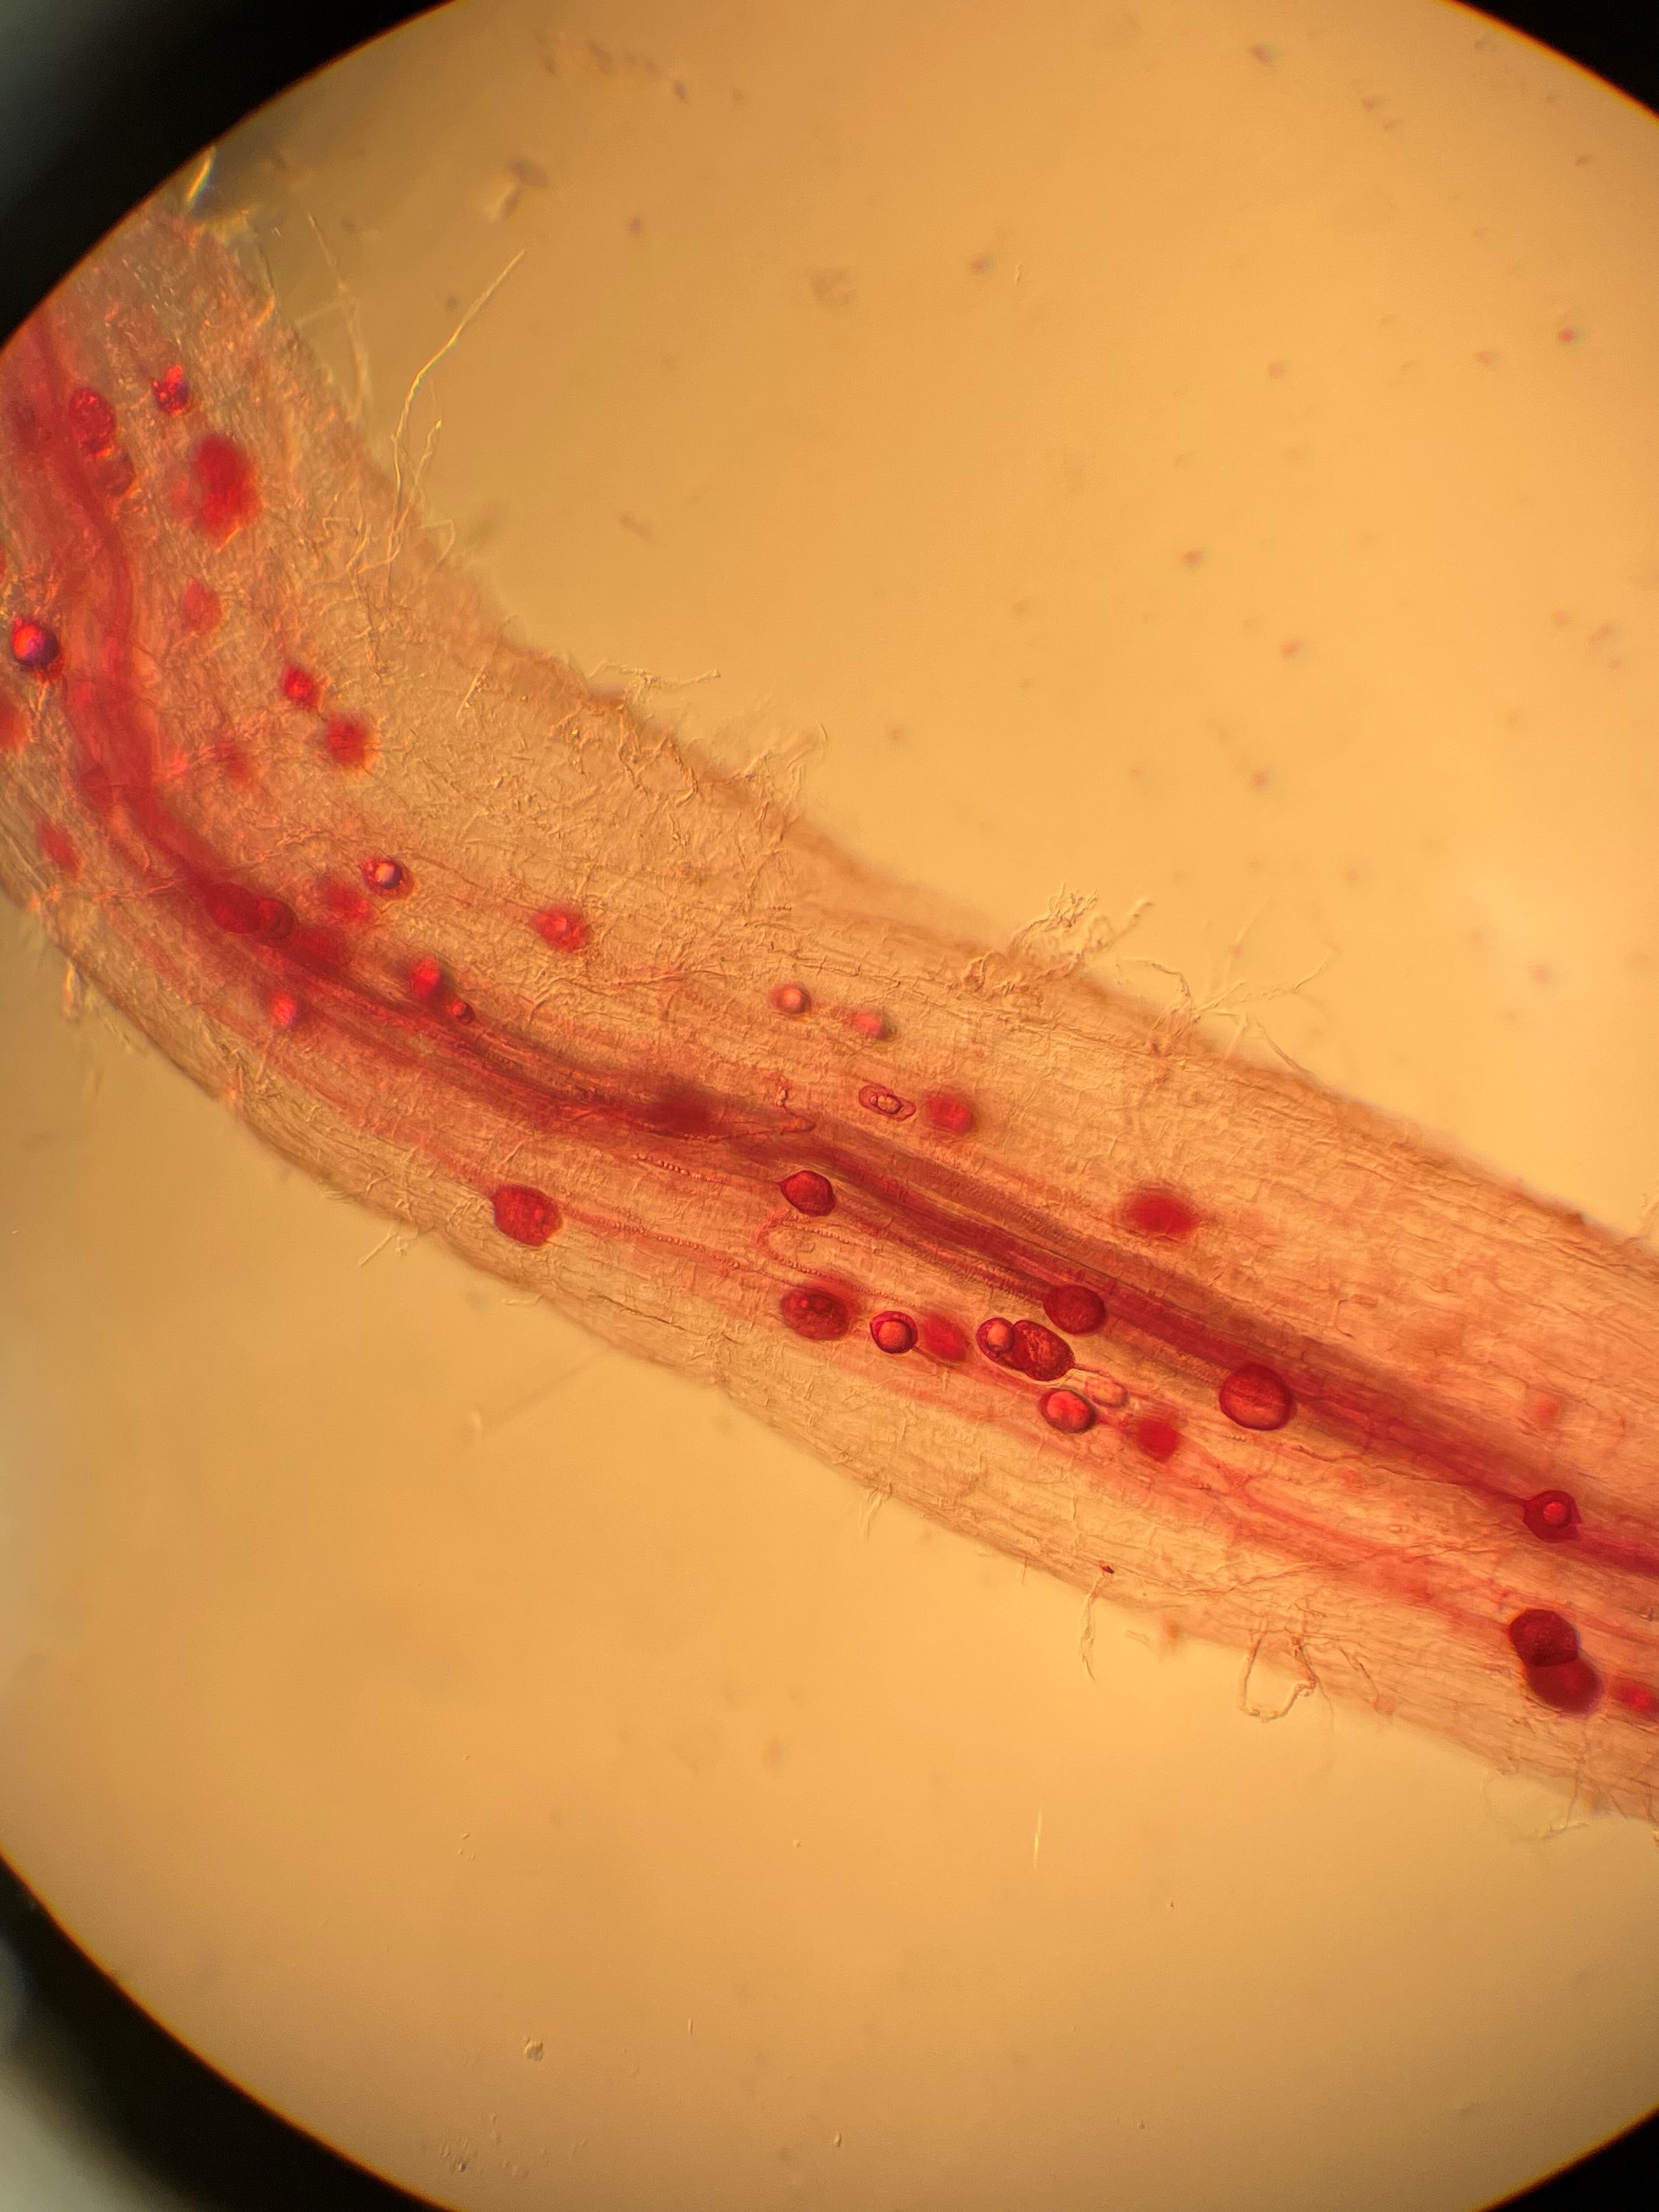
Root colonization was determined through a modified protocol first developed by (Deguchi et al., 2017). Washed roots with diameter of 0.5–1 mm were placed in 10% KOH solution, autoclaved (Consolidated Stilts and Sterilizers, Boston MA), rinsed, acidified with 1%HCl and stained with Acid Fuchsin. After being destained they were stored at 4 C in water before being examined under a compound microscope (Olympus CX41, Olympus Corporation NY, NY). 4 roots were mounted with Polyvinyl-Lacto-Glycerol on a labeled slide. 10 randomized fields within one slide were selected to examine for presence of AMF structures (arbuscules, vesicles or spores). Percent colonization was calculated as the: number of microscope fields containing colonized roots * 10.
An Illumina HiSeq1500 was used to sequence DNA extracted from soil samples from soil gathered from wild buffers, field banks, and the field. High quality (phred score >30) reads of 150 bp were generated, which ranged in number from just over 971,000 up to almost 10 million per sample. Poorer quality bases were trimmed to improve alignment to the MaxiKraken database using Kraken2 (Wood et al., 2019).
The first and third sections of the banks on each side were haphazard inoculated by adding 1/3 of the 5-gallon bucket to the area and raked in. A polyculture cover crop seed mix (Italian Rye grass, Hairy vetch, medium red clover, white clover, oats) was raked into the four plots and 1/6 lb of radish was raked into the dividing buffer strips (Images 9 & 10).
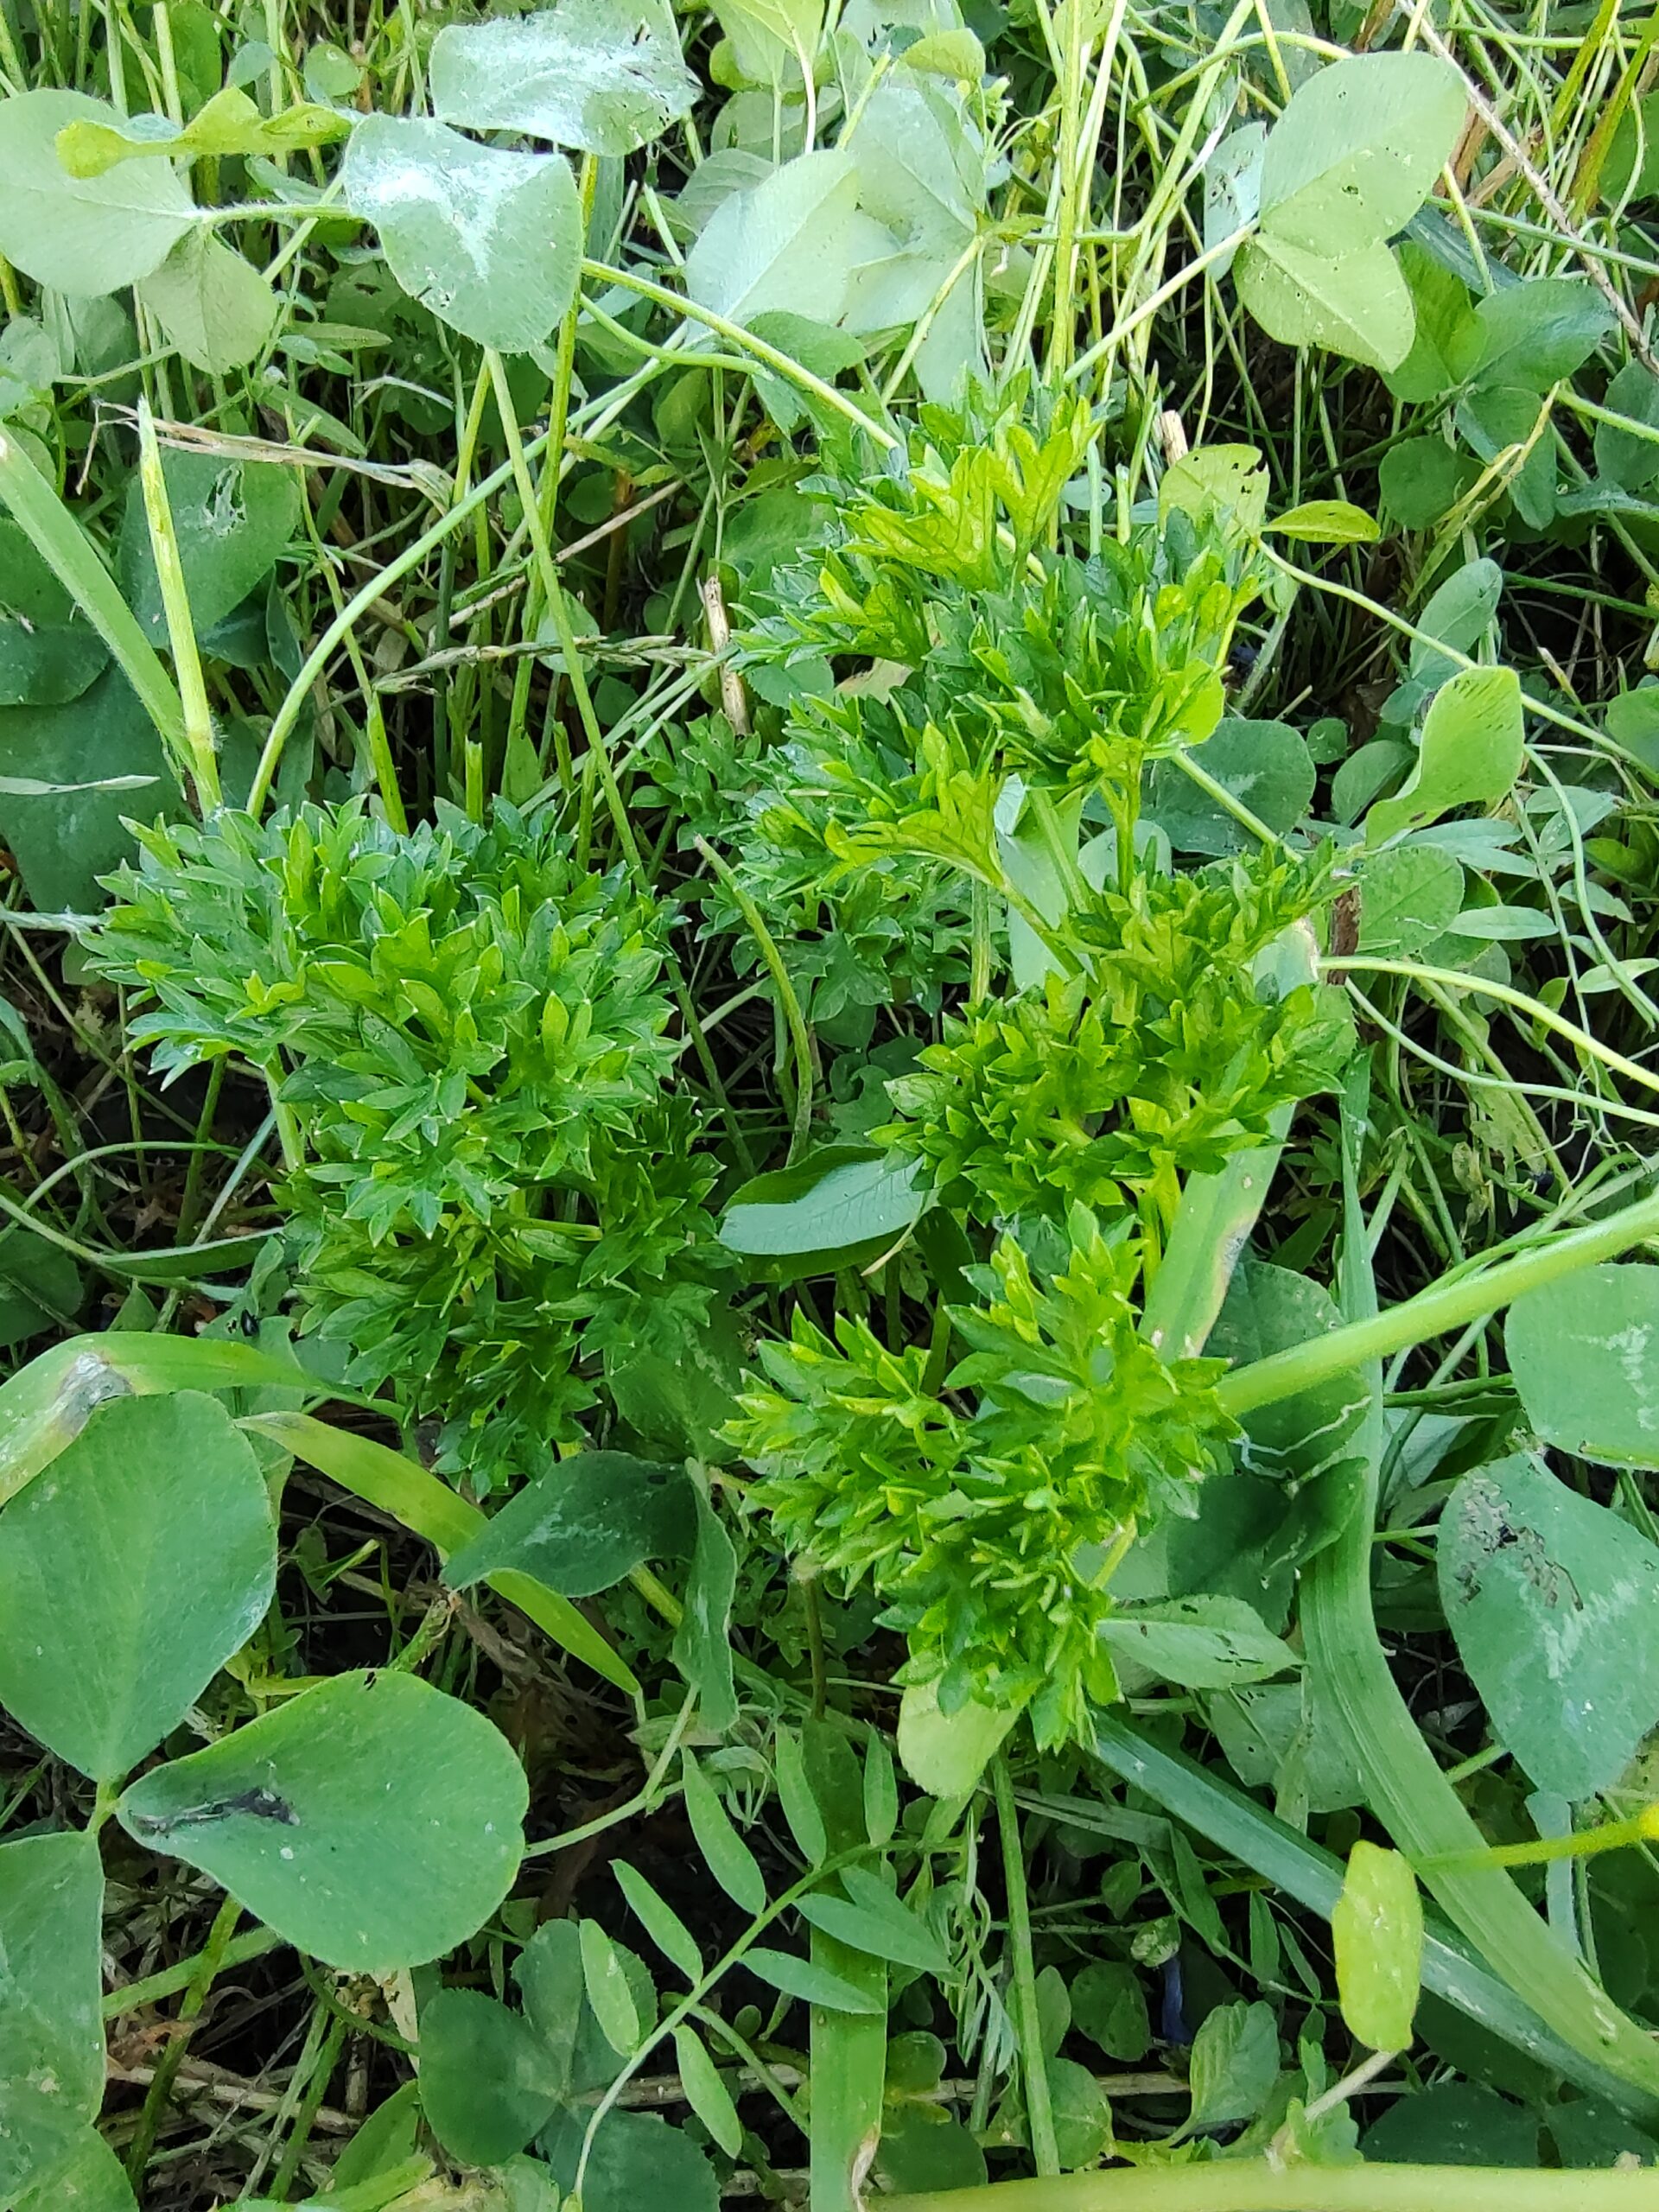
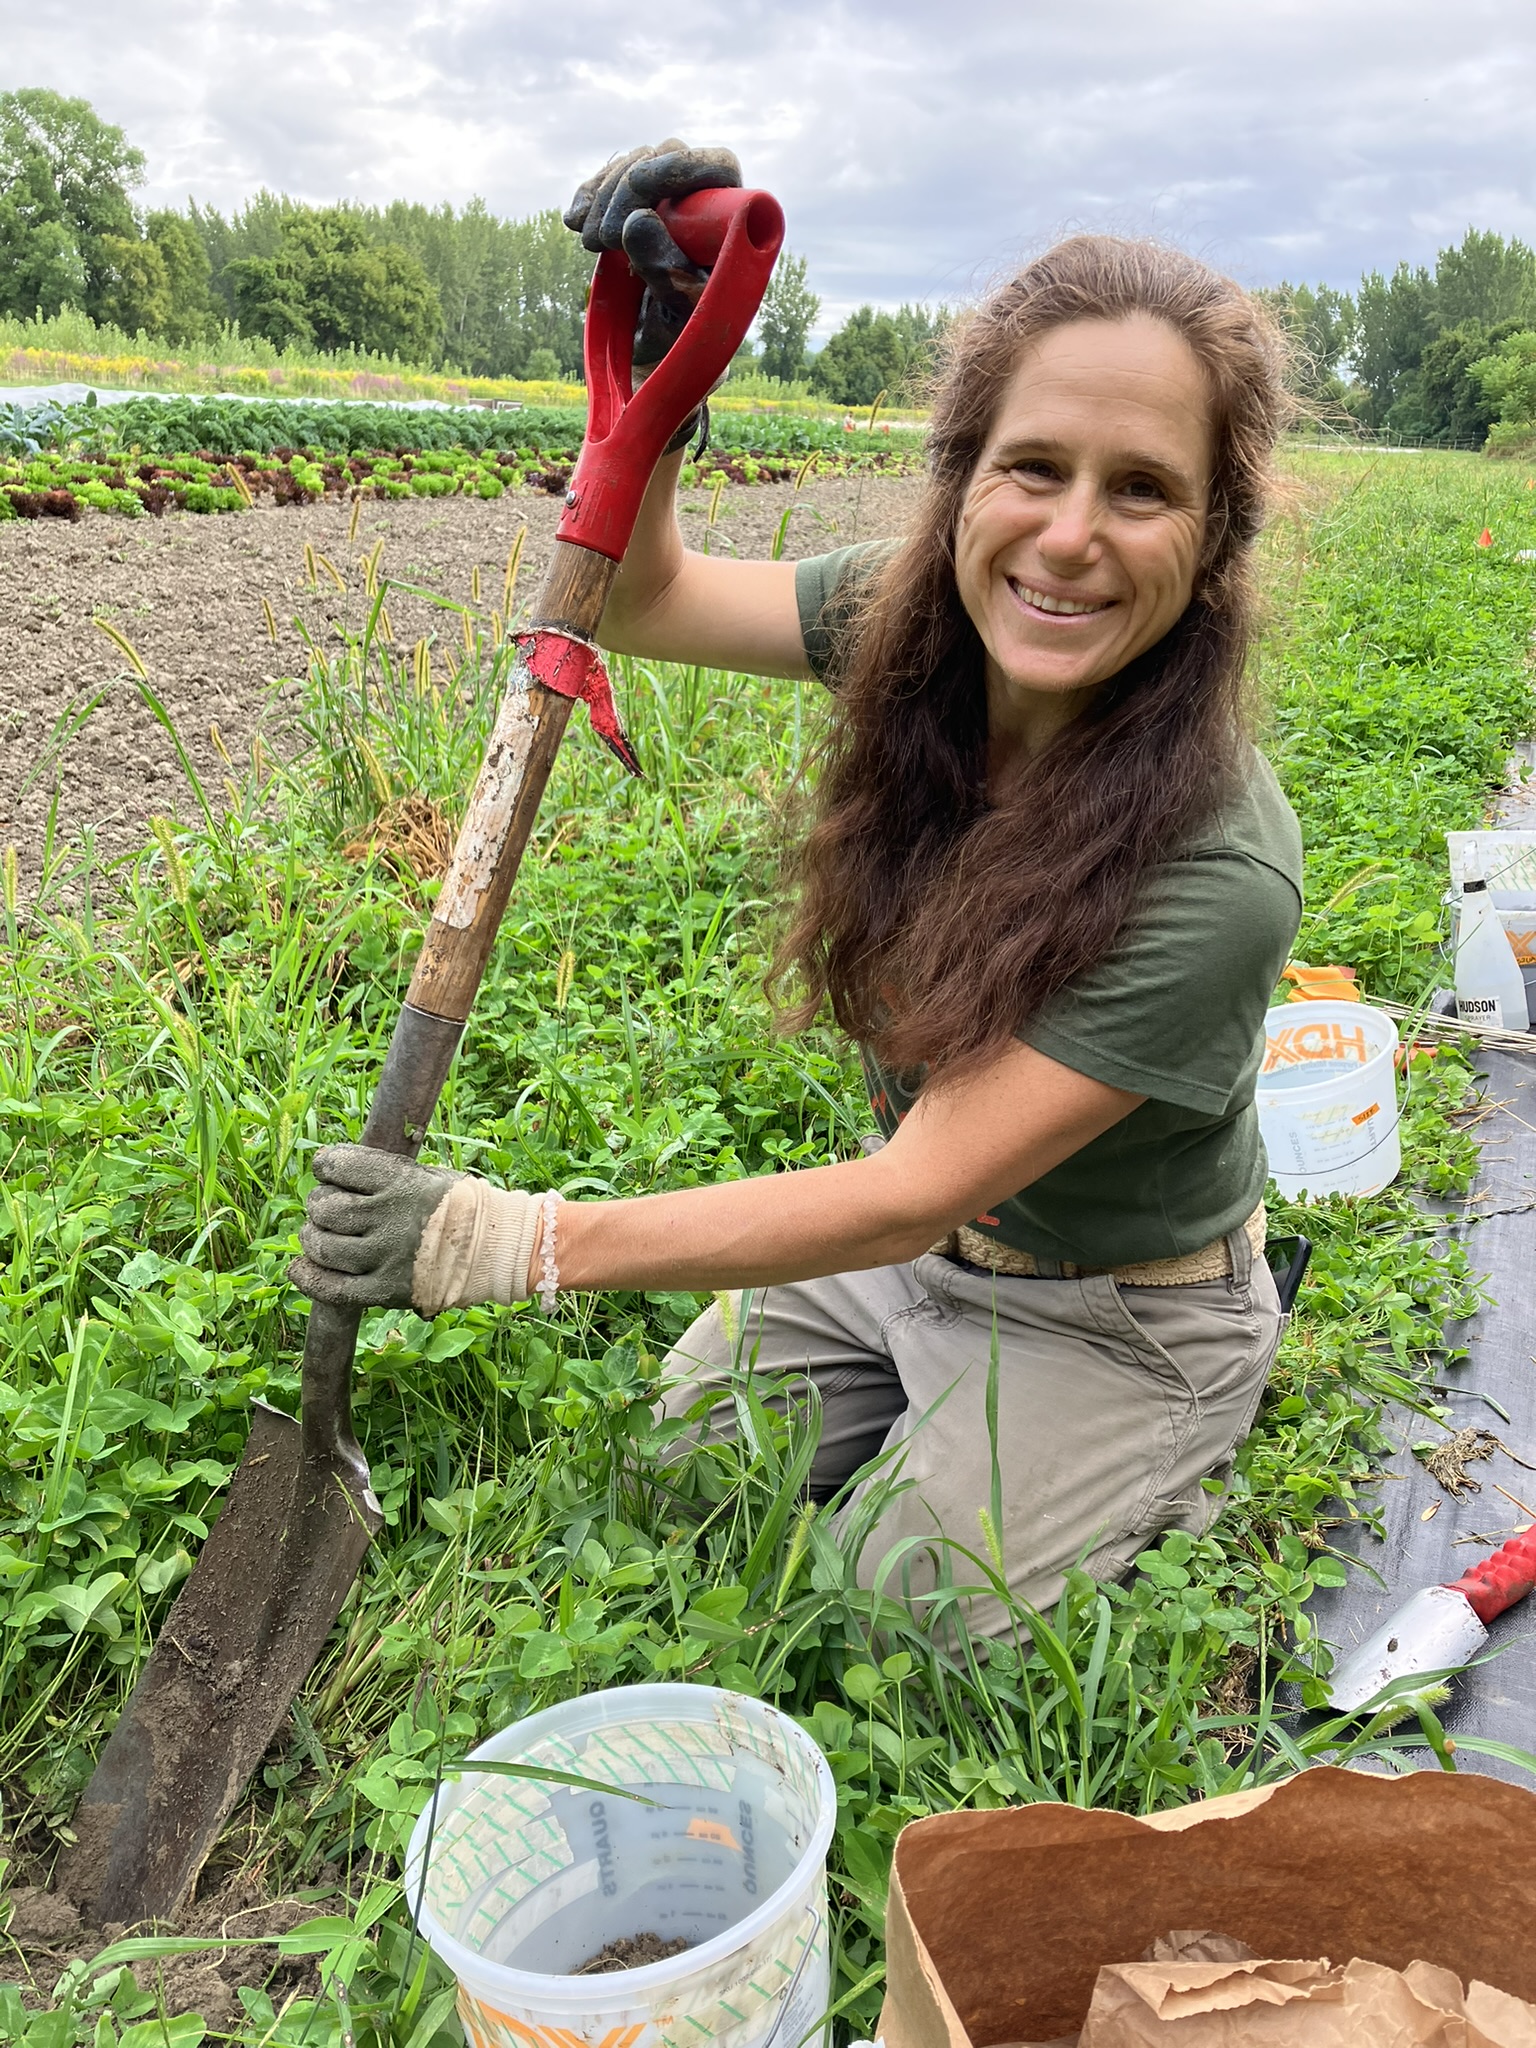
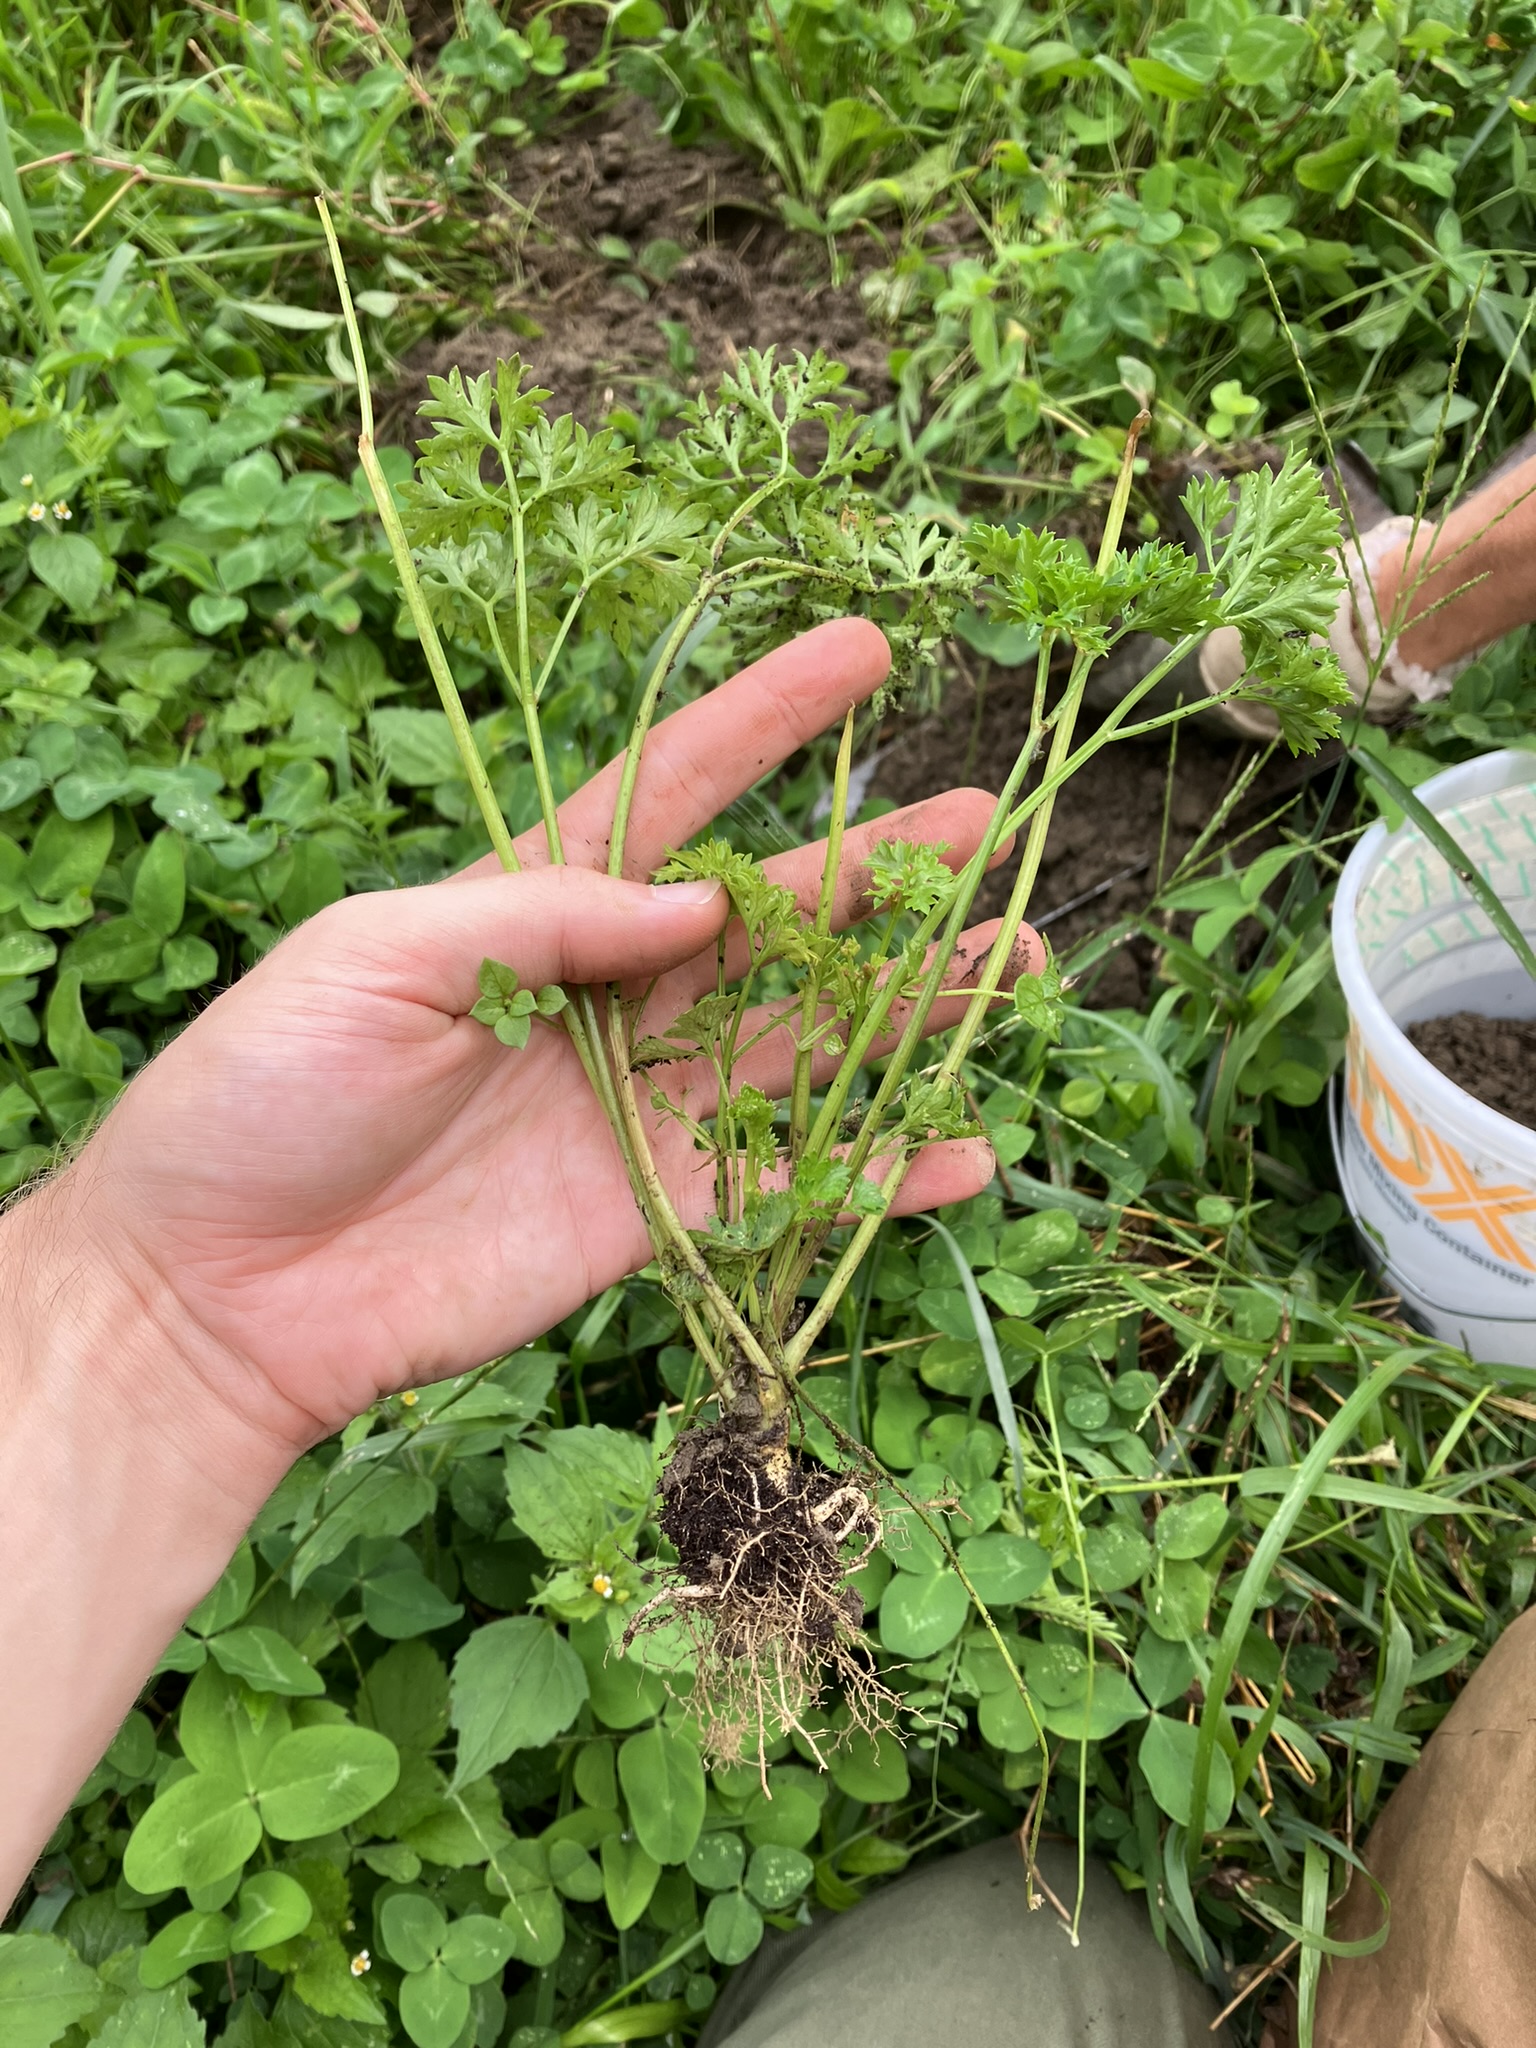
In late August parsley and soil was harvested (Image 13). 2 clumps of parsley plants were dug up (Image 14). Soil around the roots (Image15) was shaken into a bag where soil was processed for mycorrhizal spores and extra radical hyphae . Roots were cut off and processed in the lab for root colonization. Leaf and stem were weighed fresh, then dried in a labelled clean, brown paper bags for 7days in a drying room (37.78 C). after bags were tared for calculations to determine P removal/ harvest. Material was ground in the UDY Cyclone Mill (.8mm screen). 1.5g of dried plant material were added to sterile, labeled and weighed scintillation vials. They were submitted to AETL and analyzed, using Microwave assisted digestion utilizing Nitric acid (U.S. Environmental Protection Agency, 1996) followed by ICP analysis (Avio 200, Perkin-Elmer Corp., Shelton, CT, USA). P mass recovered in plant tissue was calculated: P concentration * dry biomass. Soil around the plants was also harvested and analyzed for WEP-SRP, TP, and Mehlich-3 extractable P.
The data for soil TP, Mehlich-3 extractable P, WEP-SRP, plant P uptake, and mycorrhizal counts were analyzed via a General Linear Model (GLM) with treatment and in some cases date as predictors for P concentrations or mycorrhizal counts respectively. If Levine test’s model assumptions were not met, then data were log transformed prior to non-parametric analysis. Where the model was statistically significant (p < 0.05) for one predictor with more than two levels, Analyses were conducted via SPSS28.0.0. (IBM Corp, Armonk, NY, USA). Summary statistics (using Graph Pad Prism 9.2.0, San Diego, Ca, USA) are shown in graphs to allow comparisons with literature values.
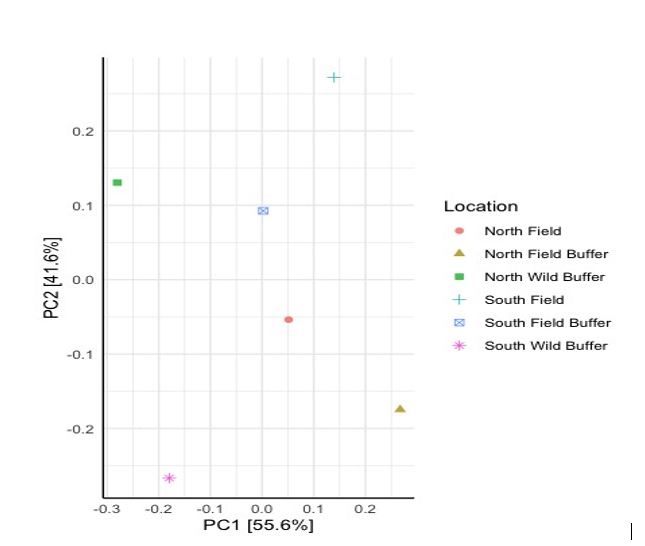
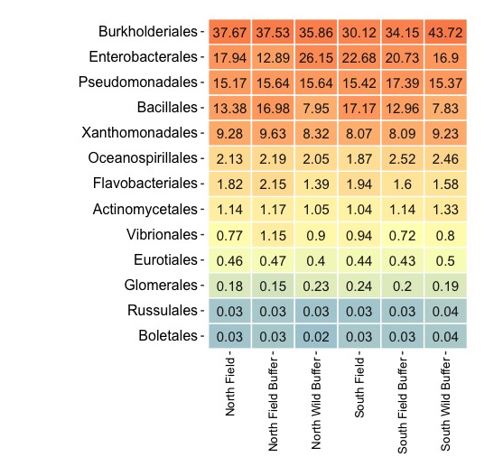
For DNA, order level counts were used to calculate relative abundance in each sample (Table 3). Additionally, Principal Components Analysis (PCA) applied a model-free data reduction technique to examine the relationship among samples and primary taxa influencing the relationships via PCA (Ringner, 2008) loadings (Figure 3). Ampvis2 used in the R environment generated heatmaps (Table 3) for microbial and fungal taxa of interest (Andersen et al., 2018). In addition, sequences were examined in One Codex targeted analysis using 5S, 16S, 18S, 23S, 28S, ITS, and gyrB (Minot et al., 2015) to identify species level taxa. Data was sorted for a limited number of P solubilizing bacteria and mycorrhizae taxa likely found in this soil.
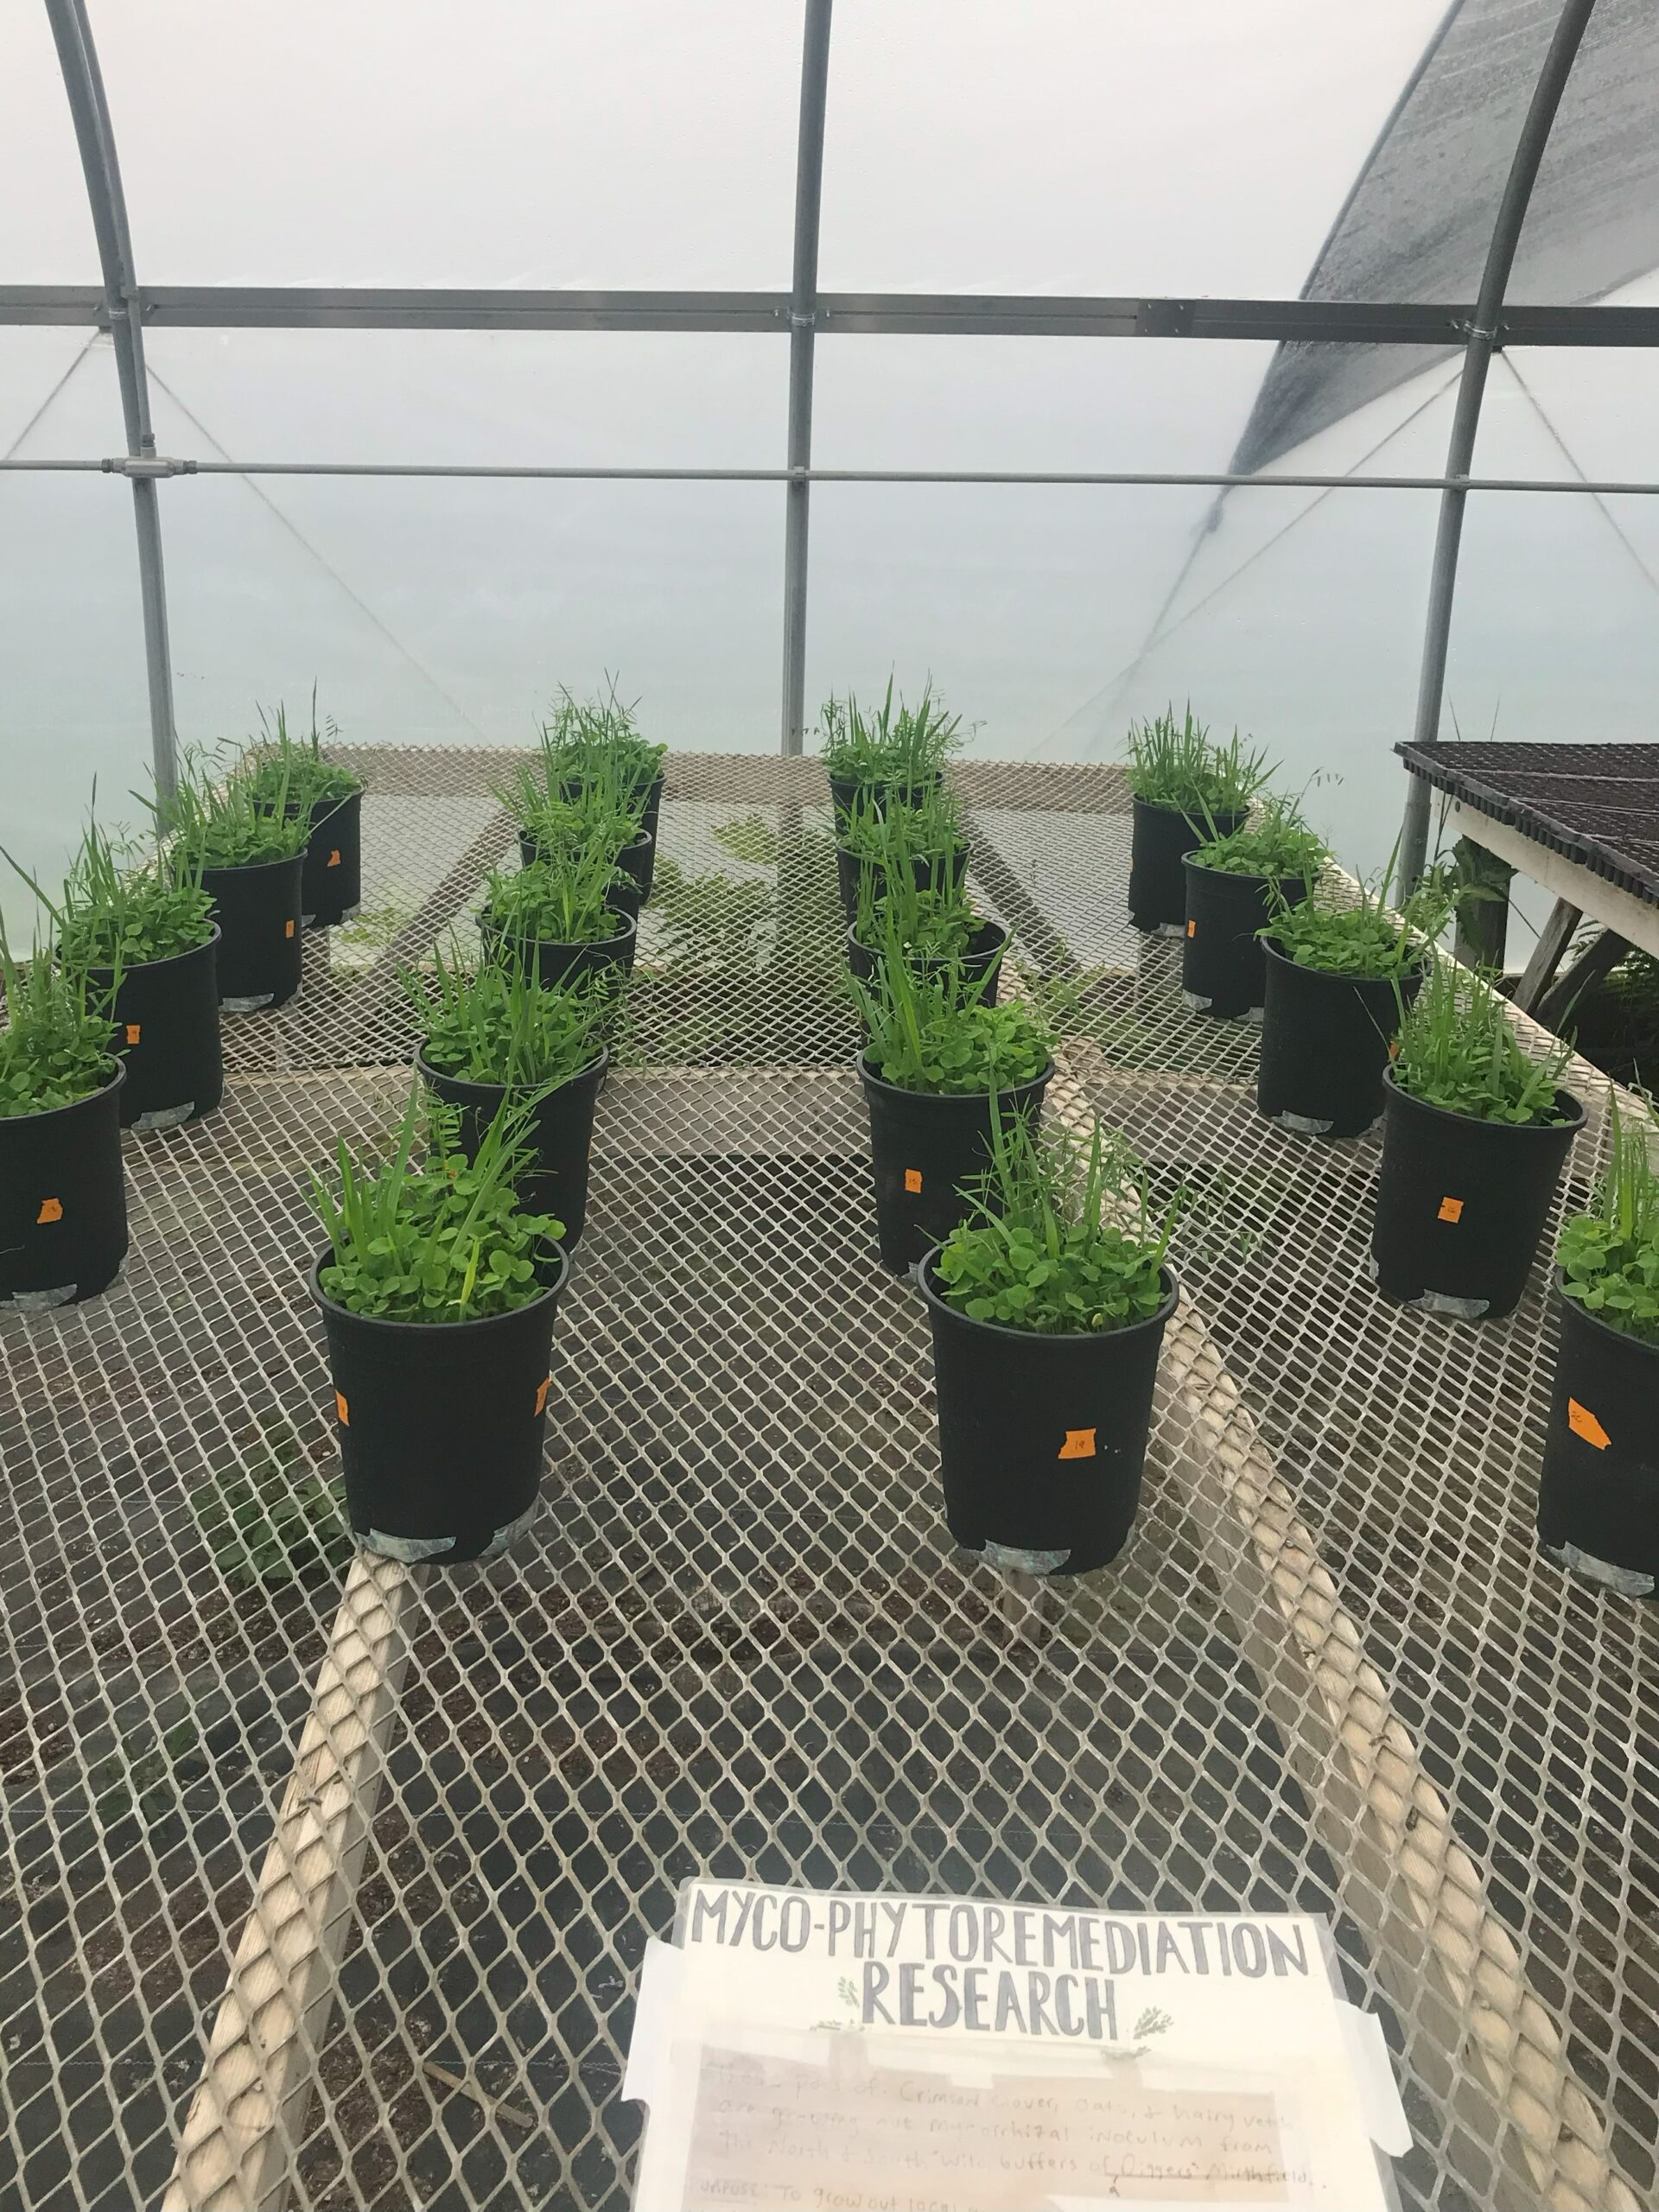
Year 1 Greenhouse Research
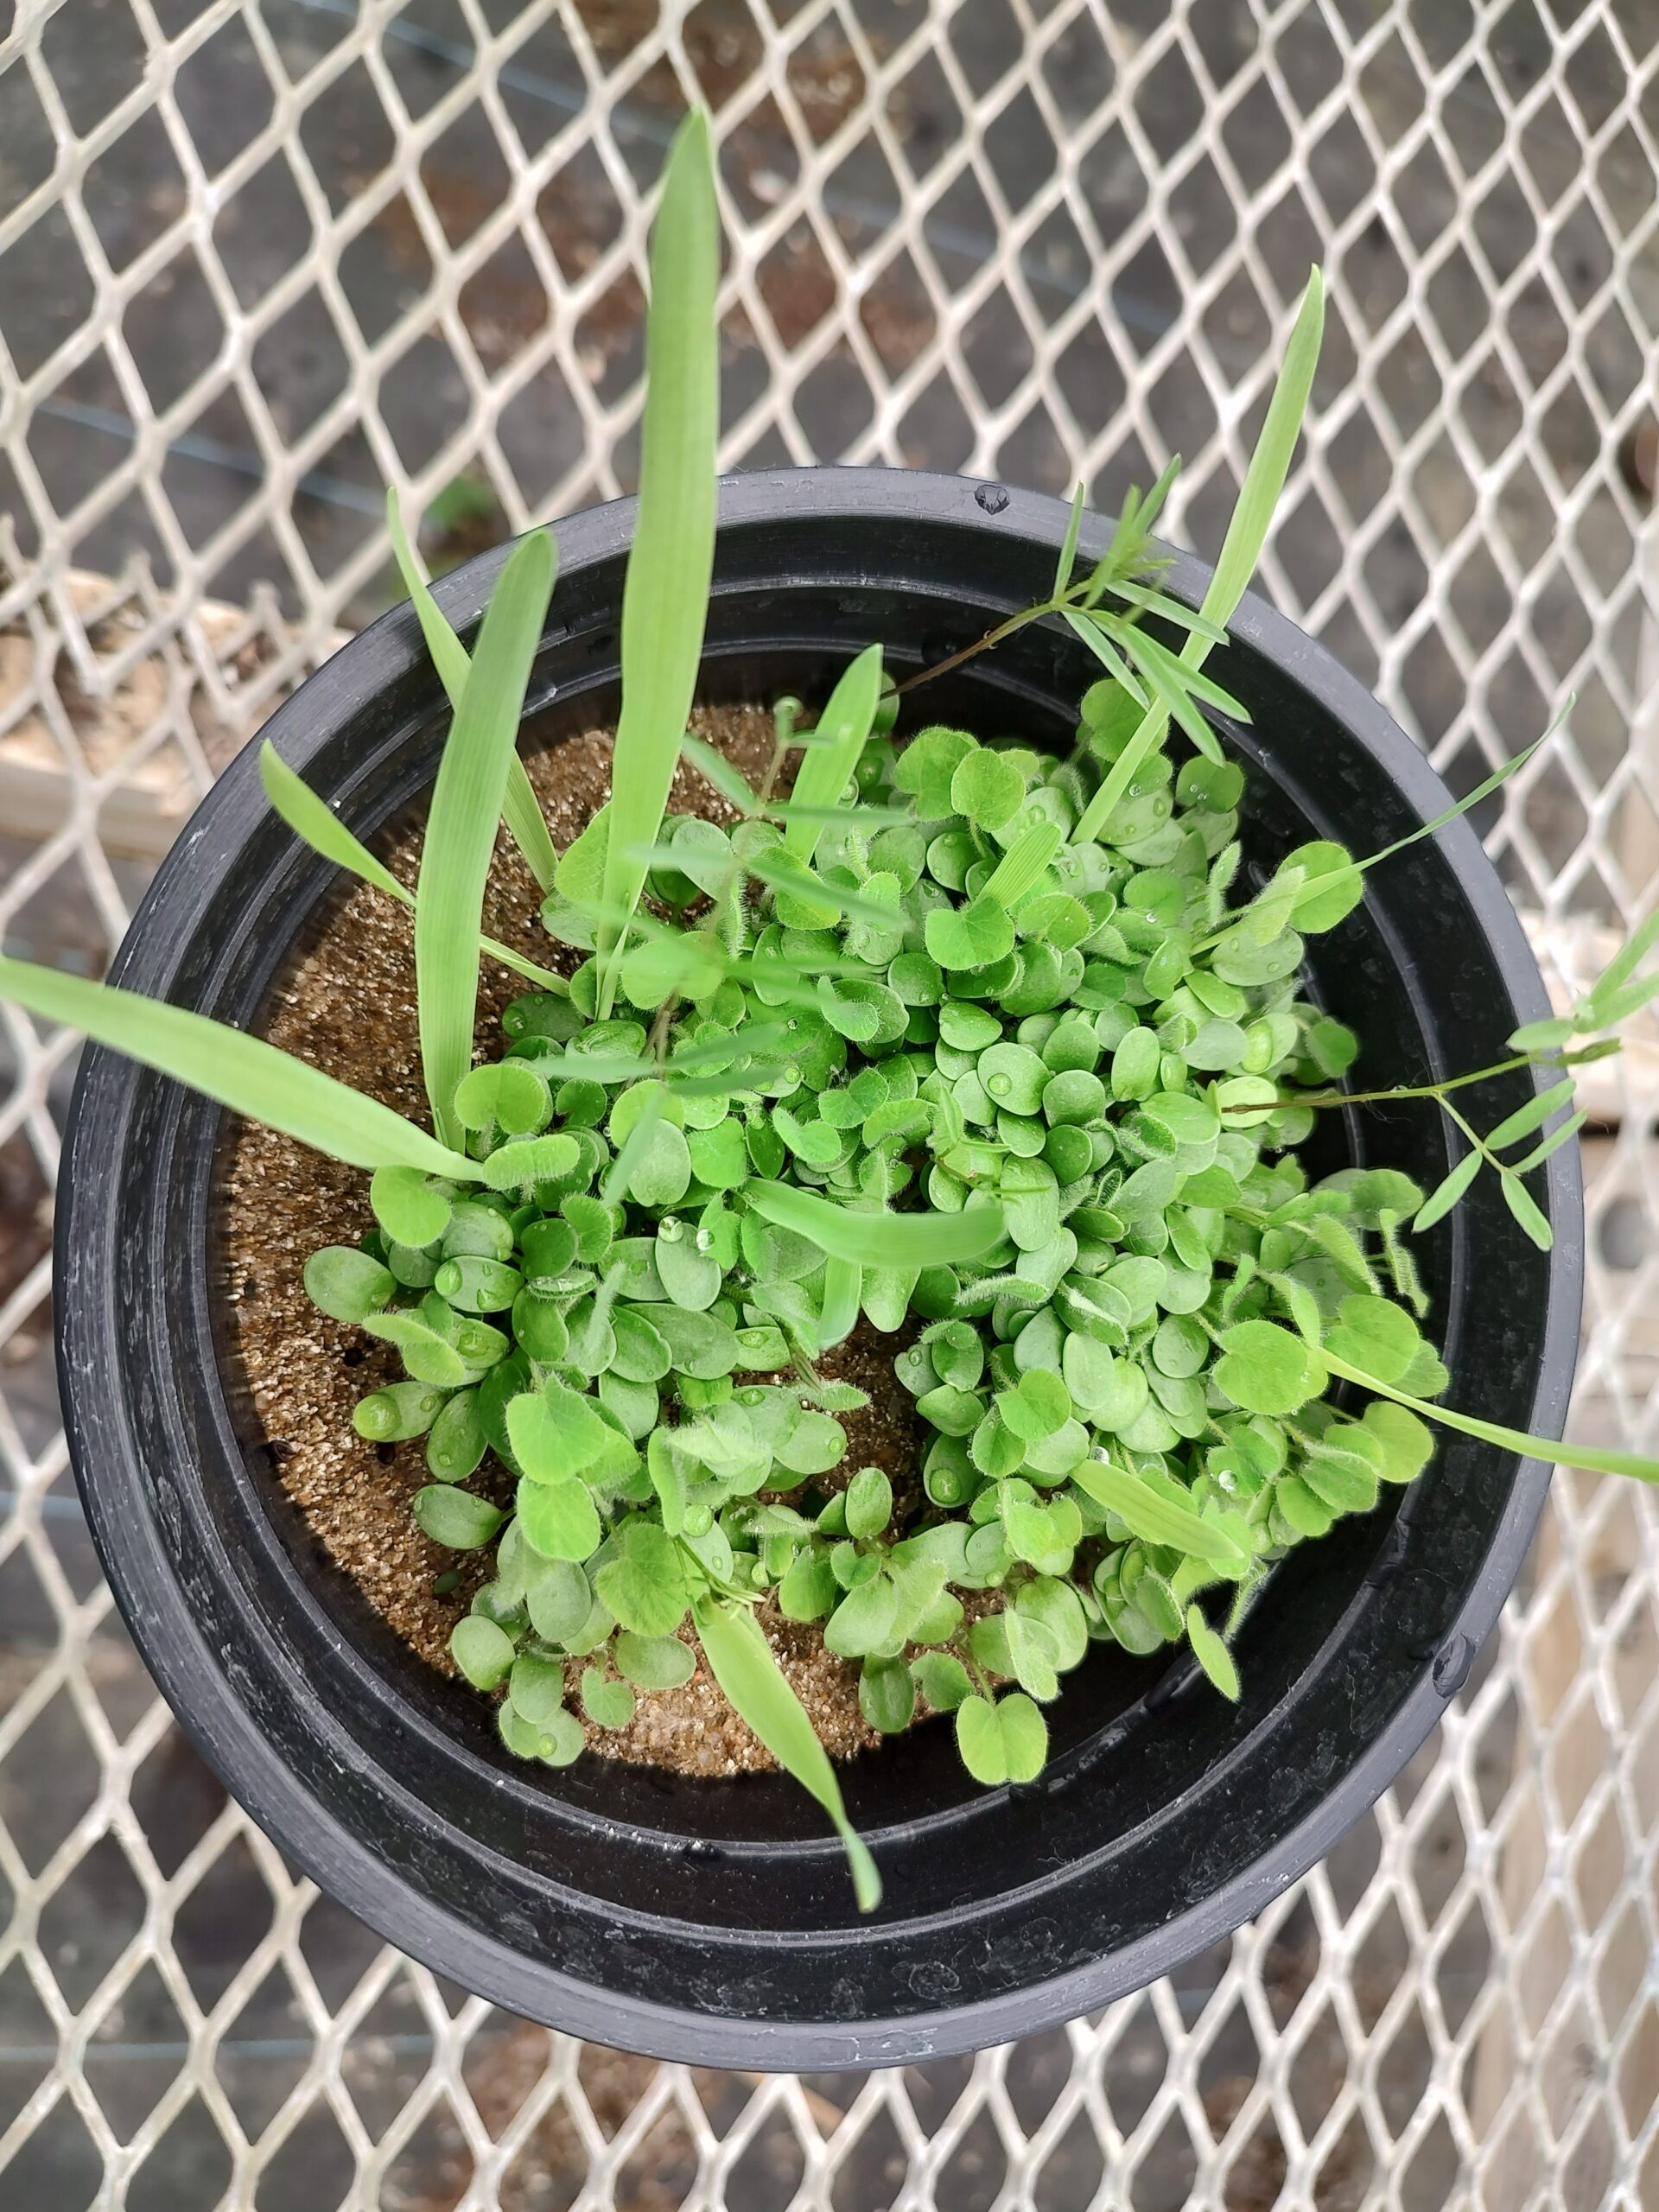
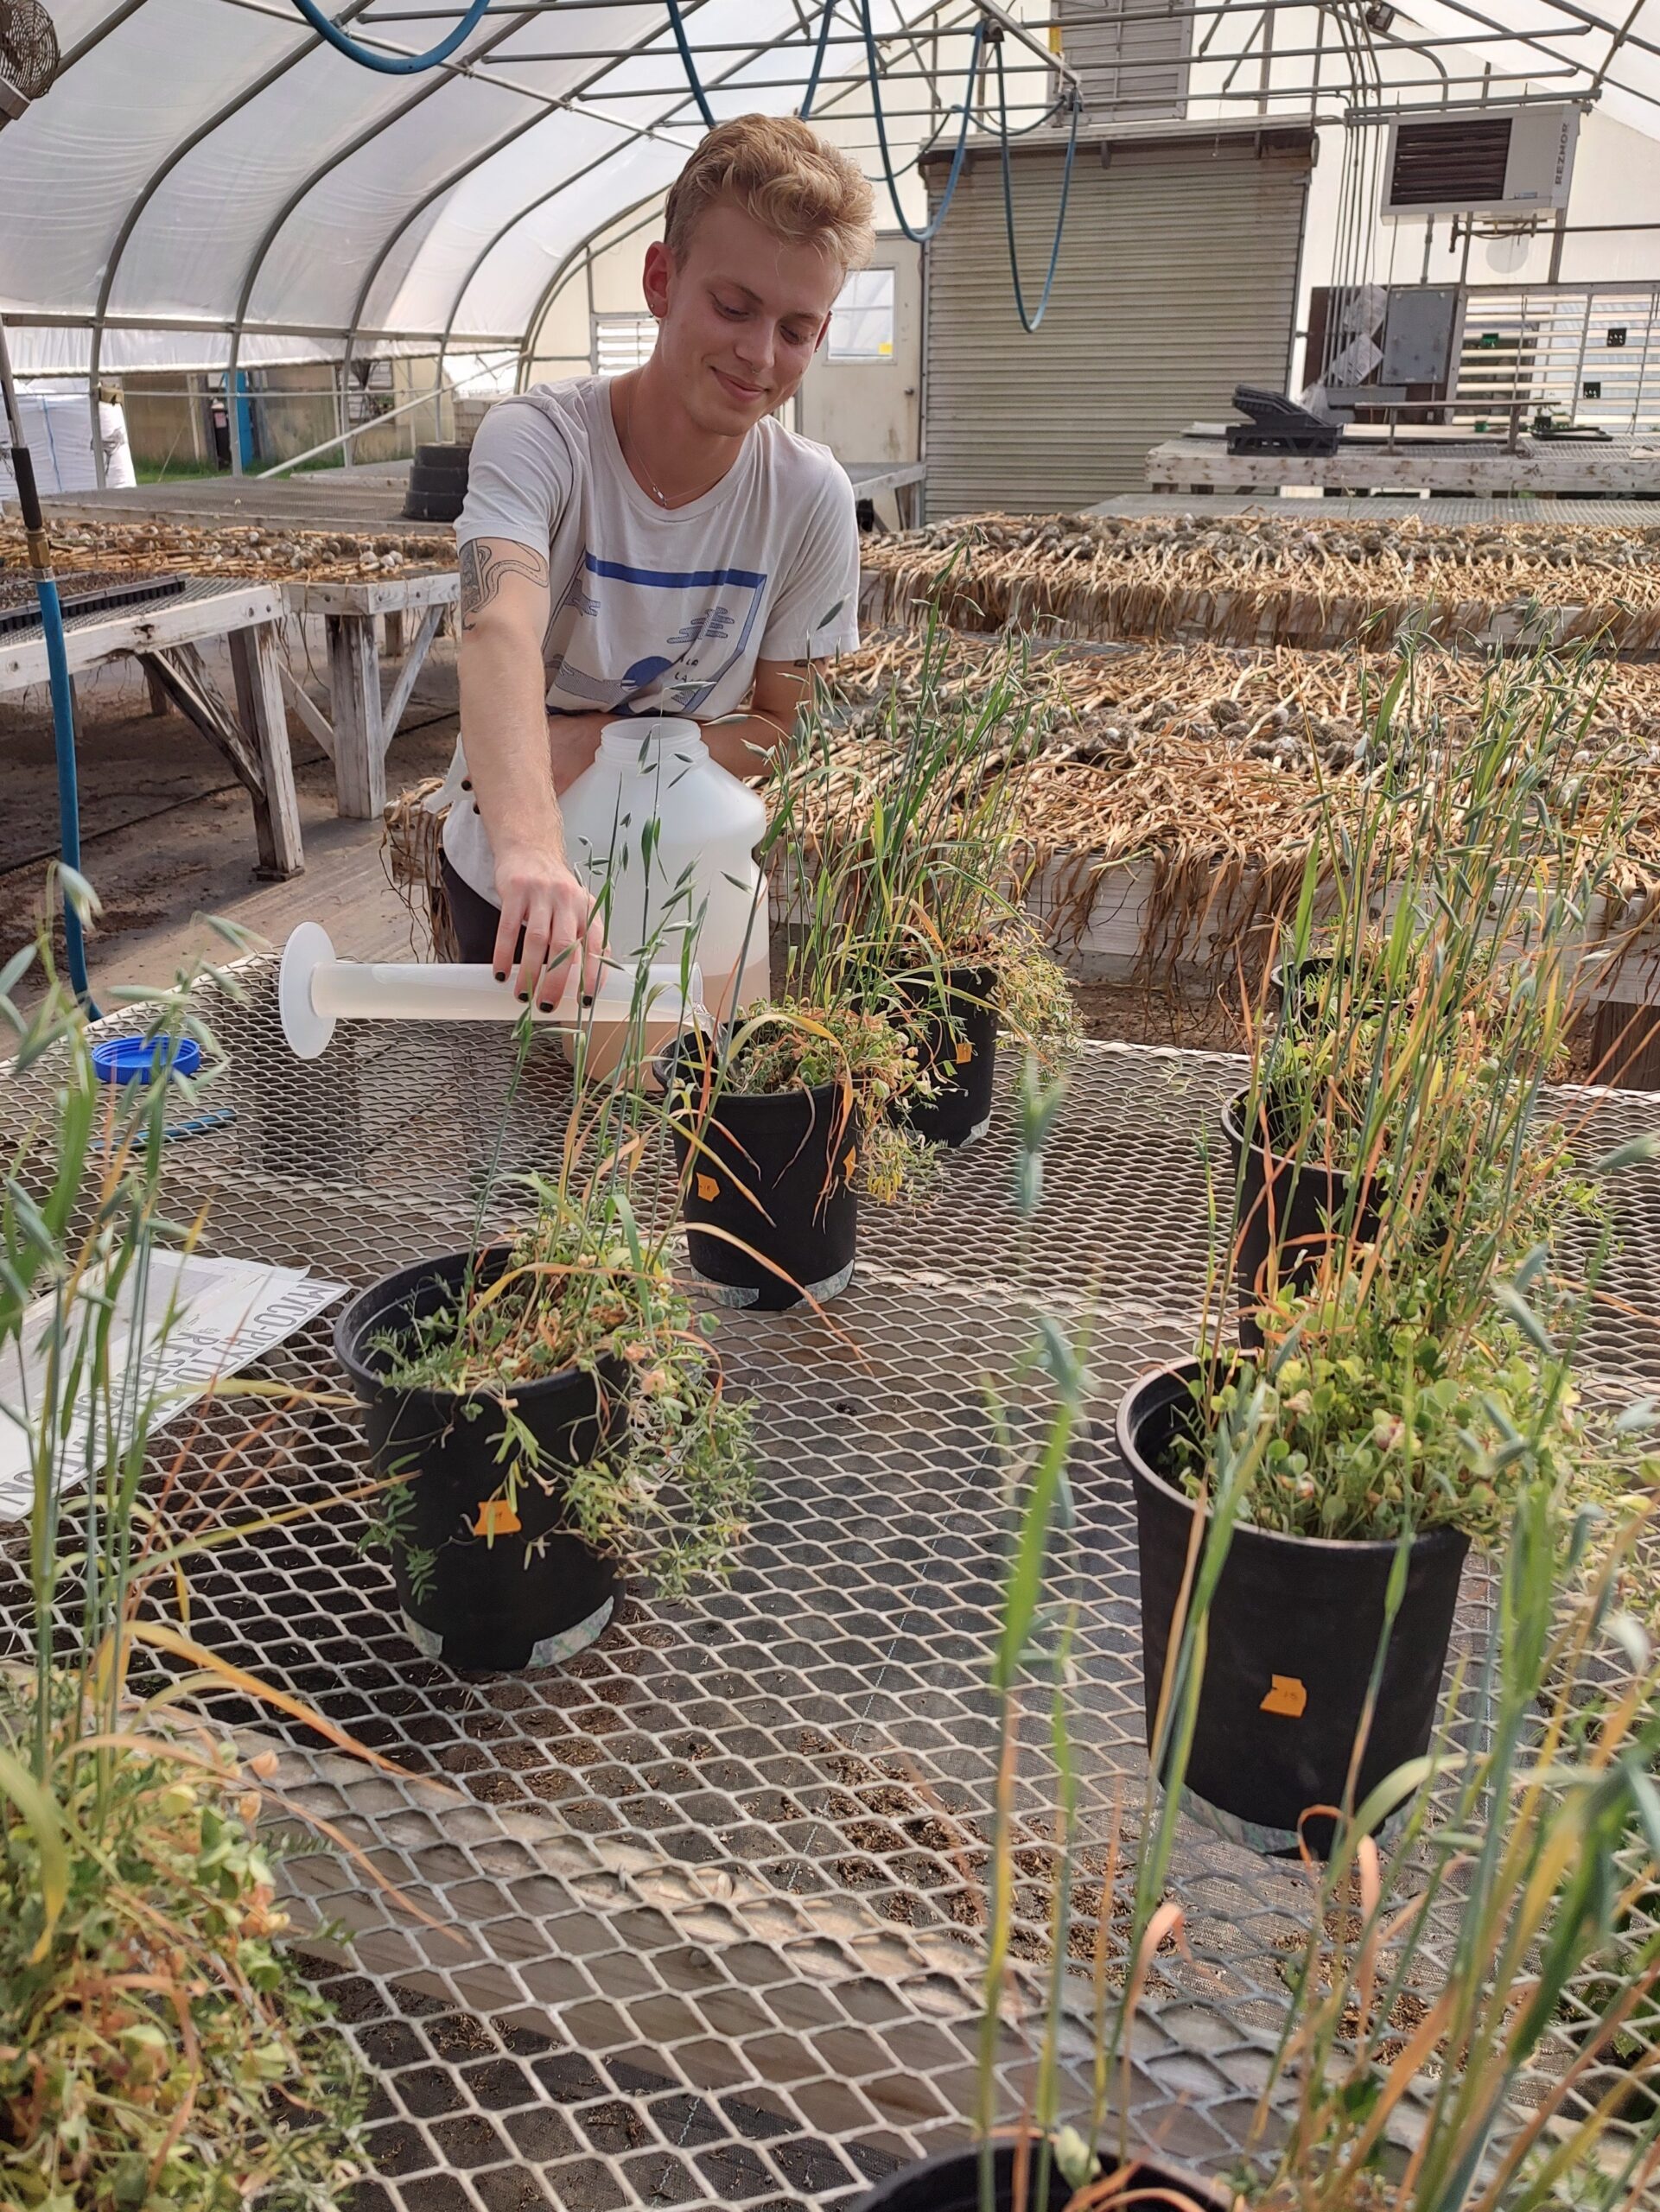
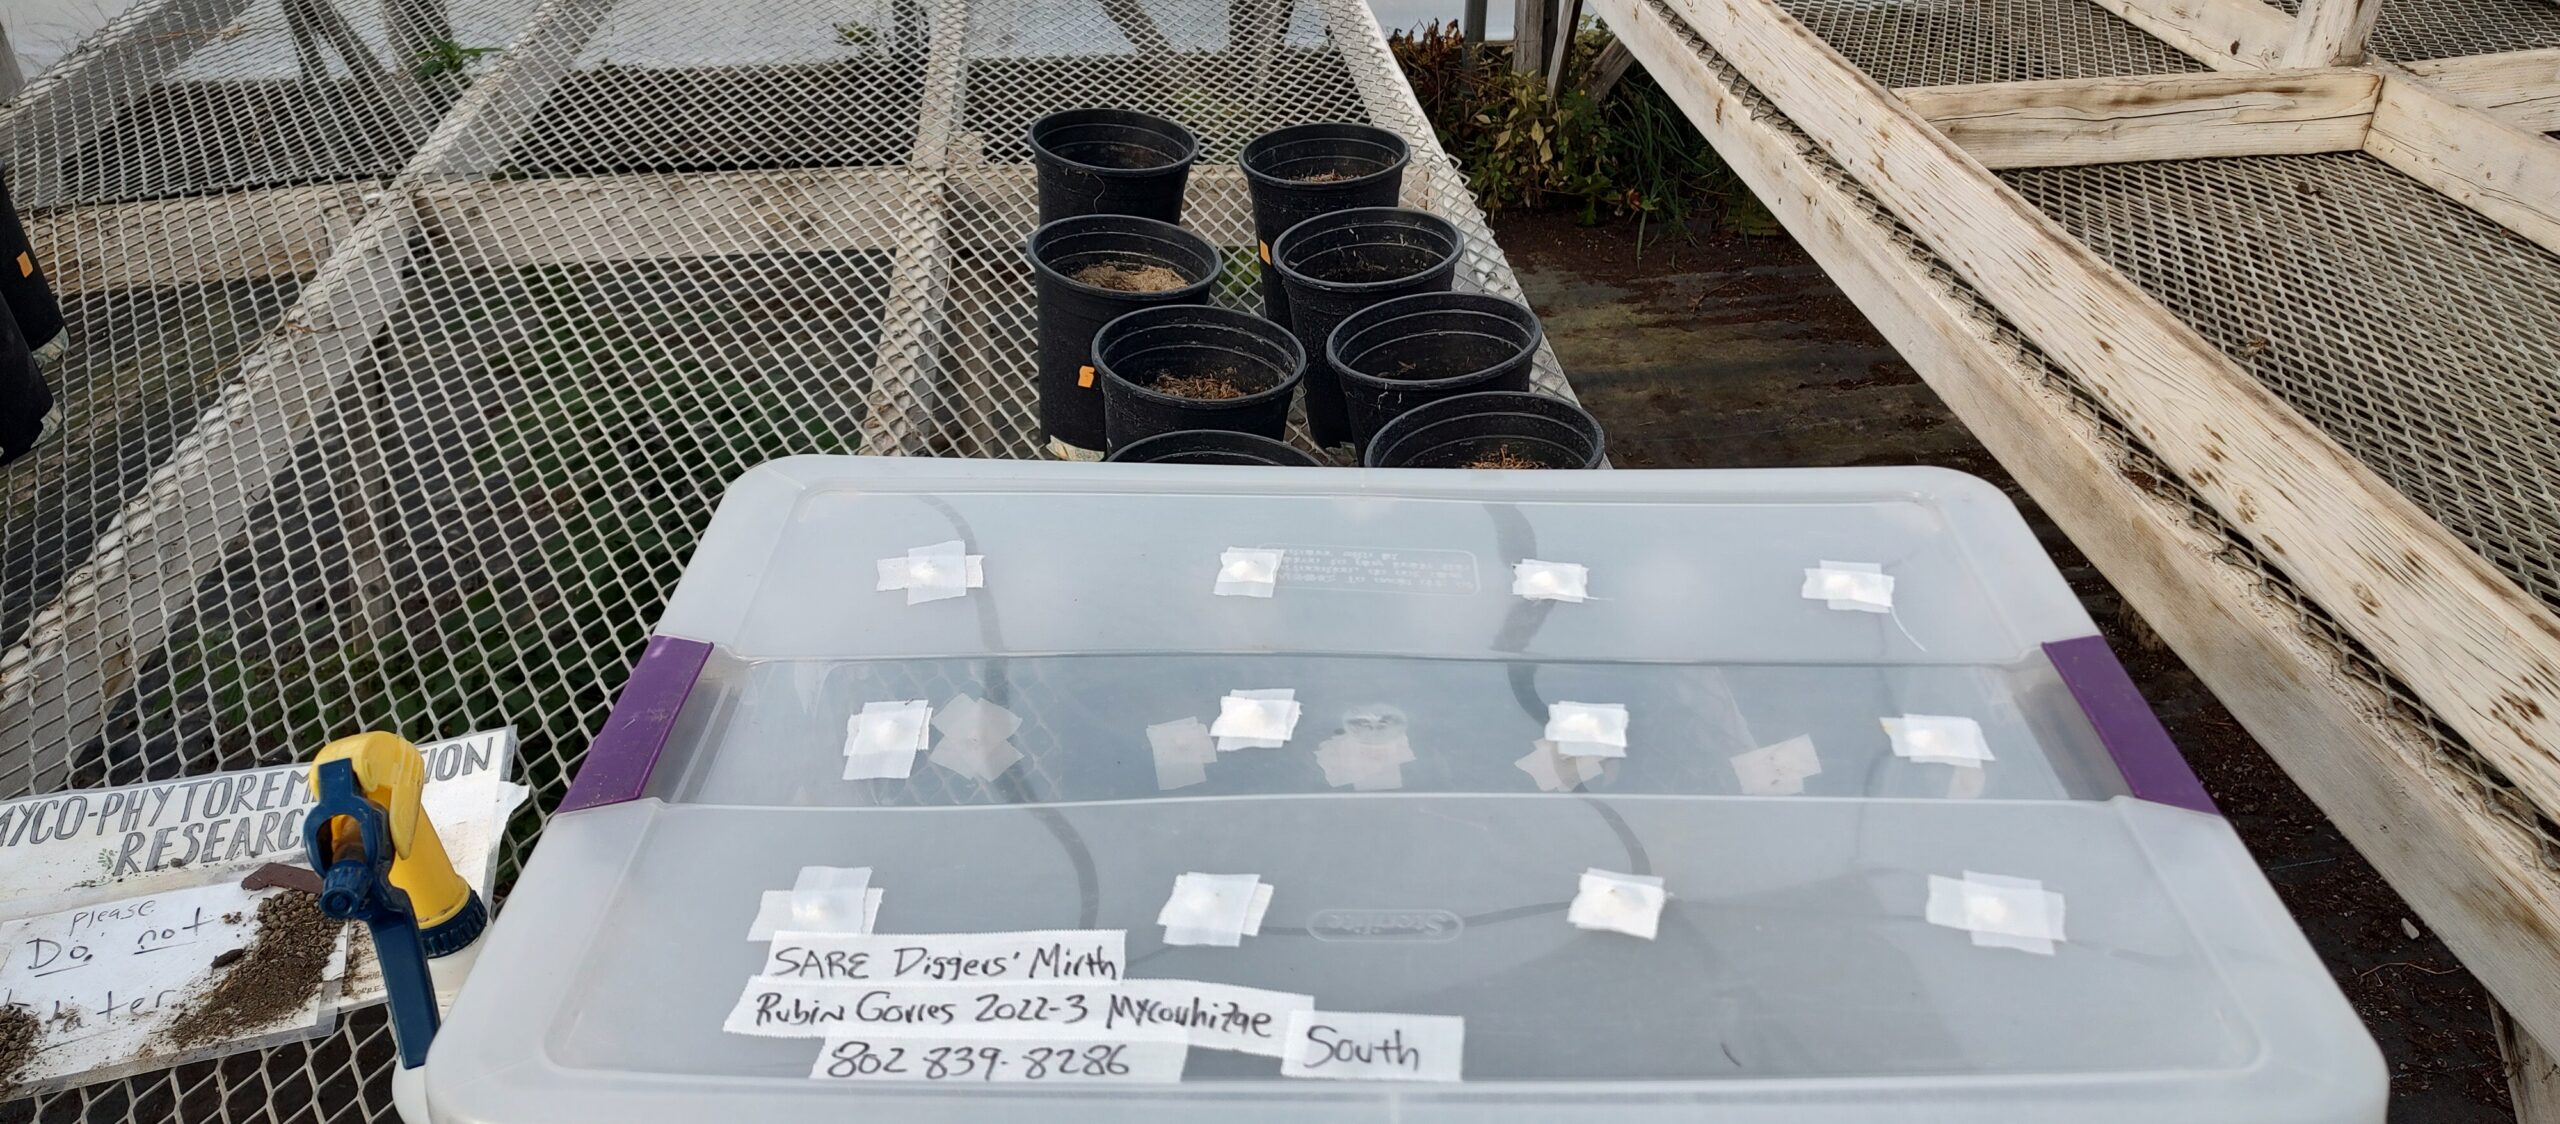
The detailed methodology of how the inoculum was cultured, tested for viability and stored through the pot cultures is written out in the guide that is an educational output for this project (linked here). In short, when soil was gathered from the N and S wild buffers, they were added to sterilized and prepared medium in pots that were then planted with the same cover crop mix as the edge of field banks. These were organized in a random block design (Image 2) and grown in a greenhouse at the farm. As they grew, (Images 16, 17, 18), they were watered once a day and fertilized once a week (Image 19) with a modified fertilizer solution (340 ml per pot) which was a mix of 15g North Country Organics (6-0-6), 0.9g Epsom salt, 6ml Neptune's Harvest (2-3-1), 2 gallons of water. After 14 weeks watering and fertilization stopped. Week 15 plants were cut. Week 16 samples were tested for viable spores. Once deemed viable (Image 19), they were cut in small pieces, mixed into the medium and stored in sterilized bins with holes covered with athletic tape (Image 21) and stored in a fridge until they are applied later this spring to soil hosting fresh parsley seeds.


In Year 2
In year 2, we grew endemic mycorrhizae, as described in detail in this guide (Kolba et al., 2022) and gifted half of the viable endemic mycorrhizae to the farmers to apply wherever they saw fit. The other half were applied in a random block design study comparing endemic, commercial, and no inoculation growing parsley in polyculture (crimson clover, oats, vetch) plots separated by radish rows (Image 21) in a Diggers’ Mirth field that was tilled in early spring of 2023.
Image 21. Random block design of three treatments separated by radish rows, which inhibit mycorrhizal inoculation and can thereby serve as buffers between the treatment plots.
Year 2 Greenhouse Planting and Field Installation
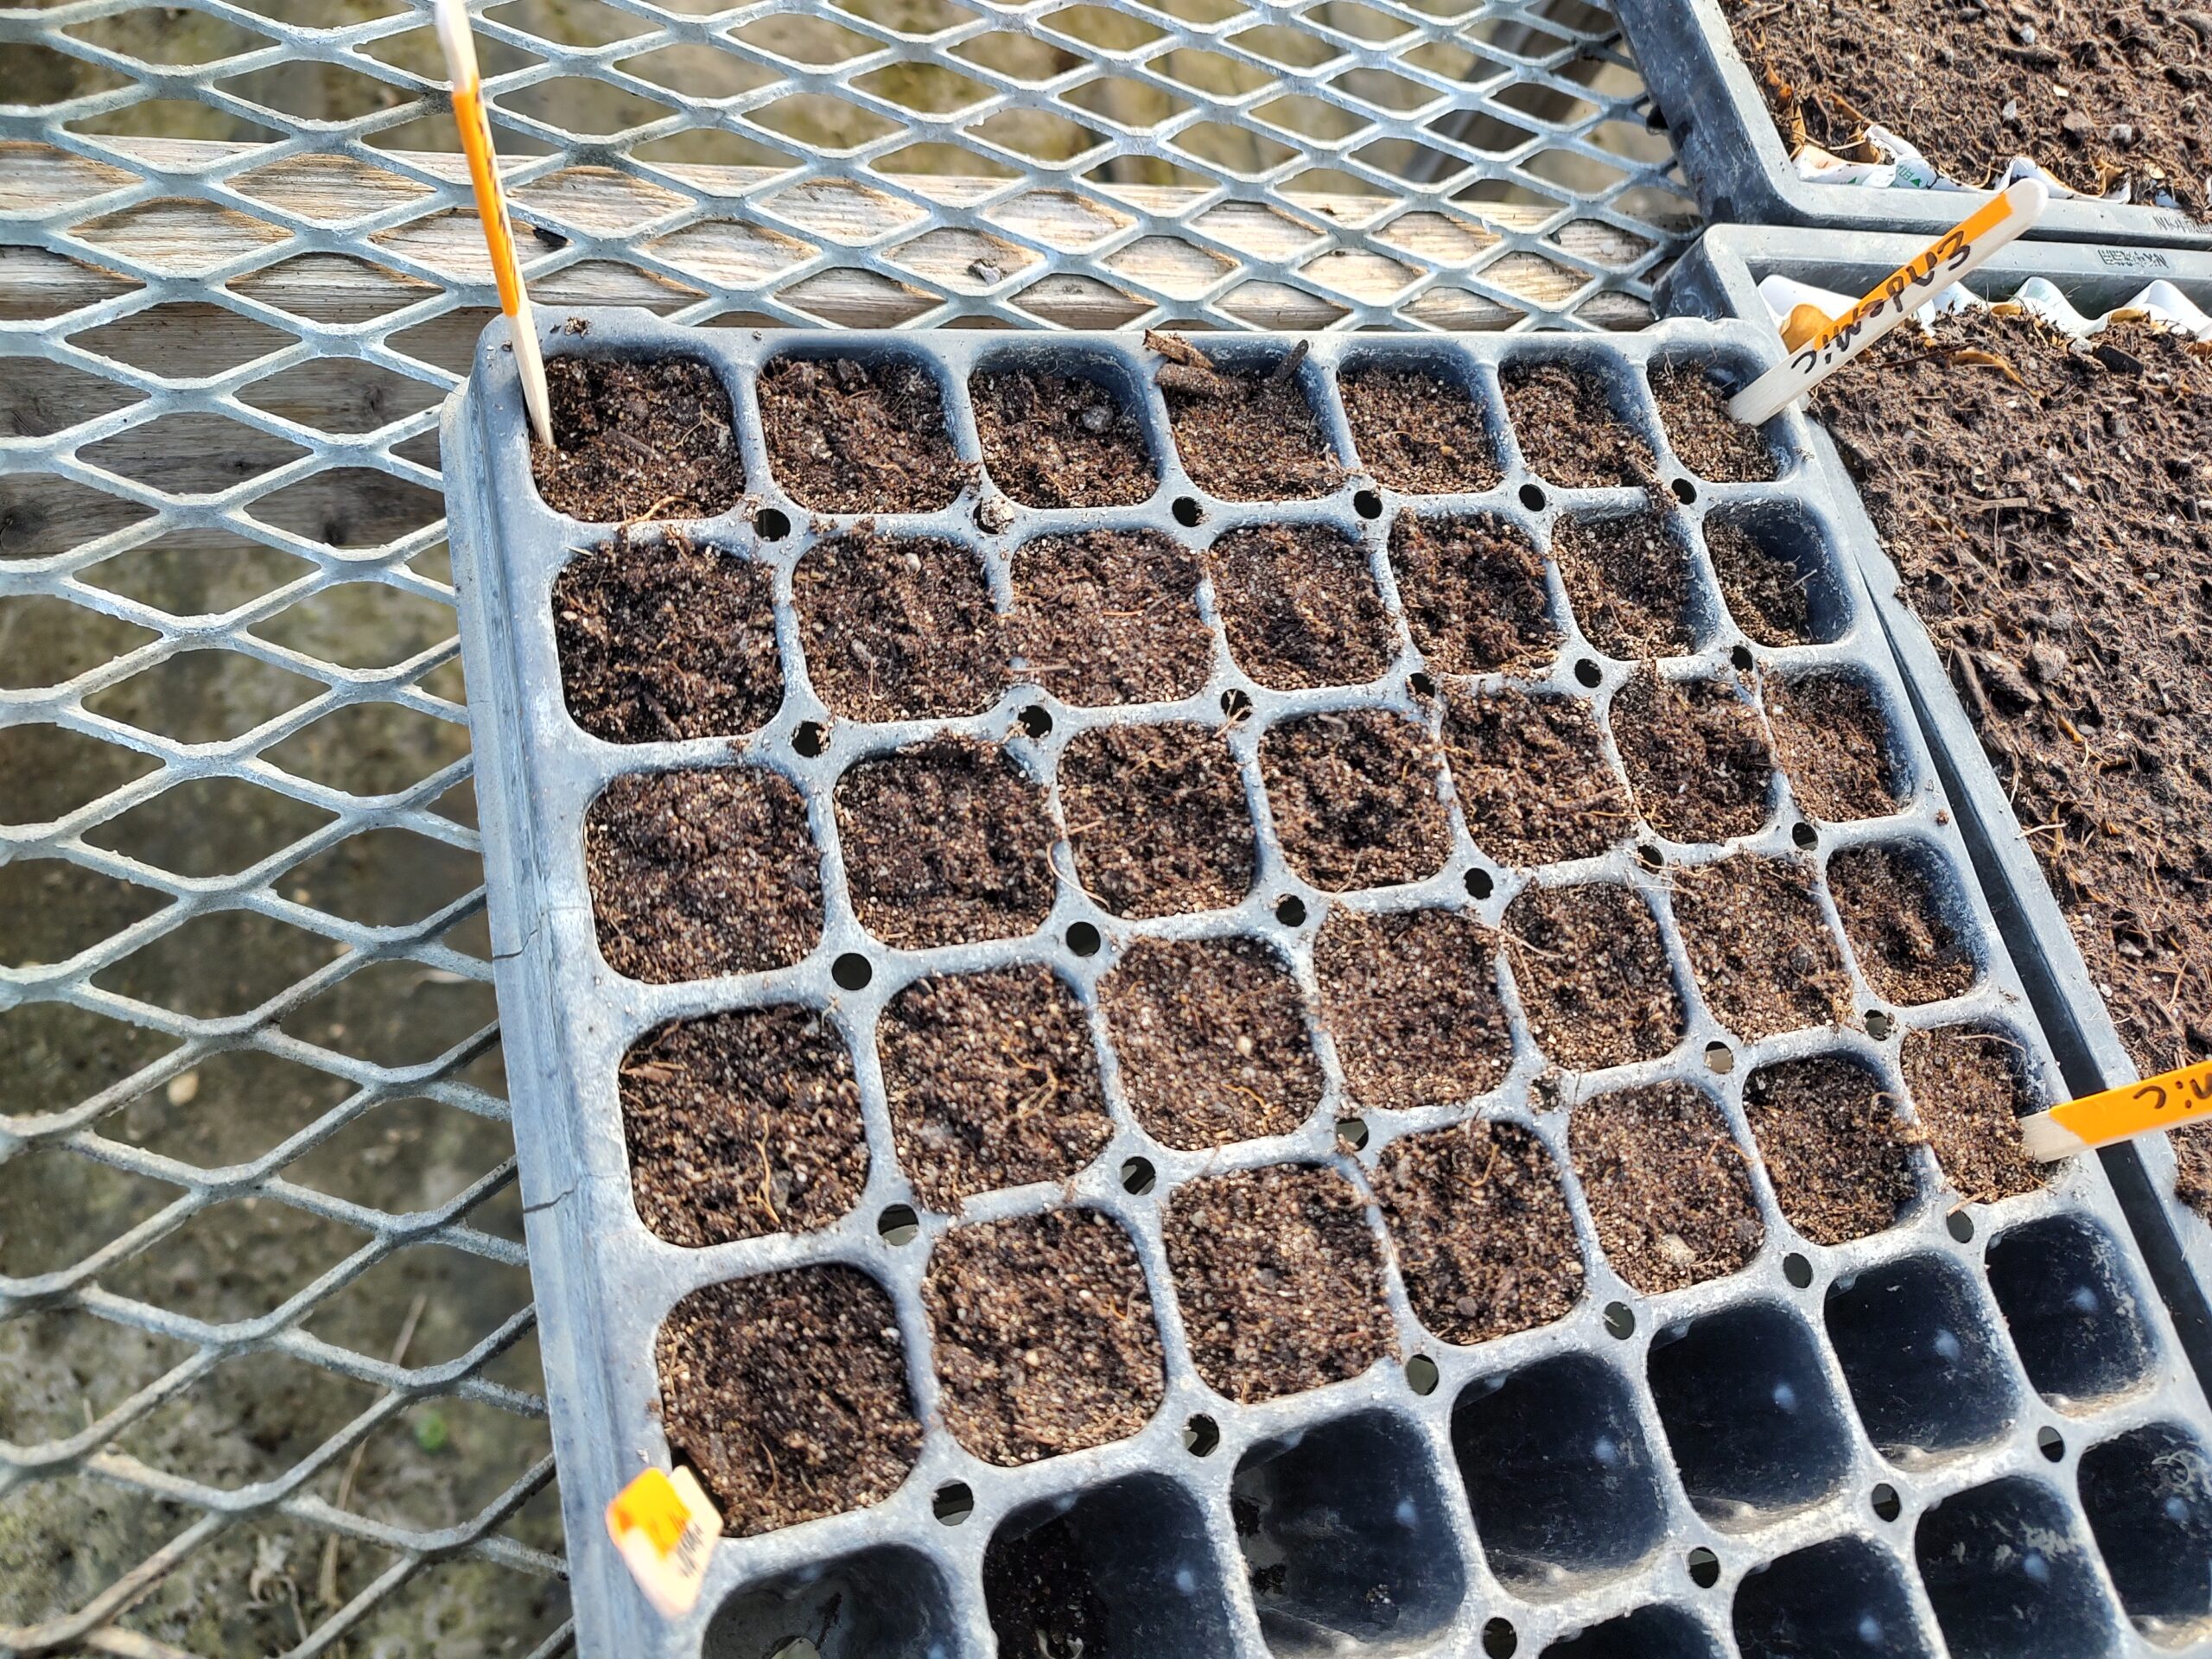
In late March, 72 parsley seeds were planted in VT Compost Fort Vee mix in trays which were divided into 3 treatments: not inoculated, commercial mycorrhizae and endemic mycorrhizae.

![]()
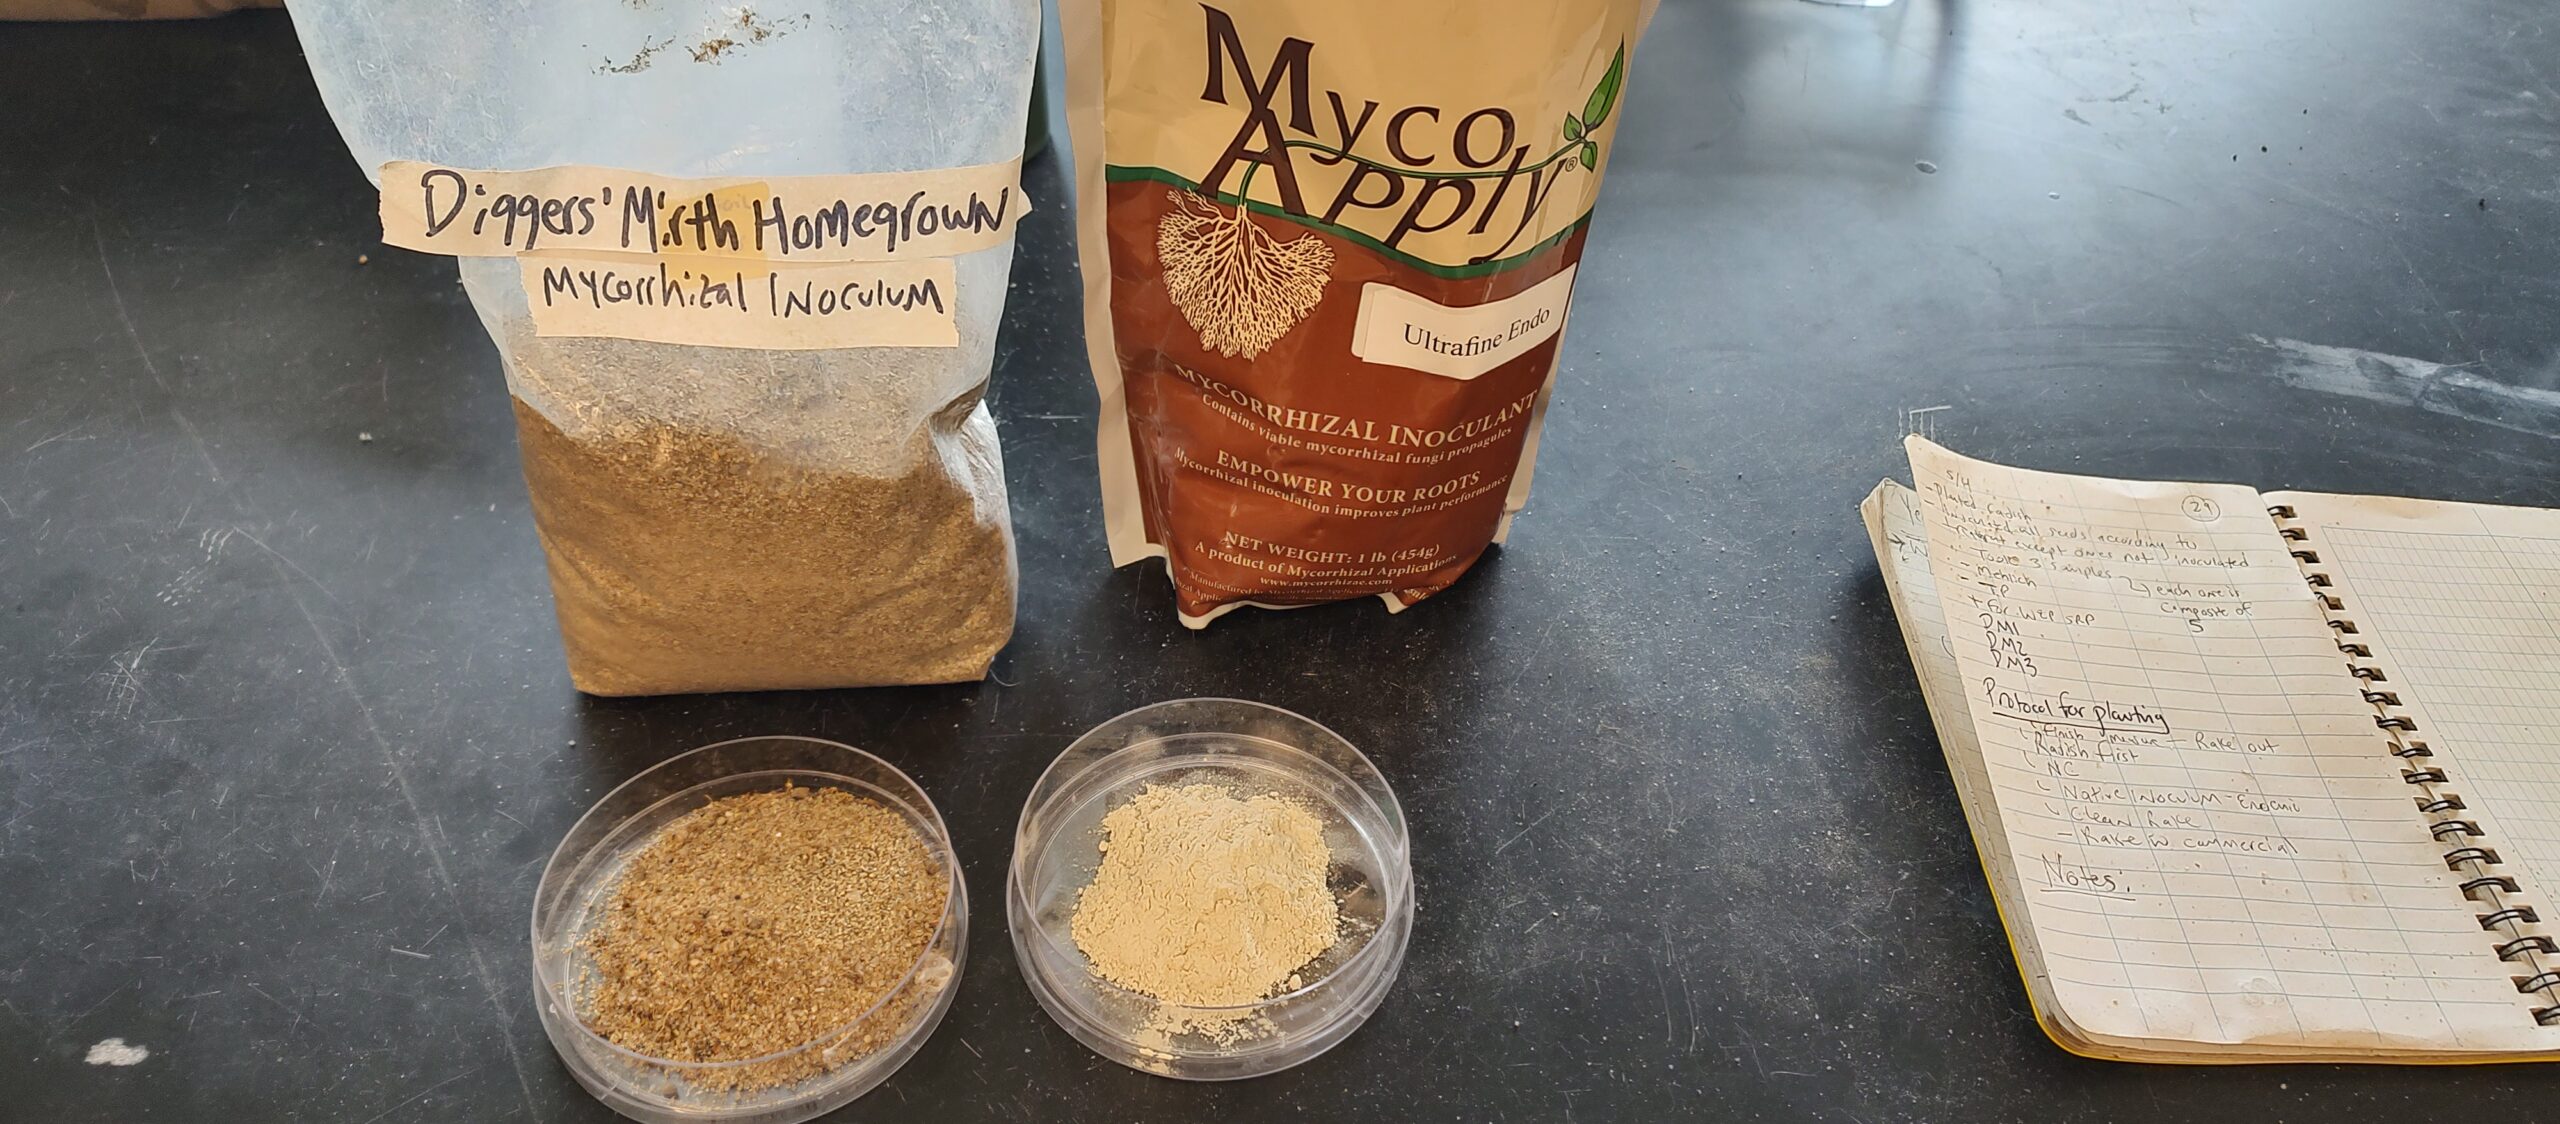
Images 22, 23, 24, 25. Parsley planted in trays with their respective treatments, Jess Rubin adding inoculant to mix, two inoculants, parsley ready to be transplanted into the field.
VT Compost Fort Vee mix was tested for initial mycorrhizal inoculation (to determine if baseline mycorrhizae were present) via spore extraction (SOP available upon request). Spores were extracted through modified protocols involving 25 g of soil, soap, a blender, sieves, sugar solution, and centrifuging to obtain spores in 50 ml of supernatant suspension. 0.5 ml of the spore suspension was pipetted onto a clean, labelled slide and spores were counted under a microscope. Spore density was calculated from the counts, dilution and amount of soil used (Gerdemann and Nicolson, 1963). From three trials, the mean was 38.67 (spores per gram) which was considered low and thereby not a concern to use for the treatments in the above design.
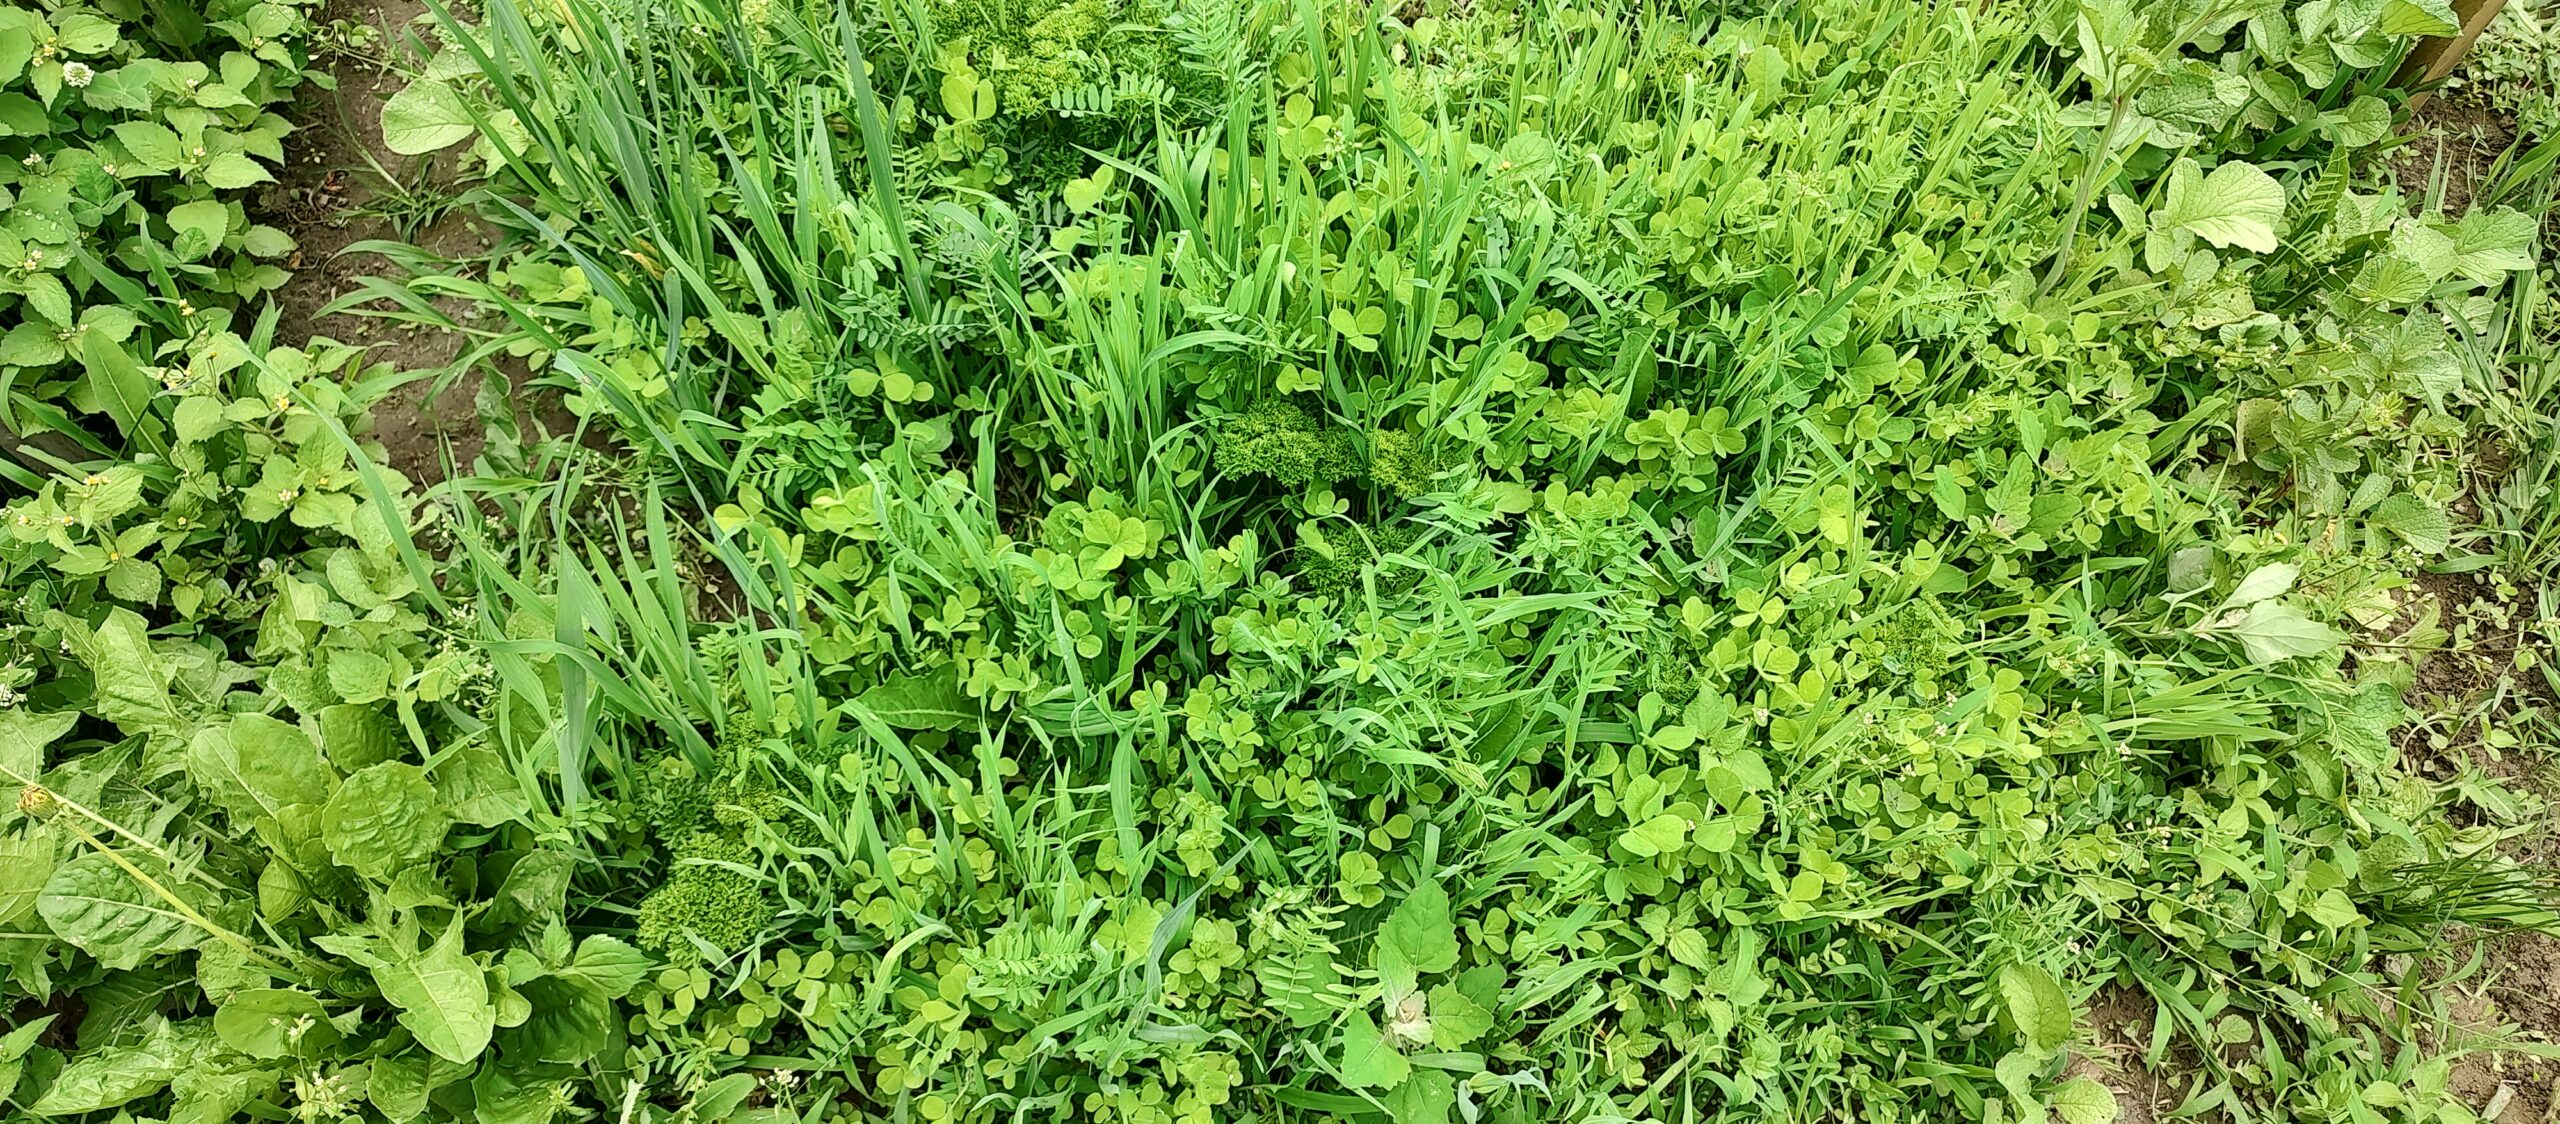
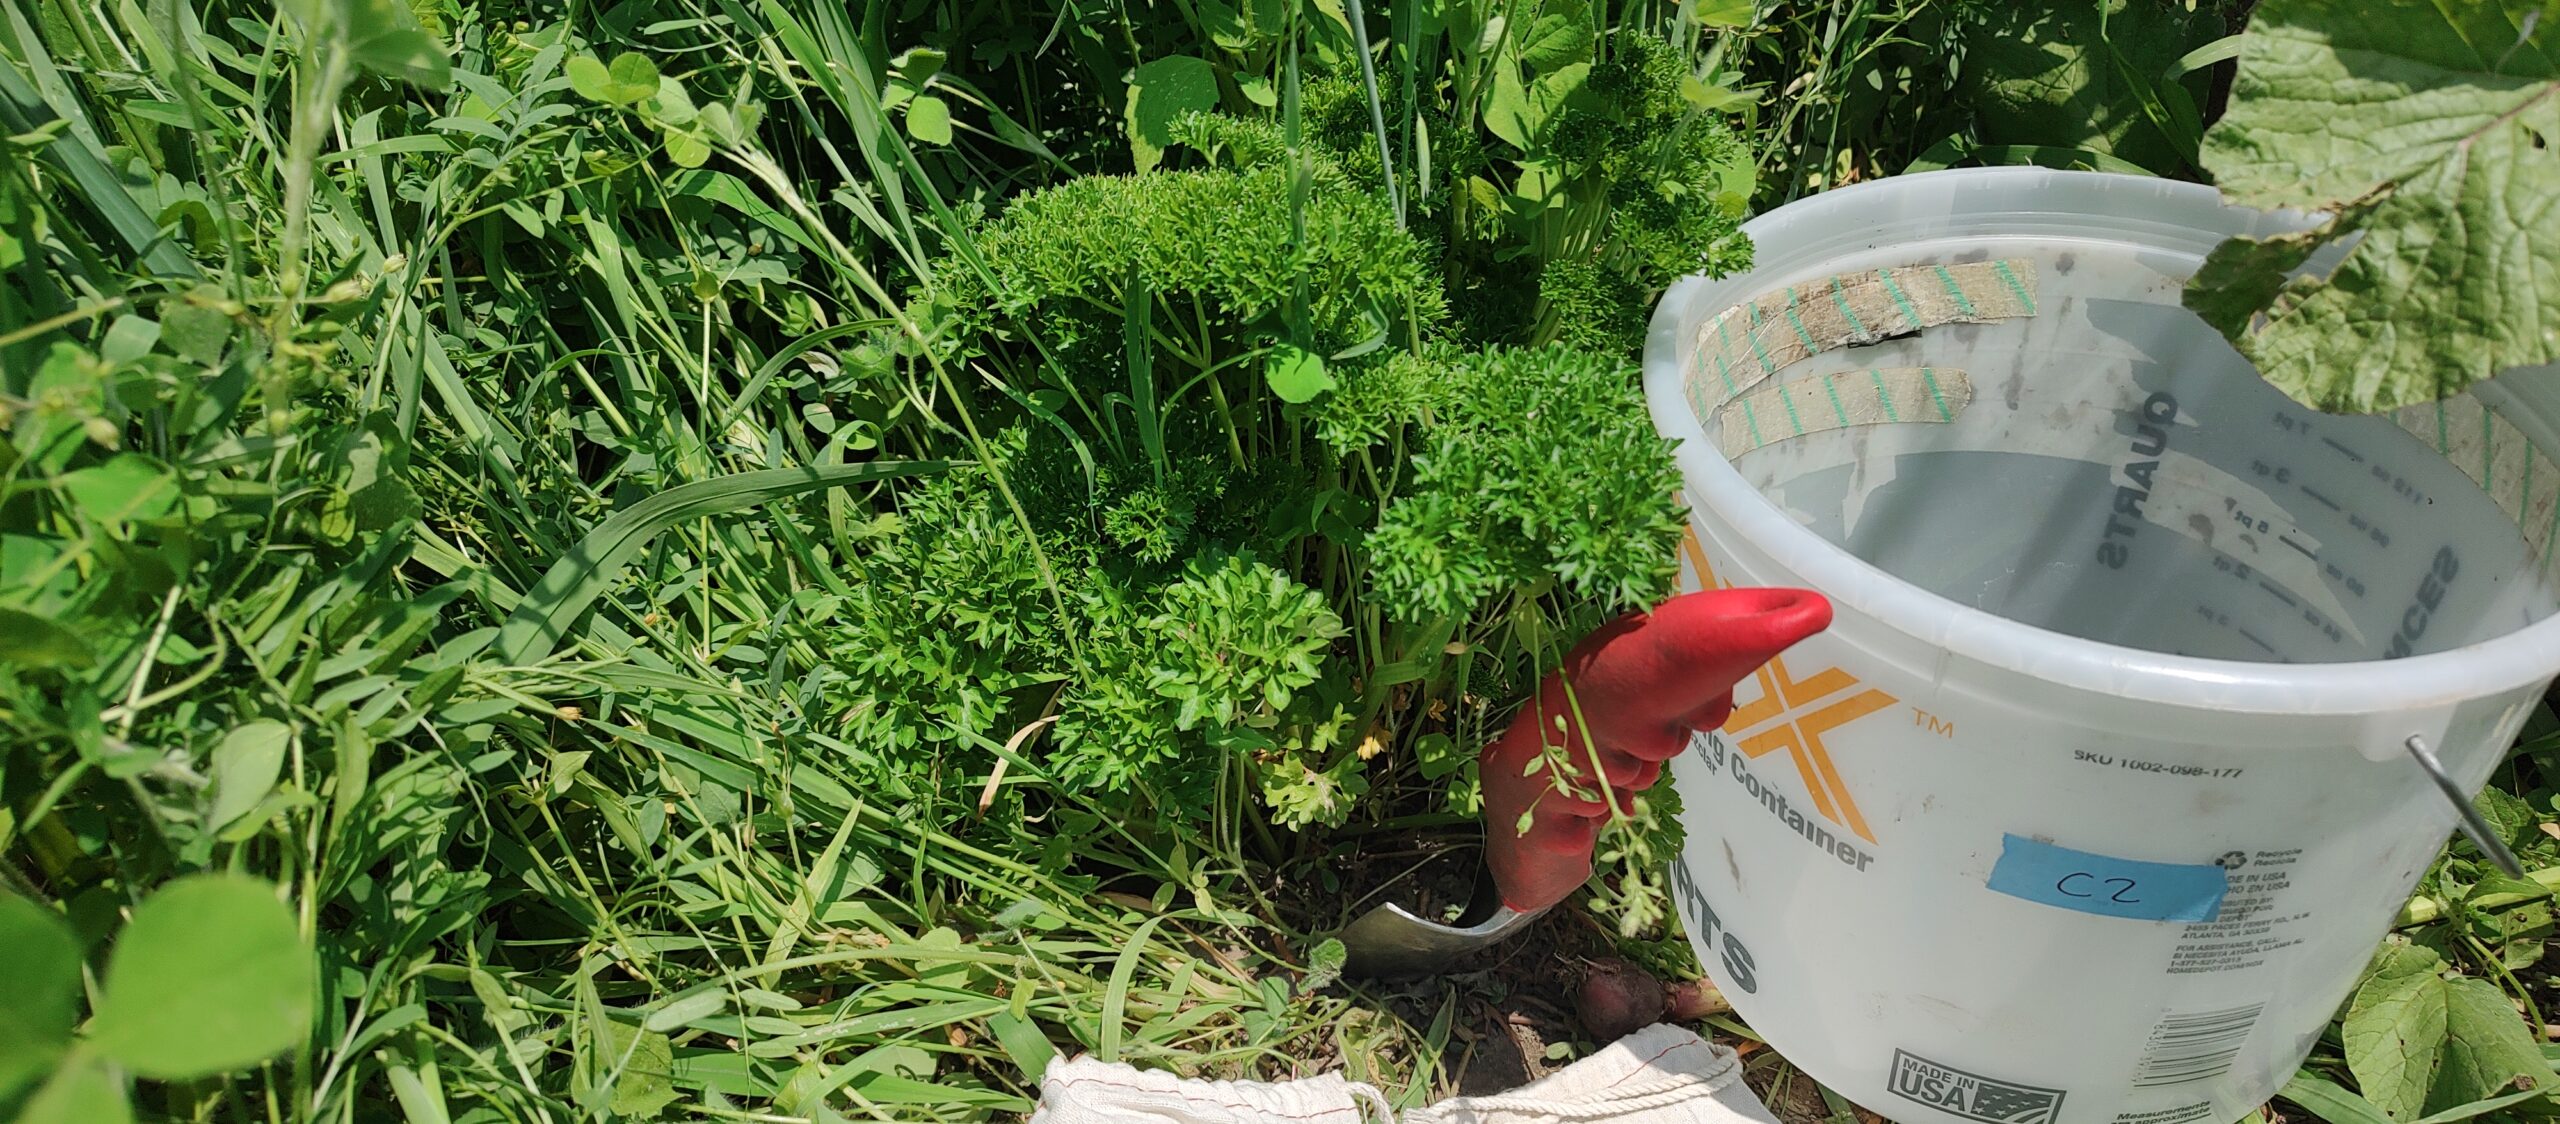
Parsley seed inoculation occurred in the greenhouse with: one third endemic mycorrhizae which we grew from wild buffers surrounding Diggers’ Mirth fields, another third with commercial inoculum (Mycorrhizal Applications, 2023), and the last third without any mycorrhizae except those naturally occurring in the Fort Vee mix. Calculations involving the ratio of 1:9 inoculation: soil guided applications of the inoculum (commercial or endemic mycorrhizae) to their respective soil trays. Parsley was thinned once in April. Meanwhile the field was tilled in early May. Soon after baseline soil and soil water P samples were taken and the cover crop mix was planted in the experimental area (with corresponding treatment added at planting to soil in respective treatment plots: endemic, commercial or no inoculant) along with radish rows separating each, according to the design (Image 21). Each treatment plot, labelled with wooden stakes, was 3’x 3’. Parsley was transplanted into the plots according to their treatment, five per plot, when the cover crop was barely beginning to rise through the soil (Image 30). The plots required weeding, heavily (Image 31) (150 gallons of weeds removed) at first and decreasingly each of the four times. Consistent rain throughout the season ensured no additional water was required.

Images 26, 27, 28, 29. Researcher Jess Rubin laying out the plots, intern Abby Meunier adding inoculum and weeding, Initial study setup.
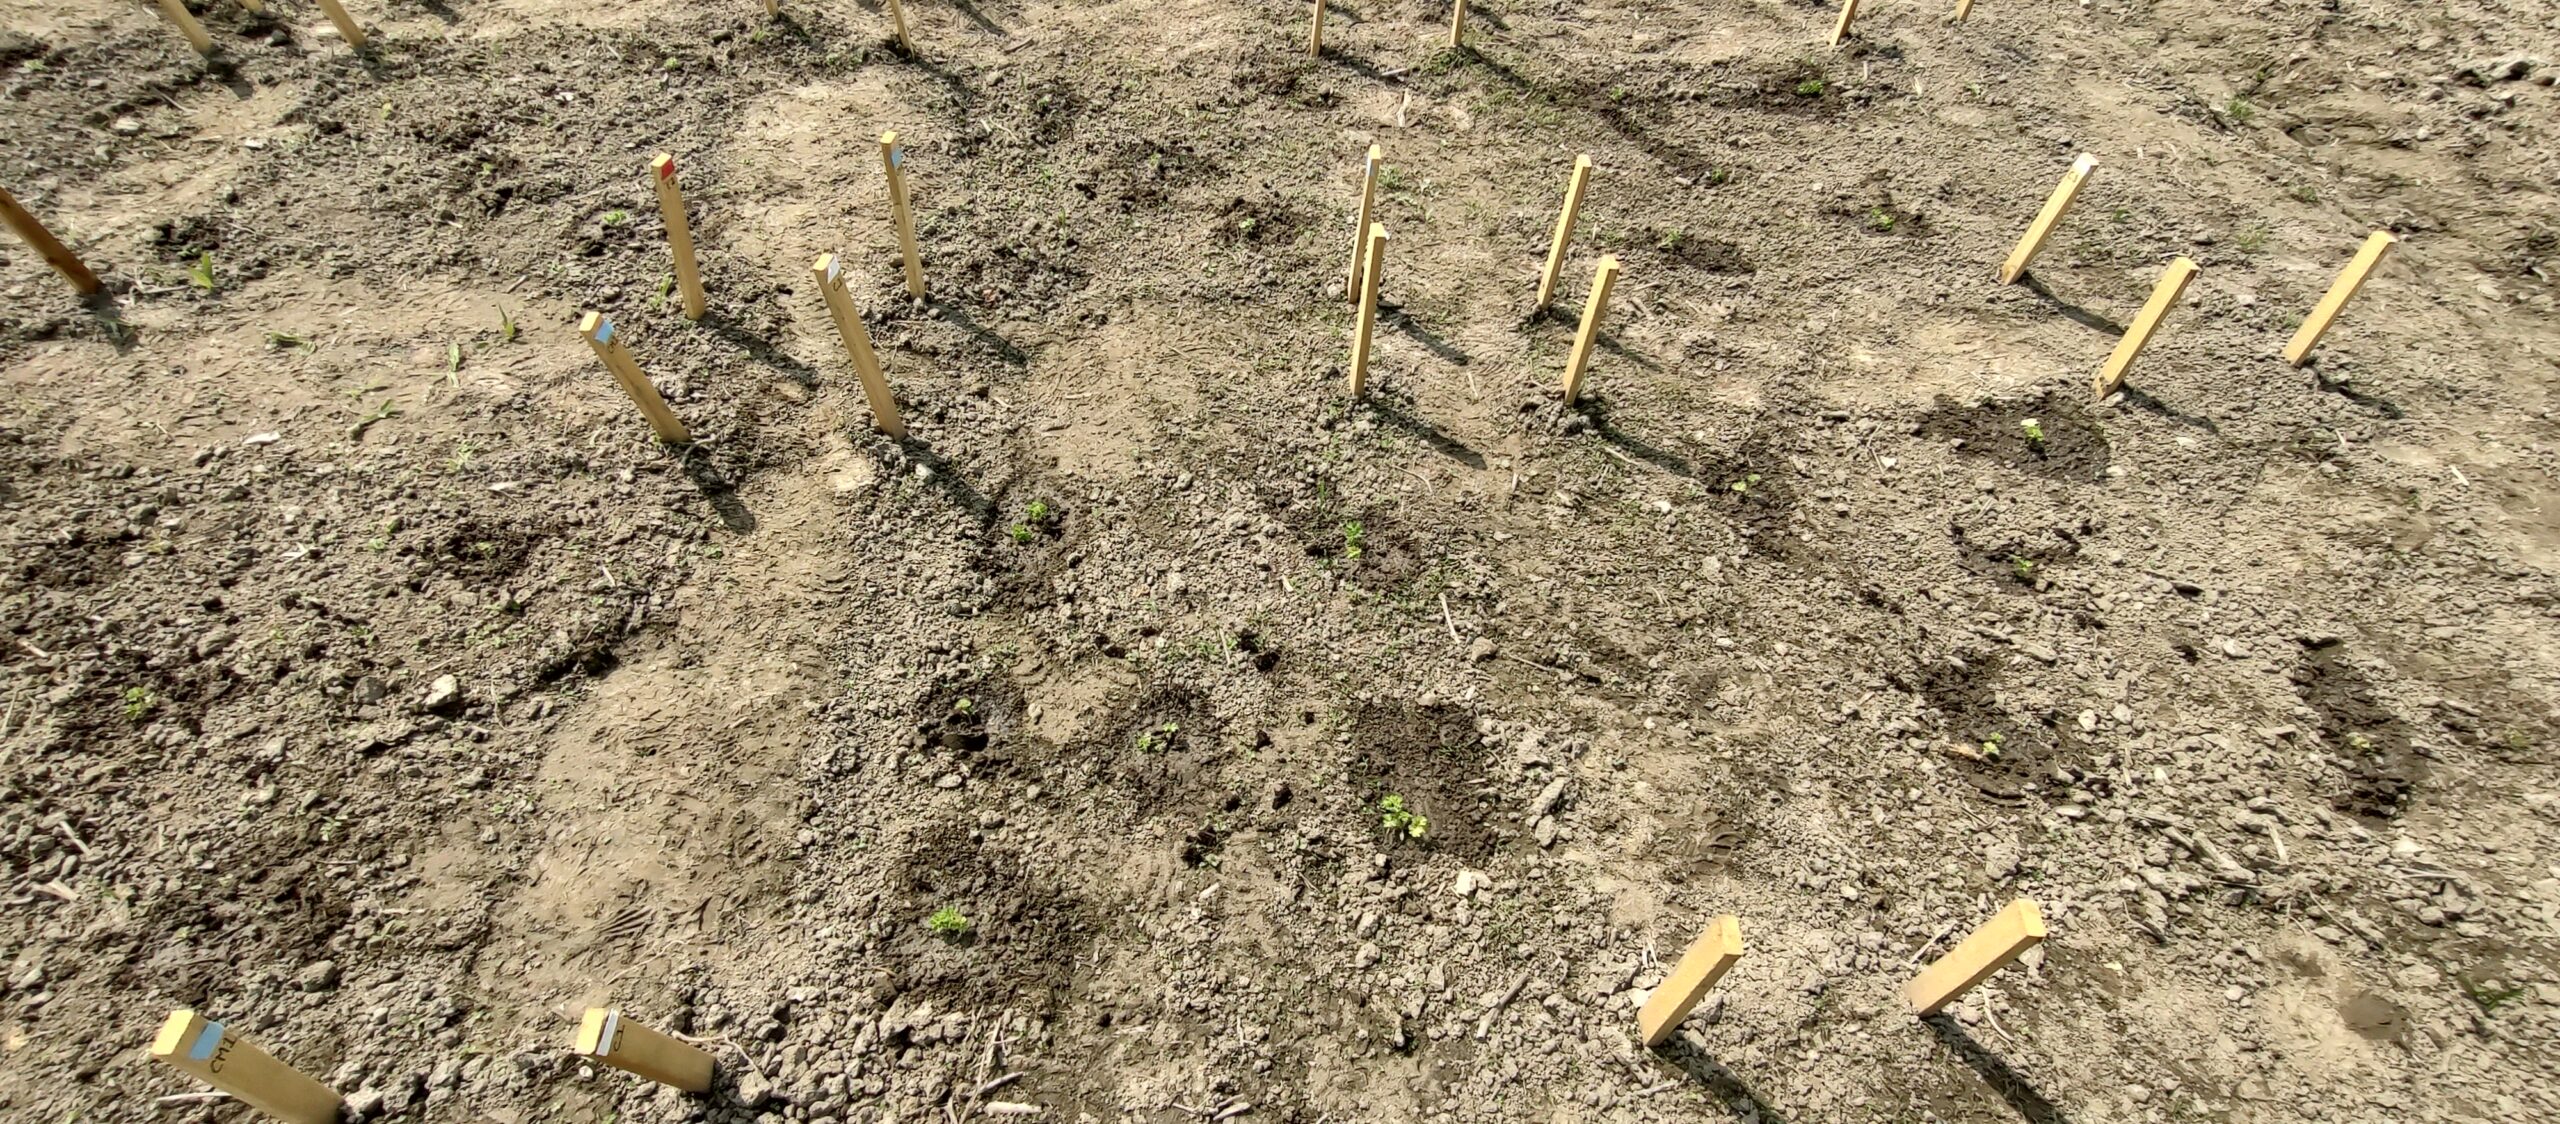


Images 30, 31, 32, 33. Parsley after transplanted into baby cover crop treatment areas, weedy plots, plots being weeded, growth arising again.
Year 2 Data gathering and analysis
Our research questions for 2023 experiment were:
- Is there a difference in the soil P between the endemic, commercial and control plots?
- Is there a difference in the water P between the endemic, commercial and control plots?
- Is there a difference in the plant P between the endemic, commercial and control plots?
- Is there a difference in the colonization of the parsley roots between the endemic, commercial and control plots?
- Is there a difference in parsley crop yield between the endemic, commercial and control plots?
To answer these questions, data gathered included: soil phosphorus (P) in forms of Soluble Reactive P through water extraction (SRP-WEP), Total P, and Mehlich-3 extractable P at the beginning and end of the experiment, parsley mass and parsley P upon harvest, and mycorrhizal colonization upon harvest.
Methodology for SRP-WEP involved gathering 5 samples composited into one per each treatment plot into a labelled bucket which was thoroughly mixed. From this 25 g of fresh soil were dried. 2 grams of dry soil were sieved (2mm mesh), put in a 40ml centrifuge tube with 20 ml of distilled water, shaken at 25 rpm for one hour, centrifuged at 6000 rpm for 10 minutes and filtered through a 0.45 μm nylon 33 mm syringe membrane filter (Fisherbrand, Suwanee, GA, USA) into labelled centrifuge tubes to prepare the sample for SRP measurement. This was submitted to UVM’s Agriculture Environment Testing Lab (AETL) where SRP concentration was determined colorimetrically on a Lachat Quick Chem Series 2 (Hach, Loveland, CO, USA) (US EPA, 2015) at 880 nm.
TP was measured from the remaining dried and sieved soil. 1.5 grams added to a labelled scintillation vial were submitted to AETL where the samples were extracted with Microwave assisted digestion utilizing Nitric acid (U.S. Environmental Protection Agency, 1996) followed by ICP analysis (Avio 200, Perkin-Elmer Corp., Shelton, CT, USA).
Mehlich-3 extractable P was measured from 2 gloved handfuls of soil from each bucket being placed in labelled clean plastic bags. These were shipped it to University of Maine’s Soil Testing lab (NE Coordinating Committee for Soil Testing, 2011) extract with Mehlich-3 solution and followed by analysis for nutrients.
For Parsley-P three of the largest parsley plants per treatment plot were harvested. Plant material was weighed after bags were tared for calculations to determine crop yield and P removal/ harvest. Once plant material was thoroughly dried in a drying room at the UVM Hort Farm, plant material was ground in the UDY Cyclone Mill (0.8mm screen). 1.5g of dried plant material were added to sterile, labeled and weighed scintillation vials. They were submitted to AETL and analyzed, using Microwave assisted digestion utilizing Nitric acid (U.S. Environmental Protection Agency, 1996) followed by ICP analysis (Avio 200, Perkin-Elmer Corp., Shelton, CT, USA). P mass recovered in plant tissue was calculated: P concentration * dry biomass.
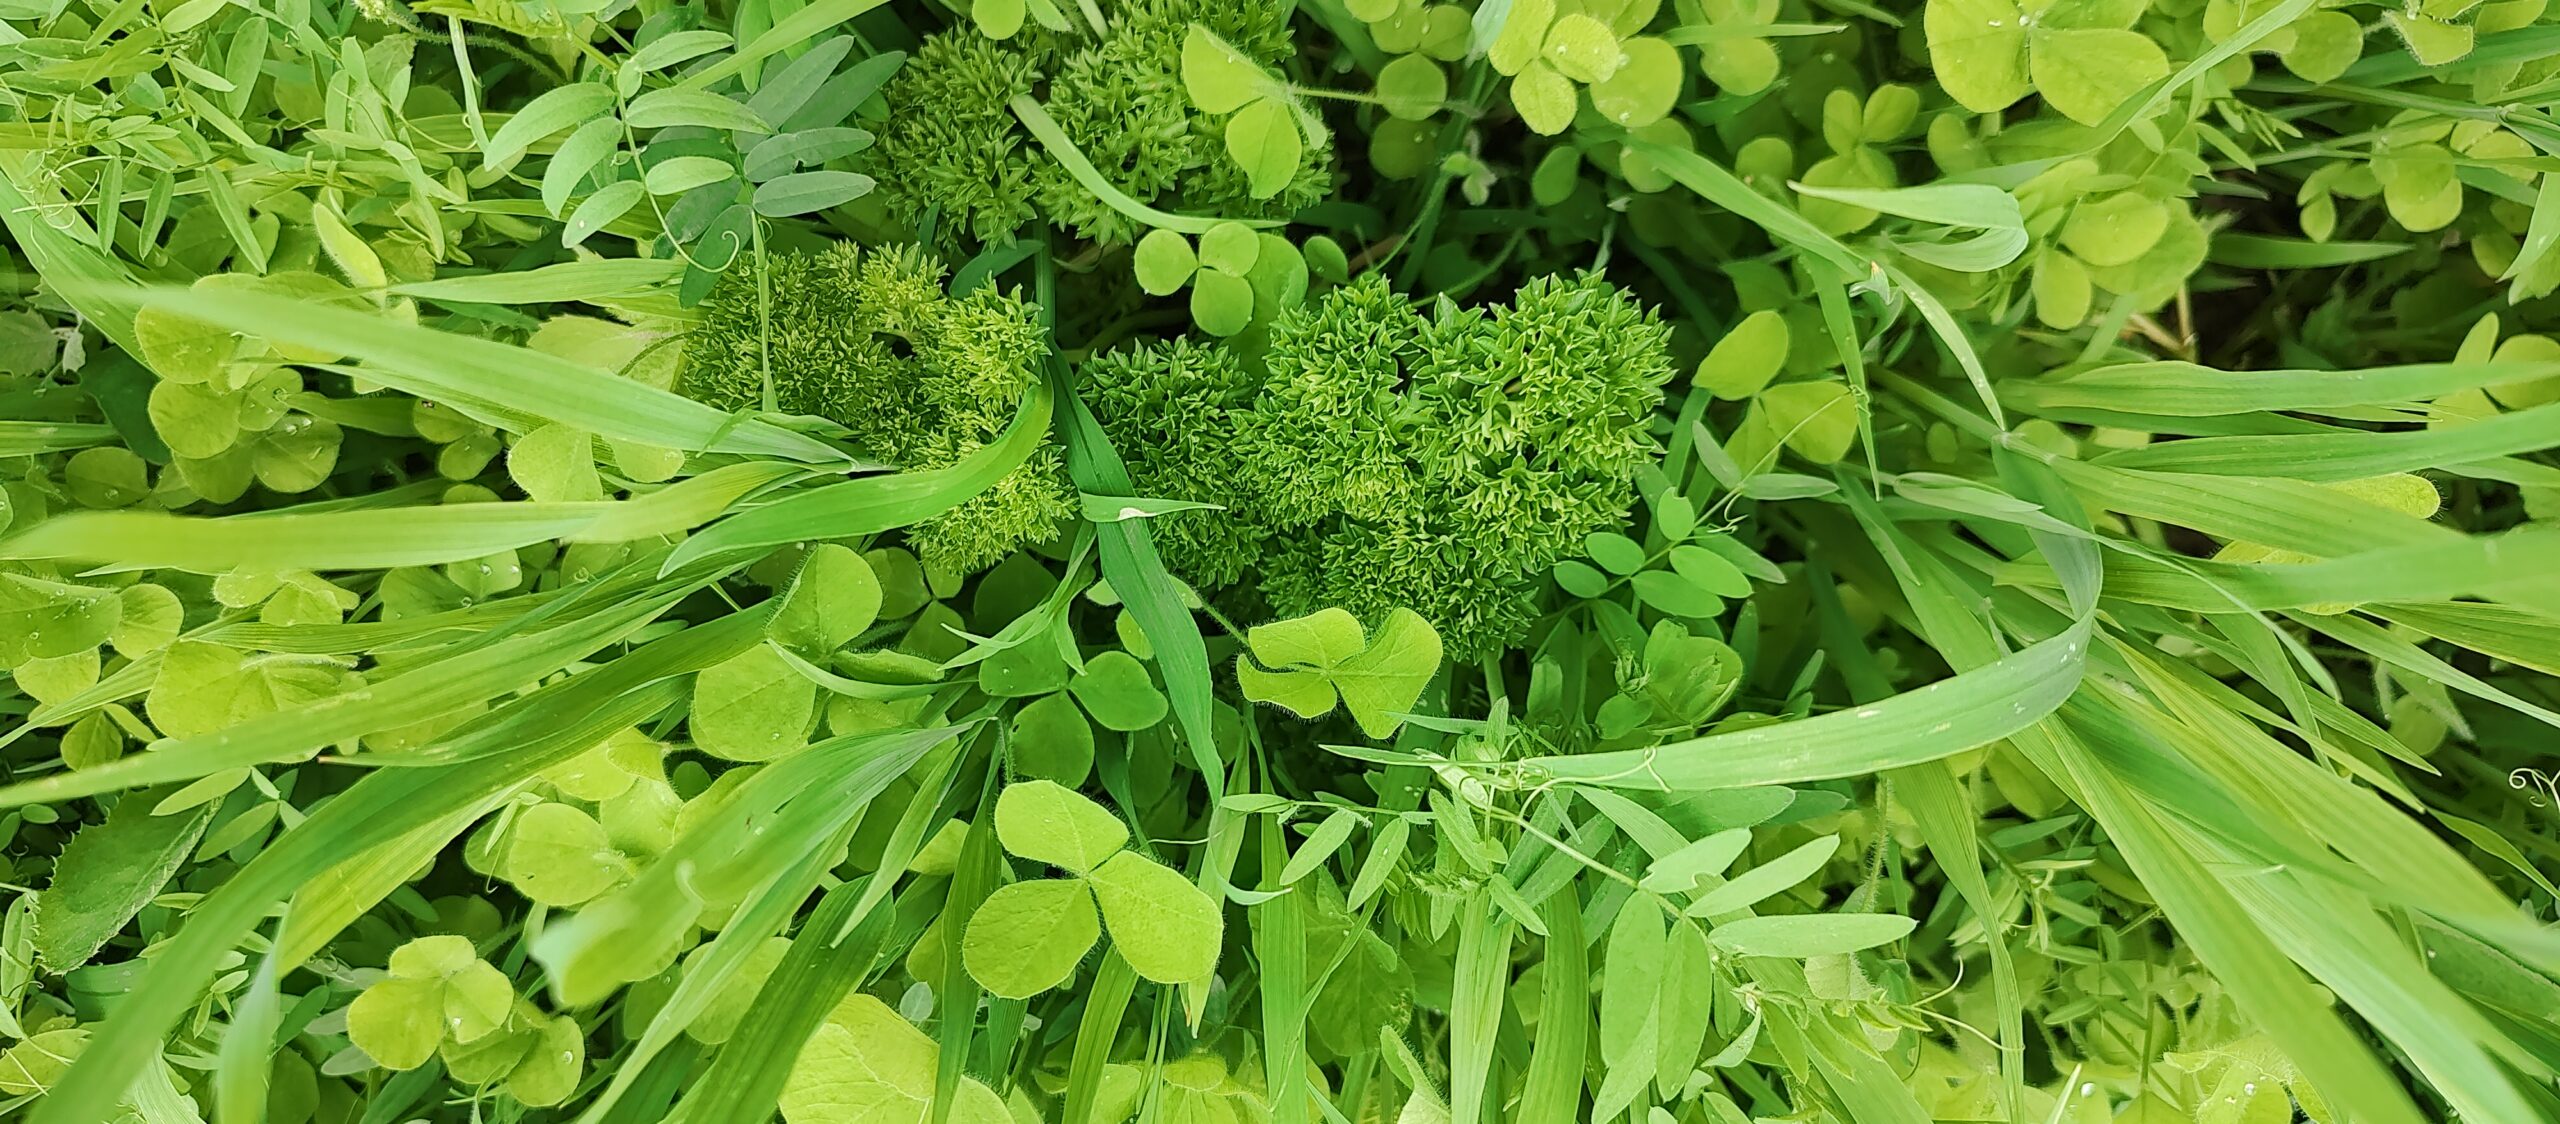
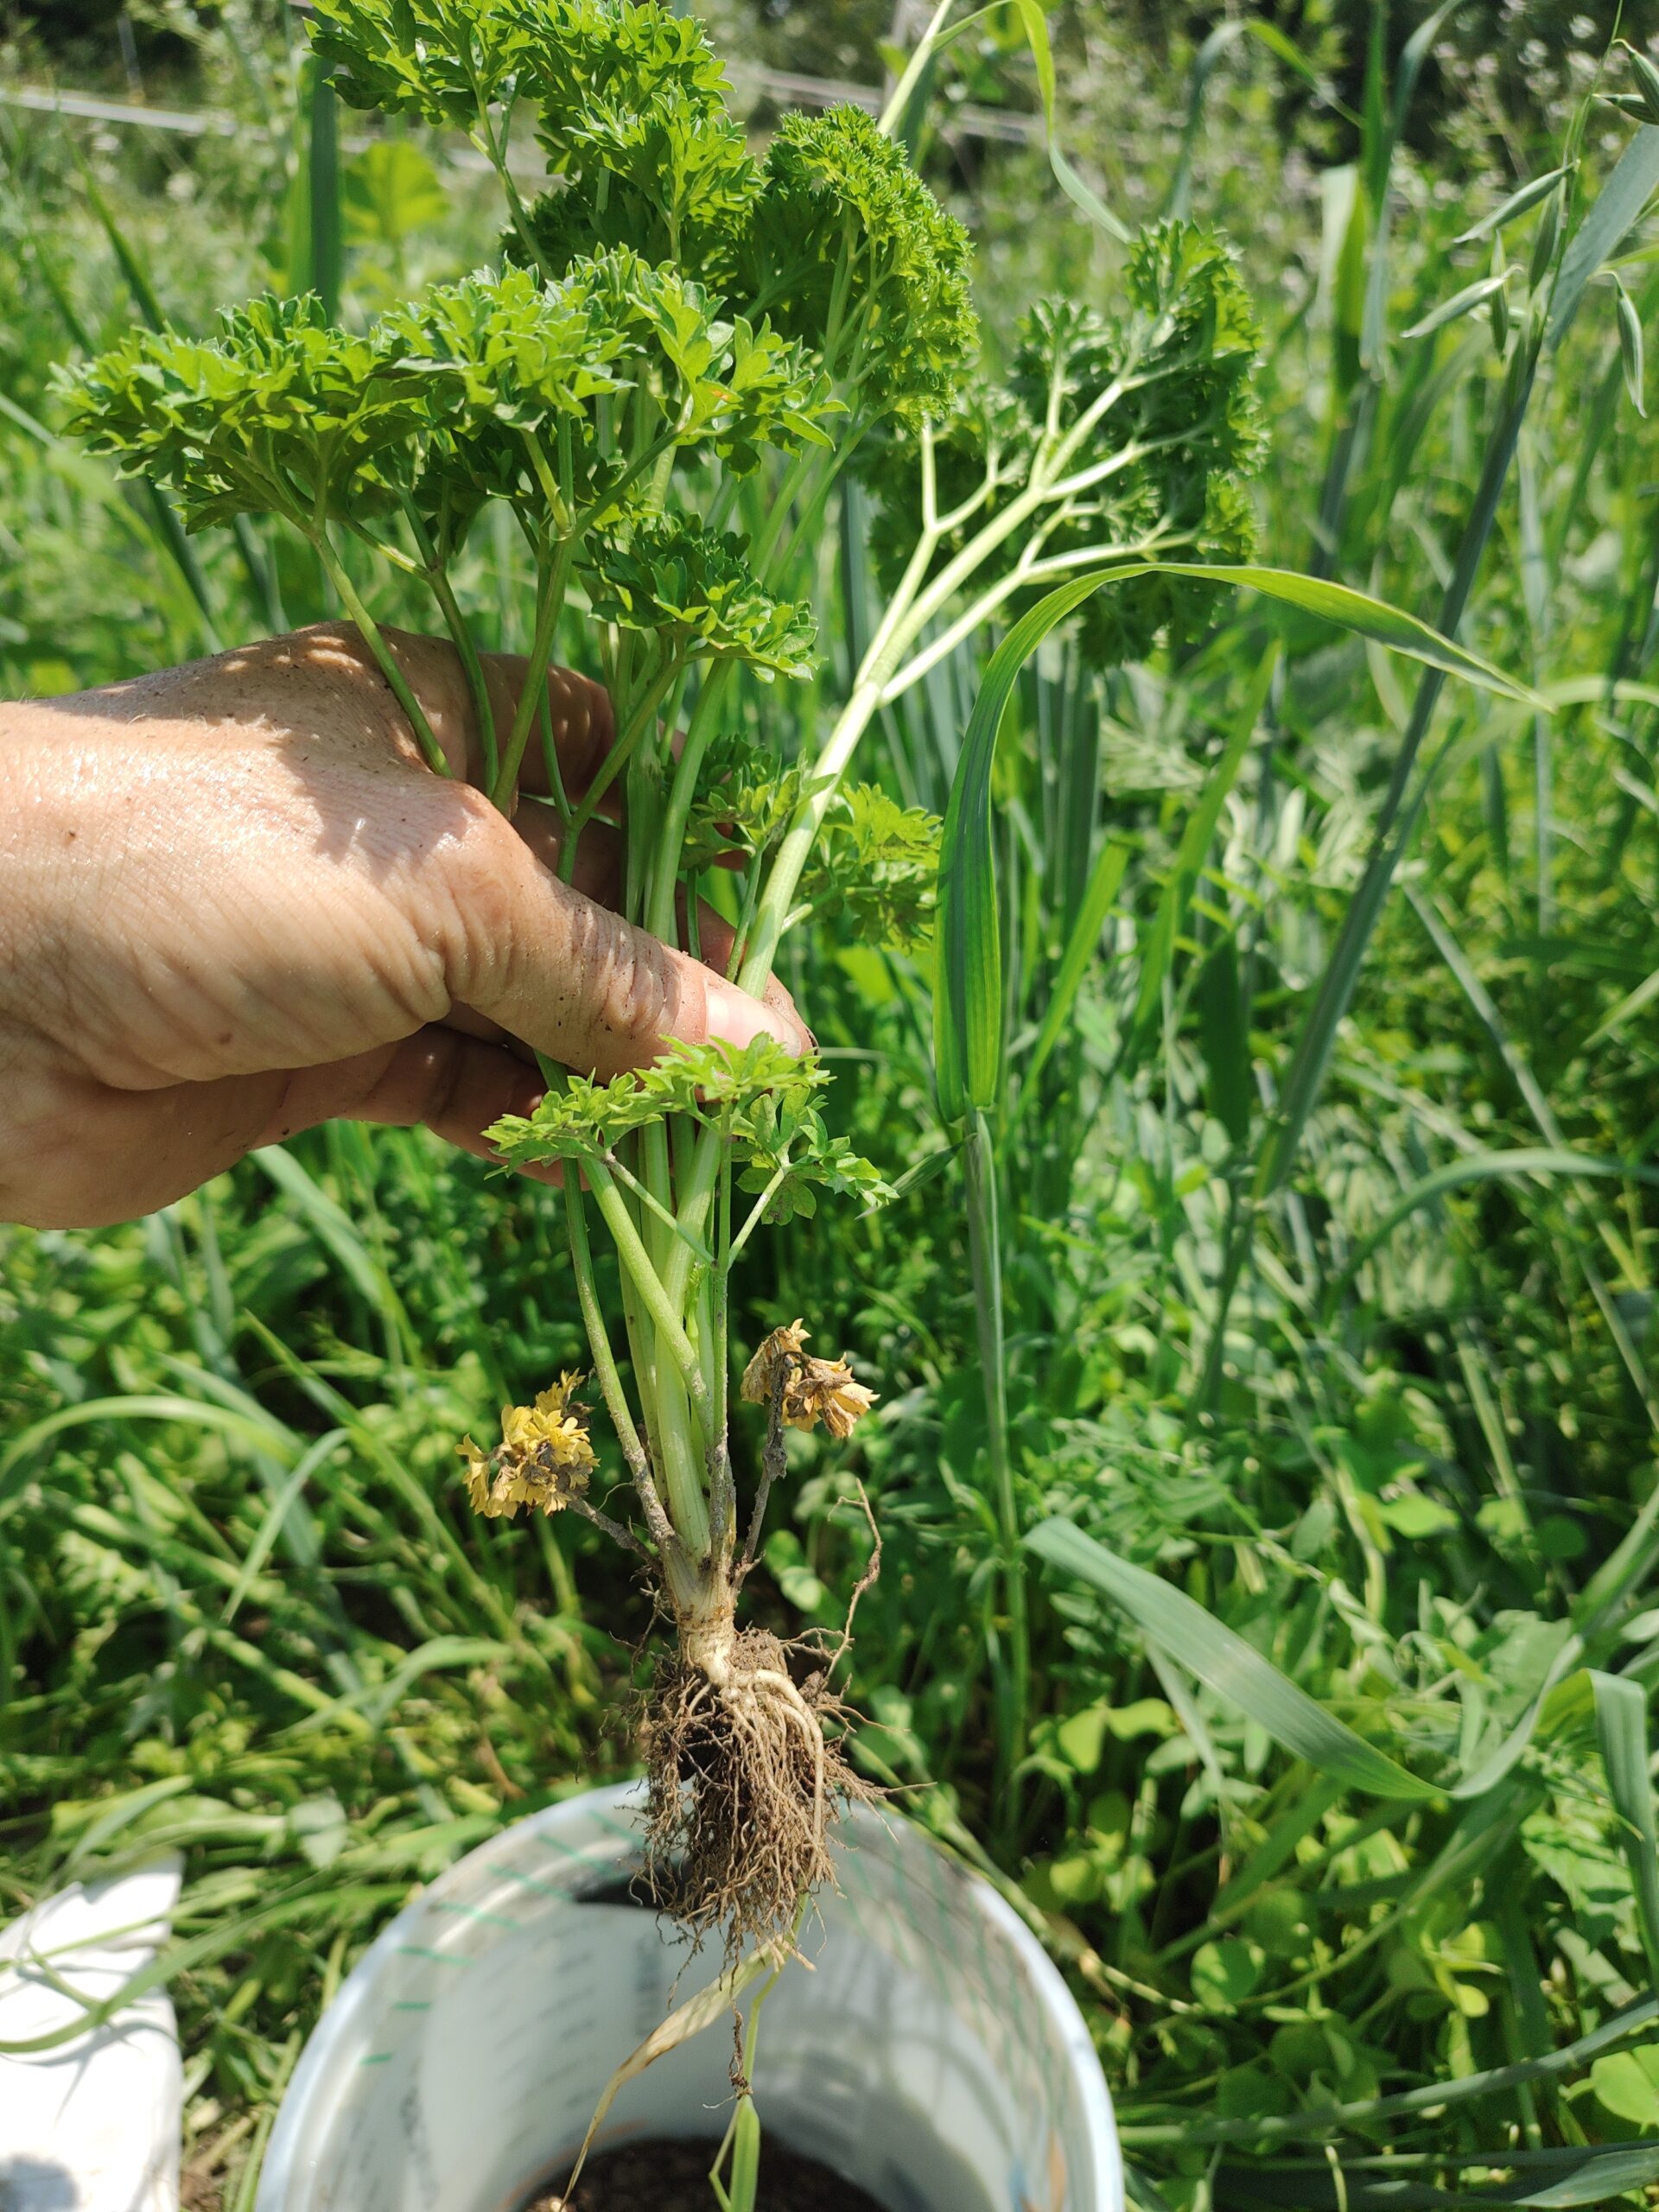
Images 34, 35, 36, 37 views of the parsley nested in the polyculture, parsley up close, parsley in endemic plot, parsley upon harvest, parsley plants harvested, parsley roots.
Mycorrhizal colonization of the harvested parsley was determined through a modified protocol first developed by (Deguchi et al., 2017). Washed roots with diameter of 0.5–1 mm were placed in 10% KOH solution, autoclaved (Consolidated Stilts and Sterilizers, Boston MA), rinsed, acidified with 1%HCl and stained with Acid Fuchsin. After being destained they were stored at 4 C in water before being examined under a compound microscope (Olympus CX41, Olympus Corporation NY, NY). 4 roots were mounted with Polyvinyl-Lacto-Glycerol on a labeled slide. 10 randomized fields within one slide were selected to examine for presence of AMF structures (arbuscules, vesicles or spores). Percent colonization was calculated as the number of fields containing colonized roots * 10. Three slides were made for each of the three treatments.
WEP-SRP, Soil TP, Mehlich-3 extractable P, plant P uptake, crop yield, and mycorrhizal colonization were analyzed via a General Linear Model (GLM) with treatment and in some cases date as predictors for P concentrations, crop yields, or mycorrhizal counts respectively. Levine test’s model assumptions were met in all cases eliminating the need for transforming the data. Summary statistics (using Graph Pad Prism 9.2.0, San Diego, Ca, USA) in table numbers were translated into graphs for this report to allow comparisons with literature values. However, the GLM was used for inference. Where the model was statistically significant (p < 0.05) for one predictor with more than two levels, Tukey post hoc test was used to discern individual comparisons. Analyses were conducted via SPSS28.0.0. (IBM Corp, Armonk, NY, USA). Correlations reported are Pearson correlations.
Sources Cited
Andersen, K.S., Kirkegaard, R.H., Karst, S.M., Albertsen, M., 2018. ampvis2: an R package to analyse and visualise 16S rRNA amplicon data (preprint). Bioinformatics. doi:10.1101/299537
Deguchi, S., Matsuda, Y., Takenaka, C., Sugiura, Y., Ozawa, H., Ogata, Y., 2017. Proposal of a New Estimation Method of Colonization Rate of Arbuscular Mycorrhizal Fungi in the Roots of Chengiopanax sciadophylloides. Mycobiology 45, 15–19. doi:10.5941/MYCO.2017.45.1.15
Gerdemann, J.W., Nicolson, T.H., 1963. Spores of mycorrhizal Endogone species extracted from soil by wet sieving and decanting. Transactions of the British Mycological Society 46, 235–244. doi:10.1016/S0007-1536(63)80079-0
Kolba, L., Rubin, J., Görres, J., 2022. Growing Local Mycorrhizal Inoculum, A Guide and Insights from a Field Trial. NESARE, Burlington VT.
Minot, S.S., Krumm, N., Greenfield, N.B., 2015. One Codex: A Sensitive and Accurate Data Platform for Genomic Microbial Identification (preprint). Bioinformatics. doi:10.1101/027607
Ringner, M., 2008. What is principal component analysis? Computational Biology Primer. Nature Biotechnology 26, 303–304. doi:https://doi.org/10.1038/nbt0308-303
Rubin, J.A., Görres, J.H., 2021. Potential for Mycorrhizae-Assisted Phytoremediation of Phosphorus for Improved Water Quality. International Journal of Environmental Research and Public Health 18, 7. doi:10.3390/ijerph18010007
Tennant, D., 1975. A Test of a Modified Line Intersect Method of Estimating Root Length. Journal of Ecology 63, 995–1001. doi:10.2307/2258617
Wood, D.E., Lu, J., Langmead, B., 2019. Improved metagenomic analysis with Kraken 2. Genome Biology 20, 257. doi:10.1186/s13059-019-1891-0
In Year 1 we aimed to test the haphazard technique of wild buffer inoculum on field edge mycorrhizal banks consisting of polyculture cover crops to see if soil & soil water P, mycorrhizal populations, and parsley would indicate differences due to inoculation. We found the technique does not work. While there were no statistically significant differences in treatment (haphazard inoculated and uninoculated), substantial findings arose regarding how farm management and location in a field may affect microbial and mycorrhizal populations, soil P and soil water P concentrations.
A. Data that demonstrated the haphazard inoculation technique was ineffective include all of our mycorrhizal, parsley P uptake, soil, and soil water P data. There was no significant difference in spore counts, extra radical hyphae length, or root colonization percentages, total P, Mehlich-3 extractable P, WEP- SRP, parsley P uptake (data not shown) between inoculated and uninoculated banks.
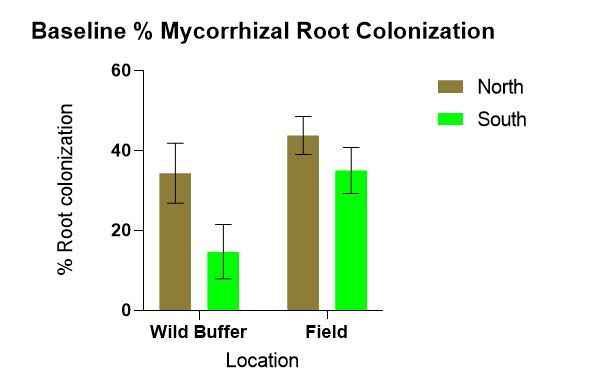
B. Location (defined by both in which field feature and cardinal directions) affects baseline microbial & mycorrhizal communities present, P indicators (Mehlich-3 extractable P) in the soil, mycorrhizal root colonization and extra radical hyphae lengths. Field trial data from June indicate location was a factor affecting WEP-SRP data. Similarly, a positive correlation between extra radical hyphal lengths and WEP-SRP was found. Starting with baseline data comparing mycorrhizal root colonization percentages statistically significant differences between the wild buffers and the field (p = 0.002) and between north and south (p = 0.003) was found with more colonization occurring in the field compared to the wild and in the North compared to the South (Figure 1).
Figure 1 indicates statistically significantly more mycorrhizal root colonization is occurring in the field compared to wild buffers which was surprising considering the density of herbaceous species, shrubs and trees in the wild buffers compared to the few weeds growing in the field at the time of sampling. This data highlights why the haphazard technique does not work, which may be because propagule density in the wild buffers is likely not enough for effective colonization. It has long been known that flooding and long fallow can disrupt the propagation of mycorrhizae (Ellis, 1998). The presence of weeds may actually maintain mycorrhizal populations. The trend of more extra radical hyphae found in N compared to S wild buffer may be due to differences in plant species composition or difference in seasonal high water table. Species in the N wild buffer consisted of: grasses, willow, primrose, dandelion, jewelweed, vetch, ash, sensitive fern, goldenrod, milkweed, mosses while in the S wild buffer: stinging nettle, goldenrod, box elder, ash, burdock, horsetail, grasses, horsetail, Virginia creeper, garlic mustard, mosses. These species vary with which mycorrhizae they partner. This area merits further research.
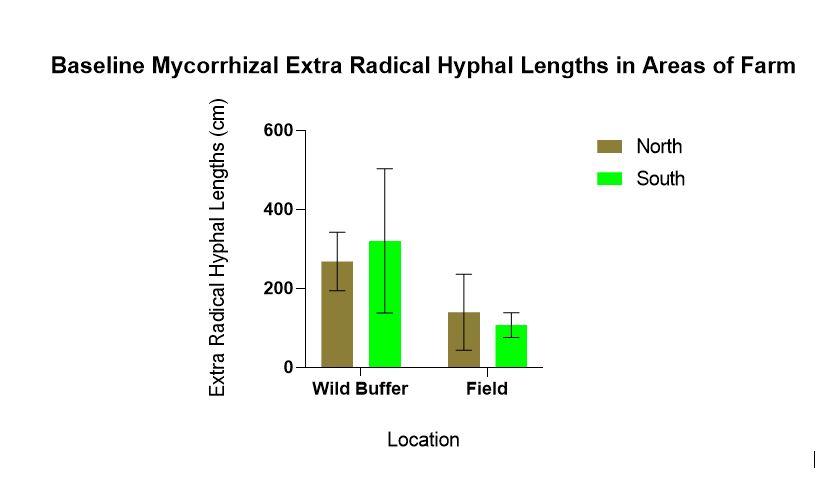
Baseline mycorrhizal hyphal lengths were statistically significantly different for location (p = 0.010) with more mycorrhizal found in the wild buffers compared to the field. There was no statistically significant for direction (p = 0.947) between N and S (Figure 2 ).
Figure 2 demonstrates why wild buffers can be sources of inoculum for growing endemic mycorrhizae. Since there are fewer disturbances in wild buffers the mycorrhizal populations and propagule counts are likely high, and certainly more than in areas (field) experiencing disturbance such as tilling and nutrient additions. This is well documented in the literature.
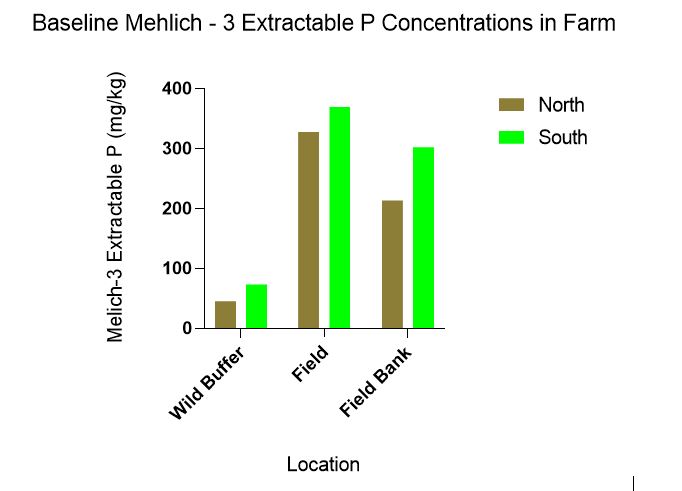
Baseline Mehlich-3 extractable P concentrations were statistically significant for location(p = 0.012) but not for direction (p = 0.105) however the trend indicates lower Mehlich-3 concentrations in the N compared to the S (Figure 3).
Figure 3 highlights how farm management practices likely affect P concentrations in the soil. From least disturbed to most disturbed Mehlich – 3 extractable P concentrations were: Wild buffer< Field bank<Field.
Baseline DNA data from looking at both mycorrhizal and P solubilizing bacteria data indicate differences due to location. PC2 distinguishes microbial communities by location (N versus S) for the wild buffers. It is interesting to note that there is a distinction between the N (field and wild buffer) and the S (field and wild buffer) which are separated by PC2 (Figure 4). The PC1 separates the wild buffers clearly from the field bank and field.
Figure 4 highlights substantial differences both between the N & S areas of the field and between the distinct areas of wild buffer, field banks, and field in terms of mycorrhizal and P solubilizing microbes. These differences may affect P cycling in soil, soil water, and plants.
The heat map (Figure 5) indicates baseline differences in the Bacillales order between the wild buffers and the field (including field bank and field).
Figure 5 highlights distinct differences in at least one bacterial order (Bacillales) between the wild buffer, field bank, and field. This is an important reminder about baseline composition of microbial and fungal communities differs based on management strategy and species present.
Pooling baseline data by direction, there was no statistically significant difference in WEP-SRP concentrations in April between the wild buffer, field bank and field, but there was a trend of SRP concentrations from highest to lowest being field>field bank>wild buffer (Figure 6).
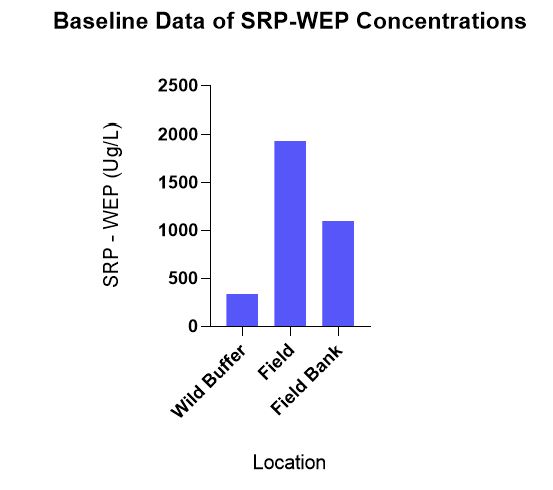
A positive correlation was found between WEP-SRP concentrations and root colonization where for each 1% root colonization increased, WEP-SRP concentrations increased by 6.11 μg/L.
Figure 6 demonstrates how WEP-SRP concentrations correlate with Mehlich 3 concentrations in correspondence to areas of management strategies with least to most disturbance; wild buffer> field bank> field. This highlights that moving field conditions closer to wild buffer conditions, i.e. through establishing field banks may help decrease soil water P concentrations.
It was surprising to find a positive correlation between mycorrhizal root colonization and WEP-SRP concentrations. Our hypothesis, the literature, and other studies (Rubin and Görres, 2022b) indicate the correlation would be negative, i.e. the more mycorrhizal root colonization is, the lower WEP-SRP concentrations would be. This is counterintuitive because we expected that plants would drive down soil water P (here represented by WEP-SRP). However, a more active mycorrhizosphere of P solubilizing bacteria may increase WEP-SRP.
In June when WEP-SRP data was log transformed (due to unequal variance) there was a statistically significant difference in WEP-SRP concentrations between N vs S with lower WEP-SRP in the north in the wild buffers. This graph shows the untransformed data (Figure 7).
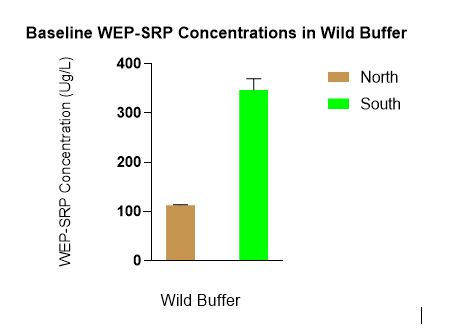
Figure 7 indicates a difference between the wild buffers in WEP-SRP concentrations. The N wild buffer’s lower WEP-SRP concentrations compared to the S wild buffer could be due to differences in spatial variability, drainage, or species composition.
C. Growing viable endemic mycorrhizae is a relatively easy and accessible practice for farmers to adopt is indicated by the guide that we are publishing. In terms of data, we found that there was no statistically significant difference in viability between the N & S inoculum pot cultures (data not shown).
Year 2 Findings
There was no significant difference in the mycorrhizal colonization, soil or water P, nor in crop yield between the endemic, commercial and control plots, in any of the metrics.
There is no statistical difference (Figure 8) in the root colonization (p = 0.120). The trend is that the highest colonization is in the endemic (mean of 23%) followed by the control (mean of 12%) and then the commercial mycorrhizae (mean of 10%).
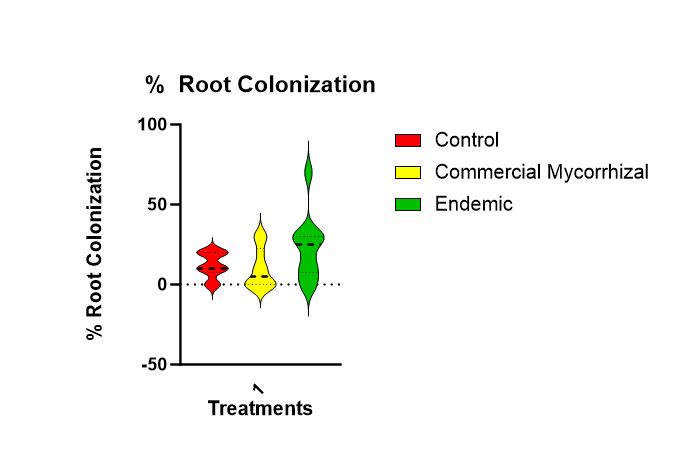
Figure 8 shows that there is no statistically significant difference in colonization roots of the parsley across treatments. There is a trend highest to lowest of endemic, control to commercial.
For TP, there was no statistical difference between the three treatments (p = 0.115). The trend in treatments (Figure 9) is highest in the control (1165.34 mg/kg) then the baseline (1152.033 mg/kg), then commercial (1078.06 mg/kg), and then the endemic (1064.18 mg/kg). There is too much variability in the data to conclude that these trends are representative of the population.

Figure 9 shows the TP concentrations at the end of the experiment. At the beginning of the experiment they were similar with average of 1152.03 mg/kg. Note the x axis starts at 900 and baseline is not included in this figure.
There was no statistically significant difference in Mehlich-3- extractable P among the treatments (p = 0.251). The estimated means of Mehlich P in soil for each treatment in descending order was 408 (mg/kg) for baseline, 382.8 (mg/kg) for commercial mycorrhizae, (mg/kg), 375.6 (mg/kg) for control, and 375.6 (mg/kg) for the endemic inoculation (Figure 10).
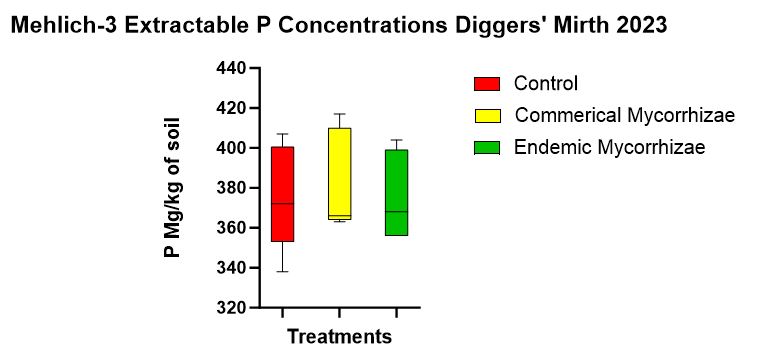
Figure 10 shows the Mehlich-3 concentrations that were not statistically different but did include a trend from highest to lowest of commercial mycorrhizae, the control, and endemic mycorrhizae.
There was no statistically significant difference between SRP concentrations between treatments. However, there was a statistically significant different in SRP concentrations (p < 0.001) between the baseline soil water concentrations (2.277 mg/L) and the commercial mycorrhizae (0.805 mg/L), the endemic mycorrhizae (0.828 mg/L), and the control (0.917 mg/L). This shows that plant uptake during the growing season does reduce available P in soil solution. While not statistically significant, the trend (Figure 11) of the plot with no plants and no treatment (not shown in chart below) having the highest concentration of P in the soil water was followed by the control, endemic, and the commercial mycorrhizae.
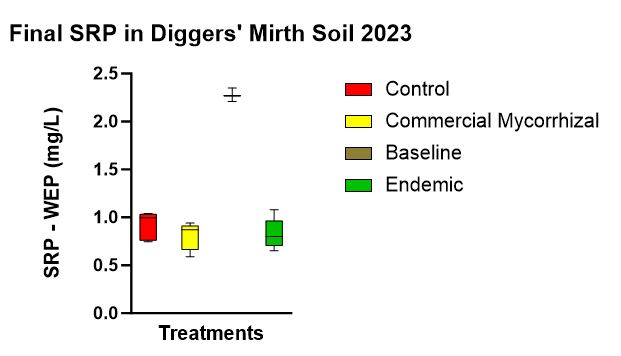
Figure 11 shows the SRP-WEP concentrations at the end of the experiment. With statistically significant difference between baseline before the growing season and all plots at the end season’s end, there was no statistically significant difference between treatments. A trend involved SRP highest in the control, followed by endemic mycorrhizae followed by commercial mycorrhizae.
There was no statistically significant difference in P uptake among the three treatments (p = 0.782) with the mean P concentrations in parsley from the treatments (Figure 12) in descending order of (5063.56 mg/kg) in the commercial mycorrhizae, (4847.46 mg/kg) in the control and (4826.36 mg/kg) in the endemic mycorrhizae.
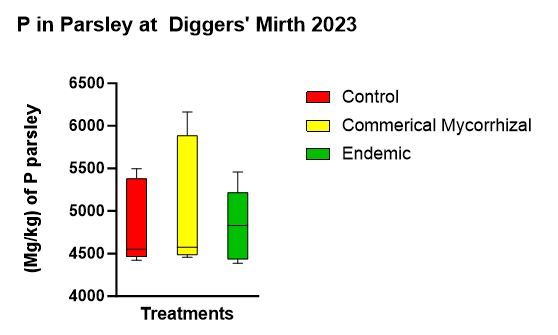
Figure 12 shows the parsley P concentrations at the end of the experiment. While not statistically significant, the trend was highest in the commercial mycorrhizae, followed by the control, followed by the endemic.
There was no statistically significant difference between treatments in regards to P uptake measured as total P mass (p = 0.214). The trend (Figure 13) from highest to lowest was control (43.336 mg), endemic mycorrhizae (36.724 mg), and commercial mycorrhizae (21.178 mg).
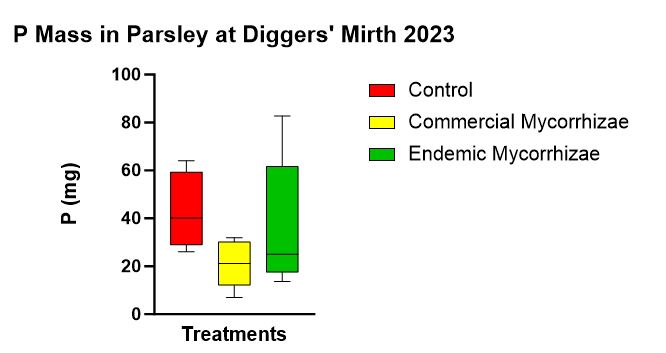
Figure 13 shows parsley P mass at the end of the experiment with a trend highest in the control followed by endemic mycorrhizae, followed by the commercial mycorrhizae.
followed by endemic mycorrhizae, followed by the commercial mycorrhizae.
There was no statistically significant difference (p = 0.183) in parsley crop yield (Figure 14) amidst the three treatments. The trend was highest in the control (52.90 g), followed by the endemic mycorrhizae (52.06 g), followed by the commercial mycorrhizae (26.86 g).
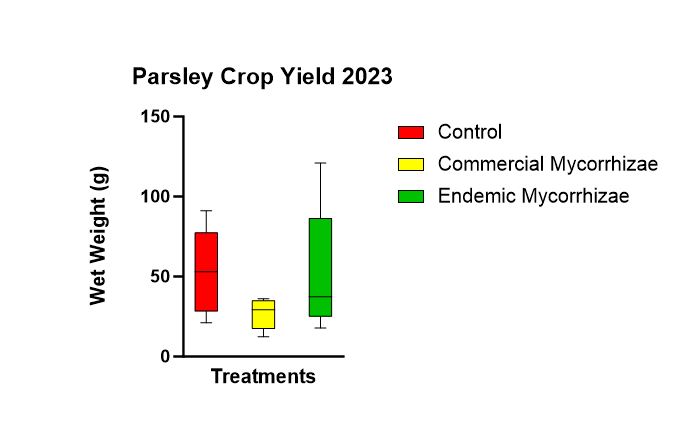
Figure 14 shows parsley crop yield between the 3 treatments using the wet mass of the parsley plants.
There were several factors that may have affected our study. The first is that there was originally low germination rate in our cover crop seeding and upon reseeding and hence reapplying inoculant to their respective plots was required. Therefore the control plot, which likely had some mycorrhizal propagules (as found in (Rubin and Görres, 2022b) may have gotten a head start in colonization. This may be why the control and the endemic mycorrhizae treatments were similar in both P mass and SRP concentrations. Also, this was a short experiment, two months from early May to mid-July. While this is the minimum amount of time for colonization, it may not have been long enough for thorough root colonization and inoculant maturation in the soil. The time between planting and harvest was too short to see statistically significant differences given that some of these processes may take several years. One other dynamic may have been introduced by weeding, in which we removed over 50 five-gallon buckets of weeds and some soil. This may also have removed and disrupted fungal hyphae as well as P which we did not account for. To avoid this covariate next time, we suggest seeding even more heavily, instead covering with a mulch such as straw or woodchips and treating with an organic, nonGMO premerge (corn gluten) to reduce weed pressure. And finally, growing a crop such as parsley in polycultures, while likely better for the soil, is not practical for production. The amount of P that may also be taken up by the surrounding polyculture was not accounted for so this may require additional measurements and techniques for it to be offered as a practical tool for P mitigation assessment and a growing technique for farmers focused on production.
Although none of these trends are statistically significant, there are some interesting findings:
- In terms of colonization, the endemic mycorrhizae were highest followed by the control. This indicates there is potential efficacy for pursuing endemic mycorrhizae on farms; even tilled soil likely has propagules and commercial mixes are most likely too foreign (as the literature states) to be effectively incorporated into agricultural systems.
- Trends in soil phosphorus such as Mehlich-3 (Figure 10), did indicate lowest concentration in the endemic followed by the control followed by the commercial which follows the colonization trend (Figure 8) and thereby suggests a linear relationship (as the literature states (Rubin and Görres, 2021) between mycorrhizal inoculation and P mitigation.
- SRP-WEP data (Figure 11) which indicated the plot with no plants had the highest P in the soil makes sense since there was no vegetation to uptake the P. It is interesting to note that both inoculated treatments had lower SRP than the control and that the commercial mycorrhizae in this case had lower soil water P than the endemic mycorrhizae. This could be seen as preliminary data that the commercial mycorrhizae were active and had an effect on soil water P. More, longer term studies are needed to elucidate any mechanisms involved.
- Trends in the TP data (Figure 9) revealed the highest soil P concentration in the baseline, followed by control, commercial, and then the endemic. In this case it could seem the inoculant was effectively reducing soil P and that endemic was more effective than the commercial mycorrhizae in this.
- While inoculant did not seem to make a difference in P uptake in parsley, it is interesting to note that plants inoculated with the commercial mycorrhizae up took the most followed by the control, followed by the endemic which is antithetical to what we hypothesized and what the literature says. Again, longer term studies are needed to analyze the P dynamics.
- While qualitatively the endemic mycorrhizal plots seemed more robust than the control, which seemed more robust than the commercial mycorrhizae, it was surprising to note that P mass uptake trend (highest in the control, followed by the endemic, followed by the commercial) is the same trend as SRP_WEP because you would think that if more P was being uptaken by the flora, there would be less in the soil and soil water.
- Offering homegrown endemic mycorrhizae to farmers from wild buffers adjacent to their fields is a great service but will be most effective when the farmers are guided to apply it to areas that will not be tilled so that the mycorrhizae can establish themselves and offer their nutrient exchanging services over the years.
Sources Cited
Ellis, J.R., 1998. Post Flood Syndrome and Vesicular-Arbuscular Mycorrhizal Fungi. Journal of Production Agriculture 11, 200–204. doi:10.2134/jpa1998.0200
Rubin, J.A., Görres, J.H., 2021. Potential for Mycorrhizae-Assisted Phytoremediation of Phosphorus for Improved Water Quality. International Journal of Environmental Research and Public Health 18, 7. doi:10.3390/ijerph18010007
Rubin, J.A., Görres, J.H., 2022b. The effects of mycorrhizae on phosphorus mitigation and pollinator habitat restoration within riparian buffers on unceded land. Restoration Ecology 31, e13671. doi:10.1111/rec.13671
In year 1 the main findings from our field research were that A. the haphazard inoculation technique does not work (which is likely why it is not recommended in the literature and instead pot culture techniques are (i.e. McCoy, 2016; Phillips, 2017); hence growing endemic mycorrhizae is a valuable practice for farmers wanting to inoculate their crops B. Location in the field of where the research is conducted is a crucial variable that likely affects microbial, fungal communities and corresponding P cycling due to respective conditions such as drainage, sunlight, microbial/fungal biome, and vegetation. Mycorrhizal banks remain an intriguing concept to support edge of field mycorrhizal reserves though their maintenance and function for crop productivity requires further research. C. Growing viable endemic mycorrhizae is a relatively easy and accessible practice for farmers to adopt. It will be interesting entering year 2 to determine the effects of endemic mycorrhizae on parsley crop P uptake in one location so that location does not affect results.
In conclusion this field study demonstrated why endemic inoculum needs to be grown in pot cultures rather than directly applied from wild areas. Propagule density/gram of soil is an important requirement for mycorrhizae to activate its nutrient cycling activity.
We refined techniques to grow endemic mycorrhizae from wild buffers adjacent to a field and produced a guide for farmers. We found no statistically significant difference in inoculum viability between wild buffers (N vs S) though they had distinct floral communities.
In year 2 our conclusions are that mycorrhizae cannot be researched effectively in a two year time frame on farms that involve nutrient additions, tillage, and crop rotations. Incorporating mycorrhizae (especially endemic) is an important area of research to pursue for farm resilience and water quality protection, however it will be most effectively applied and investigated in areas formerly grass or in pasture that area being replaced with long-term perrenial polyculture plantings. Accompanying management that involves cyclical harvest and coppicing with long-term soil P, soil water P and plant biomass P sampling with corresponding analyses can likely offer results more accurately highlighting the viability of mycorrhizae to effectively support green infrastructure, particulary to mitigate phosphorus.
Sources Cited
McCoy, P., 2016. Radical Mycology: A Treatise on Seeing & Working with Fungi. Chthaeus Press, Portland, OR.
Phillips, M., 2017. Mycorrhizal Planet: How Symbiotic Fungi Work with Roots to Support Plant Health and Build Soil Fertility. Chelsea Green Publishing.
Education & outreach activities and participation summary
Participation summary:
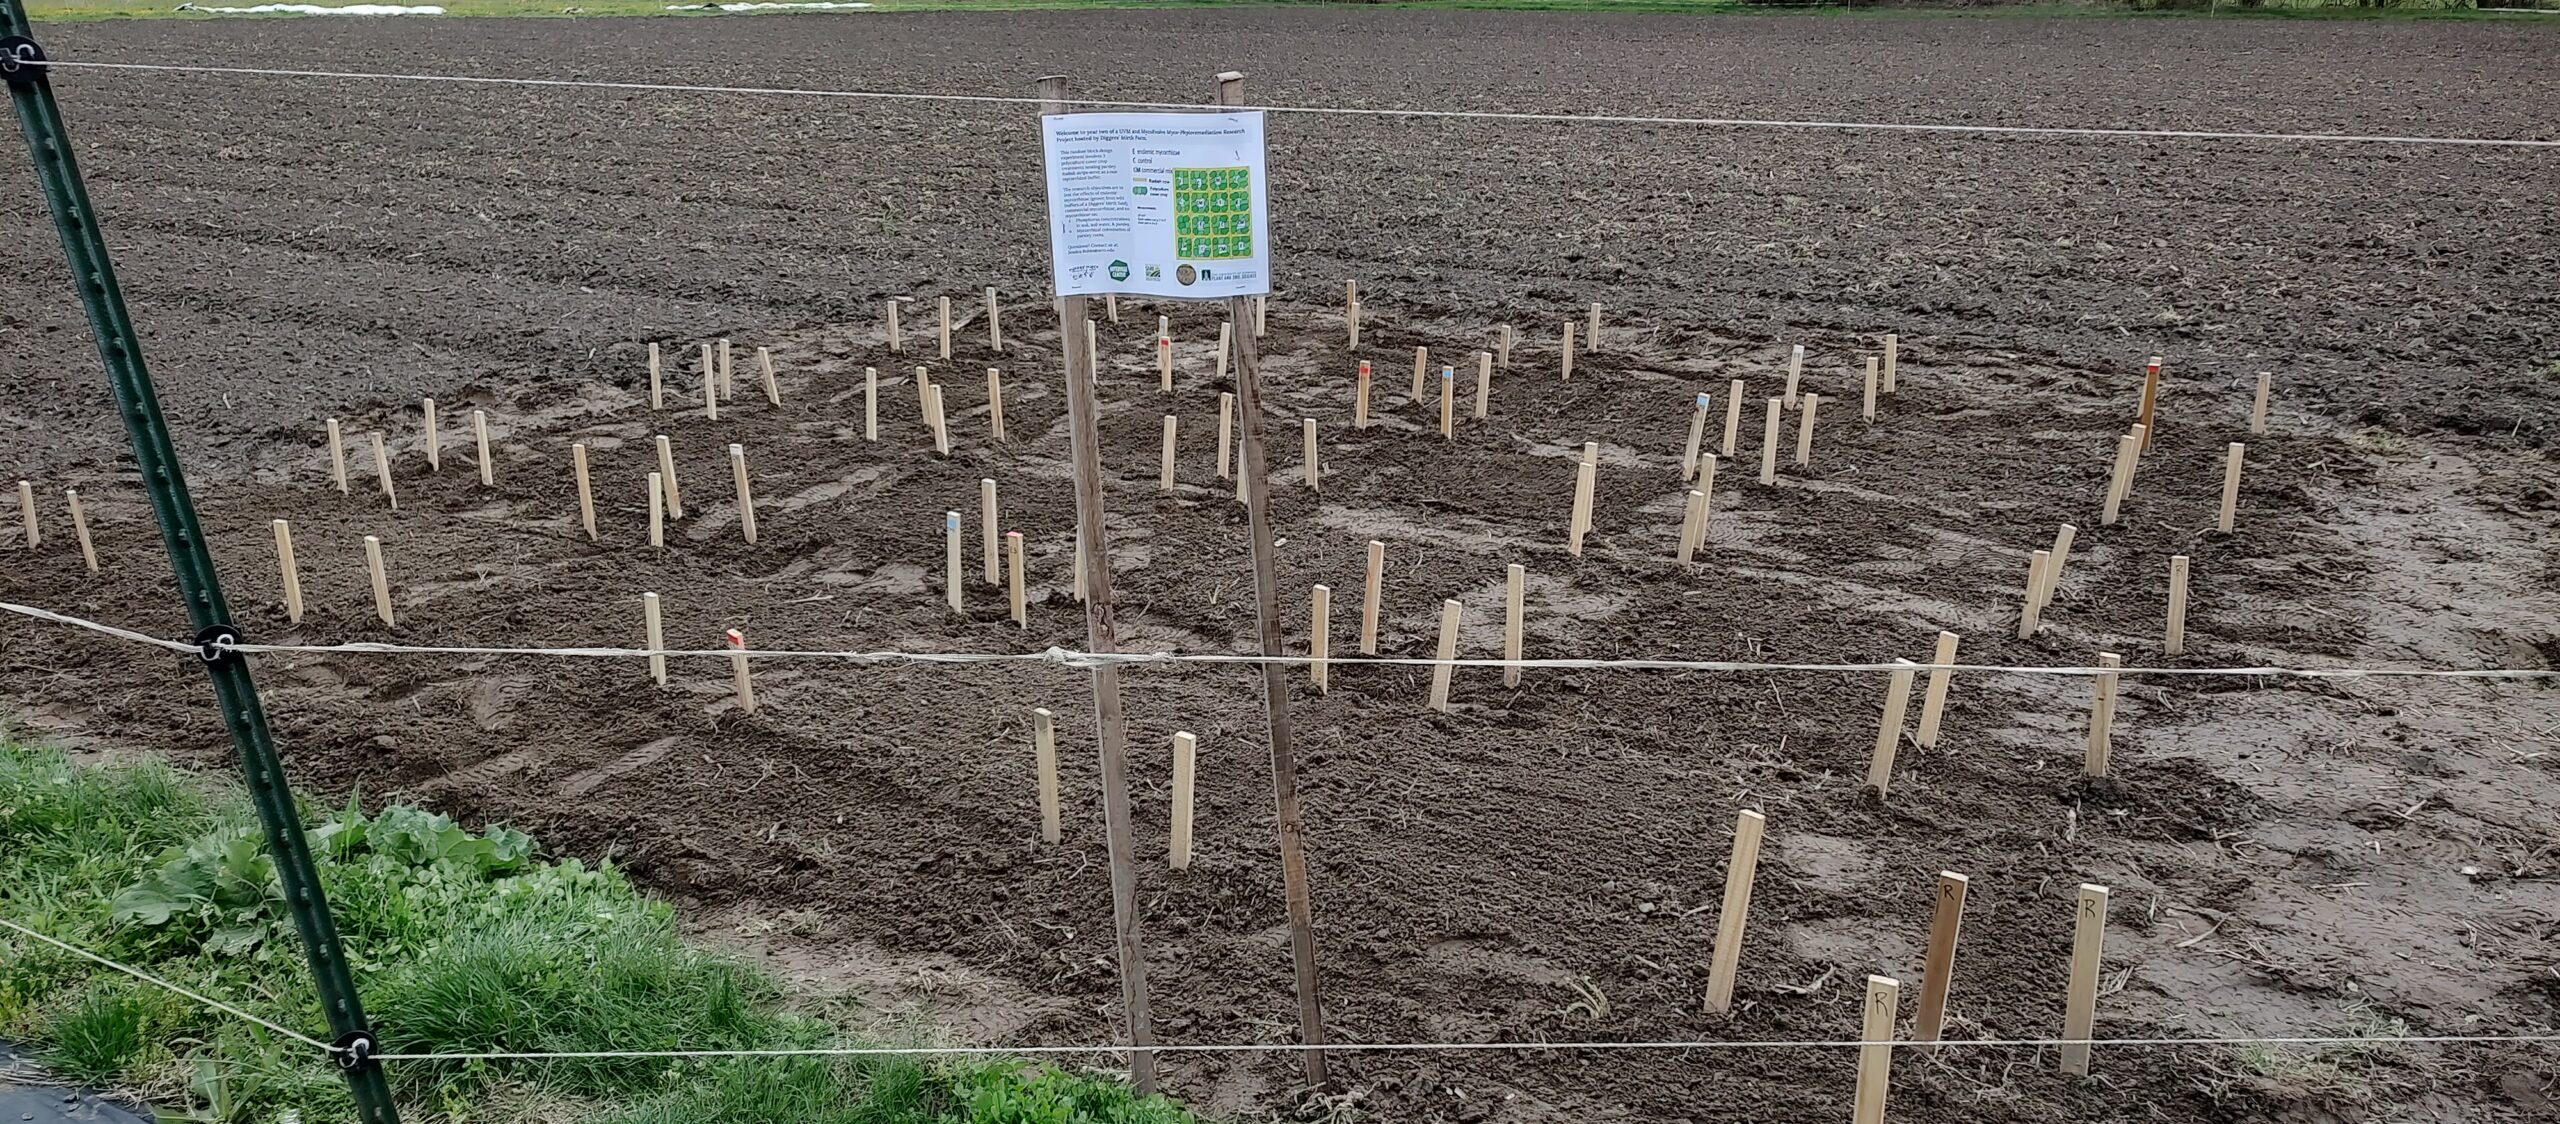
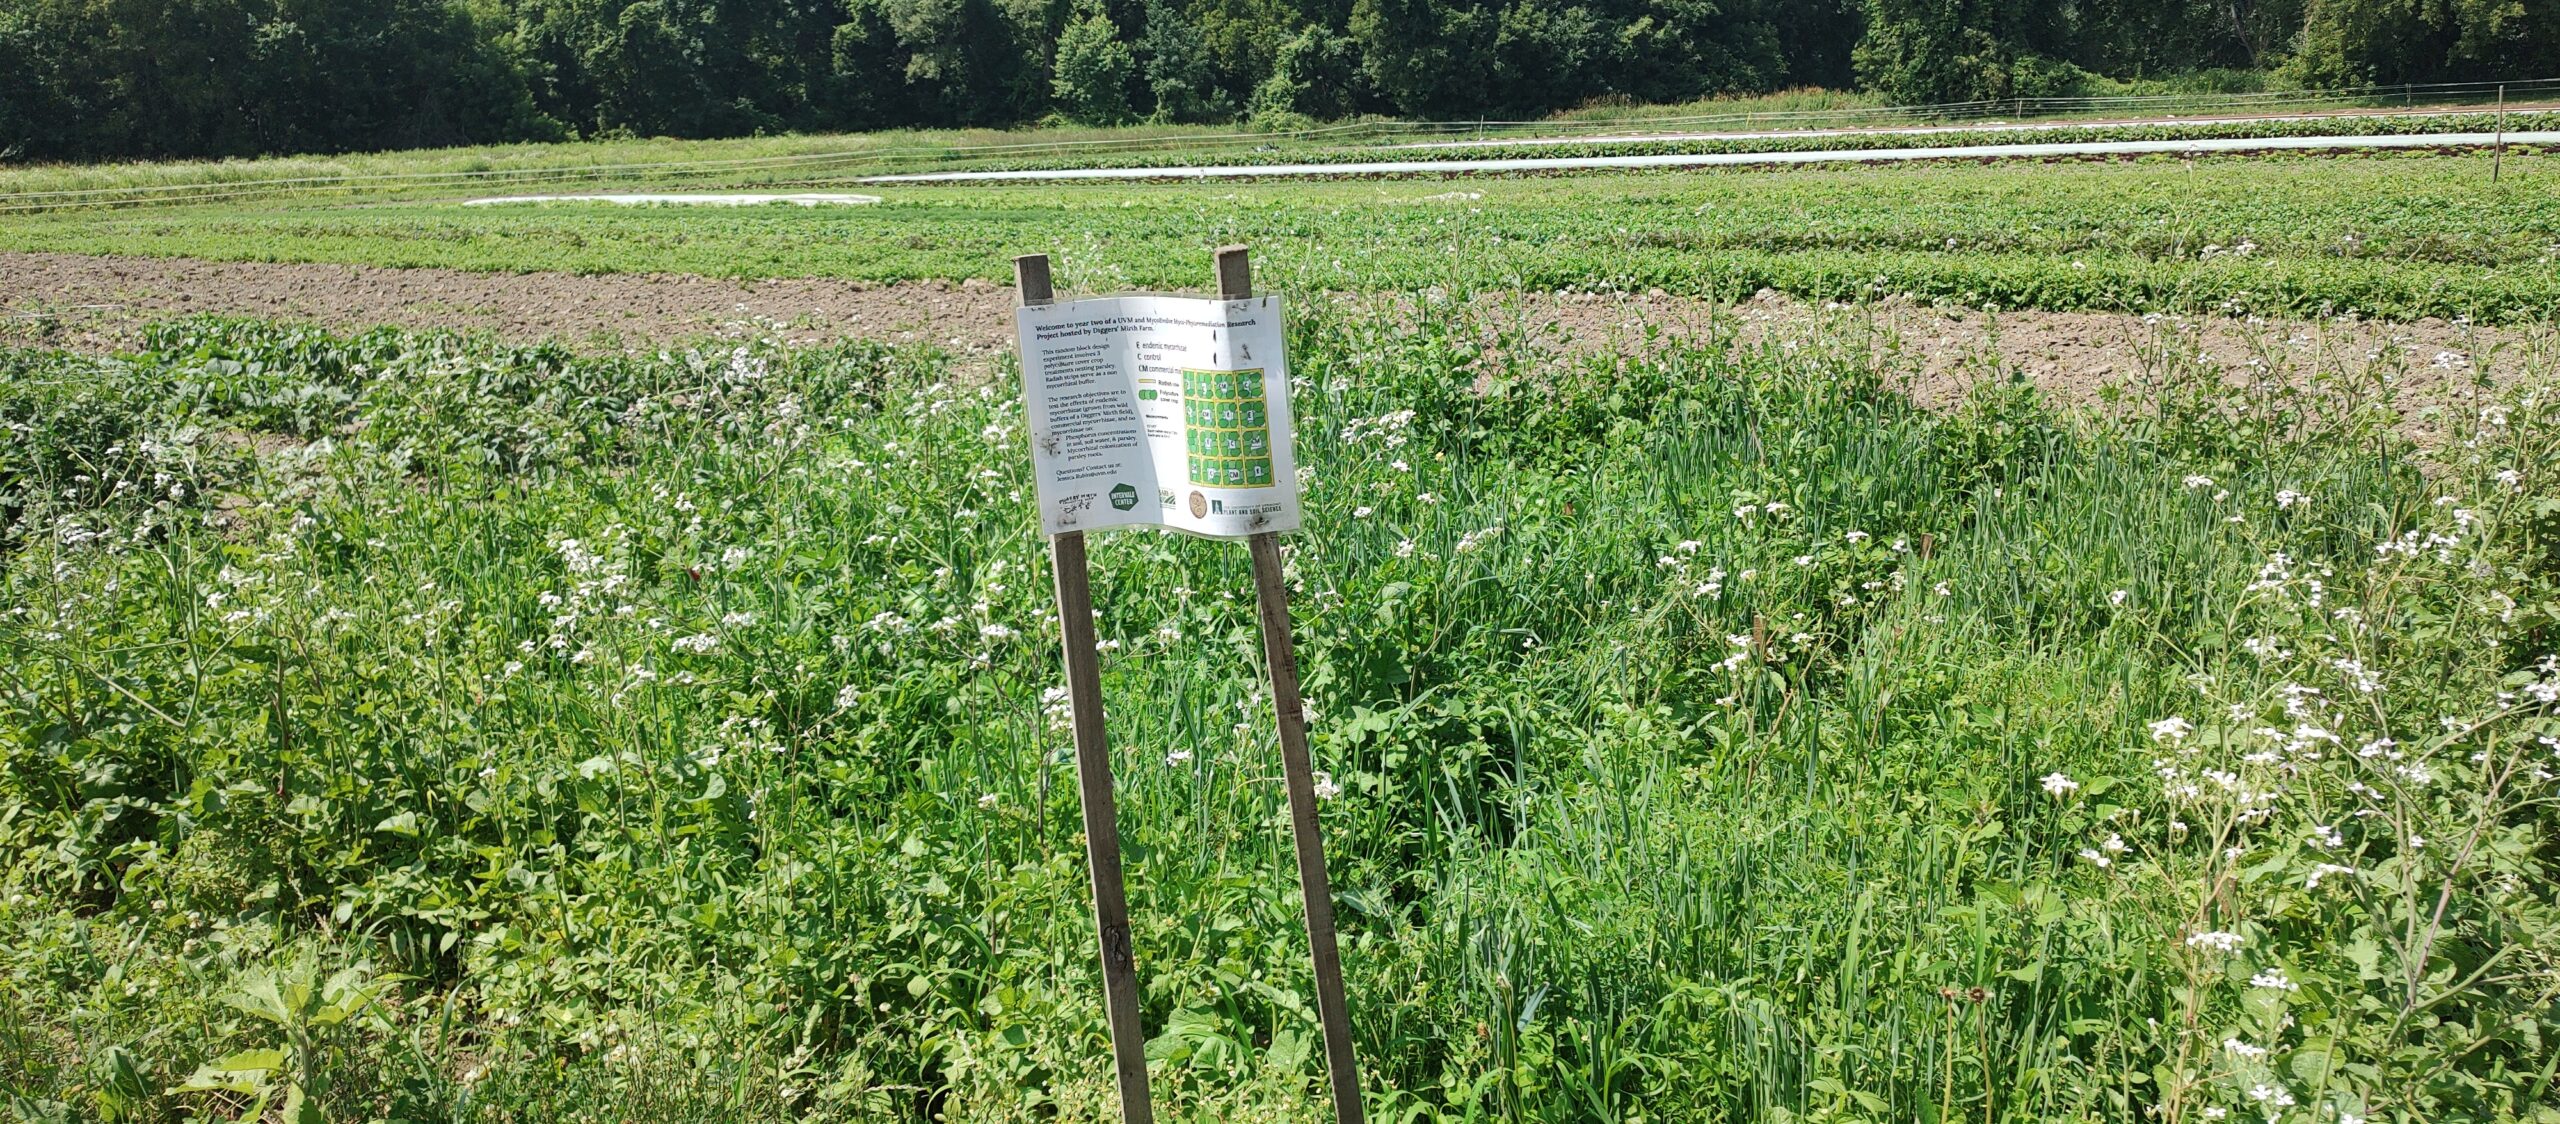
We published a guide to grow Endemic Mycorrhizae and were able to share this and our findings at the NOFA-VT 2023 Winter conference. We were able to reach 48 people at the conference through the workshop with many more trying to participate. However, half of those in the room had to be turned away because of fire regulations limiting occupancy in this room. We created a you tube video (https://www.youtube.com/watch?v=xlYDdMVaYt4) recounting all we shared in the conference presentation to reach those who could not attend. We spoke to the farmers about our research before, during, and after this research as much as we could asking for their questions and feedback as well as posted neat moments in the field and lab work on our Instagram (https://www.instagram.com/rootsandtrails_mycoevolve/?hl=en) and facebook pages (https://www.facebook.com/mycoevolve/) (i.e inoculation in parsley roots…). We had an educational laminated sign in front of our endemic mycorrhizae growing in the greenhouse (Image 38) as well as in front of the field research (Image 39) the entire time.

Images 38 and 39 Educational signs outside of our greenhouse endemic inoculation growing and field trials.
Learning Outcomes
Our work with Digger’s Mirth began around the time the farm, due to learning about nutrient management, stopped using high P content chicken manure from a local chicken farm. The farm is continuing to manage the edges of a field in a perennial cover crop, avoiding tilling of the mycorrhizal bank.
The farm applied our endemic inoculant in other fields. It is unlikely though, that they would continue producing them in accordance with our method.
They are not convinced that vegetative buffers would assist in flood mitigation more than the expansive wetland and hedgerows that currently surround all three of their fields. Our original idea of creating mycorrhizal banks that included dogwoods, willows, elderberries, aronia, fruit trees and nuts, is not synchronic with the farm’s current business plan as would require completely different set of management practices and timelines that are inconsistent with the farm’s mission to reduce food insecurity. The farm would however be open to volunteers to plant and manage these edible, medicinal, utilitarian buffers.
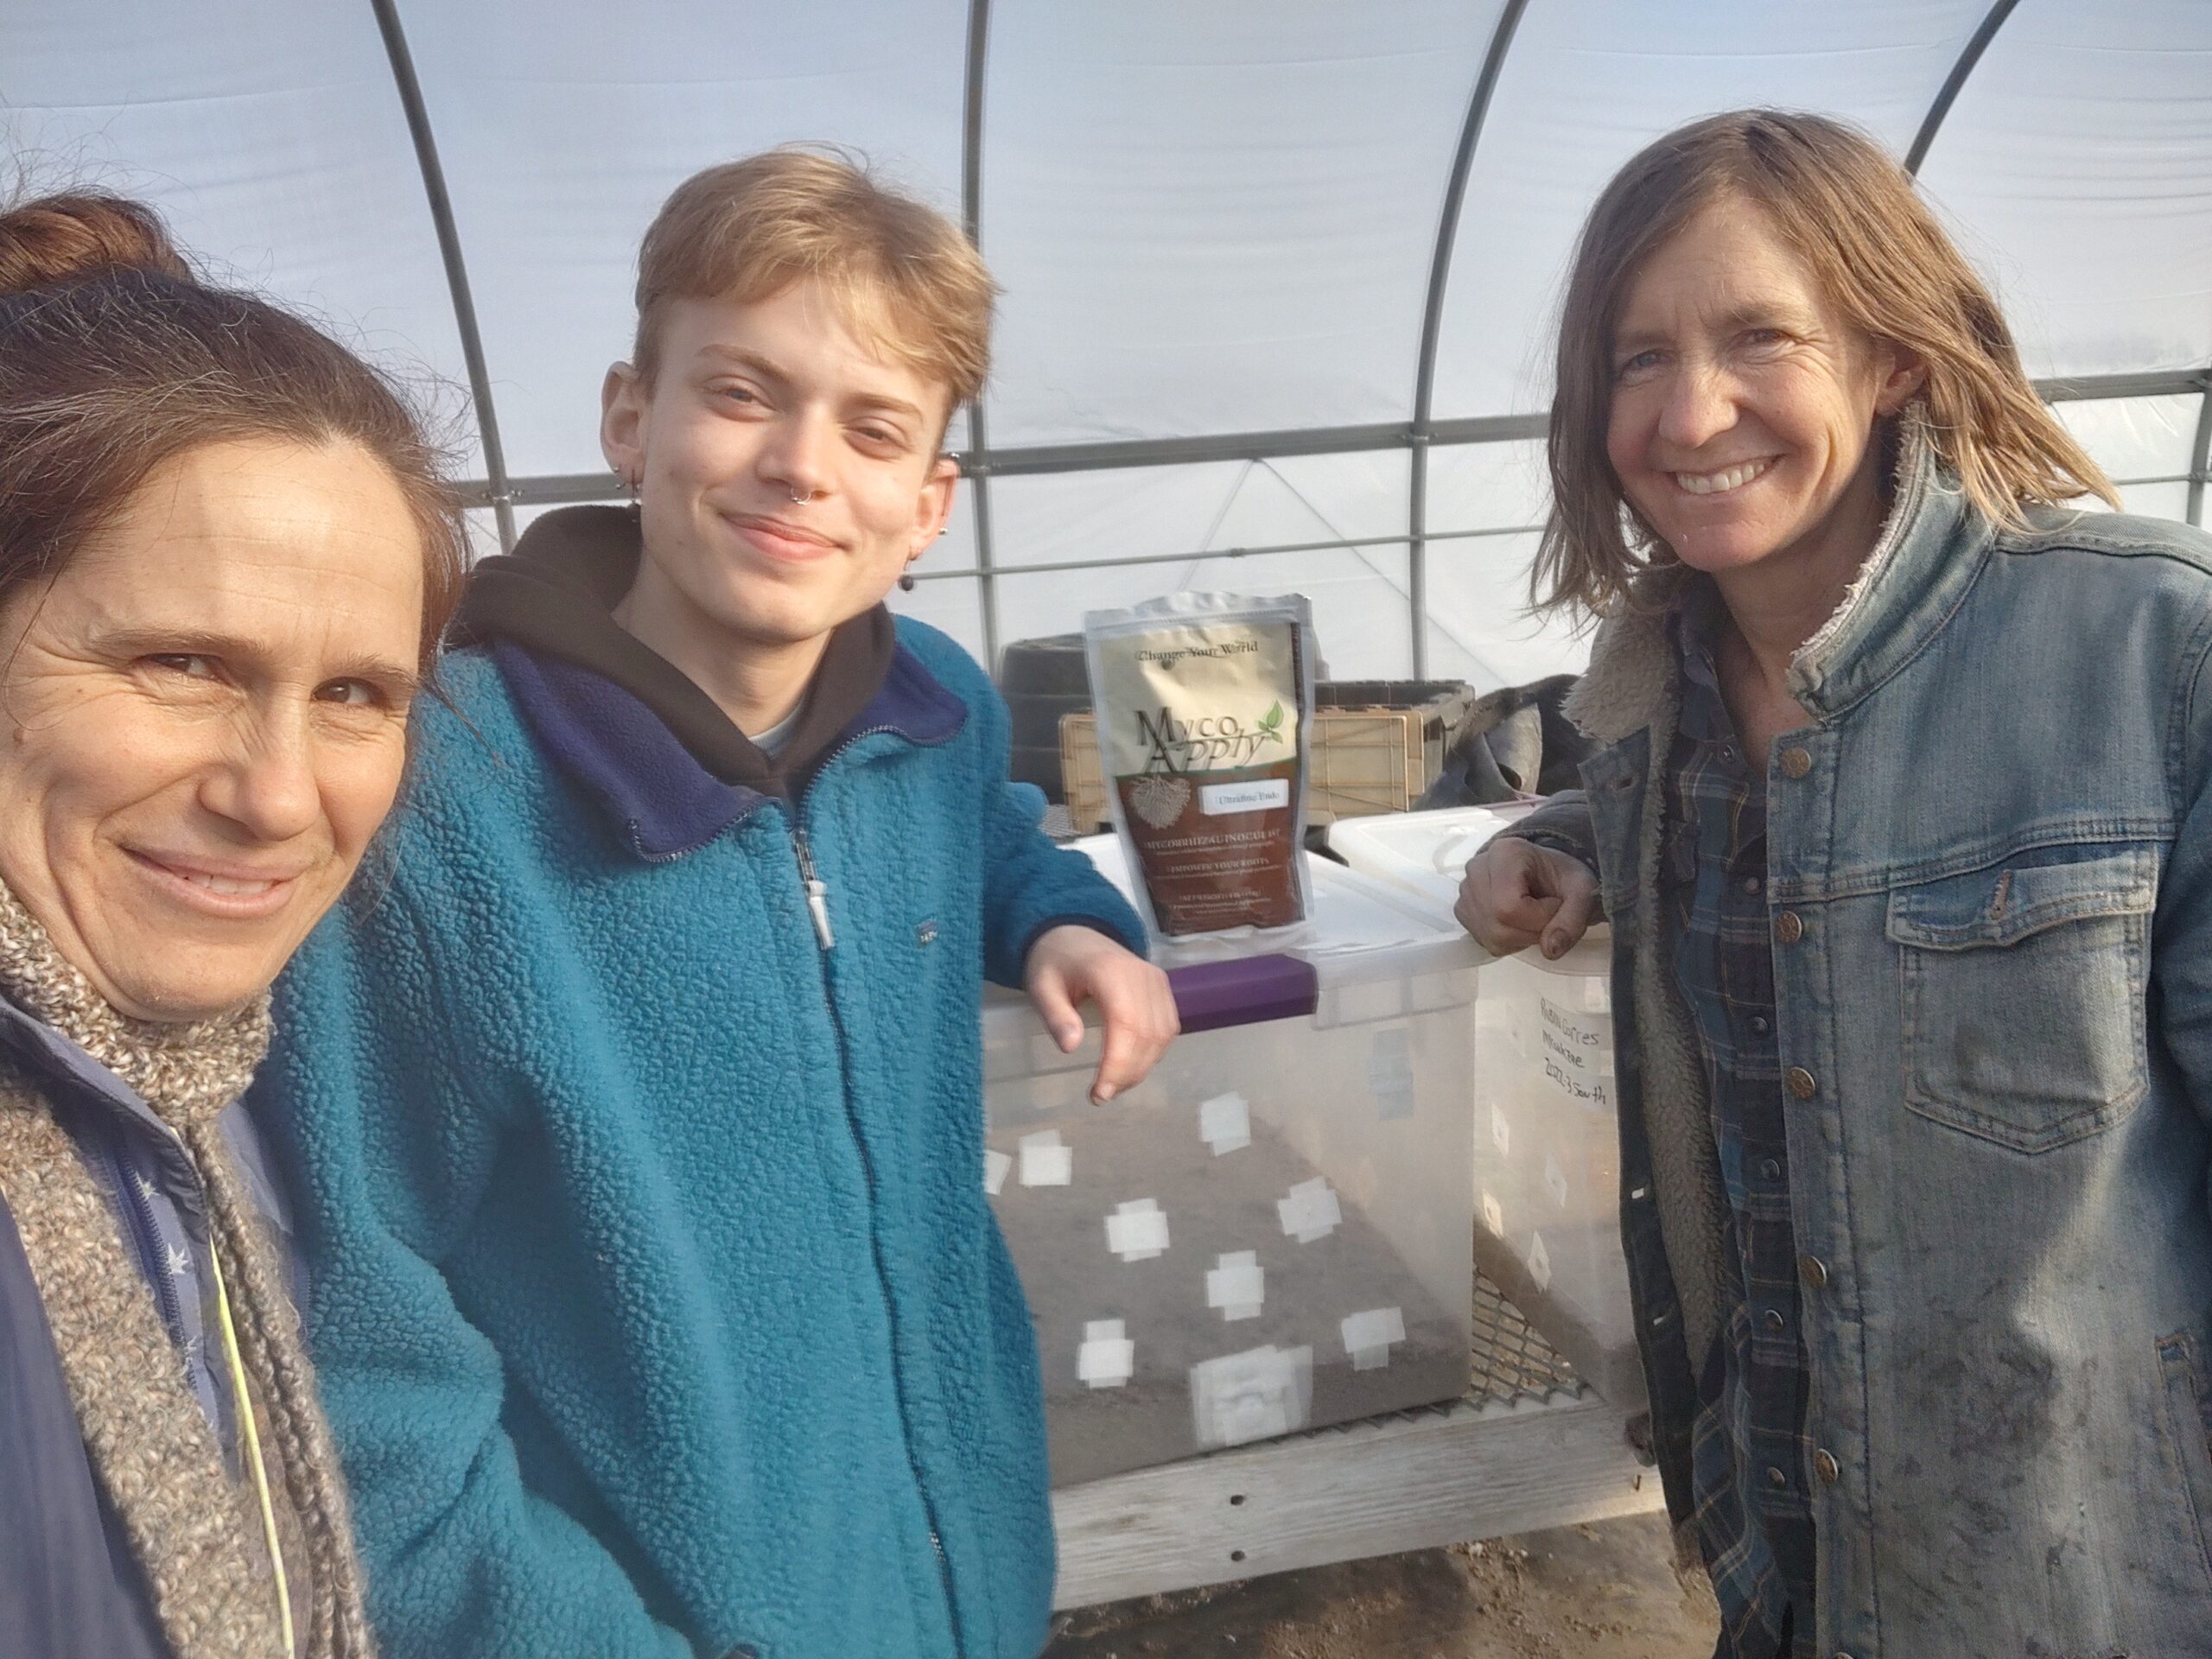
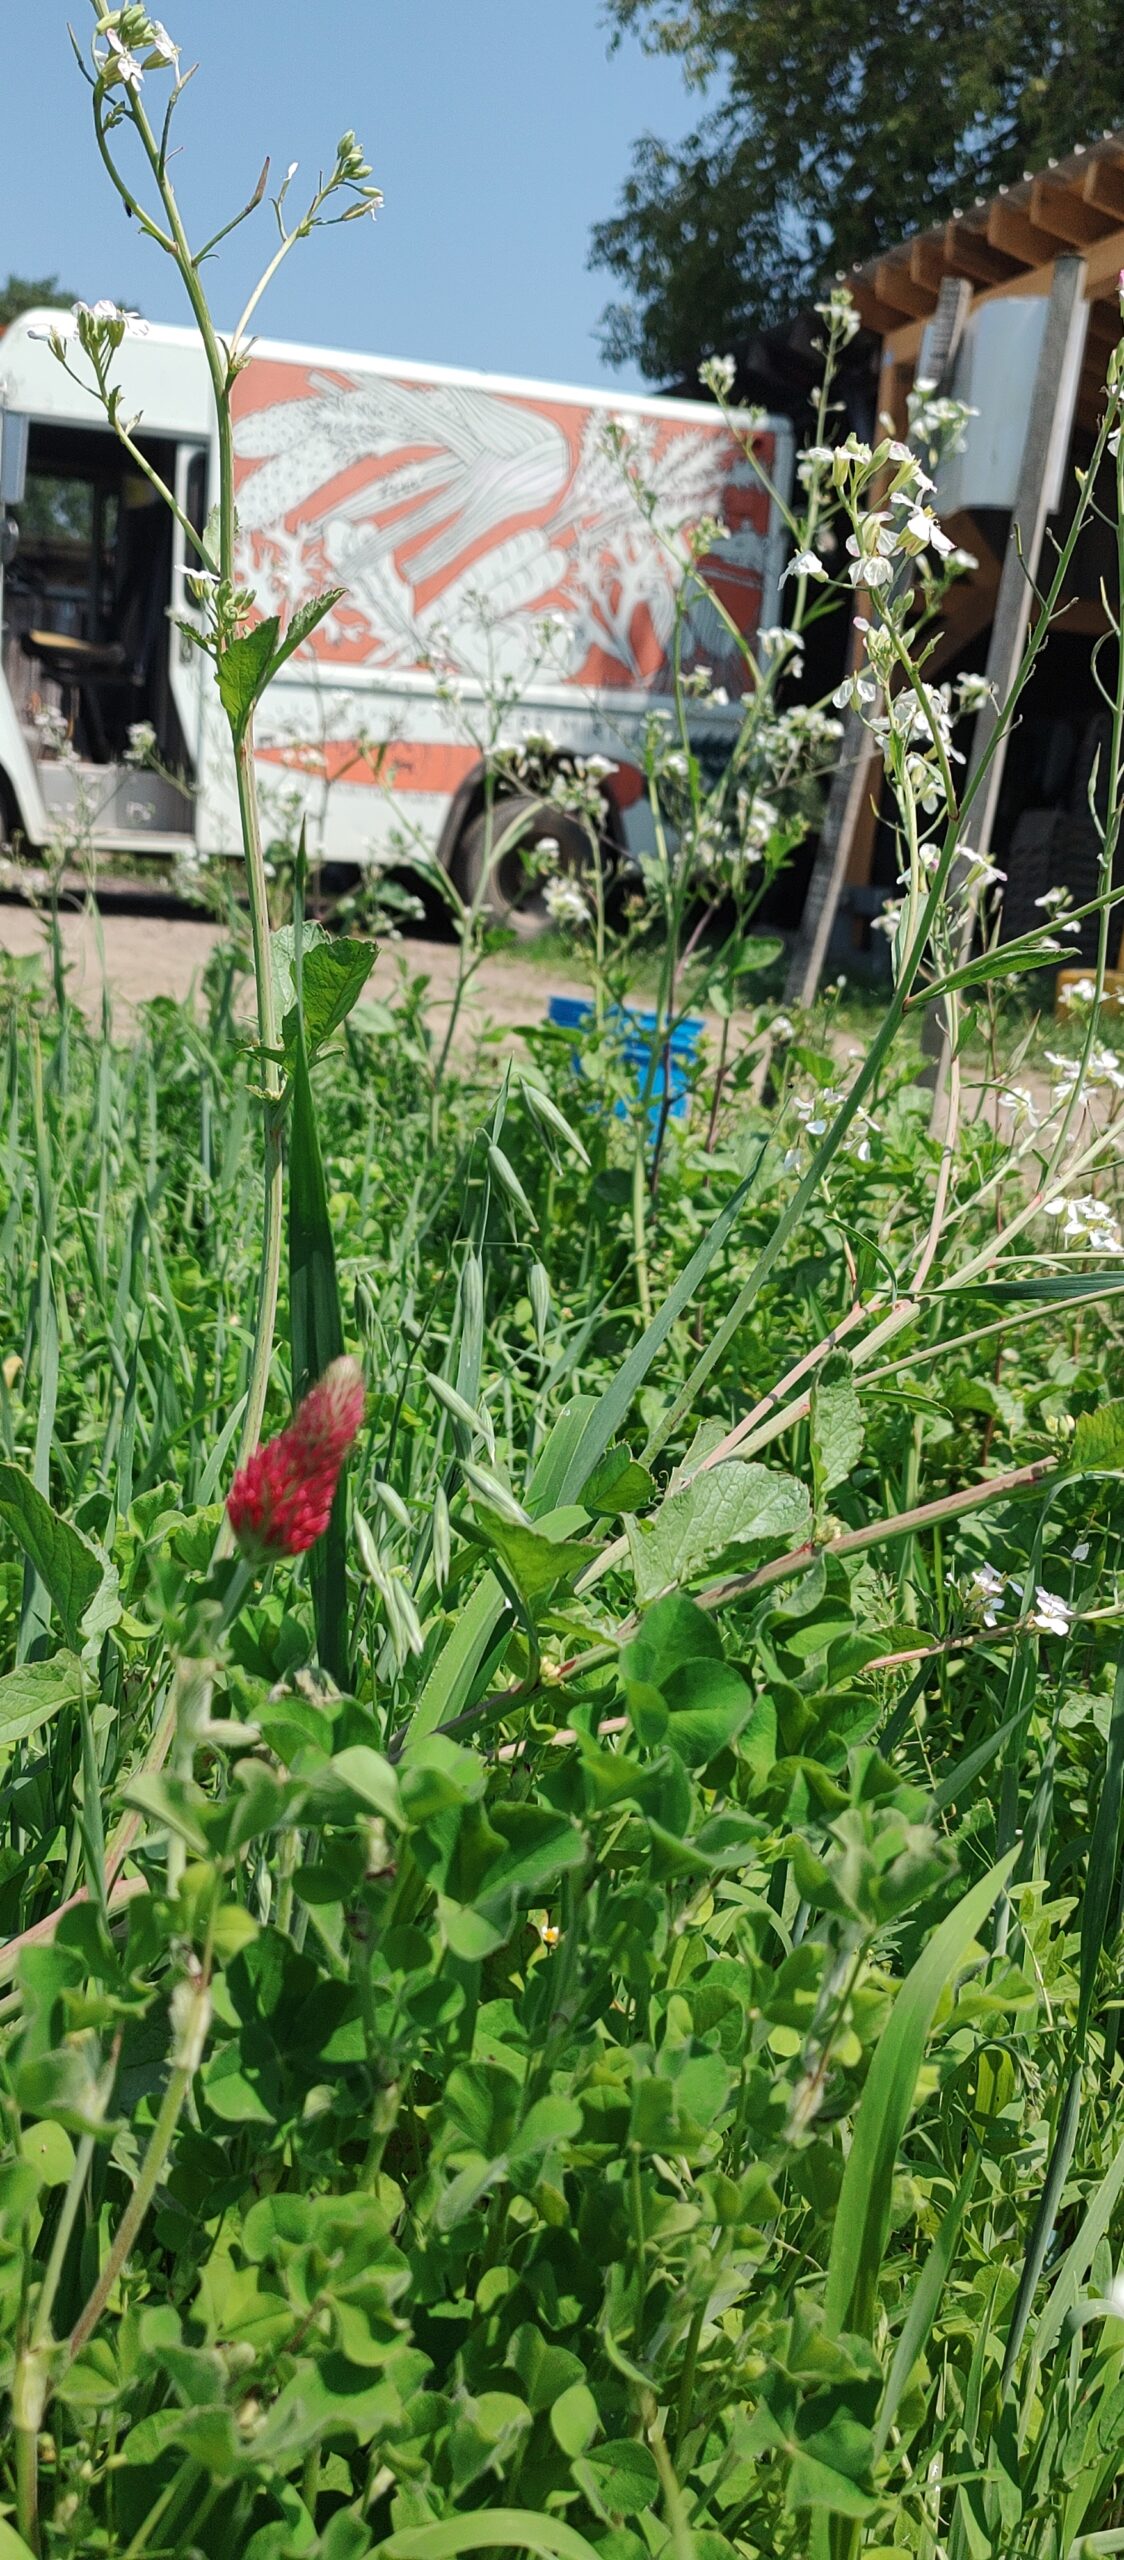
Images 40, 41, 42, 43 Researchers Luca Kolba, Jess Rubin, and Farmer Hilary Martin with the endemic mycorrhizae (before we gift it to the farm after inoculating the parsley seed) and with the commercial inoculum, Hilary tilling in cover crop grown from the endemic inoculum, a view of our plot and view with the Diggers’ Mirth delivery truck.
At the Winter 2023 NOFA Conference, we offered a workshop ‘Growing Endemic Mycorrhizal Fungi with Regenerative Farms.’ The 42 participants were surveyed.
Survey responses: surveyfromnofa23forsaresite
Summary statistics of the survey responses: NE SARE Report NOFA Survey Writeup
Project Outcomes
We have been in conversation with the land managers of the entire Intervale complex of farms and asked whether our research may be applicable in the context of the recent flooding. In short, there is interest to increase perennial buffers and to incorporate endemic mycorrhizae in areas that were formerly grass. Educational presentations to their teams would need to be given and corresponding grants would need to be written for this to be considered more seriously. With extensive plans for riparian buffers being discussed now with Interlace Commons, there is more interest in these ideas.
In Year 1.When we realized the haphazard inoculation technique was not considered best practices and the complex tilling cycle of the farm, our modification of the study to maintain the gist of it while incorporating it into areas that would not be affected by tilling worked. In hindsight I would allow more time and personnel for the scything of the field banks since they grew very tall and once the parsley was planted in them, more frequent hand scything may have facilitated more growth in the parsley crop. The concept of mycorrhizal banks still has merit, especially in terms of hosting diverse mycorrhizae if left over seasons undisturbed but for this farm’s crop production systems it is not certain they can be a supportive practice. All of our Standard Operating Procedures (SOPS) for P and mycorrhizae were honed. The questions for year 1 we set out to study were answered. Additional work that remains unanalyzed in spreadsheets is a more thorough taxonomical analysis on the different genera and species of mycorrhizae found in the different areas of the farm. We were able to record differences in spore shape, diameter, and even color with 3-5 guesses next to each one, based on guides we could find but this is as far as we got due to time and budgetary constraints. Similarly, there are limited mycorrhizal genome sequences so it was unfortunate how little mycorrhizal data we were able to get through our DNA analysis as we hypothesize there are distinct genera between areas in the farm due to management and other environmental conditions. This gap is worth pursuing as it can further inform farmers about which particular mycorrhizae can grow where and with which plant species. This would require an entirely separate study. We think all farmers and land tenders in bioregions concerned with mitigating P pollution from upland terrestrial activity could benefit from this research. We hope the guide and our findings from year 2 will be supportive to farmers and the regenerative agricultural community.
In year 2, a longer growing season (3-4 months) would have likely allowed for more data to indicate any changes occuring in the P cycle. Even better reseraching this in areas not disturbed for an entire year after the trials start would likey offer more ideal conditions for data to reflect mycorrhizae's efficacy in P cycling.
In assessment to our study’s approach, we did the best we could with the given circumstances. There are very few published studies incorporating mycorrhizae into agricultural systems because many farms, even in sustainable agriculture, rely on intensive tilling and crop rotation which damage mycorrhizal communities. The tradeoffs between maximizing mycorrhizal benefits for nutrient exchange and the benefits of tillage and seed bed preparation need to be further explored. Additionally, the conflict between needing to mitigate P in farm fields with excessive P and the decreased likelihood of mycorrhizae colonizing plant roots in legacy P fields may require novel approaches to promote mycorrhizae under these circumstances (Johnson, 2010; Johnson and Graham, 2013). One of these could involve harvesting soil with endemic mycorrhizae from fields with excessive P concentrations and then growing them. These mycorrhizae may be better adapted to the high P concentrations in fields that need to be mitigated.
Growing endemic mycorrhizae was a success as was writing the guide on how to do so. It is unclear whether endemic mycorrhizae is a better option than commercial mycorrhizae for farmers but our data seems to suggest it is. Although our research did not conclusively answer our questions about mycorrhizally assisted P mitigation, there were interesting trends in root colonization of parsley and in the soil, soil water and plant P concentrations among treatments of endemic, commercial or no inoculant. These trends warrant additional research.
We are no longer going to attempt nor promote efforts to apply mycorrhizae in agricultural systems that till and rotate crops frequently due to the high potential that tilling rips up the mycorrhizal networks and propagules left behind are not necessarily able to maximize their nutrient exchange services in each growing season before being disturbed again.
We will continue to work with endemic mycorrhizae in agricultural areas absent from tilling such as riparian buffers and field edges planted in perennials. Additional research is needed on both fronts, particularly in designing the most efficacious plant palettes to maximize P removal through cyclical fruit/nut/herb harvest and coppicing. Intervale land managers Patrick Dunseth and Duncan Murdock as well as other Intervale farmers who are interested in maintaining and increasing perennial areas could benefit from this information as can all land managers, agroforestry professionals, and restoration practitioners in the NE United States.
With the most recent flooding (Image 44), it is clear that all waterways technically need at least 100 ft on either side of their current path to allow water to slow, spread, and sink through infiltrating green infrastructure. Any farms, businesses, residents, organizations, and schools interested in supporting this needed shift in land management where P runoff from terrestiral landscapes is a concern could benefit from our findings.
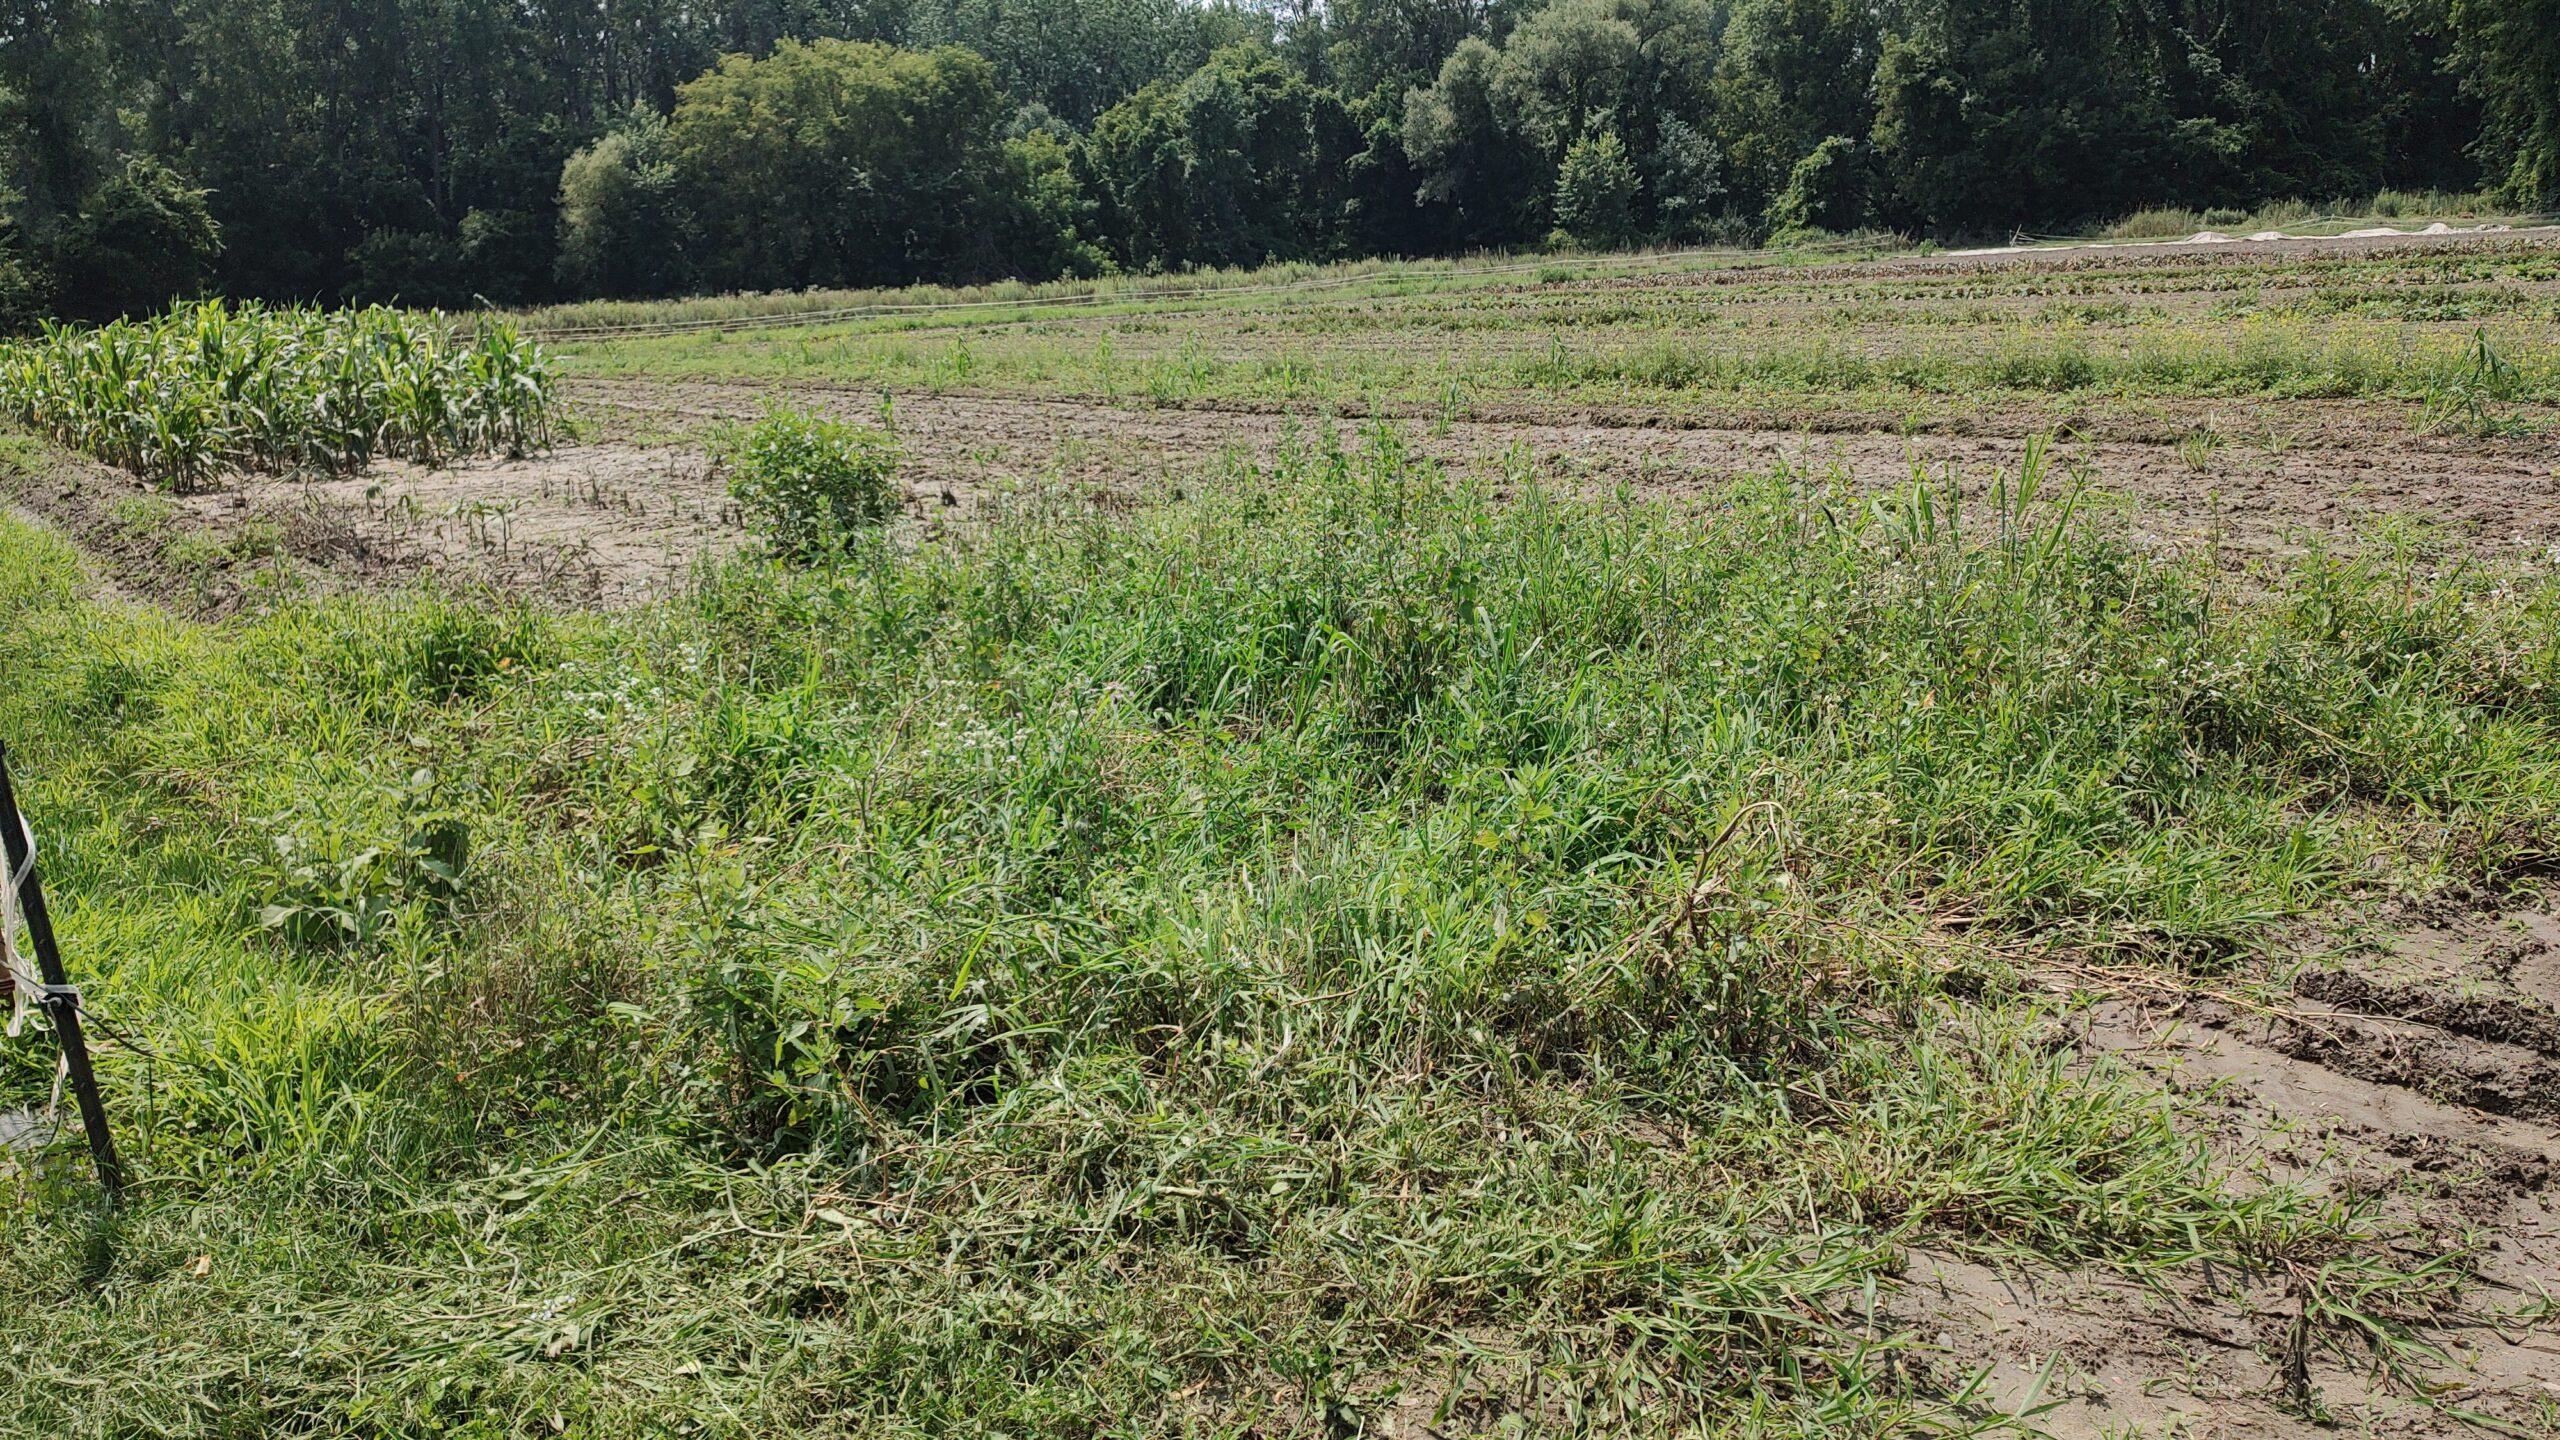
Image 44 plot of our research site (luckily harvest a week before) the flooding occurred. This photo is of the site after the water receded.