Final report for ONE24-449
Project Information
The Honeycrisp (HC) apple has generated the most consumer excitement of any apple, both in the US and in many other countries. This is still reflected in the prices consumers are willing to pay and in grower returns. However, HC is one of the most expensive and frustrating apples to produce. The problems include slow growing, highly biennial bearing, high disorder and disease incidence, storage problems and postharvest rots. Thus the high cost in the marketplace does tie in to the high cost of production at the farm and storage/packing level.
Consequently, there is a lot of lower quality HC going into the marketplace. Some of the better growers are getting recommendations to help increase quality. Many of these come from the science generated by university researchers, and the distillation to the industry by extension, in addition to crop consultants, packers and marketers.
One recommendation of a way to put the highest quality fruit in the marketplace has not been adopted in the eastern United States. It is a decision tool that is being used in the West. This is the amount of malic acid levels (from here on referred to as acidity) in the fruit. These levels can now be quickly and easily read with a meter. Unpublished research by Dr. Jim Mattheis (USDA, retired) has confirmed this. He found 3 ranges of acid levels in fruit that correspond to low, medium and high. The higher the acidity at harvest, the higher it will be when it comes out of storage and the better eating quality it will have.
In our research we sought out to confirm this in Western New York. In two years (2024 & 2025) of trials, we found HC from individual orchard blocks did fall into general three general acid level categories, high (acid > 0.6%), medium (acid between 0.4 and 0.6%) and low (acid <0.4%). In addition, through two years of a formal sensory analysis at Dr. Robin Dando's lab at Cornell University, the highest acid levels corresponded to the highest overall liking by students who tasted the fruit. From 75-96 students tasted and rated the fruit from 2024 and 2025.
The acid/brix meter for apples (produced by ATAGO USA) is cost effective, easy to use and relatively quick to perform the tests. One large packing house and sales desk is excited about the possibility and is currently starting the second year of trialing the meter. The cooperators in the project are thinking about using the meter in their QC testing. At this time, there has been no other buy in from the other major operations in the region. I have continued to discuss the benefits of measuring and tracking acid levels in HC through presentations, publications and many conversations. All apple producing regions in the eastern United States could benefit from measuring, tracking and using these acid levels to determine storage length and marketing plans in HC.
If higher consumer liking translates to more repeat sales, a conservative estimate would be to increase plantings by 20%. With the increased acreage and current price received per bin, this could yield an additional $12.5 million in gross income to New York State apple growers alone. Michigan, Pennsylvania and the other regions in New York could all benefit from the use of acidity in HC as a decision tool. I will continue trying to push adoption in Western New York and beyond.
This project seeks to measure the acidity of Honeycrisp and correlate high acid levels at harvest with very good to excellent eating quality after storage. In this study, we will sample fruit from a range of orchard blocks and separate them into low, medium and high acidity categories. At least three orchard blocks will be used per category. Acidity will be measured two ways – 1. The formal titratable acidity measurement that is time consuming, and 2. A newly acquired acidity meter that can assess samples quickly. In addition, fruit at harvest will also be treated or not treated with an inhibitor of ethylene production that slows down the rate of fruit ripening. The fruit will be stored at the standard storage temperature of 38oF for up to 90 days. Changes of acidity in fruit from each of these categories will be measured at 30-day intervals during storage. Quality as well as informal and formal sensory evaluations (appearance, texture, mouth feel, juiciness, and overall acceptability) will be assessed after 90 days of storage. Outreach will consist of recommendations in fruit industry conferences and extension publications.
During the past decade, HC has continued to be the number one sought-after variety by consumers in the US. Until this crop year, demand and premiums have remained well above all other varieties, from grower returns to retail sales. Although all of the major apple-producing states have continued to plant, the low yield and low pack out of this variety continues to be a challenge for all of its growing regions in the US and Canada. Rootstock selection, microclimate, a high biennial bearing index, bitter pit, and multiple storage disorders are not even the full list of problems. With the overproduction of most commercial fresh market apple varieties, prices from the fall crop of 2023 through spring of 2024 have been low, across the region and in nearly all varieties. While HC returns have typically been as much as 3 ½ times higher than other varieties, it has fallen to levels dangerously close to the cost of production. If the “day of reckoning” has arrived, then researchers have to up their output at a higher level to ensure all loss and waste of this premium variety is minimized.
In addition, increased production has also led to consumer dissatisfaction with fruit flavor. HC in the market can have crisp texture but disappointing flavor. The bland flavor has been associated with acidity – despite HC being a sweet fruit, acidity is the underlying positive flavor component. The challenge for the industry is to improve the flavor profile of this much wanted variety, especially with new club varieties entering the marketplace. Early research by Dr. Jim Mattheis (USDA Wenatchee) found that higher acidity at harvest was associated with higher acidity and better flavor after long-term storage.
Determining harvest maturity at the correct timing for HC has proven difficult and inconsistent. In most varieties tested in maturity programs, internal ethylene concentrations (IECs), as measured in ppm by a gas chromatograph, can be correlated with maturity. In most varieties, the start of measurable (0.2-0.5 ppm) IEP signals the start of the ripening phase, in which the fruit are very near harvest for long-term, controlled atmosphere (CA) storage. In addition, there can be a steady or exponential rise in IEC in which fruit can become overmature and unsuited for CA and must be packed and marketed quickly. In HC, IEC does not correlate with maturity. There is no correlation with when to harvest for any storage regime, length, or marketing window using IEC in HC. Currently, a number of other quality indicators are used to try and determine ideal harvest timing for storage/market destination. One of the primary harvest indicators used in HC is color. In concert with acceptable flavor, color that “jumps out” when the yellow background color makes the red appear almost fluorescent/iridescent is ideal. The major flaw with using color is that weather patterns in the days/weeks prior to maturity can affect proper color. For instance, cooler and cloudier weather patterns can wash out existing color or cause poor color development altogether. Another quality indicator that can help time harvest is firmness. Again, weather patterns during a large part of the growing season or close to harvest can affect firmness. Above average precipitation can cause fruit to be softer than target levels for CA storage. Drought or below average precipitation can cause fruit to be firmer than normal, and trick growers into harvesting too late if they are waiting for firmness to get into target range for a “normal” season. SSC (%), measured by a refractometer, indicates the overall sweetness of the fruit. As with the above quality indices, weather patterns can affect the SSC and perceived sweetness and flavor. Above average precipitation can cause fruit to have lower SSC and not taste as good. Conversely, drought or below average precipitation can cause fruit to have higher SSC than normal, and make for sweeter tasting fruit. Another quality indicator to help time correct harvest dates is the starch pattern index (SPI). A sample of apples are cut in half, and sprayed with an iodine solution. The conversion of starches to sugars causes the purple-colored iodine solution to turn ripe. Varying stages of ripeness (variety specific) show patterns in the fruit. At Cornell, we use a score of 1-8, with 1 being completely unripe (purple) and 8 being completely (over)ripe (white). Each variety (X) has a set standard (1<X<8) between for suggested harvest from on the early side (midterm to long-controlled atmosphere (CA) storage) to later harvest (to be packed relatively quickly and stored short term in regular air). While SPI can be a guideline to when to harvest for a planned storage/marketing plan, weather patterns can also swing it out of alignment with other maturity/quality indicators. For instance, a droughty season can cause a small amount of carbohydrates to be deposited into the fruit. When these fruit enter the maturation phase, the conversion of starch to sugars happens relatively quickly, and is not a great indicator of when to harvest and does not reflect true maturity. Another relatively new way to help gauge maturity is the delta absorbance (DA) meter. The loss of chlorophyll in the peel can be an effective indicator of fruit ripening. This vis–NIR portable spectrometer measures delta absorbance. It provides a non-destructive relative chlorophyll content index (Ziosi et al. 2008). Absorbance of radiation of wavelengths 670and 720 nm is converted to absorbance based on the Beer–Lambert Law and the index of absorbance difference (IAD) and represents the absorbance peak of chlorophyll-a and the background spectrum, respectively. The lower the number, the more mature the apple is (less chlorophyll remaining). Past research has shown that DA readings in our region for HC are often not in alignment with other maturity/quality indicators. Therefore, we aim to show that TA will be a tool in the toolbox that can be most in alignment with good eating quality. This in turn should increase farm income for growers of HC in the Northeast region of the US and Canada.
Cooperators
Research
Prior to the need for sample collection, a meeting was held with the cooperators to make sure we were on the same page for how we were going to treat the fruit at harvest and the methods that we were going to follow.
It was our hope that we would get the used autotitrator up and running prior to harvest but we were unable due to the fact that there were some parts that needed to be replaced and that company who services the machine has changed hands several times. However as outlined in the grant proposal we were able to purchase an additional ATAGO pocket brix/acid meter for the cooperators at Lake Ontario Fruit, Inc. (LOFI). Prior to harvest, I demonstrated the use of the meter to the QA crew at LOFI.
Also prior to harvest, I contacted the potential growers from whose farms we would be collecting samples. We have been collecting Honeycrisp fruit for various research projects from some of the same farms and orchard blocks for several years in a row. Upon explaining the promise of measuring acidity and tying high acid levels to better storage quality the growers were happy to let me take samples and were looking forward to the results.
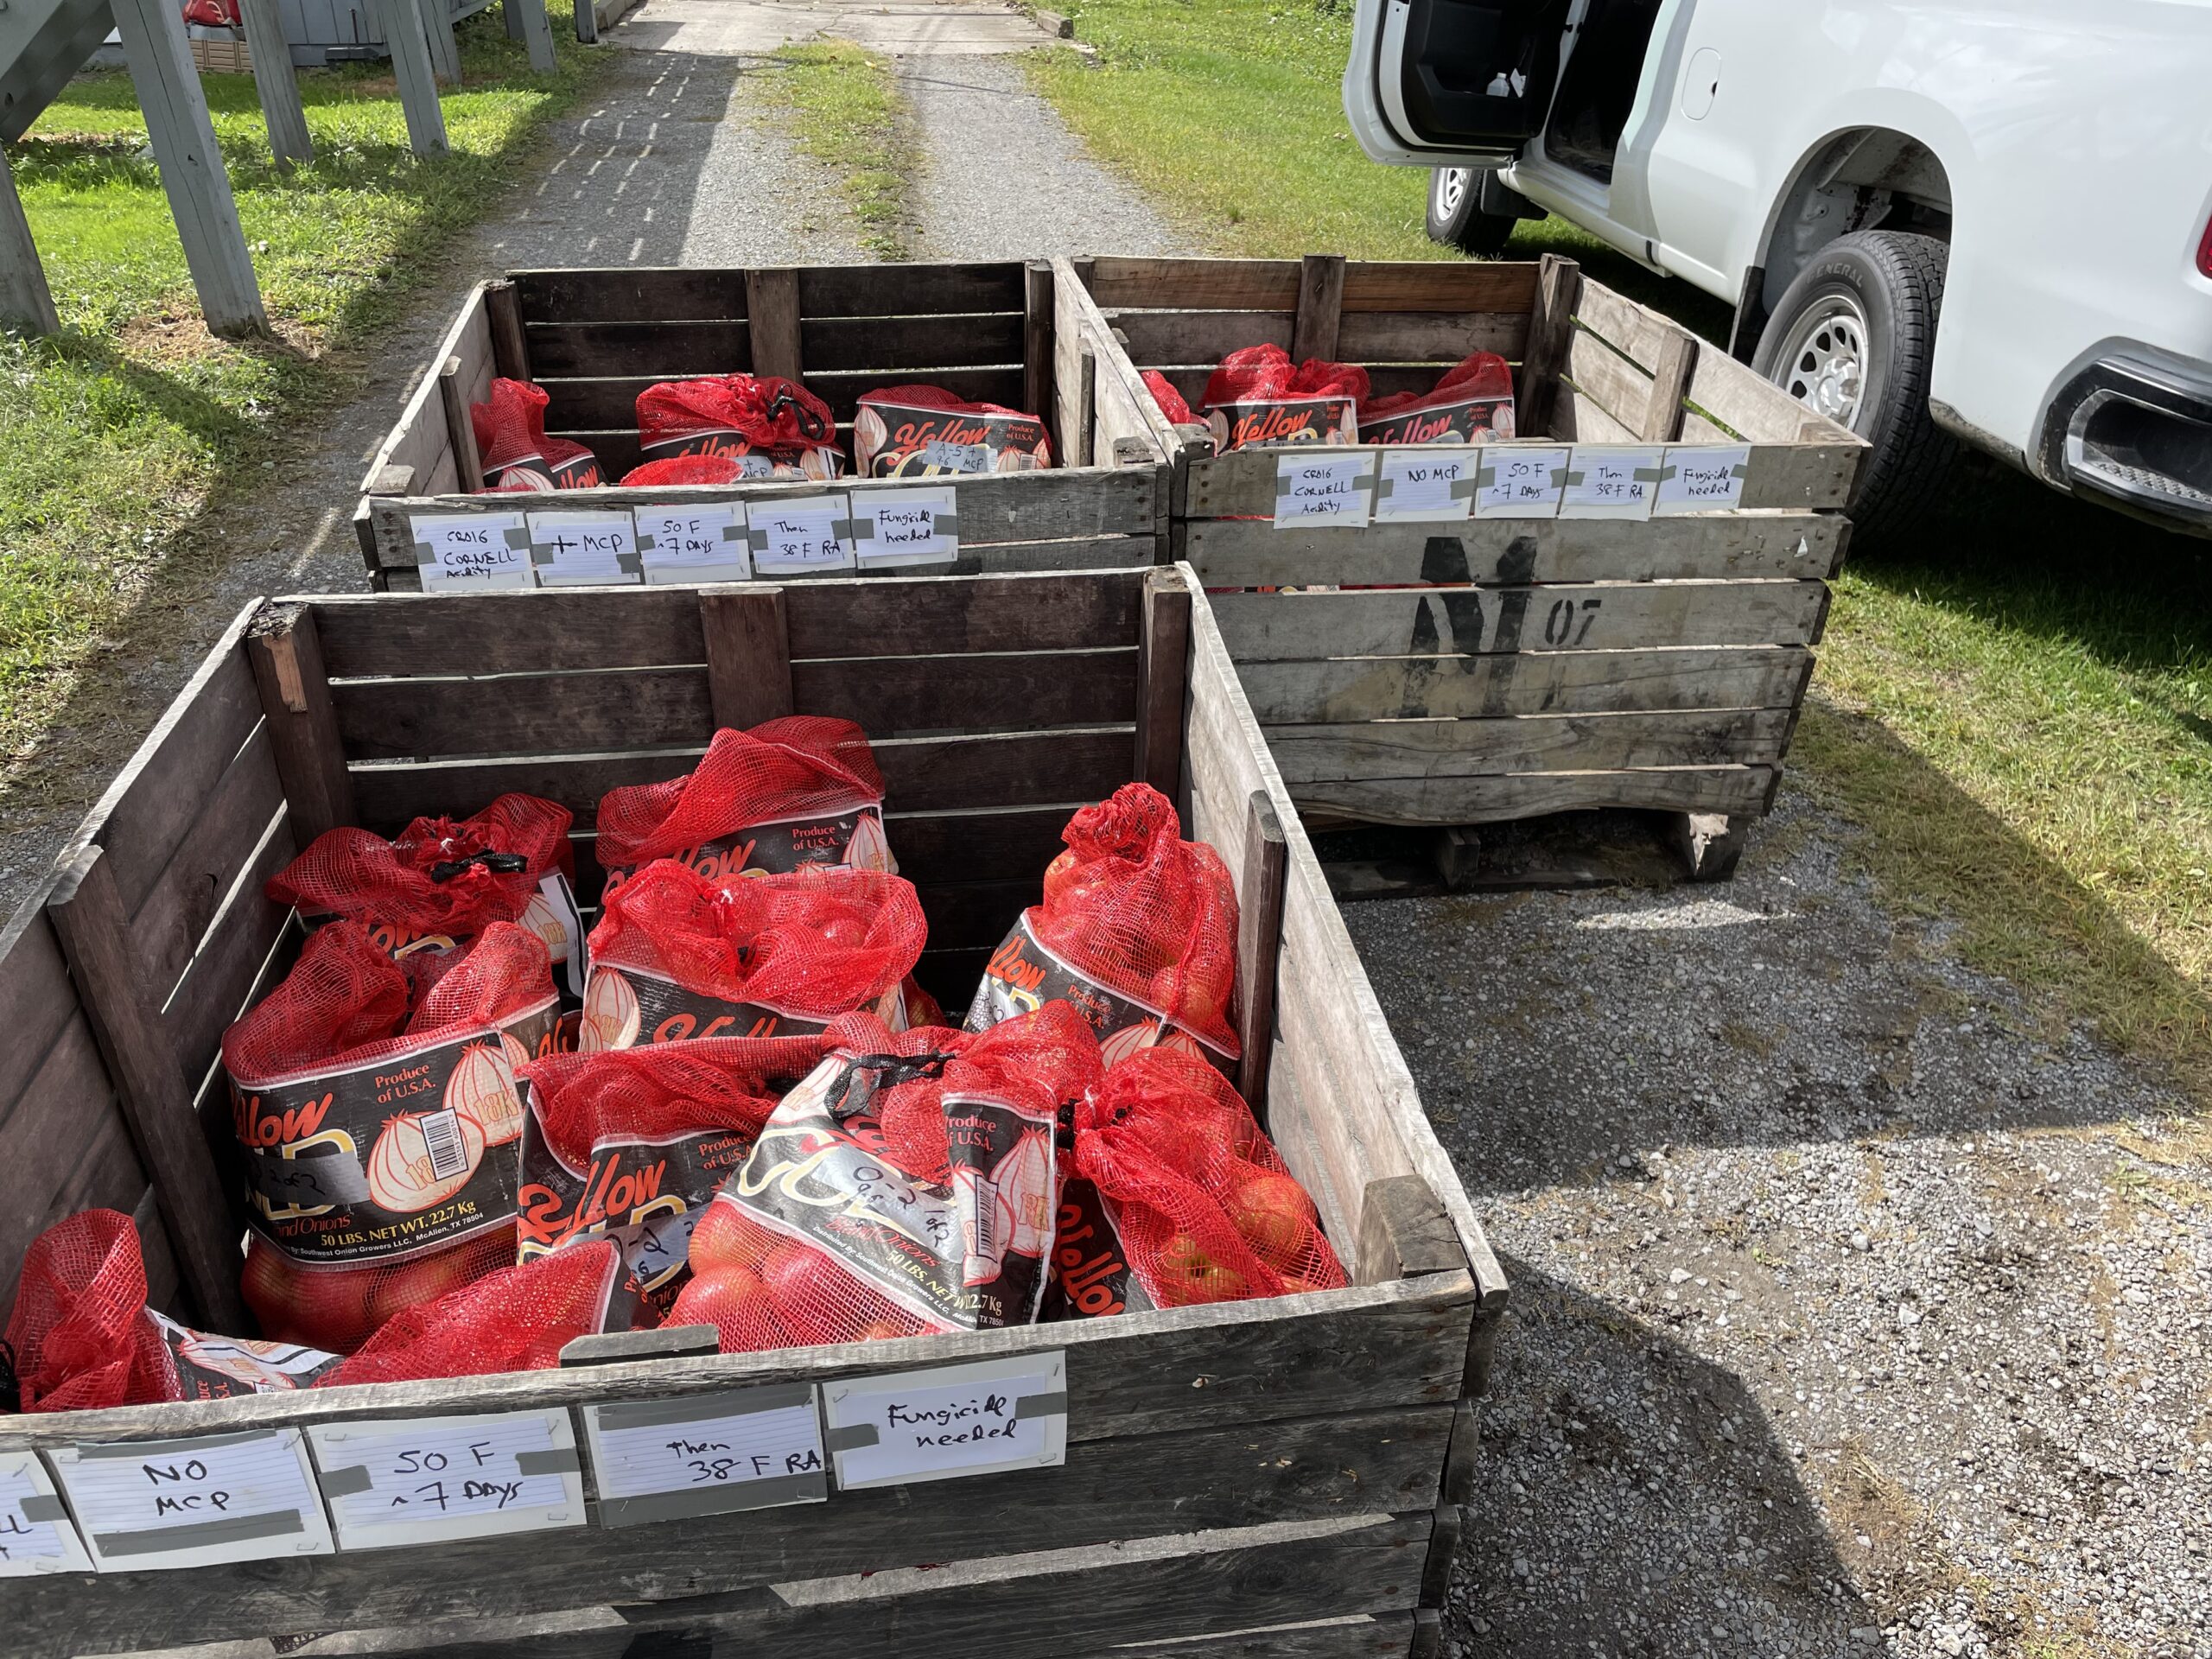
At the correct maturity timing for Honeycrisp harvest (September 6-12, 2024) for these potential research blocks, myself and my assistants collected 28 samples from 14 orchard blocks from 9 separate farms. The 28 samples were divided into half treated with 1-MCP, and half untreated. Each sample consisted of 120 apples at harvest. 100 were taken 2 LOFI and treated or not treated with 1-MCP, and conditioned at 50F for seven days before being put into a 38 F room in regular air storage for the duration. The remaining 20 fruits per sample were taken to the harvest maturity lab at Orleans CCE. Standard maturity measurements were taken, which included DA meter, firmness, total soluble solids (brix), and starch pattern index (SPI). For the brix and acidity readings, the juice from the hole punches taken for firmness was used. After calibration with distilled water, approximately 5 ml of the sample juice were placed on the ATAGO brix/ acid meter on which the button was pushed giving us the brix. After the meter was cleaned and dried with distilled water and dried with Kimwipes™, approximately 1gram of juice was placed in the beaker on the scale provided with the ATAGO test kit. Distilled water was added to bring the total volume weight to 50 grams. After a quick stir, approximately 5 ml of the solution was placed on the meter with the button pushed giving us the percent malic acid. Another button was pushed giving us the brix:acid ratio. All results were recorded.
As mentioned in the previous paragraph, the fruit were conditioned at 50F for a week before placing them in their recommended storage temperature of 38F. This conditioning of Honeycrisp is standard procedure to reduce the likelihood of the post harvest disorder soft scald/soggy breakdown. The researchers were curious whether or not the conditioning. An effect on the rate of acid reduction in the fruit. Therefore, extra samples were harvested for three of the 14 orchard blocks.
At approximately 30 and 60 days postharvest, 20 apple samples each were taken from each of the 28 sample bags. These were brought back to the harvest maturity lab and tested for firmness, brix, total malic acid, and brix:acid ratios with the equipment and methods described earlier. All data was recorded.
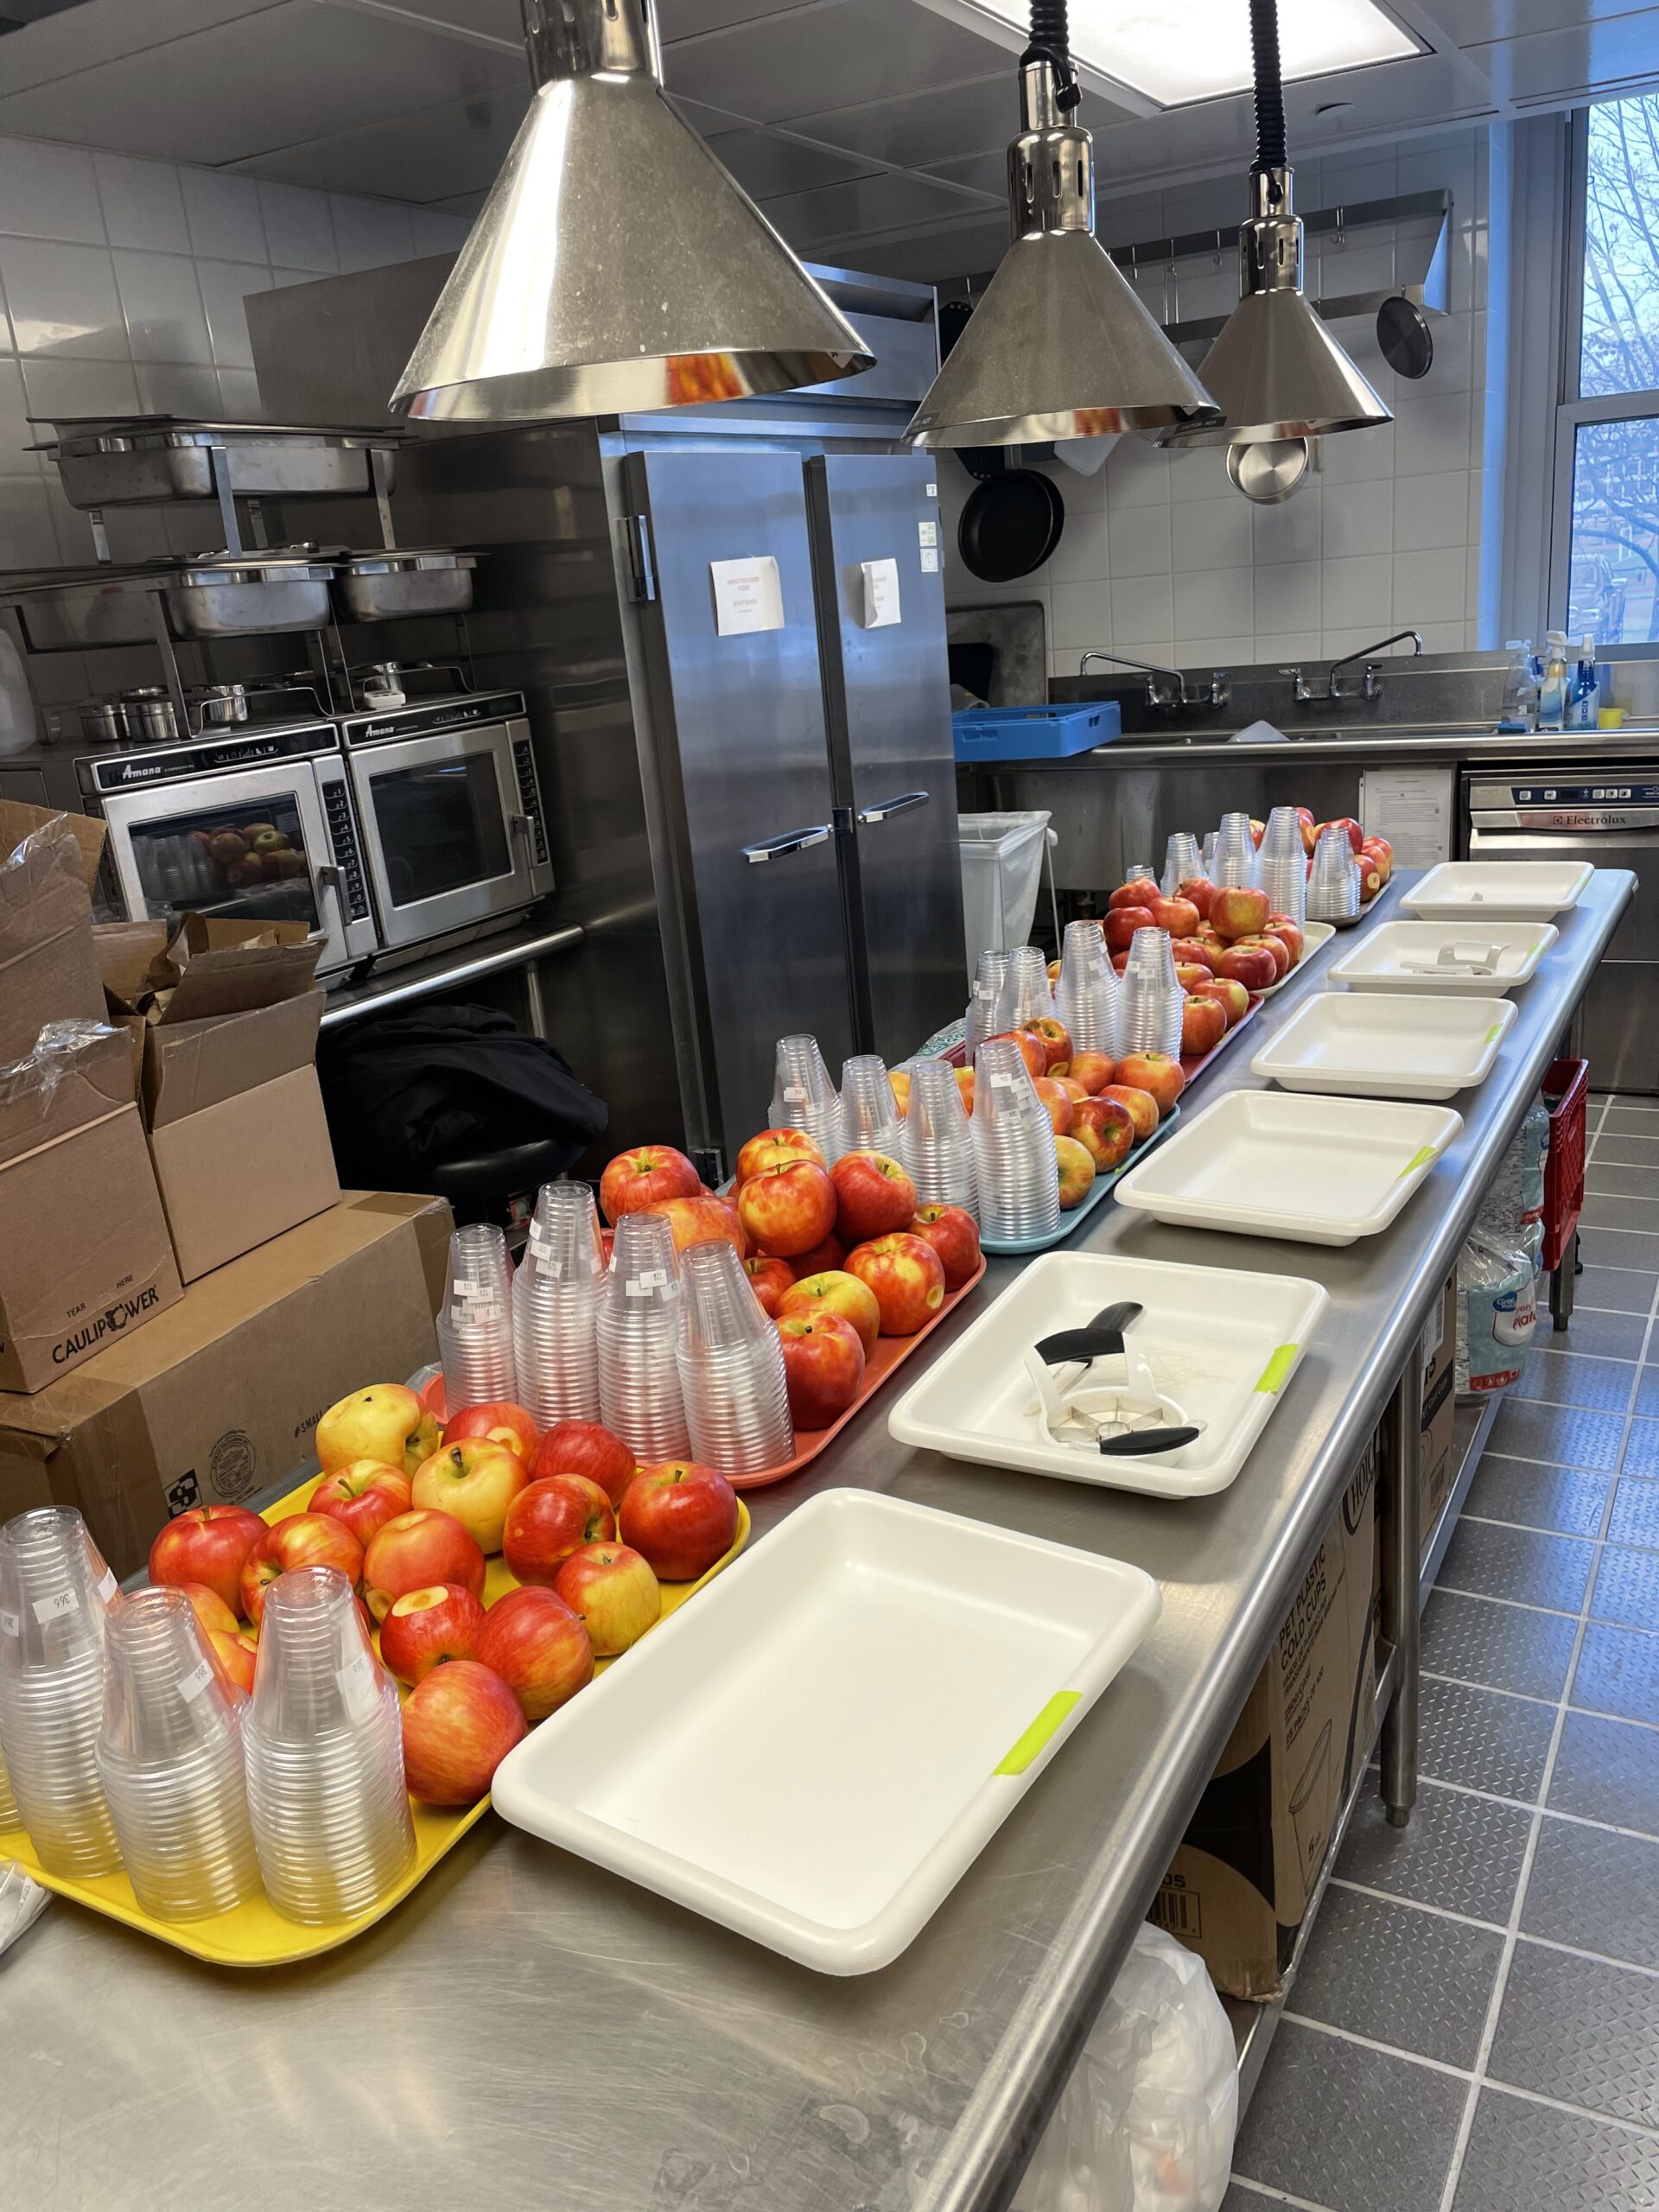
At approximately 90 days postharvest, the remaining samples were taken out of storage. There was some loss to rots, and these were culled out prior to final use of the samples from 10-20 for final acidity measurements at the harvest maturity lab. The remaining usable apples were tested for firmness, brix, total malic acid, and brix:acid ratios with the equipment and methods described earlier. All data was recorded. After this testing was concluded, a subset of samples representing at least two samples each from the three acid categories (high, medium, and low) corresponding to the malic acid levels described earlier were taken to the sensory analysis (SA) lab in the care of Dr. Robin Dando on the Cornell University campus. Craig worked with members of the Dando lab to set up the SA. The SA is a scientifically validated voluntary taste testing by students. 88 students completed the SA. The SA Add a computer that accompanied the samples. Each sample also had a picture of a “typical apple”, whole. Each participant in the SA scored these samples, from the whole apple picture and its visual appearance, including taste, texture, aroma, and off flavors. Each sample had a random code assigned to it. Data analysis has shown higher acidity apples have a higher overall rating, as well as flavor and texture liking.
For year 2 of the project, at the correct maturity timing for Honeycrisp harvest (September 10-19, 2025) for these potential research blocks, myself and my assistants collected 44 samples from 22 orchard blocks from 13 separate farms. The 44 samples were divided into half treated with 1-MCP, and half untreated. Each sample consisted of 120 apples at harvest. 100 were taken to LOFI and treated or not treated with 1-MCP, and conditioned at 50F for seven days before being put into a 38 F room in regular air storage for the duration. The remaining 20 fruits per sample were taken to the harvest maturity lab at Orleans CCE. Standard maturity measurements were taken, which included DA meter, firmness, total soluble solids (brix), and starch pattern index (SPI). For the brix and acidity readings, the juice from the hole punches taken for firmness was used. After calibration with distilled water, approximately 5 ml of the sample juice were placed on the ATAGO brix/ acid meter on the button was pushed giving us the brix. After the meter was cleaned and dry with distilled water and dried with Kimwipes™, approximately 1 gram of juice was placed in the beaker on the scale provided with the ATAGO test kit. Distilled water was added to bring the total volume weight to 50 grams. After a quick stir, approximately 5 ml of the solution was placed on the meter with the button pushed giving us the percent malic acid. Another button was pushed giving us the brix:acid ratio. All results were recorded.
At approximately 30 and 60 days postharvest, 20 apple samples each were taken from each of the 44 sample bags. These were brought back to the harvest maturity lab and tested for firmness, brix, total malic acid, and brix:acid ratios with the equipment and methods described earlier. All data was recorded.
At approximately 90 days postharvest, the remaining samples were taken out of storage. There was some loss to rots, and these were culled out prior to final use of the samples from 10-20 for final acidity measurements at the harvest maturity lab. The remaining usable apples were tested for firmness, brix, total malic acid, and brix:acid ratios with the equipment and methods described earlier. All data was recorded. After this testing was concluded, a subset of samples representing at least two samples each from the three acid categories (high, medium, and low) corresponding to the malic acid levels described earlier were taken to the sensory analysis (SA) lab in the care of Dr. Robin Dando on the Cornell University campus. Craig worked with members of the Dando lab to set up the SA. The SA is a scientifically validated voluntary taste testing by students. About 75 students completed the SA. The SA had a computer that accompanied the samples. Each sample also had a picture of a “typical apple”, whole. Each participant in the SA scored these samples, from the whole apple picture and its visual appearance, including taste, texture, aroma, and off flavors. Each sample had a random code assigned to it. These SA attributes were combined into an "overall liking score". Results are in the proper section.
The principal measurement for this entire study is the acidity, in the form of malic acid. From unpublished data from Dr. Jim Mattheis of USDA, there are three main acid categories for apples that are eaten for the fresh market. High = >0.6% malic acid. Medium is 0.4% or greater, but 0.6 or less. Low is under 0.4%. In the 2024 harvest, the 14 orchard blocks had approximately 43% of the samples (6/14) at the high acid level, 36% of the samples (5/14), and approximately 21% of the samples (3/14) at the low acid level. In the 2025 harvest, the 22 orchard blocks had approximately 9% of the samples (6/14) at the high acid level, 45% of the samples (5/14), and approximately 45% of the samples (3/14) at the low acid level.Since half the samples just after harvest were treated with the ethylene blocker 1-MCP, and half were left untreated, there were 28 total samples for the subsequent analyses in year 1, and 44 samples in year 2. . Past research and observations have shown that 1-MCP helps retain acidity, even in samples stored in regular atmosphere. The primary benefit for most apple varieties is the retaining of firmness. However, Honeycrisp is one of the only apple varieties in which you do not see a significant difference in firmness between treated and untreated 1-MCP samples. Nonetheless, because of the maintenance of acidity benefits, most storages treat their Honeycrisp with 1-MCP.
Please see the data tables below for the summary of the malic acid data for all the samples at all sampling periods. One of the things that I learned during both years of the two year project is that Honeycrisp orchard blocks that have very uniform trees and good pruning and good crop loads, have more even maturity (which is not something new) but tend to have higher acid levels. In contrast, trees with variable crop loads or heavy crop loads and less dwarfing rootstocks tend to have lower acid levels at harvest. There were some samples that retained their same acid level categories throughout the 120 day period, but all declined over time. It is known that acid levels will always decline over time. The reason for a rise in some of the samples at some samplings is because at each sampling, we are doing destructive sampling and not sampling the same apples. We are sampling apples from the same harvest during subsequent testing periods, but not the same apples so there will be some inherent variation.
| Summary of All Acidity Data, Year 1 | ||||||||
| Total Acidity (Converter to Malic Acid), % (from 1:50 dilution) | ||||||||
| ID | Trt | Harvest | 30 Days PH | 60 Days PH | 90 Days PH | AVG | ||
| A-1 | NO 1-MCP | 0.65 | 0.52 | 0.58 | 0.45 | 0.55 | ||
| A-1 | 1-MCP | 0.65 | 0.33 | 0.62 | 0.39 | 0.50 | ||
| A-2 | NO 1-MCP | 0.87 | 0.68 | 0.78 | 0.75 | 0.77 | ||
| A-2 | 1-MCP | 0.87 | 0.56 | 0.58 | 0.82 | 0.71 | ||
| A-3 | NO 1-MCP | 0.56 | 0.37 | 0.31 | 0.30 | 0.39 | ||
| A-3 | 1-MCP | 0.56 | 0.21 | 0.41 | 0.34 | 0.38 | ||
| A-4 | NO 1-MCP | 0.68 | 0.37 | 0.66 | 0.45 | 0.54 | ||
| A-4 | 1-MCP | 0.68 | 0.37 | 0.53 | 0.44 | 0.51 | ||
| A-5 | NO 1-MCP | 0.64 | 0.63 | 0.74 | 0.47 | 0.62 | ||
| A-5 | 1-MCP | 0.64 | 0.58 | 0.73 | 0.68 | 0.66 | ||
| A-6 | NO 1-MCP | 0.43 | 0.53 | 0.70 | 0.73 | 0.60 | ||
| A-6 | 1-MCP | 0.43 | 0.47 | 0.55 | 0.46 | 0.48 | ||
| A-7 | NO 1-MCP | 0.38 | 0.34 | 0.89 | 0.31 | 0.48 | ||
| A-7 | 1-MCP | 0.38 | 0.38 | 0.51 | 0.46 | 0.43 | ||
| A-8 | NO 1-MCP | 0.56 | 0.54 | 0.59 | 0.62 | 0.58 | ||
| A-8 | 1-MCP | 0.56 | 0.49 | 0.52 | 0.49 | 0.52 | ||
| A-9 | NO 1-MCP | 0.29 | 0.00 | 0.00 | 0.14 | 0.11 | ||
| A-9 | 1-MCP | 0.29 | 0.23 | 0.26 | 0.19 | 0.24 | ||
| A-10 | NO 1-MCP | 0.64 | 0.43 | 0.59 | 0.59 | 0.56 | ||
| A-10 | 1-MCP | 0.64 | 0.50 | 0.48 | 0.44 | 0.52 | ||
| A-11 | NO 1-MCP | 0.47 | 0.50 | 0.42 | 0.38 | 0.44 | ||
| A-11 | 1-MCP | 0.47 | 0.41 | 0.43 | 0.38 | 0.42 | ||
| A-12 | NO 1-MCP | 0.47 | 0.46 | 0.35 | 0.35 | 0.41 | ||
| A-12 | 1-MCP | 0.47 | 0.35 | 0.29 | 0.31 | 0.36 | ||
| A-13 | NO 1-MCP | 0.86 | 0.55 | 0.69 | 0.51 | 0.65 | ||
| A-13 | 1-MCP | 0.86 | 0.27 | 0.72 | 0.61 | 0.62 | ||
| A-14 | NO 1-MCP | 0.30 | 0.44 | 0.30 | 0.32 | 0.34 | ||
| A-14 | 1-MCP | 0.30 | 0.35 | 0.27 | 0.24 | 0.29 | ||
| AVG | ALL | 0.56 | 0.42 | 0.52 | 0.45 | 0.49 | ||
| MIN | ALL | 0.29 | 0.00 | 0.00 | 0.14 | 0.11 | ||
| MAX | ALL | 0.87 | 0.68 | 0.89 | 0.82 | 0.77 | ||
| AVG | No 1-MCP | NA | 0.45 | 0.54 | 0.46 | 0.50 | ||
| AVG | 1-MCP | NA | 0.39 | 0.49 | 0.45 | 0.47 | ||
| Average all 4 Samplings | 1-MCP | no 1-MCP | Sensory Analysis Ithaca 12-4-24 (1-MCP) | |||||
| High | #>.6 | 2,5,13 | 2,5,6,13 | High | #>.6 | 2,5 | ||
| Medium | #>.4, <.6 | 1,4,6,7,8,10,11 | 1,4,7,8,10,11,12 | Medium | #>.4, <.6 | 1,6 | ||
| Low | # < 0.4 | 3,9,12,14 | 3,9,14 | Low | # < 0.4 | 9,11* | ||
| *11 actually averages medium | ||||||||
| Summary of All Acidity Data, Year 2 | ||||||||
| Total Acidity (Converter to Malic Acid), % (from 1:50 dilution) | ||||||||
| Harvest | 30D | 60D | 90D | Average | ||||
| A-1 | MCP | 0.58 | 0.33 | 0.32 | 0.29 | 0.31 | ||
| A-1 | no MCP | 0.44 | 0.48 | 0.43 | 0.45 | |||
| A-2 | MCP | 0.75 | 0.61 | 0.48 | 0.37 | 0.49 | ||
| A-2 | no MCP | 0.63 | 0.47 | 0.34 | 0.48 | |||
| A-3 | MCP | 0.67 | 0.58 | 0.52 | 0.62 | 0.57 | ||
| A-3 | no MCP | 0.65 | 0.54 | 0.59 | 0.59 | |||
| A-4 | MCP | 0.81 | 0.52 | 0.51 | 0.54 | 0.52 | ||
| A-4 | no MCP | 0.59 | 0.47 | 0.37 | 0.48 | |||
| A-5 | MCP | 0.72 | 0.72 | 0.63 | 0.58 | 0.64 | ||
| A-5 | no MCP | 0.60 | 0.68 | 0.66 | 0.65 | |||
| A-6 | MCP | 0.63 | 0.43 | 0.42 | 0.40 | 0.42 | ||
| A-6 | no MCP | 0.46 | 0.36 | 0.32 | 0.38 | |||
| A-7 | MCP | 0.84 | 0.52 | 0.66 | 0.46 | 0.55 | ||
| A-7 | no MCP | 0.64 | 0.59 | 0.51 | 0.58 | |||
| A-8 | MCP | 0.46 | 0.35 | 0.29 | 0.31 | 0.32 | ||
| A-8 | no MCP | 0.28 | 0.26 | 0.27 | 0.27 | |||
| A-9 | MCP | 0.62 | 0.55 | 0.42 | 0.36 | 0.44 | ||
| A-9 | no MCP | 0.34 | 0.35 | 0.32 | 0.34 | |||
| A-10 | MCP | 0.48 | 0.51 | 0.51 | 0.49 | 0.50 | ||
| A-10 | no MCP | 0.54 | 0.37 | 0.47 | 0.46 | |||
| A-11 | MCP | 0.82 | 0.59 | 0.74 | 0.40 | 0.58 | ||
| A-11 | no MCP | 0.62 | 0.70 | 0.59 | 0.64 | |||
| A-12 | MCP | 0.88 | 0.77 | 0.64 | 0.64 | 0.68 | ||
| A-12 | no MCP | 0.61 | 0.45 | 0.70 | 0.59 | |||
| A-13 | MCP | 0.66 | 0.49 | 0.40 | 0.41 | 0.43 | ||
| A-13 | no MCP | 0.50 | 0.48 | 0.45 | 0.48 | |||
| A-14 | MCP | 0.71 | 0.57 | 0.51 | 0.43 | 0.50 | ||
| A-14 | no MCP | 0.53 | 0.45 | 0.47 | 0.48 | |||
| A-15 | MCP | 0.39 | 0.24 | 0.21 | 0.18 | 0.21 | ||
| A-15 | no MCP | 0.14 | 0.14 | 0.17 | 0.15 | |||
| A-16 | MCP | 0.95 | 0.88 | 0.70 | 0.69 | 0.76 | ||
| A-16 | no MCP | 0.56 | 0.51 | 0.62 | 0.56 | |||
| A-17 | MCP | 0.49 | 0.43 | 0.50 | 0.45 | 0.46 | ||
| A-17 | no MCP | 0.38 | 0.35 | 0.40 | 0.38 | |||
| A-18 | MCP | 0.32 | 0.40 | 0.36 | 0.24 | 0.33 | ||
| A-18 | no MCP | 0.29 | 0.36 | 0.36 | 0.34 | |||
| A-19 | MCP | 0.52 | 0.59 | 0.43 | 0.53 | 0.52 | ||
| A-19 | no MCP | 0.41 | 0.33 | 0.36 | 0.37 | |||
| A-20 | MCP | 0.49 | 0.29 | 0.35 | 0.27 | 0.30 | ||
| A-20 | no MCP | 0.30 | 0.31 | 0.22 | 0.28 | |||
| A-21 | MCP | 0.57 | 0.28 | 0.32 | 0.43 | 0.34 | ||
| A-21 | no MCP | 0.35 | 0.31 | 0.26 | 0.31 | |||
| A-22 | MCP | 0.61 | 0.32 | 0.37 | 0.27 | 0.32 | ||
| A-22 | no MCP | 0.30 | 0.56 | 0.29 | 0.38 | |||
| Average all 4 Samplings | 1-MCP | no 1-MCP | Sensory Analysis Ithaca 12-8-25 (each set of samples -1-MCP & +1-MCP) | |||||
| High | #>.6 | 5,12 | 5,11 | High | #>.6 | 5 | ||
| Medium | #>.4, <.6 | 2,3,4,6,7, 9-11, 13, 14, 16,17,19 | 1-4,7,10,12-14,16 | Medium | #>.4, <.6 | 10 | ||
| Low | # < 0.4 | 1,8,15,18, 20-22 | 6,8,9,15,17-22 | Low | # < 0.4 | 15 | ||
We had similar results in both years of the project, with a few exceptions. One pertains to the percentage of samples compared across both years as far as acid levels. Across both years, the percentage of medium samples was about the same, ~50%. However, the percentage of high acid samples was much less in year 2 (9% in 2025 vs. 25% in 2024). In addition, the percentage of low acid samples was much higher in year 2 (39% in 2025 vs. 25% in 2024). A possible theory for the overall lower acid content in 2025's samples could be attributed to a significant drought experienced across our region. This resulted in lower quality fruit. This lower quality fruit likely had less of a brix:acid balance then healthier fruit, such as in 2024.
We set out what we wanted to do and what we had outlined in the funded project proposal. We were able to successfully measure malic acid levels in a wide range of Honeycrisp samples. In addition, they divided up nicely into three acid categories. As expected, the acidity declined over time. We were able to observe some differences in planting systems and crop load that probably can be correlated with acid levels.
One surprise from the research was that there were no significant differences in consumer liking between the 1-MCP-treated fruit and the untreated samples. Chris Watkins had been recommending that Honeycrisp stored in air should be treated with 1-MCP, to maintain acidity. We now think that a 1-MCP treatment may not be needed. The Watkins lab wants to carry on further studies to validate these findings.
What is extremely exciting is that both years of the sensory analysis at the Dando lab at Cornell yielded the same results- positive correlation with fruit acid levels and overall liking. With 75-96 tasters, the highest overall liking scores were from the high acid category samples. followed by the medium, and then the low. Grad student Rogelio Cianchini Diaz (Dando lab) is writing a paper and presenting a poster on our research.
As mentioned above, one of the things that we learned during both years of this two year project is that Honeycrisp orchard blocks from high density planting systems (like tall spindle or super spindle) that have very uniform trees and good pruning and good crop loads, have more even maturity (which is not something new) tend to have higher acid levels. In contrast, trees with variable crop loads or heavy crop loads and less dwarfing rootstocks (center leader planting systems) tend to have lower acid levels at harvest. There were some samples that retained their same acid level categories throughout the 90 day period, but all declined over time.
One of the recommendations I will make to growers is to try to prune as uniformly and narrowly as possible and to thin the trees to the correct crop load, which varies by rootstock, planting system, in row spacing, and between row spacing. If growers could increase the number of Honeycrisp orchard blocks that are bumped up to the high acid category by 5% (a conservative estimate) on a consistent basis, I estimate consumer liking would increase two-fold, to 10%. If this translates to a 10% increase in repeat sales, the entire industry in WNY would benefit. To match the demand, 10% increase in production at current acreage estimates would be approximately 500 acres of high quality fruit. At ~$500/bin yielding ~ 50 bins/acre would bring in additional revenue of $12.5 million back to the growers.
Marketers, packers, and storage operators would benefit immensely as well. More higher acid (quality) fruit going into storage means less waste and downgraded fruit, which saves the entire supply chain money. Increased sales are a boon to the marketers as well. However, this won't be realized unless the lion's share of storage facilities test acidity at harvest. I've reached out to all the large facilities in Western NY, and have not had much buy-in yet. Time is short at the QC portion of their operations, and I need to keep selling the benefits to get them to try the technology. Currently, the second largest sales desk/grower/packer/storage facility is using the DA meter in the trial phase. It is my hope that Lake Ontario Fruit, Inc., the partners on this project, will make time to do the acid testing on their incoming fruit. Using this data as a decision tool to decide the storage length and marketing plans of each individual block should be extremely useful. I'll continue to share these results and recommendations in presentations and publications, and also in in-person visits to growers, packers, marketers, and storage facilities.
Education & outreach activities and participation summary
Participation summary:
I’m excited to confirm in two years of testing in Western NY, that there is correlation of malic acid levels (what we call acidity) in Honeycrisp to eating quality confirmed by sensory analysis (i.e., taste testing) by Cornell students. In both years, the samples with the highest acid levels had the best eating quality in this blind, scientifically designed testing.
Please see this New York Fruit Quarterly article for more info: Pub. 1 - Kahlke et al Acidity of Honeycrisp.pdf
There are many quality indicators that can be measured to help gauge apple quality, at least at harvest. These included internal ethylene concentration, firmness, brix (% soluble solids), and the starch pattern test. Most of these are not good indicators or predictors for Honeycrisp (HC) quality at the consumer level. I believe acidity in the fruit is a major key to put quality HC in the marketplace.
Prior to this year's harvest, I began reaching out to packinghouses in my region. I am trying to convince them that it would be beneficial for them to begin tracking blocks of HC (at the harvest/QC stage and beyond). This would slow down the already rushed process of testing when receiving loads of fruit, but the testing is relatively simple, and I have offered to show folks how to do the testing. All data will be exclusive to the packinghouses that collect it but when aggregated (anonymously), I aim to continue to show the apple industry in NY that the highest acid HC should be stored longer and marketed later in the season when many packers have run out of their HC. These higher acid fruit should still have excellent eating quality after 6-8 months of storage.
Learning Outcomes
Adoption of the testing and subsequent use of acidity levels to aid in determining Honeycrisp storage length and marketing plans has been limited this far. I have gotten the 2nd largest sales desk/grower/packer/storage facility to begin using the DA meter in the trial phase. They are currently studying the block by block trends of these malic acid levels. It is my hope that they will soon translate this data into a decision tool. Block history, crop load, bitter pit incidence, and other factors go into the decision of storage length and marketing plans. Acid levels should also factor into this decision.
I have discussed this research with nearly every grower, crop consultant, packer, marketer and storage operator that I come in contact with. At the very least, I've raised awareness that the acidity in Honeycrisp is one of the keys to eating quality. It is my hope that others will purchase a brix/acid meter and begin testing and tracking Honeycrisp malic acid levels. I am even offering training in the use of the meter. It is very easy to use and relatively quick once someone has run a few samples in a row.
More to follow.
Project Outcomes
The primary change in behavior is the use of the brix:acid meter in the trial phase by the second largest sales desk/grower/packer/storage facility. They are excited by my results and hope to see the same for their operation.
Regarding the methodology and results there were few challenges. The only one I recall was the crunch of harvesting the samples, testing the acid levels, getting them into storage and performing the maturity testing. As with most other varieties, Honeycrisp is harvested in a narrow window. Thus a large proportion of this work was performed over the period of less than two weeks. However, I have worked with Dr’s Chris Watkins and Robin Dando on proposal development and would not change any of the methodology.
We certainly answered the questions that we set out to study- namely is there a range of malic acid levels in Honeycrisp that we can divide into categories, and does higher acid correlate with higher consumer acceptance. Both of these turned out to be true.
As mentioned in other sections, I am disappointed thus far by the lack of industry buy in. However, I think this has the potential to be very impactful and will not stop trying to state the benefits and to get some facilities to try it with hopefully pressure from their growers and crop consultants.
I think the additional work that needs to be done on this project is training storage and packing facilities on the use of the meter, and encouraging them to follow through with packout data and the possibility of repeat sales with the highest acid blocks.
I feel that other Honeycrisp growing regions of New York would benefit from this research, namely the Champlain Valley and the Hudson Valley. These are the other two large apple growing regions in New York. In addition, other Eastern states could benefit as well such as Michigan and Pennsylvania. We are aware that our growing conditions and our climate in the East produces better quality Honeycrisp than the West. This could be another way to gain an advantage.