Final report for OW15-008
Project Information
The long-term goal of this project is to improve nitrogen fertilizer management on farms implementing biologically-intensive soil-building practices to grow diverse crops. Cover cropping and organic amendments contribute to the soil’s fertility beyond the year they were incorporated by building active organic matter. Through this participatory research we will be able to place dollar values on the importance of optimizing soil fertility. Growers will be able to more accurately estimate nitrogen mineralization from soil organic matter and adjust fertilizer applications up or down accordingly. Extensive outreach efforts will be used to directly reach over 200 growers in Washington and Oregon.
- Assist producers with fertilizer applications through pre-season soil tests that predict nitrogen mineralization.
- Evaluate the net economic return of increasing amounts of organic fertilizer applied before planting across geographically dispersed farms with differing soil quality parameters.
- Assist producers with in-season soil tests that allow adjustment to fertility during the growing season.
- Assist producers in developing nitrogen management plans to increase profitability while protecting water quality.
Cooperators
Research
Field Trials: An experiment to assess nitrogen contribution from organic matter and the economic benefit of five different rates of fertilizer application was performed with 5 organic farms. Two farm sites were located near Royal City in central Washington (Sites 1-2) with a semi-arid climate. Three farm sites were located in western Washington (Sites 3-5) with a maritime climate.
Fertilizer rates were determined through interviews with cooperating farmers and by consulting broccoli production guides. In 2016, organic feather meal fertilizer (11%N, 0%P, 0%K) was applied at 0, 60, 120, 180, and 240 lbs N/acre in a randomized complete block design with 3 replications at each farm. In 2017, 2 additional N rates were added: 360 and 480 lbs N/acre.
Certified organic broccoli transplants were prepared at a central location and transplanted following ground preparation and fertilizer application. Transplanting occurred mid-April in central WA and mid-May in western WA in 2016 and 2017. Plant spacing was determined by individual farmers and was similar at sites 1,2,3, and 5. Site 4, the smallest farm planted broccoli more densely in 2016. Weather stations were set up at each site to record air temperature for calculation of growing degree days.
Soil Analyses: Soils were sampled before planting broccoli and analyzed for bulk density (BD), water-holding capacity, organic matter (OM), total C, mineral-associated C, particulate organic C, nitrate-N, P, K, and pH. Soil nitrate-N was more intensively sampled by sampling at 0 and 28 days after transplant (DAT) and at harvest (between 71 and 91 DAT). In addition to laboratory analysis, soil nitrate was also analyzed with a field nitrate testing kit (EM Quant™). Nitrogen mineralization predictive tests were done for soils collected in spring before planting. Predictive tests included the Haney test (performed at Ward Labs, Kearney, WA) which includes both 24-hr CO2 respiration (Solvita™ test) and predicted available nitrogen calculated from Solvita™ and weak acid extraction of mineral nitrogen. Other predictive tests were 42-day aerobic nitrate (NO3) mineralization at 22 and 35 ◦C (incubated soils sampled at 0, 7, 21, and 42 days), and 7-day anaerobic ammonium (NH4) mineralization at 40◦C.
Crop Yield and N uptake: Marketable broccoli yield was taken from each plot. Additionally, three adjacent broccoli plants from each replication of each treatment were destructively harvested and combined into a single sample and analyzed for biomass, total N and total C.
Statistical Analysis and Interpretation: The average of 3 field replications was calculated for bulk density, basic soil analyses, Haney tests, 7-day anaerobic NH4 incubation, and seasonal soil NO3 . The aerobic NO3 mineralization rate (lbs NO3 day-1) was calculated by attempting to fit a linear to plateau model with nitrate mineralization versus days of incubation and averaging the rate across replications.
Soil physical properties, days to first harvest, and plants per acre are shown in Table 1. Site 5 was a silt loam while the other sites were sandy loam, fine sandy loam, or very fine sandy loam. Soil organic matter ranged from 2.0% to 11.3% and pH ranged from 5.8 to 7.8 (Table 2). Organic matter was higher and pH was lower in the soils from the western Washington maritime climate than in the soils from the semi-arid climate in central Washington.
Table 1. Climate, soil properties, and plant density at organic farm sites in Washington State, 2016.
|
Site |
Climate |
GDD7.2 to first harvest |
Days to first harvest |
Soil Type |
BD g cm-3 |
Plants acre-1 |
|
16.1 |
Semi-arid |
701 |
71 |
Royal very fine sandy loam |
1.10 |
14,520 |
|
16.2 |
Semi-arid |
~7001 |
71 |
Taunton fine sandy loam |
1.24 |
14,520 |
|
16.3 |
Maritime |
652 |
71 |
Yelm fine sandy loam |
0.93 |
16,228 |
|
16.4 |
Maritime |
679 |
72 |
Alderwood gravelly sandy loam |
0.89 |
23,522 |
|
16.5 |
Maritime |
802 |
79 |
Nooksack silt loam |
1.06 |
16,228 |
|
17.1 |
Semi-arid |
|
91 |
Royal very fine sandy loam |
1.10 |
14,520 |
|
17.2 |
Semi-arid |
|
91 |
Taunton fine sandy loam |
1.24 |
14,520 |
|
17.4 |
Maritime |
|
81 |
Alderwood gravelly sandy loam |
0.89 |
15,125 |
1The weather station at Site 2 was compromised, but GDD were likely similar to Site 1. GDD7.2=Growing Degree Days with base temperature of 7.2 C. There was no harvest from sites 17.3 or 17.5 in 2017.
Table 2. Basic soil analyses from each site prior to planting.
|
Site |
pH |
NO3-N mg/kg |
P mg/kg |
OM % |
Total Org C % |
Organic C (Mg ha-1) |
POM-C (Mg ha-1) |
C:N POM |
|
16-1 |
7.7 |
3.2 |
86.9a |
2.8 |
1.32 |
25.7 |
11.7 |
8.4 |
|
17-1 |
7.8 |
3.1 |
140 |
2.7 |
1.53 |
22.1 |
9.3 |
8.2 |
|
16-2 |
7.8 |
1.1 |
18.9a |
2.0 |
1.18 |
21.9 |
7.5 |
7.4 |
|
17-2 |
7.7 |
4.7 |
41 |
2.2 |
1.16 |
22.2 |
6.5 |
8.0 |
|
16-3 |
6.0 |
3.0 |
206.0b |
7.5 |
5.51 |
78.0 |
24.1 |
13.3 |
|
17-3 |
6.2 |
4.4 |
216 |
11.3 |
5.62 |
79.7 |
44.2 |
11.4 |
|
16-4 |
7.1 |
6.2 |
102.9b |
7.7 |
4.89 |
66.3 |
22.3 |
14.6 |
|
17-4 |
6.2 |
7.7 |
143 |
10.1 |
5.28 |
71.6 |
36.3 |
12.5 |
|
16-5 |
5.8 |
3.0 |
25.2b |
3.5 |
1.80 |
30.2 |
6.2 |
10.1 |
|
17-5 |
7.5 |
2.3 |
51 |
3.5 |
1.87 |
29.1 |
5.2 |
10.7 |
aOlsen P test, bBray P test, cOlsen K test, dNH4OAC K test
Tests to predict N mineralization varied slightly in their ranking of the soil sites. The Haney test, Solvita test, and 7-day anaerobic tests all predicted greater N mineralization from sites three and four in both years (16.3, 16.4, 17.4, 17.3). The ranking of sites with 45 d aerobic tests were similar, but site 1 was also identified as having potentially high N mineralization (Table 3).
Table 3. Results of nitrogen mineralization predictive tests.
|
|
Haney Tests |
45-day aerobic incubation, 0-6 inches |
7-day anaerobic incubation, 0-6 inches |
||
|
|
Solvita CO2-C day-1 |
Predicted N min lbs acre-1 |
NO3 lbs a-1 day-1 |
NH4 mg kg soil-1 |
|
|
Site |
22C |
35C |
40 C |
||
|
16.1 |
15.3 |
13.2 |
1.0 |
2.2 |
39.2 |
|
16.2 |
22.5 |
10.8 |
1.2 |
2.2 |
53.6 |
|
16.3 |
153.3 |
71 |
1.7 |
4.9 |
108.0 |
|
16.4 |
70.9 |
54.2 |
1.1 |
2.2 |
97.3 |
|
16.5 |
39.9 |
18.6 |
0.5 |
1.6 |
7.5 |
|
17.1 |
19.4 |
16.4 |
1.6 |
2.7 |
54.4 |
|
17.2 |
24.2 |
21.9 |
1.6 |
2.3 |
57.6 |
|
17.3 |
114.4 |
48.2 |
1.6 |
4.2 |
86.1 |
|
17.4 |
148.7 |
51.0 |
1.9 |
3.8 |
105.2 |
|
17.5 |
49.9 |
16.8 |
1.2 |
2.3 |
36.9 |
In 2016, broccoli transplants in several plots at Site 1 were completely lost to rodent damage, so Site 1 data was not included in above ground biomass or marketable yield analyses. Similarly, harvests at sites 3 and 5 were lost in 2017. In 2016, fertilizer rate had a significant effect (p<0.05) on above ground biomass at Sites 2 and 4, but not Site 3 or 5 (Figure 1). In 2017, fertilizer rate significantly effected above ground biomass at all sites where harvest was possible. Fertilizer rate significantly affected marketable weight at all sites over both years (p<0.05; Figure 2).
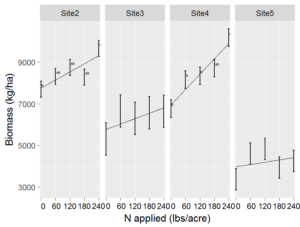
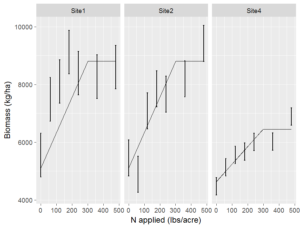
Figure 1. Above ground biomass with different N rates in 2016 (left) and 2017 (right).
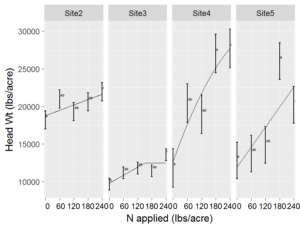
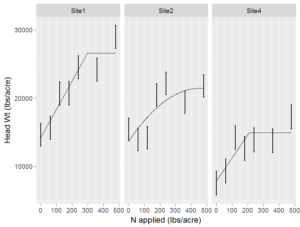
Figure 2. Market broccoli weight with different N rates in 2016 (left) and 2017 (right).
A linear to plateau model described the effect of fertilizer increase on market head weight in 2 of 4 sites analyzed in 2016. The other 2 sites did not plateau and only a linear model could be fit. In 2017, when 2 additional fertilizer rates were included, a linear to plateau model fit the 3 sites where there was a measurable harvest. Plateau N levels ranged from 152 to 457 lbs N / acre.
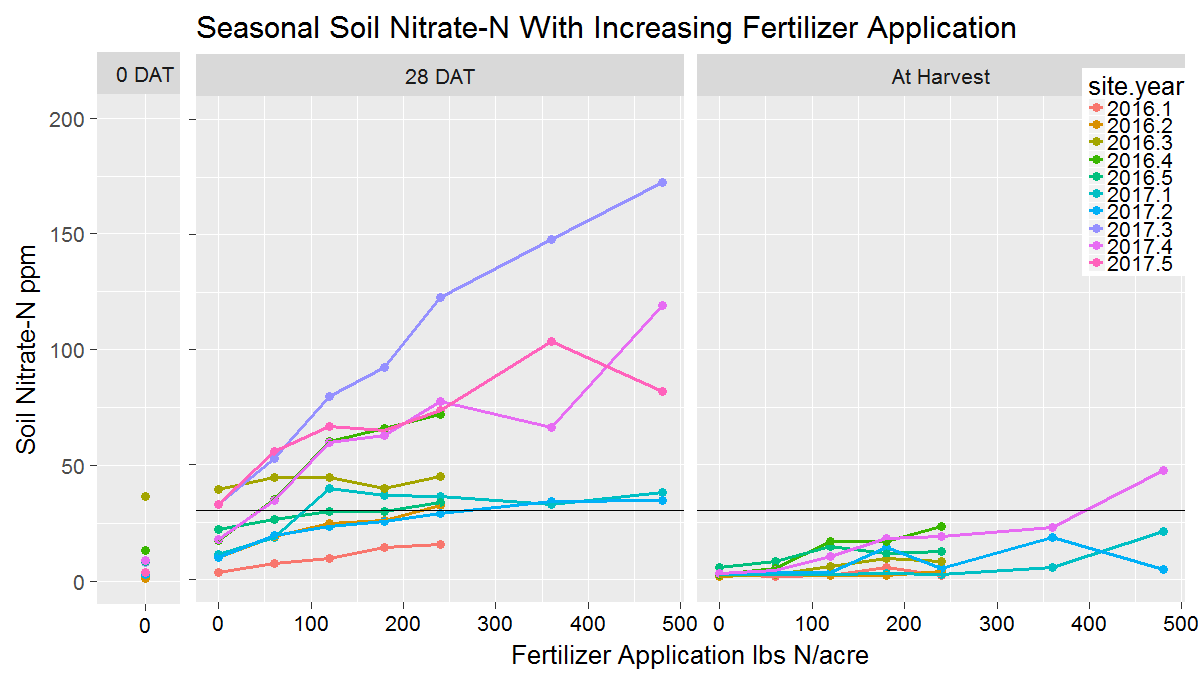
Fall soil nitrate levels are another indication of appropriate nitrogen application rate; leaving excess nitrate in the soil after harvest can degrade water quality. Soil nitrate at 30 ppm or greater is considered high and equates to about 105 lbs NO3-N a-1 . Only one site had fall soil nitrate levels above this level and this occurred at the highest rate of N application (480 lbs N/acre; Figure 3).
Research outcomes
Education and Outreach
Participation summary:
Presentations given include:
Collins, D.P., A. Bary. 2017. Optimizing nitrogen management on organic and biologically-intensive farms. Soil Science Society of America. [60 people, likely researchers and extension professionals, also live streamed online to at least 100 (estimate 50% farmers).]
Collins, D.P. 2016. Optimizing nitrogen management on organic and biologically-intensive farms. Proceedings of the 7th National Small Farms Conference. Virginia Beach, VA. [20 professionals]
Collins, D.P. 2017. Optimizing nitrogen management on organic and biologically-intensive farms. Southeast Alaska Farmers Summit, Haines, AK. Invited Speaker.[40 professionals, 40 farmers]
Collins, D.P. 2017. Optimizing nitrogen management on organic and biologically-intensive farms. OSU Farm Fair, Hermiston, OR. Invited Speaker. [10 professionals, 20 farmers]
Collins, D.P. 2016. Optimizing nitrogen management on organic and biologically-intensive farms. Tilth Producers of Washington Annual Conference. Wenatchee, WA. Invited Speaker. [10 prof 70 farmers]
Collins, D.P. 2017. Optimize nitrogen management with organic amendments and soil building. Focus on Farming, Monroe, WA. Invited Speaker. [10 professionals, 20 farmers]
3 Workshops were given focusing on quick nitrate tests as a tool for mid-season nitrogen evaluation.
May 8, 2018 – Presentations in Kitsap and Clallam counties (2 different workshops). 5 professionals, 49 farmers
May 19, 2017 – Presentation in Okanagan County. 15 farmers.
A journal publication focusing on the research results and an extension publication focusing on the quick nitrate tests are in preparation.
Education and Outreach Outcomes
The quick nitrate test that was evaluated as part of this project is a promising method for guiding mid-season nitrogen applications. Also, continuing research into pre-plant nitrogen mineralization predictive tests will be important to refine their use and undertand their potential.
Organic matter, cover crops, mineralization
Compost, organic fertilizer, and amendments.
Quick nitrate testing for mid-season nitrogen application