Final report for OW20-356
Project Information
Beekeepers in the United States have reported high colony losses for more than a decade. Among many stress factors experienced by honey bees, beekeepers report queen failure as one of the highest contributors to colony loss. Beekeepers can effectively reduce the rates of colony mortality in their apiaries by replacing failing queens, which are available through queen producers. Beekeepers assess their colonies in January and February in preparation for almond pollination services in California. Accompanied by high colony losses, beekeepers may struggle to fill their pollination contract commitments with healthy queenright colonies.
Reports on management practices suggest that the rate of queen replacement by U.S. beekeepers has drastically increased in recent years. This heavy increase in demand for new queens warrants exploring solutions to increase queen supply. One available technique involves overwintering queens in "bank" colonies. For this technique, beekeepers purchase late-season queens and suspend them inside a single bank colony during the winter. After winter, beekeepers can use these queens to replace failing queens in colonies prepared for almond pollination services or introduce them into newly divided colonies after the almond bloom to offset winter colony losses.
We proposed to investigate the technique of overwintering honey bee queens in bank colonies with Oregon beekeepers that pollinate almonds in California. We overwintered queens in bank colonies with three commercial beekeeping operations (September 2020 – January 2021). Bank colonies were assessed for strength (frames of bees, frames of brood), amount of stored honey, and pest and pathogen levels (Varroa mites, Nosema spp.). We sampled queens from these bank colonies for morphometric and reproductive metrics and will compare results from queens confined in banks with unconfined queens from established colonies. We also introduced banked queens into new colonies at the end of the almond bloom, and their performance was assessed throughout the year alongside Hawaiian-sourced queens (March 2021 – January 2022).
We gathered feedback from producers when we presented preliminary results at several industry conferences in 2021 and 2022. Taking advice from these producers, we followed a stringent protocol for selecting bank colonies and overwintered queens in bank colonies with two different stocking rates in Western Oregon (October 2021 – January 2022 and October 2022 – January 2023). We refined our protocol in response to our survival results from banks overwintered in 2021 – 2022 and 2022 – 2023. We also described our protocol in a newly published technical guide on queen banking.
Our goal was to evaluate the technique of overwintering queens in bank colonies for beekeepers in Oregon. We posed some research questions regarding this technique: will overwintering queens in bank colonies for approximately 4-5 months effect their reproductive potential? How will these queens perform compared to the standard Hawaiian-sourced queens? What is the optimal positioning for queens inside bank colonies to maximize winter survival? We will continue evaluating this technique next winter. The following is the progress pertaining to the study:
Year 1
- We determined the percent survival rate of queens overwintered in bank colonies (n=20 queens per bank) with three commercial beekeeping operations in Oregon (September 2020 - January 2021).
- We sampled queens that overwintered in two situations: a) confined in bank colonies and b) unconfined in established colonies (January 2021). We analyzed these queens for morphology, total sperm count, and sperm viability.
- We introduced queens that overwintered in bank colonies into newly established colonies after the almond bloom in California (March 2021). We evaluated the performance of these queens throughout the year alongside Hawaiian-sourced queens (March 2021-January 2022). Performance metrics include colony acceptance, queen longevity, colony strength, brood pattern quality, and brood disease prevalence.
Year 2
- We determined the percent survival rate of queens overwintered in bank colonies of two different stocking rates (n=30 and n=60 queens per bank) in Western Oregon (October 2021 – January 2022).
- We will analyzed queens that overwintered in bank colonies of two different stocking rates for morphological traits, total sperm count, and sperm viability (February 2022).
Year 3
- We determined the percent survival rate of queens overwintered in bank colonies of two different stocking rates (n=30 and n=60 queens per bank) in Western Oregon (October 2022 – February 2023) with a modified positioning strategy for the queen banks stocked with 60 queens.
- We published a technical guide on queen banking that extensively covers this technique. The guide is free to download (see Information Products section).
Refer to the two attachments of a Gantt chart for a timeline covering all project objectives.
- .xlsx file attachment: WSARE_Gantt_Chart_xlsx
- .pdf file attachment: WSARE_Gantt_Chart_pdf
Cooperators
- - Producer
- - Producer
- - Producer
- - Producer
- - Producer
- (Researcher)
Research
Year 1 (September 2020-October 2021)
The research team (PI, co-PI, and five producers) determined necessary attributes of bank colonies based on published research findings and personal experiences. We also agreed on a bank frame design that holds 20 queens. In September and October 2021, we constructed five bank colonies with three producers, each residing in different regions of Oregon. We assessed every colony in one of the producers’ highest performing apiaries and chose five candidates to serve as bank colonies based on criteria from our discussion. We placed 20 experimental queens in each of the five bank colonies. An additional 32 colonies were assessed in the same apiary to serve as control colonies. The original queen was removed from each control colony and replaced with an experimental sister queen. Queen survival was determined in bank colonies before and after transit to California in January.
The research team actively managed the bank colonies during placement in California. The management process involved introducing two full frames of brood every two weeks. These brood frames were assessed 7-8 days later for queen cells, and all queen cells were destroyed. We recorded total frames of bees for each bank throughout the management process.
After approximately two weeks in California, we sampled queens that were confined in bank colonies and unconfined in established colonies for each beekeeping operation (n=120 total) and sent to North Carolina State University’s Honey Bee Queen and Disease Clinic and analyzed for morphology, total sperm count, and sperm viability. We successfully replaced each queen sampled from control colonies.
In March 2021, we introduced queens from bank colonies 0f two beekeeping operations (BK1 and BK2) alongside Hawaiian sourced queens into newly made colonies (n=36 per treatment group). Hawaiian-sourced queens are the solely available mated queens in the U.S. in March thus serving as the control group for our colony performance evaluation. We evaluated the performance of these colonies in June, August, October of 2021, and February 2022. Performance metrics included colony strength, brood pattern, and queen survival.
Year 2 (October 2021-September 2022)
The research team (PI, co-PI, and five producers) reconvened in the summer of 2021 to revise the selection protocol for bank colonies. The producers suggested an increase the queen stocking rate of bank colonies for the 2021-2022 winter. The team also added selection and management methods regarding low Varroa infestation levels in bank colonies. These methods included more stringent pre-screening methods for Varroa mite infestation for candidate bank colonies and applying a miticide application on bank colonies during late fall.
In October 2021, we constructed ten bank colonies with one Oregon producer and tested two different stocking rates—30 queens and 60 queens per bank (n=5 banks per stocking rate). We chose bank colonies by assessing field colonies in this producers’ highest performing apiaries in September and following our current selection criteria.
Queens survival counts were recorded periodically throughout the winter (October 2021-January 2022). The bank colonies were transported to California for almond pollination in mid-January. After approximately two weeks in California, queens were sampled from bank colonies (n=20 per treatment group) and sent to North Carolina State University’s Honey Bee Queen and Disease Clinic and were analyzed for morphology, total sperm count, and sperm viability.
Year 3 (October 2022-February 2023)
The research team (PI, co-PI, and five producers) reconvened in the summer of 2022 to revise the selection protocol for bank colonies. In 2021-2022, we found significantly higher queen mortality in queen cages positioned in the outer half of the bank frames within bank colonies that were stocked with 60 queens (GLMM, p < 0.001). To clarify, the outer 5 queen cages of each row on the bank frames were more susceptible to dying while overwintering in bank colonies. In response, we refined our protocol during the winter of 2022-2023 by overwintering 60 queens in a bank colony with two bank frames of 30 queens positioned in the centermost part of the bank frame.
In October 2022, we constructed ten bank colonies with one Oregon producer and tested two different stocking rates—30 queens and 60 queens per bank (n=5 banks per stocking rate). We chose bank colonies by assessing field colonies in this producers’ highest performing apiaries in October and following our current selection criteria.
Queens survival counts were recorded periodically throughout the winter (October 2022-February 2023). The bank colonies were transported to California for almond pollination in mid-January. The final survival count was recorded after the bank colonies were in California for approximately one week.
In 2020, bank colonies had the following attributes when the queens were introduced.
- Double-story (2 boxes) hive configuration
- 14-19 frames of bees
- Approximately 60 pounds of stored honey
- No laying queen present
- Colonies were assessed 7-8 days later for queen cells; all queen cells were destroyed
Bank colonies that were selected in 2021 and 2022 followed the same selection criteria from 2020 (see above) and also included the following:
- Colonies had sample results of 0.0-1.2% Varroa mites per 100 bees
- Colonies received an oxalic acid dribble treatment after 21 days of hosting queens, further lowering sample results to 0.0-0.4% Varroa mites per 100 bees.
Queen survival in bank colonies
Table 1 illustrates that there was wide variation in queen survival among bank colonies and beekeeping operations evaluated from 2020-2021. However, we observed high queen survival for banks during transit to California. Based on observations from January 30 – March 8 2021, all bank colonies satisfied the minimum colony strength requirement recommended for almond pollination (four frames of bees). However, not all bank colonies satisfied the average strength recommendation of eight frames of bees.
We increased our stocking rates in bank colonies to 30 and 60 queens per bank during the winters of 2021-2022 and 2022-2023. Queen survival rates in bank colonies from 2021-2022 resulted in wide variation among bank colonies for both stocking rates (Table 2). In 2021-2022, we found significantly higher queen mortality in queen cages positioned in the outer half of the bank frames within bank colonies that were stocked with 60 queens (GLMM, p < 0.001). To clarify, the outer 5 queen cages of each row on the bank frames were more susceptible to dying while overwintering in bank colonies. In response, we refined our protocol during the winter of 2022-2023 by overwintering 60 queens in a bank colony with two bank frames of 30 queens positioned in the centermost part of the bank frame. Nonetheless, queen survival rates in bank colonies from 2022-2023 resulted similarly with wide variation among bank colonies for both stocking rates (Table 3). Overall, we found that stocking rates of 30 and 60 queens per bank colony are not associated with odds of queen survival in bank colonies after accounting for winter season of this study (Logistic regression drop-in-deviance test, p = 0.325).
Table 1. Average and range of queen survival (%) in queen banks (n=20 per bank) that overwintered in three beekeeping operations in Oregon (September 2020-February 2021).
| Beekeeping Operation | Average Queen Survival (%) | Range (%) |
| BK1 | 86 | 55-100 |
| BK2 | 78 | 67-95 |
| BK3 | 34 | 0-90 |
Table 2. Average and range of queen survival (%) in queen banks that overwintered with 30 and 60 queens per bank (October 2021-February 2022). Stocking rates of 30 and 60 queens per bank colony are not associated with odds of queen survival (p = 0.325).
| Bank Colony Stocking Rate | Average Queen Survival (%) | Range (%) |
| 30 queens | 80 | 30-97 |
| 60 queens | 72 | 52-88 |
Table 3. Average and range of queen survival (%) in queen banks that overwintered with 30 and 60 queens per bank (October 2022-February 2023). Stocking rates of 30 and 60 queens per bank colony are not associated with odds of queen survival (p = 0.325).
| Bank Colony Stocking Rate | Average Queen Survival (%) | Range (%) |
| 30 queens | 82 | 70-93 |
| 60 queens | 68 | 10-93 |
Queen morphometric and reproductive metrics
We compared morphometric and reproductive metrics of queens that were a) confined in bank colonies and b) unconfined in established colonies during the 2020-2021 winter from three beekeeping operations. We found no significant differences in queen head width, thorax width, and total sperm count with banked and non-banked queens. However, queens were significantly heavier in the control group of the third beekeeping operation (BK3) than banked queens from all three beekeeping operations (Fig. 1; p<0.001). This finding provides slight evidence that queens lose weight due to the prolonged banking process. Additionally, the banked queens from BK3 had significantly lower percent sperm viability than the unconfined control group of queens from BK3 (Fig. 2, p=0.006), but the percent sperm viability among queens from BK1 and BK2 had no discernible differences. We speculate that the poor survival associated with bank colonies from BK# (Table 1) may be associated with the lower sperm viability of these banked queens.
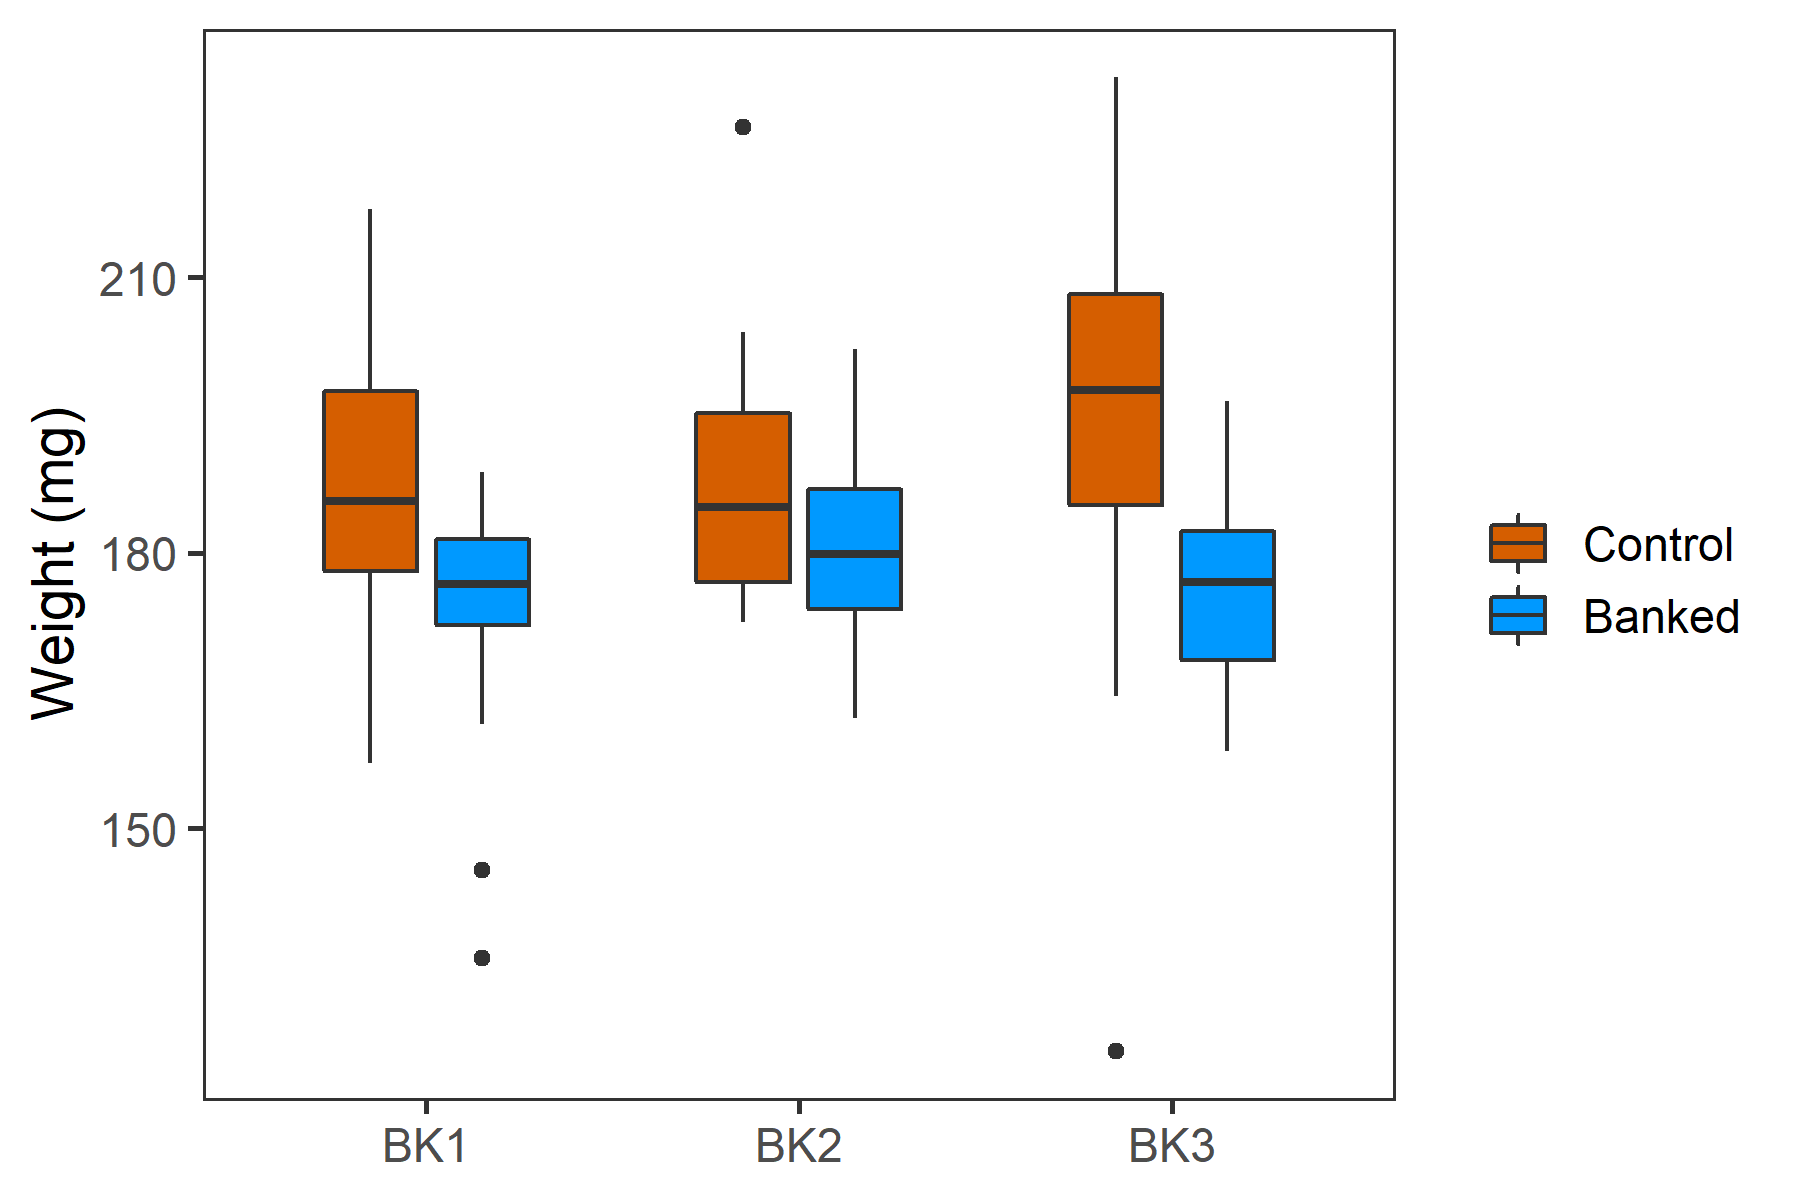
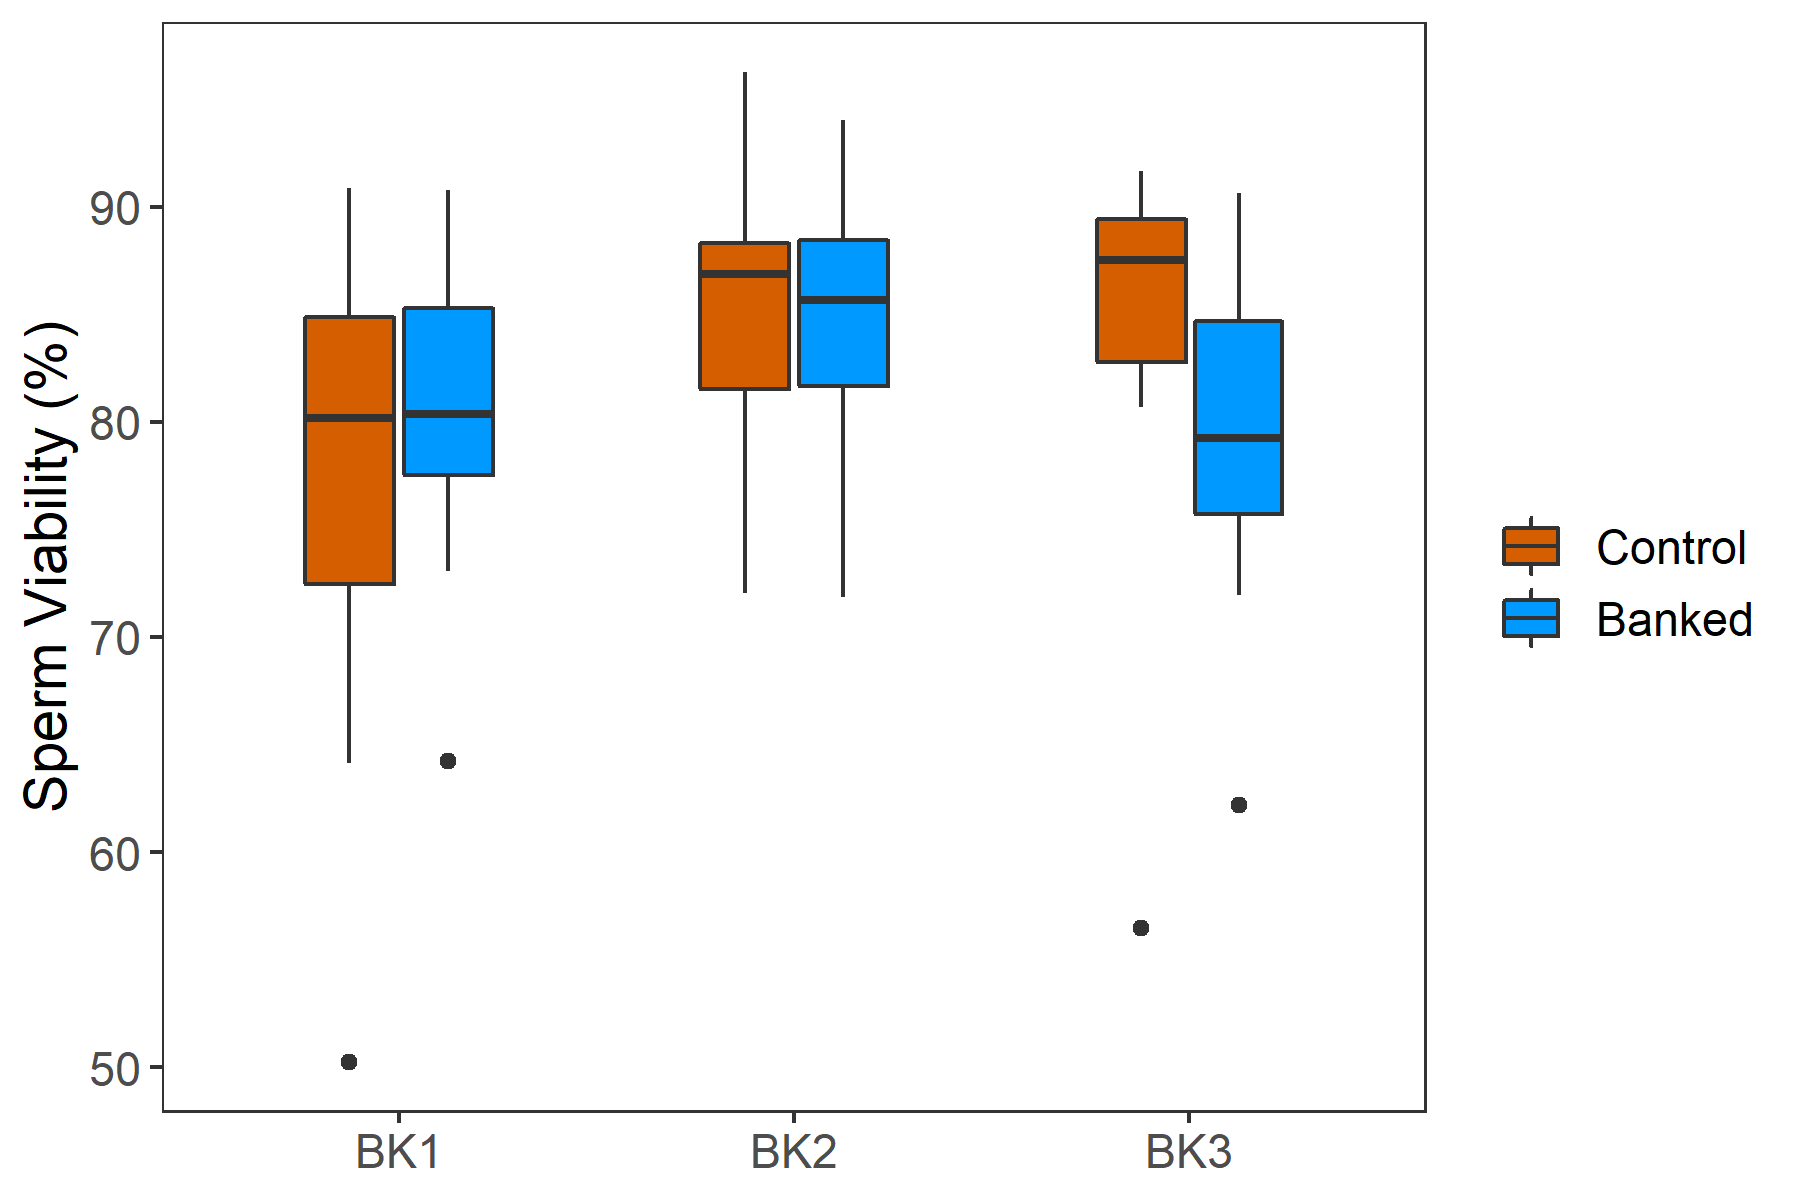
Figure 1. Queen body weight of banked and control groups. Figure 2. Percent sperm viability of banked and control queens.
Additionally, we compared morphometric and reproductive metrics of queens that were overwintered in bank colonies stocked with 30 and 60 queens each during the 2021-2022 winter season. We found no significant differences in queen head width (p= 0.851), thorax width (p = 0.903), total sperm count (p = 0.358), queen weight (p = 0.304), and percent sperm viability (p = 0.327) between the two stocking rates.
Colony performance
We evaluated the performance of colonies headed by banked queens from two beekeeping operations (BK1 and BK2) and Hawaiian sourced queens (n=36 per treatment group) in June, August, October 2021, and February 2022. Performance metrics included queen survival, brood pattern, and colony strength. There was high overall queen loss (43–56%) in all three queen source. But we found that queen source is not associated with odds of queen survival in these colonies (Fig. 3; logistic regression drop-in-deviance test, χ2 = 1.15, p = 0.63).
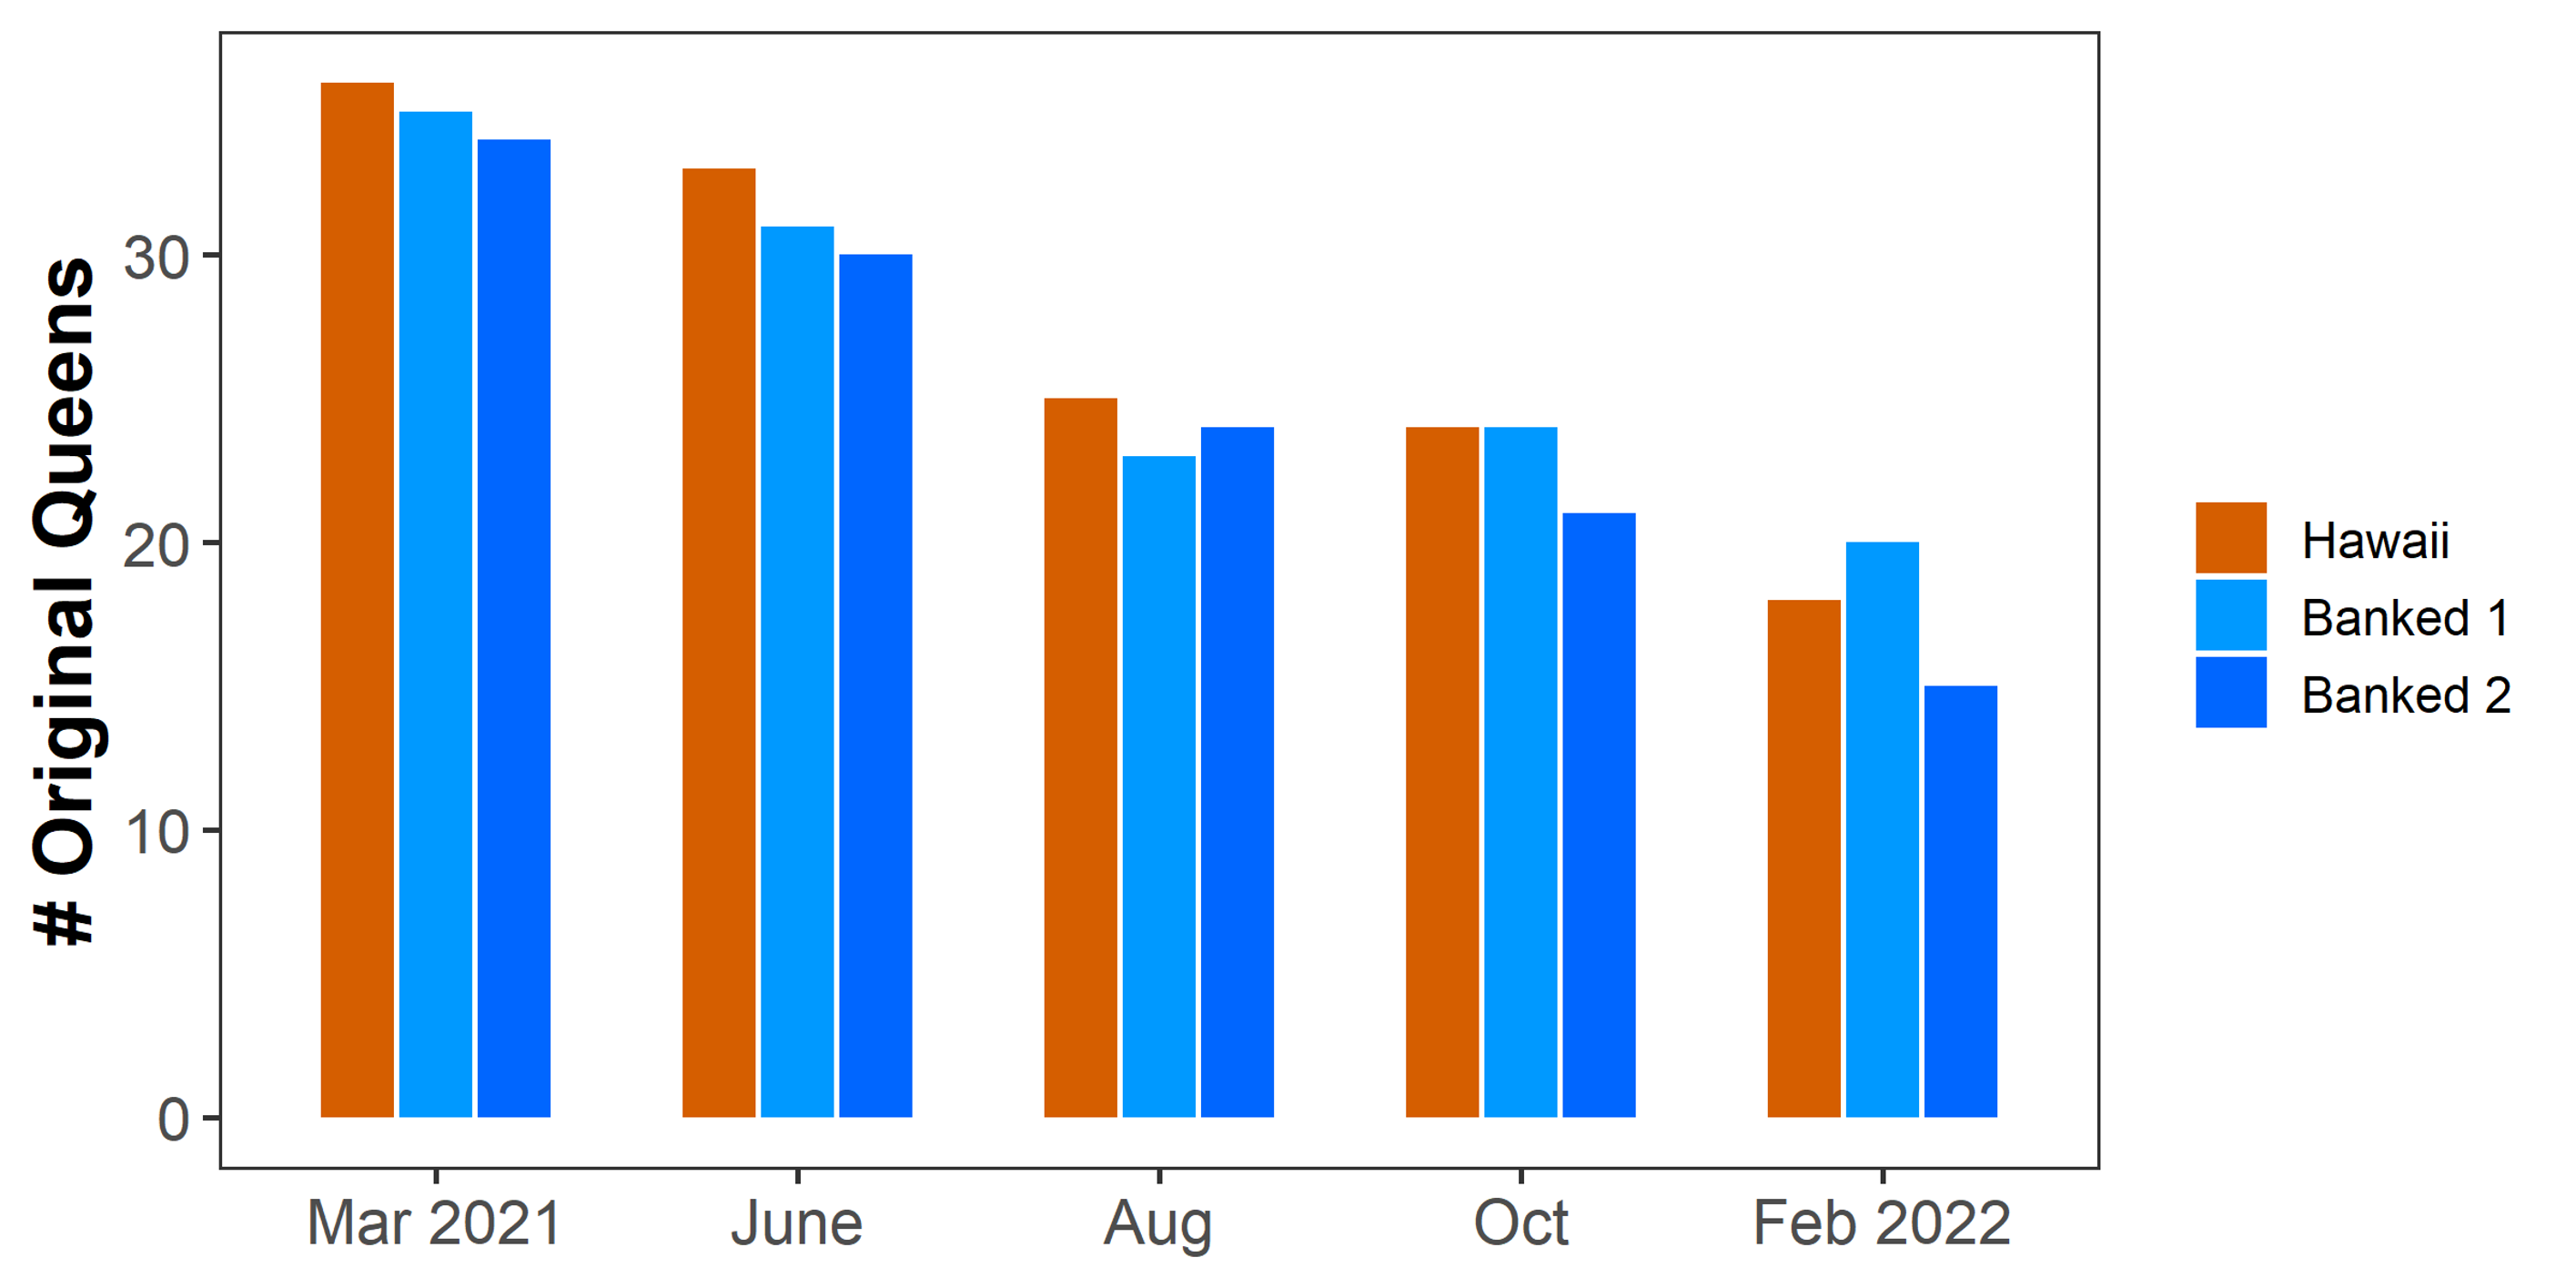
Figure 3. Queen survival of 3 different queen sources assessed in June, August, October of 2021 and February of 2022. Queen source is not associated with odds of queen survival in these colonies (p = 0.63).
We based our analyses for colony strength on typical expectations for beekeepers that participate in almond pollination. The standard almond pollination contract requires that every rented colonies maintain a minimum of 4 frames of bees in colony strength for every colony and an average of 8 frames of bees within every almond orchard location. All surviving colonies in our study had at least 4 frames of bees in February 2022. There is evidence of an association between queen source and proportion of colonies with 8 frames of bees or greater in February 2022 during almond pollination (Fig. 4; logistic regression drop-in-deviance test, χ2 = 7.43, p = 0.024). In fact, the odds of a colony headed by BK1 having 8 or more frames of bees is 6.6 times the odds of a colony headed by Hawaiian sourced queens when assessed in February. A 95% confidence interval for this multiplicative difference runs from 1.5 times to 37.1 times.
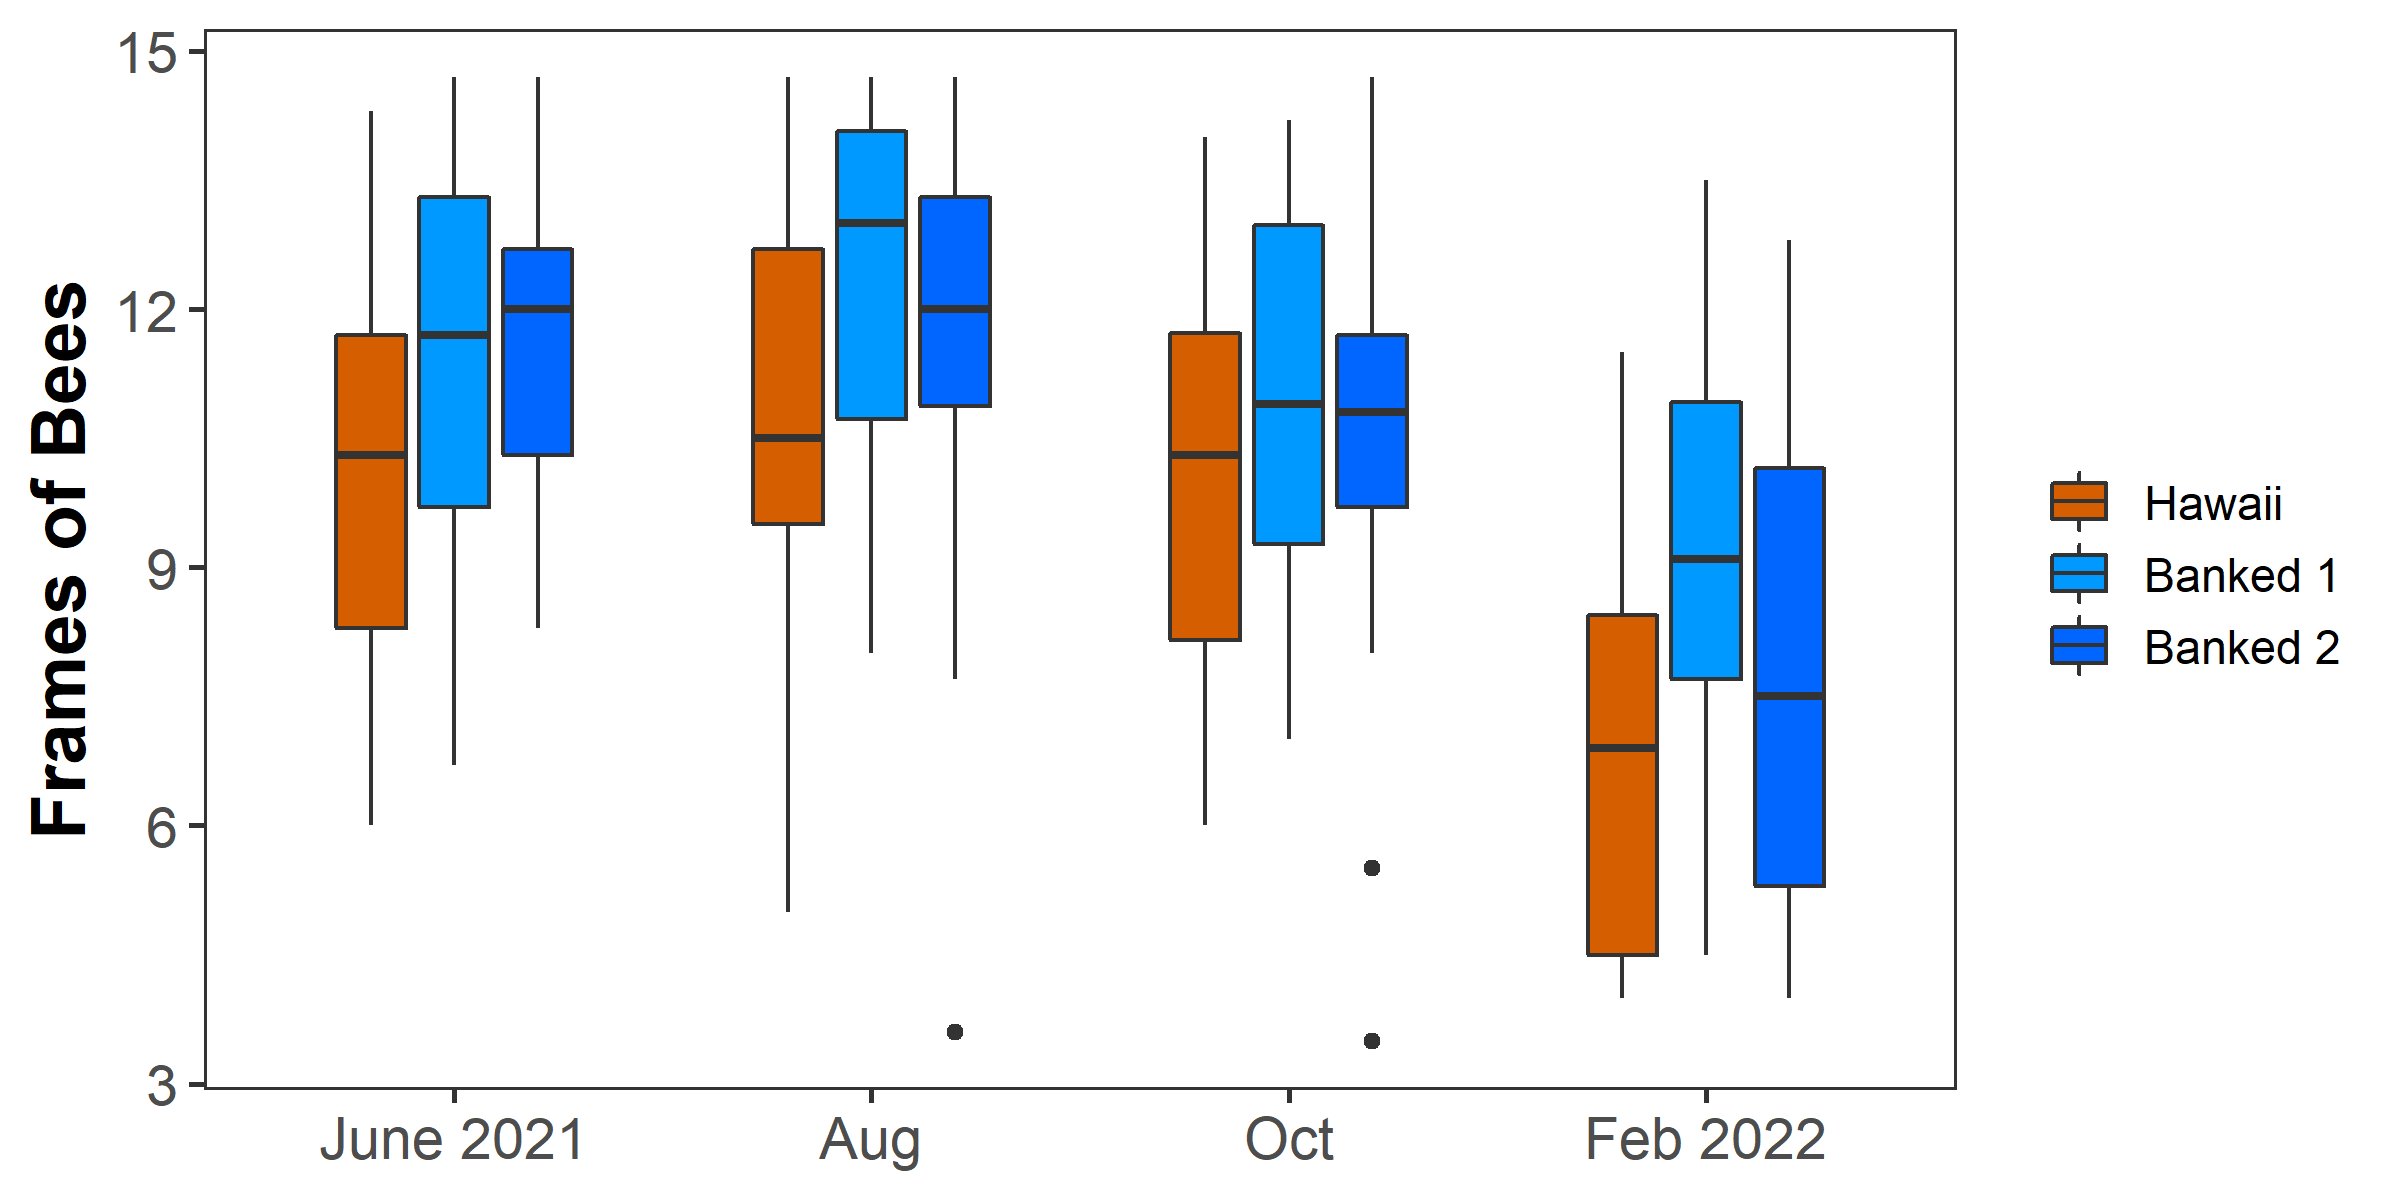
Figure 4. Colonies headed by 3 different queen sources were assessed for frames of bees in June, August, October of 2021 and February of 2022.
Research outcomes
Education and Outreach
Participation summary:
E. Topitzhofer (Co-PI) presented preliminary results of this project at the following industry conferences:
- Jun. 13, 2023: Western Apicultural Society mini-conference, videoconference. 90 attendees.
- Jan. 18, 2023: Linn Benton Beekeepers Association meeting, Corvallis, OR. 25 attendees.
- Oct. 29, 2022: Oregon State Beekeepers Association meeting, Florence, OR. 85 attendees.
- Apr. 5, 2022: Gilroy Beekeepers Association meeting, videoconference. 17 attendees.
- Oct. 24, 2021: Oregon State Beekeepers Association meeting, Florence, OR. 60 attendees.
- Jun. 1, 2021: Gilroy Beekeepers Association meeting, videoconference. 15 attendees.
- Mar. 21, 2021: British Columbia Honey Producers Association Semi-Annual Education Day, videoconference. 130 attendees.
We distributed a survey to presentation attendees and found that 50 beekeepers plan to overwinter queens in bank colonies based on the content discussed in these presentations.
We have also received positive feedback from beekeepers about our technical guide on queen banking. The analytics from our web platform show that the guide has been consistently downloaded daily since publication and has a total of 200 downloads thus far.
Education and Outreach Outcomes
Our recommendations for overwintering queens in bank colonies are described in our published technical guide. These recommendations are based on the data collected from this project. Throughout our project timeline, we made significant improvements including determining optimal queen placement in bank colonies, validating pest and pathogen pre-screening methods for candidate bank colonies, and improving bank colonies by increasing colony strength in September.