Final report for OW20-357
Project Information
The producers of vermicompost have long acknowledged the benefit of having a diverse and active soil microbial community. However, this diversity has yet to be properly quantified and is often still seen to be a black box. Next-generation DNA sequencing has allowed researchers to shed light into these black boxes and have led to large projects such as the Human Microbiome (Turnbaugh et al. 2007) and Earth Microbiome Projects (Gilbert et al. 2014). However, one of our most valuable resources in restoring soil and plant health, the microbial community of vermicompost, has been neglected and its producers left in the dark. The goals of this project are 1) develop a baseline microbial community analysis of vermicompost and teas from producers across the nation and 2) help this community better understand and quantify diversity in order to improve and increase adoption of their products. Questions such as “do inputs affect diversity,” “does vermicompost have a higher biological diversity than big box compost”, and “does education of producers and their clients help sales”? are among the many questions that can be addressed with this data. Physical and chemical analyses will also be used to evaluate vermicompost qualities to develop some understanding of how these familiar measurements relate to microbial communities. Communication through email and website will be crucial. We plan to present our results and conclusions at the 21st NC State Vermicomposting conference as well as publish in an open source journal. Education and outreach materials will be created and disseminated to producers.
The overall objective of this project is to collect and analyze a large and diverse amount of vermicompost and vermicompost tea in order to enhance the knowledge of sustainable vermicomposting practices and to bring a new technology and understanding to compost producers. The first objective will be to collect samples nationally from vermicompost producers. We aim to collect 150-250 samples from as diverse group of producers as possible. Our second key objective is to successfully sequence received samples and have the vermicomposts analyzed conventionally using Seal of Testing Assurance Program (STA) methods. DNA extraction and sequencing preparation will be performed at the Colorado School of Mines saving significant sample analysis costs over a private lab. Compost STA properties will be analyzed by Midwest Labs.
Our third objective is to use bioinformatic tools to process the sequencing data for quality control and taxonomic assignment. By comparing the communities found in samples, the metadata from the vermicompost STA analysis, and producer answered questionnaires we can begin to answer key deliverable questions. These questions include: Is there a core microbial community found in all vermicomposting samples and why might they be universally present? Do composting inputs and techniques have an effect on overall diversity? Can a metric be developed based on this survey of samples to distinguish between different vermicomposts? How do the microbial communities of vermicompost change overtime? Can we also use this technology for pathogen tracking from manure inputs? We also want to compare vermicomposts to their tea derivatives and to big box vermicomposts and compost brands.
Our fourth objective is to educate the producers and the public about microbial soil diversity and it’s benefits to sustainable agriculture. This will be accomplished by virtual interaction, face to face discussion (virtual conference), publishing in an open source journal, and providing producers with a public outreach package.
Cooperators
- - Technical Advisor (Researcher)
Research
Sample Collection: In order to collect samples from producers nationally, Zack and Kathy will attend the NC State vermicomposting conference (Oct 2019) to recruit producers. Beginning in April of 2020, sampling kit, instructions, and a questionnaire will be prepared and mailed to each participant. The questionnaire will ask producers detailed questions about their vermicomposting methods which will greatly enhance our data set. Producers with a more refined or unique process will be asked to provide unique samples or even take microscopy pictures of tea to help with the analysis. The sampling kit will include screw top tubes with ice packs for approximately 2 grams of soil. Shipping supplies and separate bag for a 200 grams sample is provided by Midwest Laboratory. Product sampling will follow a protocol as defined by Midwest Laboratory.
DNA Extraction and Sequencing: Once all samples have been received, DNA will be extracted with a MoBio Power Soil extraction kit. DNA from each sample will be quantified and then amplified with “universal” primers (Parada, Needham, and Fuhrman 2016) that amplify the 16S and 18S genes in order to identify bacterial, fungal, and eukaryotic organisms. Amplicon will be sent out for sequencing at Duke university using an Illumina MiSeq. While the taxonomic resolution of this type of sequencing reaches to the genus level it still allows for an adequate profile of diversity and general shifts in populations which can be correlated to specific variables.
Soil Analysis: The larger 200g sample of vermicompost collected from each producer will be sent to Midwest Laboratories in Omaha, NE for analysis. They will perform the “compost plus package” analysis which includes moisture, total nitrogen, phosphate, pH, total carbon, as well as other elements and nitrogen species.
Data analysis: Once the DNA sequencing and soil analyses are performed, an in-depth analysis of the microbial and soil testing data will be undertaken. The sequencing data will be processed for demultiplexing, quality control, and taxonomic identification using open source software R, QIIME2 (Bolyen et al. 2019, 2) with the SILVA database (Pruesse et al. 2007). Processing power will be provided by the systems already owned by the University and lead investigator. The final output from this program will yield an operational taxonomic unit (OTU) table in which each sample has its microbial community broken down by relative abundance as well as taxonomic tree file. This OTU table and tree file, will be merged with the soil analysis data using a sample mapping file which will allow for each sample to have both soil data and microbial community data associated with each other which is known as a biome file.
From this point, the statistical analysis can begin primarily using a combination of free and open source software including Tableau, (“Tableau” 2016) and R. A basic alpha diversity analysis will be performed using the Faith’s phylogenic diversity analysis which yield a numerical diversity measurement for each sample. This allows for sample diversity to be directly compared to one another with a logical scale. Additionally, a beta diversity analysis will be performed which allows for the visualization of how similar the microbial communities are to one another on a coordinate system. Colors and shapes can be used to highlight similar community clustering based on experimental variables in order to see which soil properties correlate to certain microbial taxa a canonical correspondence analysis will also be performed using the taxonomy data and vermicompost analysis performed by Midwest Labs. In order to better understand microbial community similarities, a core microbiome analysis will be performed. This analysis will help us understand if communities are similar between vermicomposting methods and materials. In contrast, a differential abundance analysis can be performed in order to see which taxonomies are different between different experimental conditions.
Objective 1: National Sample Collection
Initial Consultations
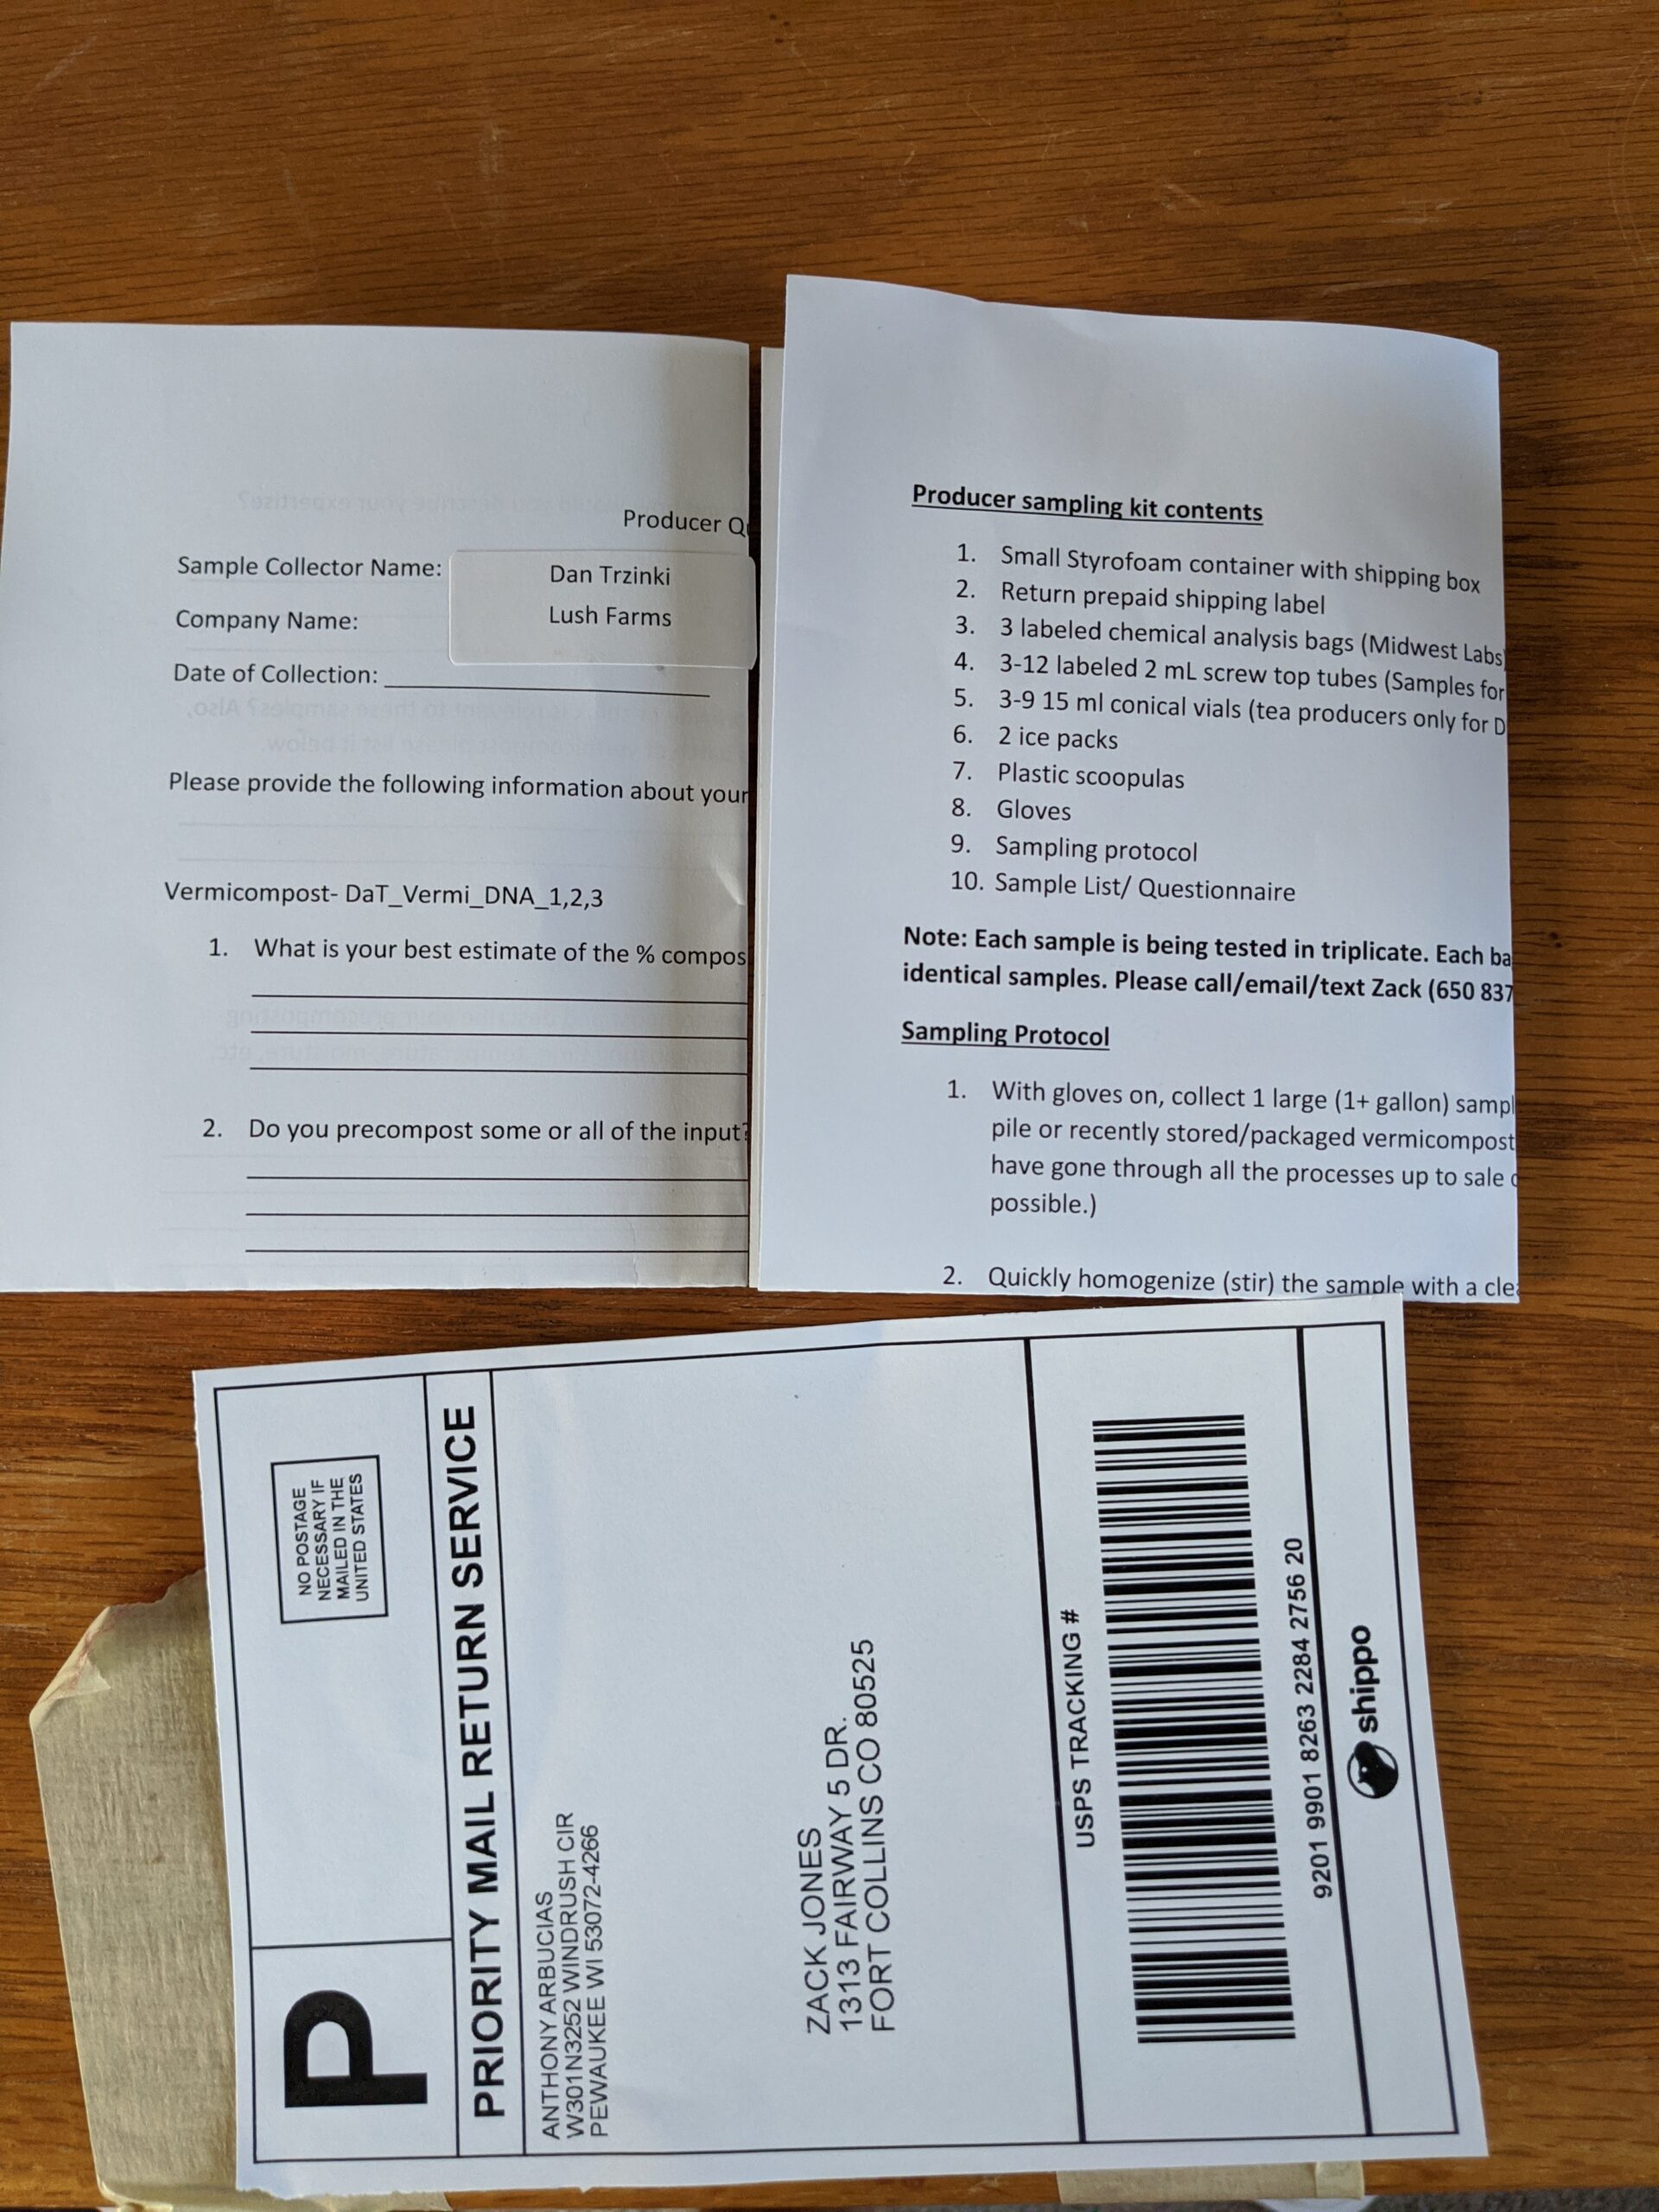
Dr. Jones began by calling all (~25) vermicompost producers whose details can be found in the Education Section. Producers described their systems and vermicomposting methods in detail. These conversations allowed for the identification of additional DNA sampling opportunities which might add context to the vermicompost sequencing data. This interaction also allowed for an initial overview of sample variables which helped to form the producer questionnaire. By the end of the conversation each producer had a set of supplies to expect for DNA sample collection and MidWest Lab sample collection. All producers were to send triplicate samples of at least 1 vermicompost for DNA analysis and MidWest Lab physical/chemical analysis. Additional samples for DNA analysis were to be collected of precompost, manure, or soils on an individual basis depending on composting processes. Producer questionnaires were prepared with the same questions but personalized for unique samples to each producer. This allowed for consistent information across the sample set. The questionnaire was included with the sampling kits along with sampling instructions as seen in Figure 1.
Sampling Kit Preparation
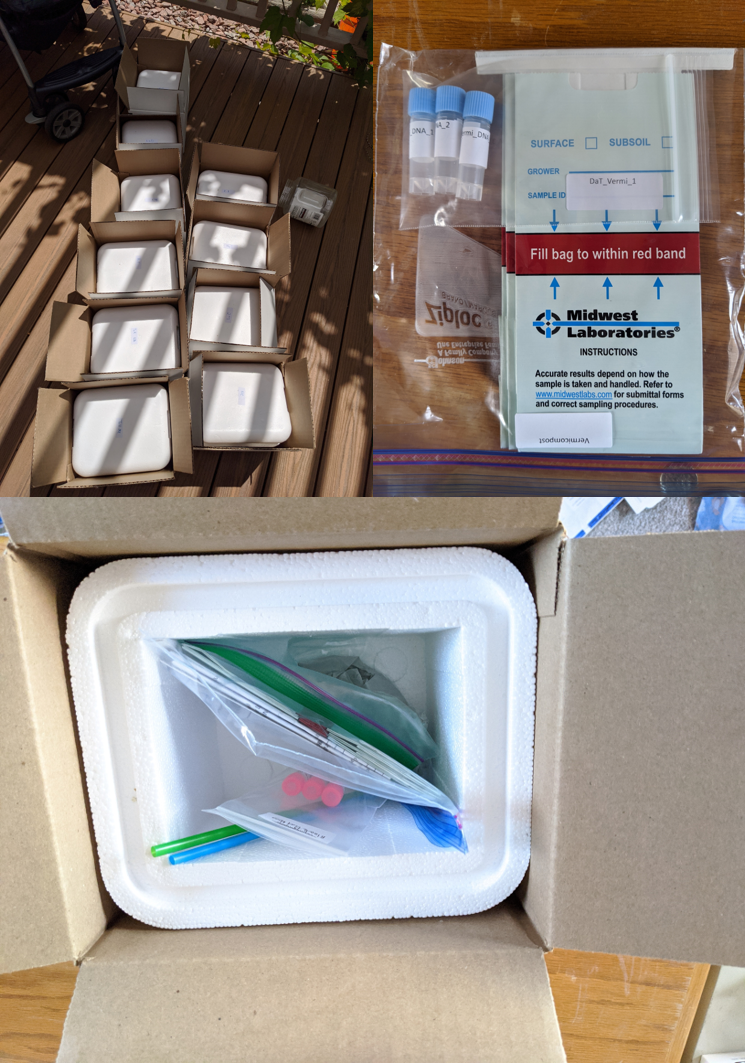
With the help of Ms. Doesken, nearly 30 sample collection kits with instructions were made and shipped nationally and as far as Alberta, Canada. Samples were returned on ice or dry ice because COVID restrictions did not allow for in lab testing of a preservative. This change in plans caused problems even with overnight shipping. USPS shipping interruptions and hot summer temperatures caused some samples to arrive warm. These samples had to be recollected to ensure DNA viability. Sampling kits were sent with a pre-paid return label (Figure: 1) for overnight shipping. Examples of the sample collection kits and collection kit preparation are below (Figure 2).
Sample Collection
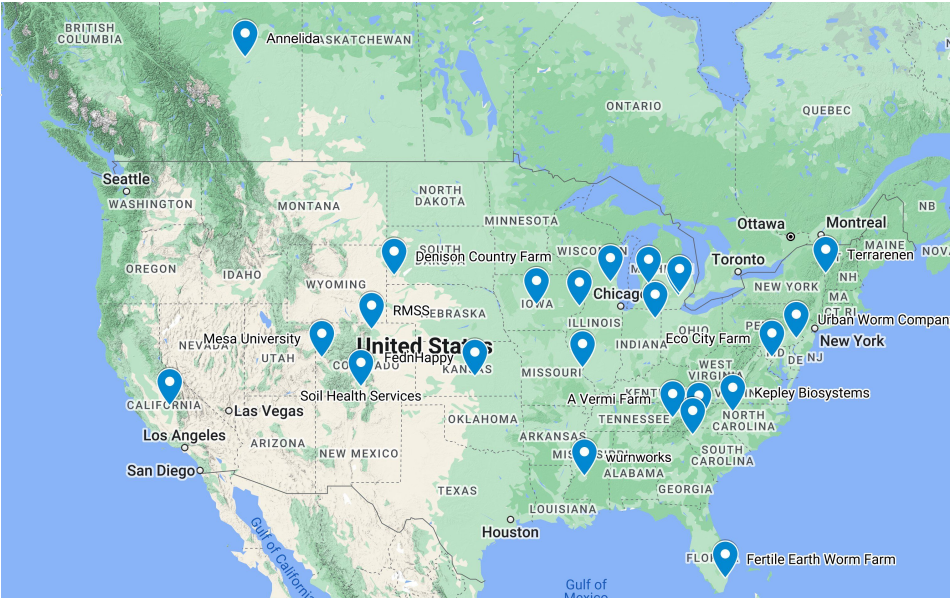
All kits were mailed back to Dr. Jones who then stored DNA samples frozen until DNA extraction. Midwest Lab sample bags were forwarded for analysis. A total of 19 producers submitted triplicate samples for Midwest Labs analysis and DNA sequencing analysis. An additional 6 producers have submitted samples for DNA testing only, either because Midwest Lab samples were not received or the producer was added to the study after Midwest Lab testing was completed. Producer questionnaires about their samples were also collected with the sampling. All metadata from each sample has been recorded in a large spreadsheet and will be presented in the final objective, Data Analysis. The map below represents locations of all 25 vermicomposters who submitted samples for DNA sequencing (Figure 3).
Objective 2: DNA Extraction and Sequencing
DNA Extraction
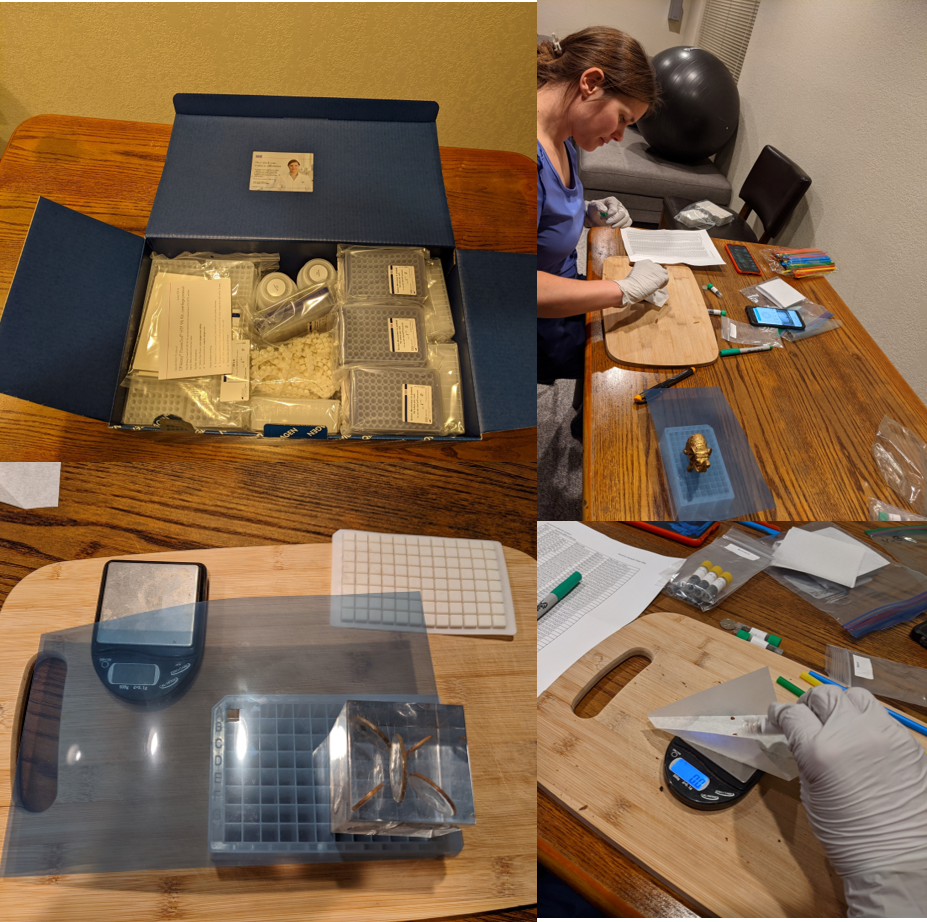
A total of 250 samples were processed for DNA microbial community analysis. Because of COVID restrictions, university laboratory access was lost at the Colorado School of Mines for the entire duration of the grant. This disruption caused some modification to the method of DNA extractions. In order to save time and due to limited lab access, a high throughput DNA extractions kit was used with 96 well plates (Figure 4). The extraction was then performed at an outside lab with high throughput extraction instrumentation.
DNA Amplification
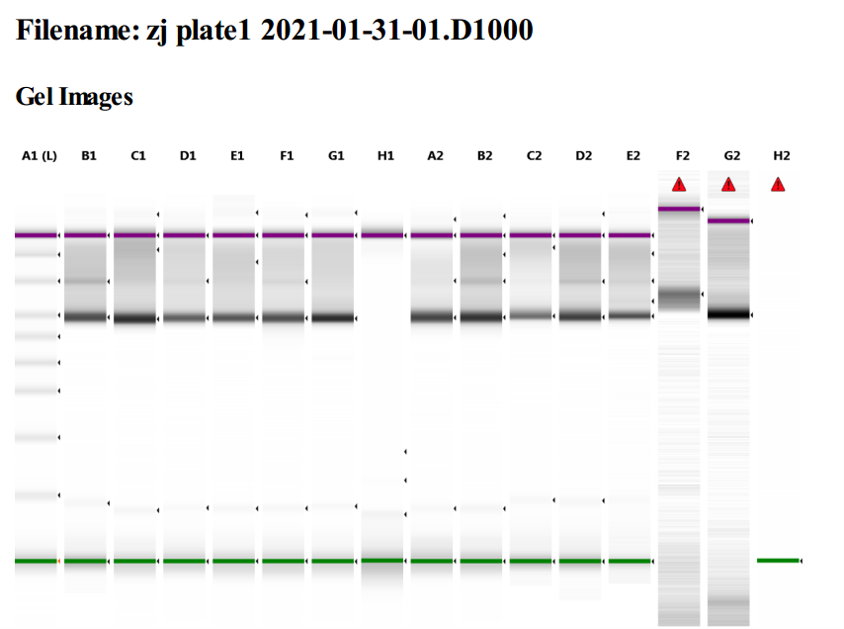
The extracted DNA was amplified with primers for the 16S gene that also amplify some of the 18S genes for Eukaryotic organisms. Amplification success is tested by gel electrophoresis (Figure 5). A dark band indicates a successful amplification. As seen in column H1, there was significant trouble with amplifying some samples.
DNA Sequencing
The DNA amplicon underwent barcode and adapter ligation in order to load it on the sequencing instrument. DNA sequences were sent to Anschutz Medical Core Genomics Lab in Denver Colorado for sequencing. The DNA sequencing run was successful and raw DNA sequences were transferred to Dr. Jones and Dr. Vanzin for analysis. While the sequencing run was successful, several samples did not amply or did not have enough sequences to continue analysis. This incomplete sample set limited our analysis in some ways because of lack of replication of most producers ( all collected in triplicate). This problem was likely due to humic acid contamination in the DNA exactions and prevented amplification. While this problem was expected with compost samples, the lack of laboratory access due to COVID prevented optimization as initially planned.
Objective 3: Physical and Chemical Analysis by Midwest Labs
Midwest Lab samples were returned with DNA samples. Samples were stored for up to a week refrigerated before being sent via overnight mail to Midwest Labs. Samples were sent in three batches due to receiving samples over a month. All Midwest Lab samples were successfully processed for the compost package and the data received.
Objective 4: Data analysis
Physical / Chemical Properties Analysis
The first analysis was performed on the physical and chemical data received from Midwest Labs. In order to keep data anonymous each producer who submitted samples were given a number in order to compare their compost to other producers. All analysis data below was shared via blog in order to demonstrate how to make sense of large datasets and allow producers to follow the process. Selected relevant properties were originally displayed according to producer number (Figure 6 below). 

It was clear that there was wide range of values for many of these properties. Vermicompost producers found this valuable, because it allowed them to see the range of vermicompost characteristics and understand how their vermicompost compared to others. There was quite a range of values despite nearly every producer being proficient in vermicomposting (Figure 15) as shown in the following producer metadata section.
Hypotheses surrounding mainly manure content and manure treatment were explored as this was one of the few producers' variables that could provide a consistent gradient. Manure is also typically thought to be main source of nutrients such as phosphorus. Producer samples were sorted by total manure content (Figure 7), however it should be noted there were five different types of compost.

While manure is typically used as an inorganic nutrient source it also tends to be high in salts and produce high conductivity. Relationships between phosphorus and conductivity were explored by making a ratio between the two properties as seen below (Figure 8).

Producers that aged manure outside before vermicomposting had more phosphorous but less salts. This likely due to the fact that precipitation could flush out salts into the ground. Higher phosphorous to conductivity ratios were also seen in windrow (in ground) systems likely for the same reason. This phenomena is also observed in producer number 8 which contained fish excrement from a pond bottom. While total phosphorous in #8 was comparable to other samples without manure, it had the lowest conductivity of all the samples.
There was also a weak relationship observed in regards to pH and calcium (Figure 9). The basic pH values above 7 were unexpected as composting produces organic acids from the microbial degradation of compost inputs.

It is difficult to draw firm conclusions about this relationship because calcium doesn't directly affect pH. However, many calcium based compounds do affect soil pH such calcium carbonate. While there was no producer data or inputs directly related to calcium levels, it is hypothesized that the amount and type of soil indirectly getting into the vermicompost could be affecting pH. These soils likely have calcium carbonates which could buffer the pH of these systems above neutral (max 8.2). This indirect addition of soil could happen when inputs are collected or mixed on the ground. The amount of degradation and aeration may also play a role as the more organic matter degrades, especially under anaerobic conditions, more organic acids are formed which may explain some variation in the data trend.
Producer Metadata Analysis
Data from the producer questionnaires were also analyzed and presented to the producers via blog. The number of producers is variable in some figures as not all producers sent samples for Midwest Lab analysis. Additionally some producers are listed twice if they submitted samples from more than one vermicompost system and provided data for both. The goal of presenting this data was two-fold. First, it showed the huge diversity of ways one can vermicompost. No one producer was doing it the same and demonstrates how versatile vermicomposting can be. Secondly it allows for producers to see how each other go about producing their product by comparing inputs, composting times, and composting techniques. This data will also be used to investigate the differences in microbial communities between producers.
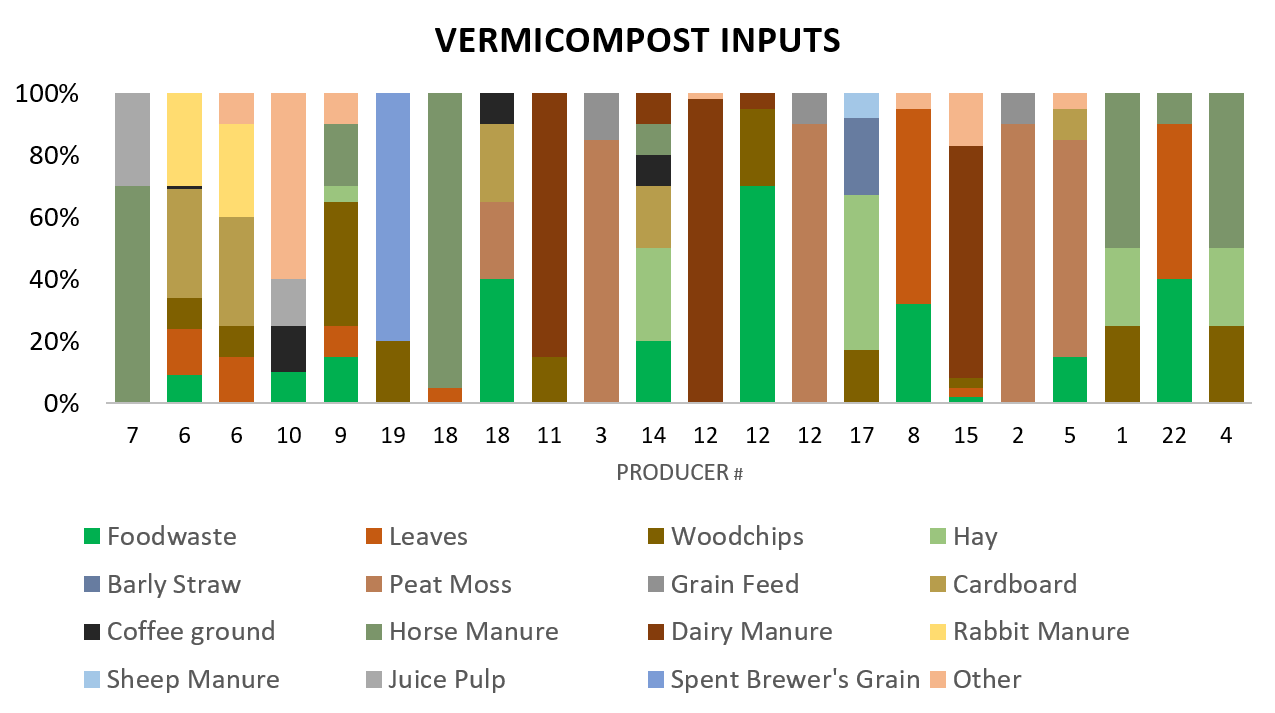
Each producer reported inputs used for vermicomposting (Figure 10). Manure was commonly used, however there are 5+ different types of manure including horse, dairy cow, sheep, goat, and rabbit . Common bedding materials include leaves, peat moss, and hay. Food waste, juice pulp, and coffee grounds were common worm foods. There were 3 producers who have a peat moss grain food mixture, but the rest to be use a custom mixture of what is available to them.
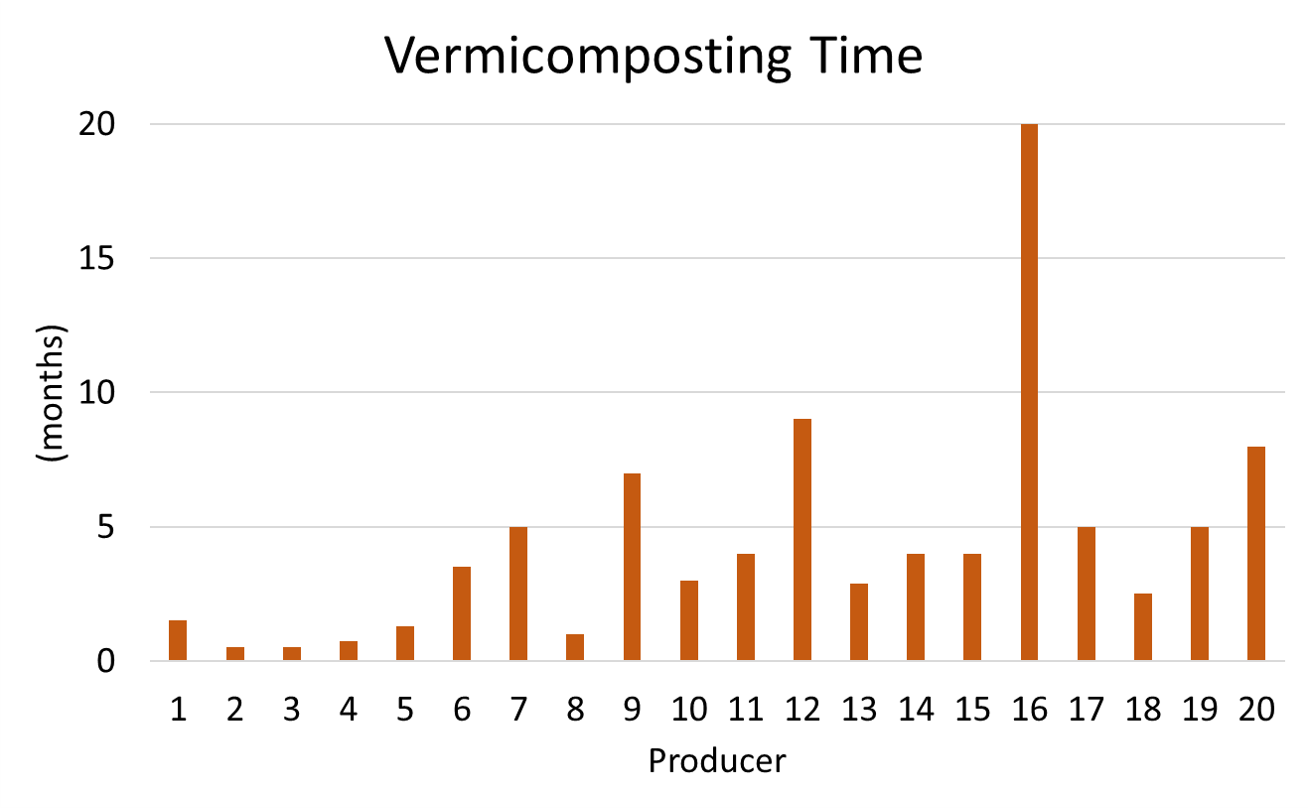
In Figure 11 above, there is a large range of composting times with the average composting being 4.5 months. This large range could be due to the fact that some producers might have over wintered their vermicompost or the vermicompost was not fully ready due to the spring sample collection time. A summer collection time for future studies or several collections over time would be ideal.
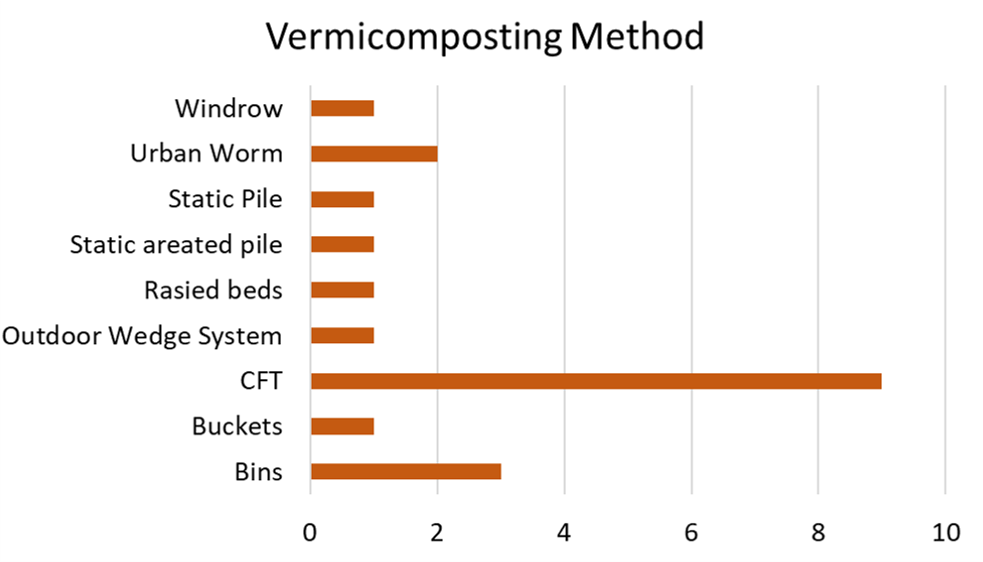
Figure 12 shows that the continuous flow-through (CFT) composter was by far the most popular method. This fact is not surprising considering most participants are small business owners. These CFT composters allow finished compost to fall through the grating in the bottom and collected with minimal labor. That being said, business owners are also successfully scaling low tech methods of buckets and bins. There were also a number of outdoor systems as well, including windrows and a wedge system. Nearly all producers are using Eisenia Fetida as their worm of choice, but two producers were using African night crawlers.
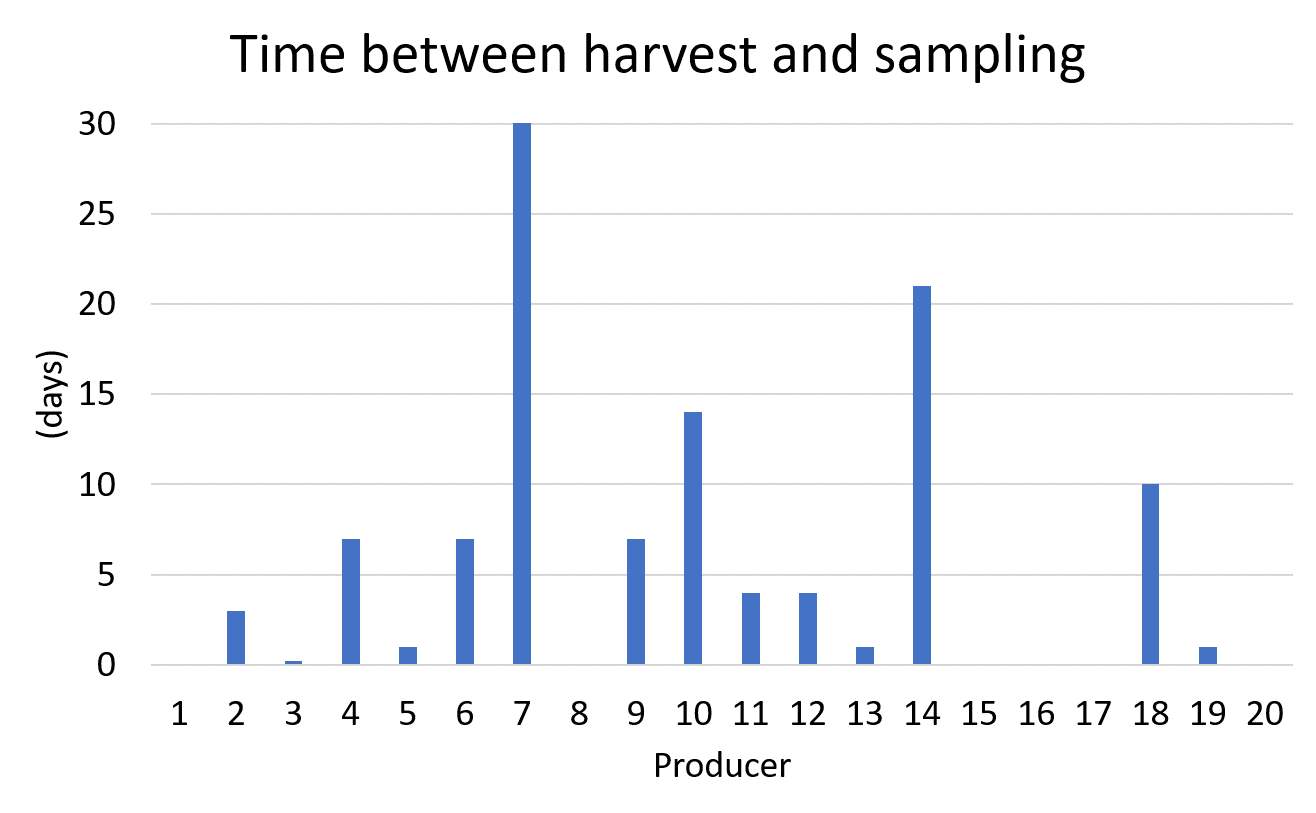
Producers also reported how long their vermicompost remained in storage before sampling (Figure 13). Some producers took a sample straight from their composter indicated by a zero days, while most samples were stored after harvesting for less than a week.
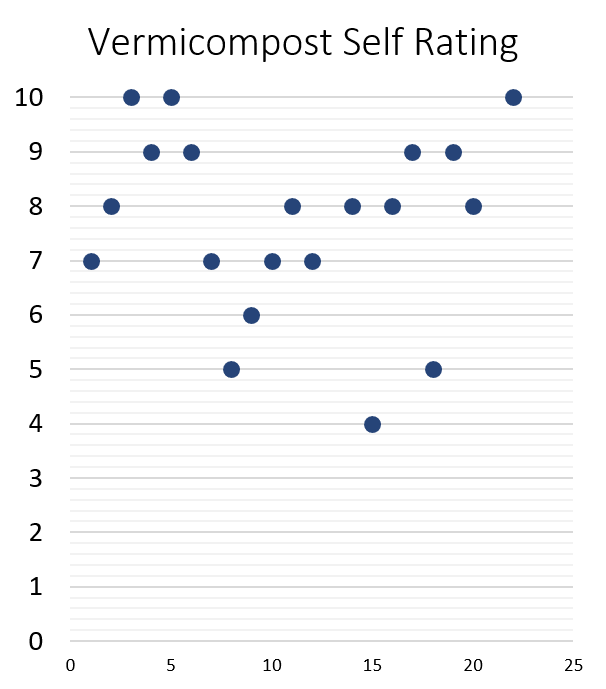
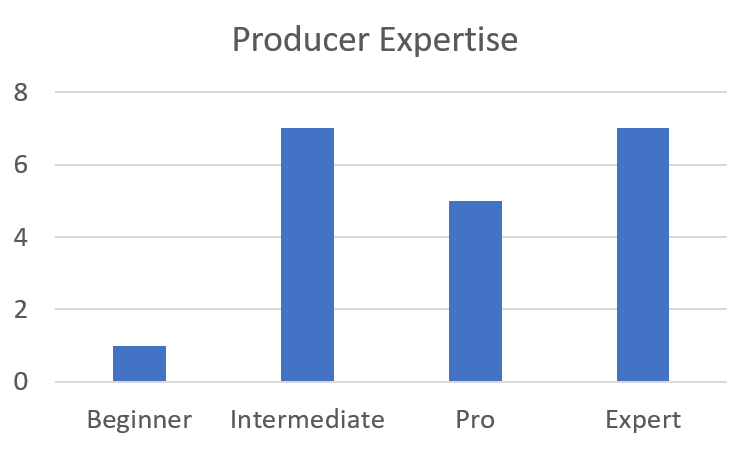
Despite this huge range of composting methods and inputs, most producers considered their vermicompost to be of high quality and rate themselves at being experts (Figures 14 and 15). This is likely true, since the large majority are successful small business owners and were recruited from a national conference on vermicomposting. This fact could cause bias in the data and should be interpreted with that context in mind. There is likely limited "bad" or poorly produced vermicompost in this study. Ultimately, this metadata collected from questionnaires shows that each producer has found a unique process given the resources around them.
DNA Sequencing Analysis
Demultiplexed DNA sequences were obtained from the University of Colorado Anschutz Medical Campus Genomics Core. The sequencing run was successful with approximately 13 million high quality sequences recovered. However, roughly half of the samples had less than 1000 sequences assigned to them and some samples had over a million sequences topping out at 2.5 million sequences for a single sample. This poor distribution of sequences and failure of some samples is likely due to humic acid contamination during the DNA extraction process. The main issue with losing samples is lack of individual sample replication as every sample was collected and extracted in triplicate to provide statistical power to the analysis. Because we lost a lot of statistical power, our analysis was more limited than expected on an individual producer level. Despite this limitation, samples were able to grouped by sample type to demonstrate the value that DNA sequencing can bring to vermicomposters and potentially sustainable agriculture as a whole.
Sample type descriptions:
Peat: peat moss used as bedding or "brown" material
Vermicompost: Compost made with worms
Precompost: Partially composted material added to vermicompost
Manure: Manure added to precompost or vermicompost directly from horse, dairy cows, goats, rabbits, or sheep.
Tea: Vermicompost tea made from bubbling vermicompost in water.
Soil: Soil collected from a dry mono culture corn farm.
Compost: Traditionally made compost without worms.
Worm: Guts from worms grown in a laboratory setting.
Alpha Diversity
To begin looking at the sequencing data, an overview visualization of alpha diversity was generated. Alpha diversity is the most well known diversity type and is generally thought of the number of species in a sample (richness). Below, (Figure 16), richness is described in number of unique sequences, or amplicon sequence variant (ASV), in each sample. It should be noted that each unique sequence should not be considered a unique "species." Previously, a species was defined as all sequences that are 97% similar, however this has been debated since it's inception and the definition of species using 16S sequences is still a hot topic among academics.
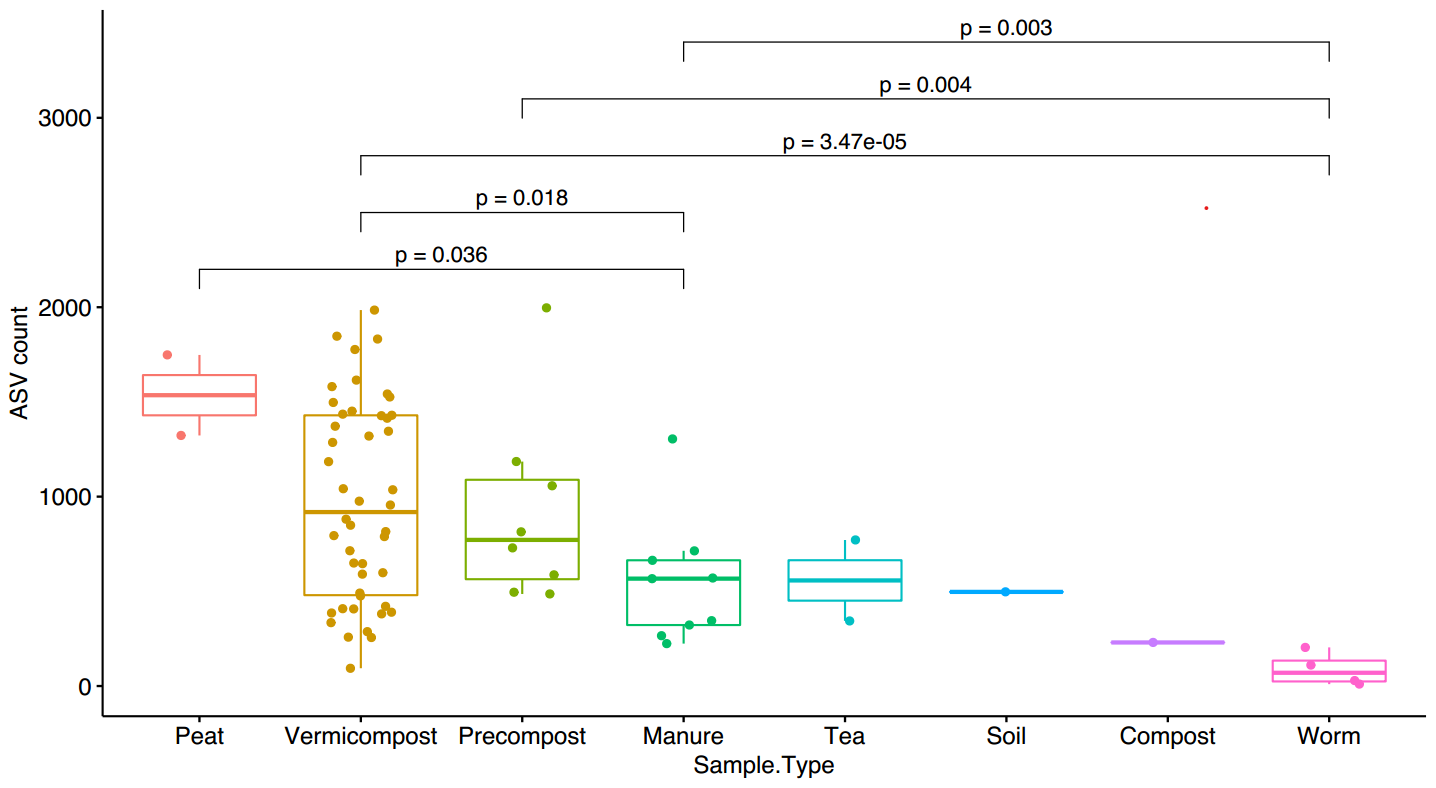
Samples are grouped by sample type with each dot representing an individual sample. Vermicompost represents over half of the samples which show a large range of alpha diversity. However, the lack of diversity in some samples could be due to lack of sequencing depth due the previously mentioned complications. For the most part, we can see that diversity significantly (p=0.018) increasing from manure to precompost to vermicompost.
Evenness (Figure 17) is an estimate of how equally the populations of all the species were distributed. For example, a perfect evenness of 1 means every specie in the sample is equally abundant (ex: 20 species each 5% of the population). The closer the zero the more uneven a population is. A similar trend is seen with microbial populations becoming more even through the composting process which is typically seen as diversity increases.

Taxonomy
In order to visualize the taxonomic differences between samples, a series of heatmaps were generated from Kingdom to Genus level averaging the samples of each sample type. With short read sequencing, species level identification is not possible with high confidence, as the whole 16S gene is unable to be sequenced. All of the figures below (Figures 18-21) will display the top 20 groups of organisms as relative abundance (0-100%) at each taxonomic level. The color red indicates high abundance and blue is low abundance.
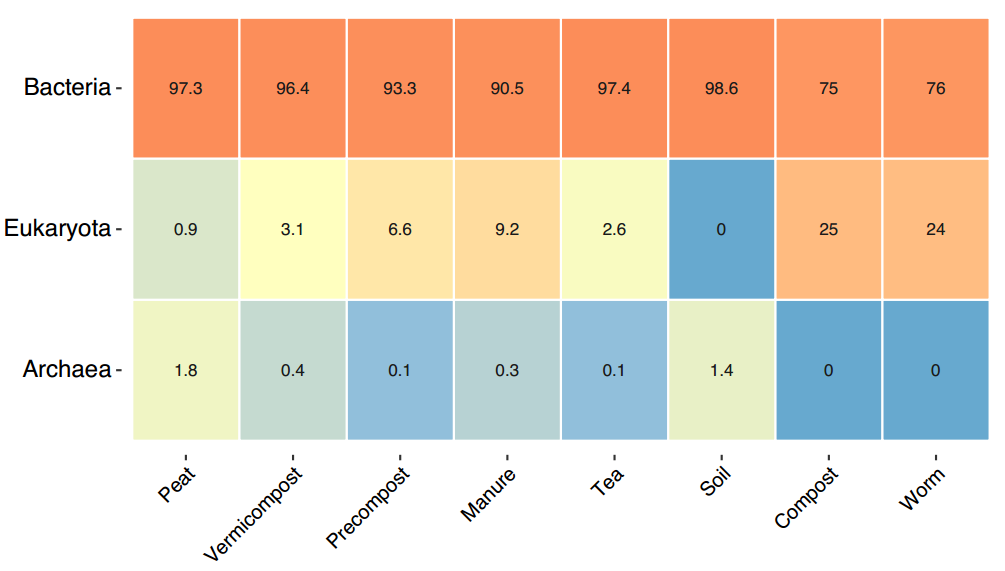
In the Kingdom level heatmap above (Figure 18) we notice that all samples are dominated by bacteria with the compost and worm samples having the highest relative abundance of Eukaryota sequences. There is also a decreasing trend of Eukaryotic organisms going from manure to precompost to vermicompost. This could be caused by an explosion in the bacterial communities, not necessarily a loss of fungi because the data is relative not absolute.
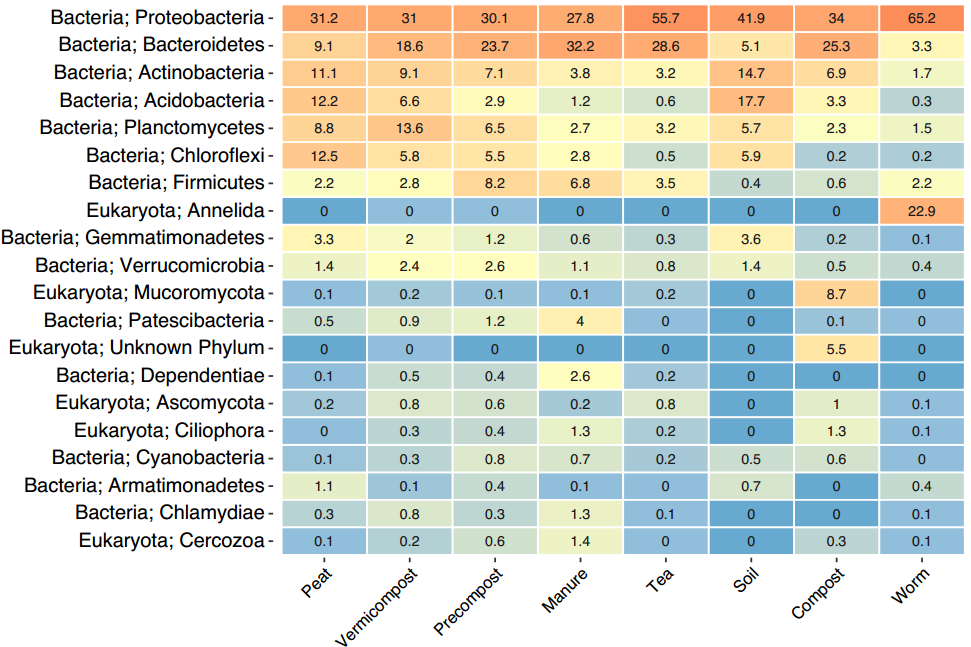
The heatmap above (Figure 19) drops down one taxonomic level to the Phyla level. A few groups of organisms already start to standout that we can begin to identify potential organisms of interest. Looking at our worm samples on the end we can see they are composed of almost 23% Annelida or worm sequences. While not surprising, it demonstrates that the DNA sequences are reflective of one of the few organisms one can actually see and lends confidence in the analysis. In the Compost sample we can see Eukaryote Mucoromycota at 8.7% which is knows to contain mainly mycorrhizal fungi, root endophytes, and plant decomposers. We also see compost has 5.5% of a completely unknown phylum which highlights the vast amount of work left to be done in the field of microbiology.
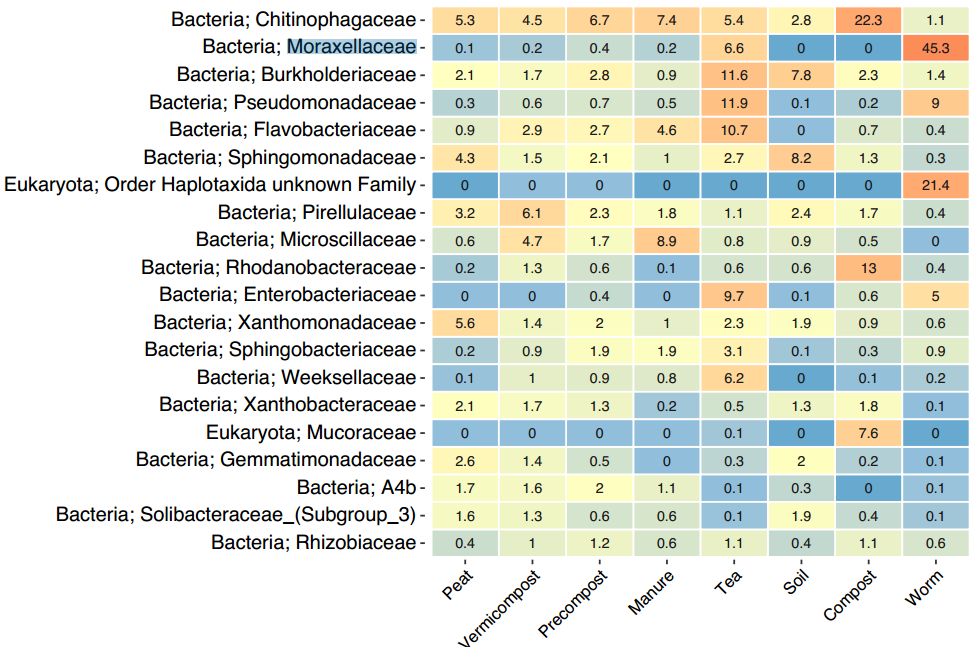
The most abundant family found in all sample types was Chitinophagaceae (Figure 20). It is most enriched in the single compost sample but present in all of the samples to some degree. This family still contains a large diversity of organisms which makes it hard to speculate what their significance is. Additionally, the compost sample was more enriched with Mucoraceae (noted in the phyla level as Mucoromycota ), Rhodoanobacteraceae, and Chitinophagaceae. The #2 most abundant is Moraxellaceae which is enriched in the worm gut. These are likely commensal organisms, meaning they are the primary inhabitants of the worm gut. The Tea samples are starting to show enrichment of a lot of families less predominantly found in other samples. Take note of these enrichments, as they demonstrate why these samples separating out from other samples in the beta diversity plot (Figure 15) as described in the beta diversity section below. The manure and vermicompost samples are showing an enrichment of Microscillaceae which have also been found in manure amendments and is suggested to increase degradation of petroleum based toxins. Vermicompost is also showing an enrichment of Pirellulaceae which are aerobic organisms that mostly only been studied in aquatic environments.
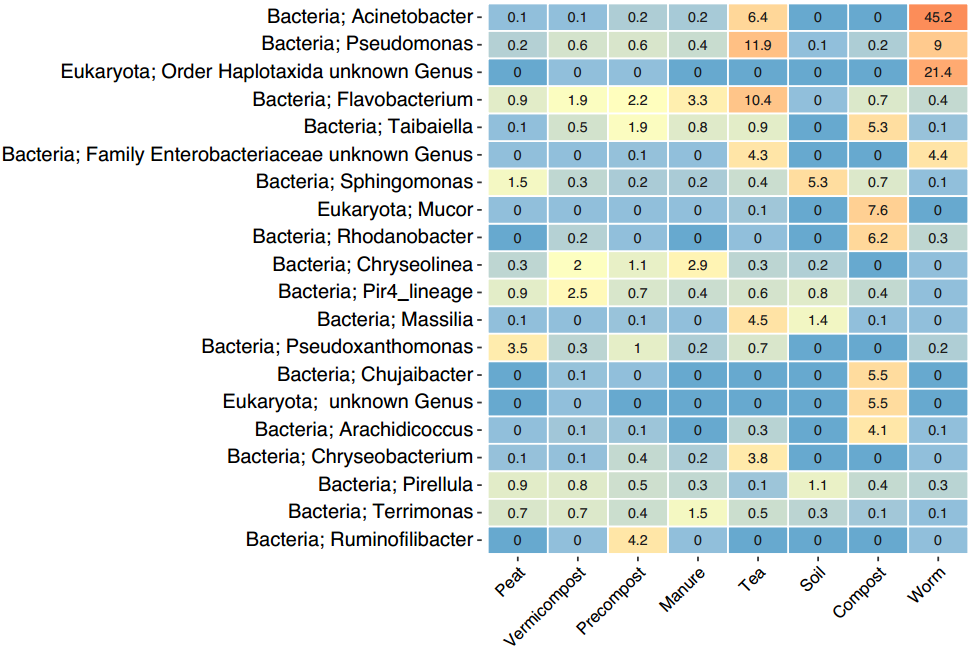
In the Genus level heatmap (Figure 21) there are too many genus of organisms to fully address, but there are some that stand out. Taibiella contains a member Taibaiella smilacinae, a known endophyte isolated from a plant root. If we look at the Tea samples we can see it contains 4.5% Massilia, a major group root colonizing organisms. There is also a presence of Chryseobacteria especially in the Tea which is know to contain groups of plant growth promoting organisms. Interestingly, only Ruminofilibacter is seen in the precompost and has previously been shown to be dominant in mature manure based compost.
Core Microbiome Analysis
In order to focus the taxonomic analysis on vermicompost, a core microbiome analysis was performed at the genus and family level (Figures 22 and 23). A core microbiome highlights which organisms are the most prevalent and most abundant in a set of samples. In the two core microbiome analyses below the taxonomic identification is on the y axis, the relative abundance of each group is on the x axis, and colors indicate the prevalence of each group at the relative abundance or higher.
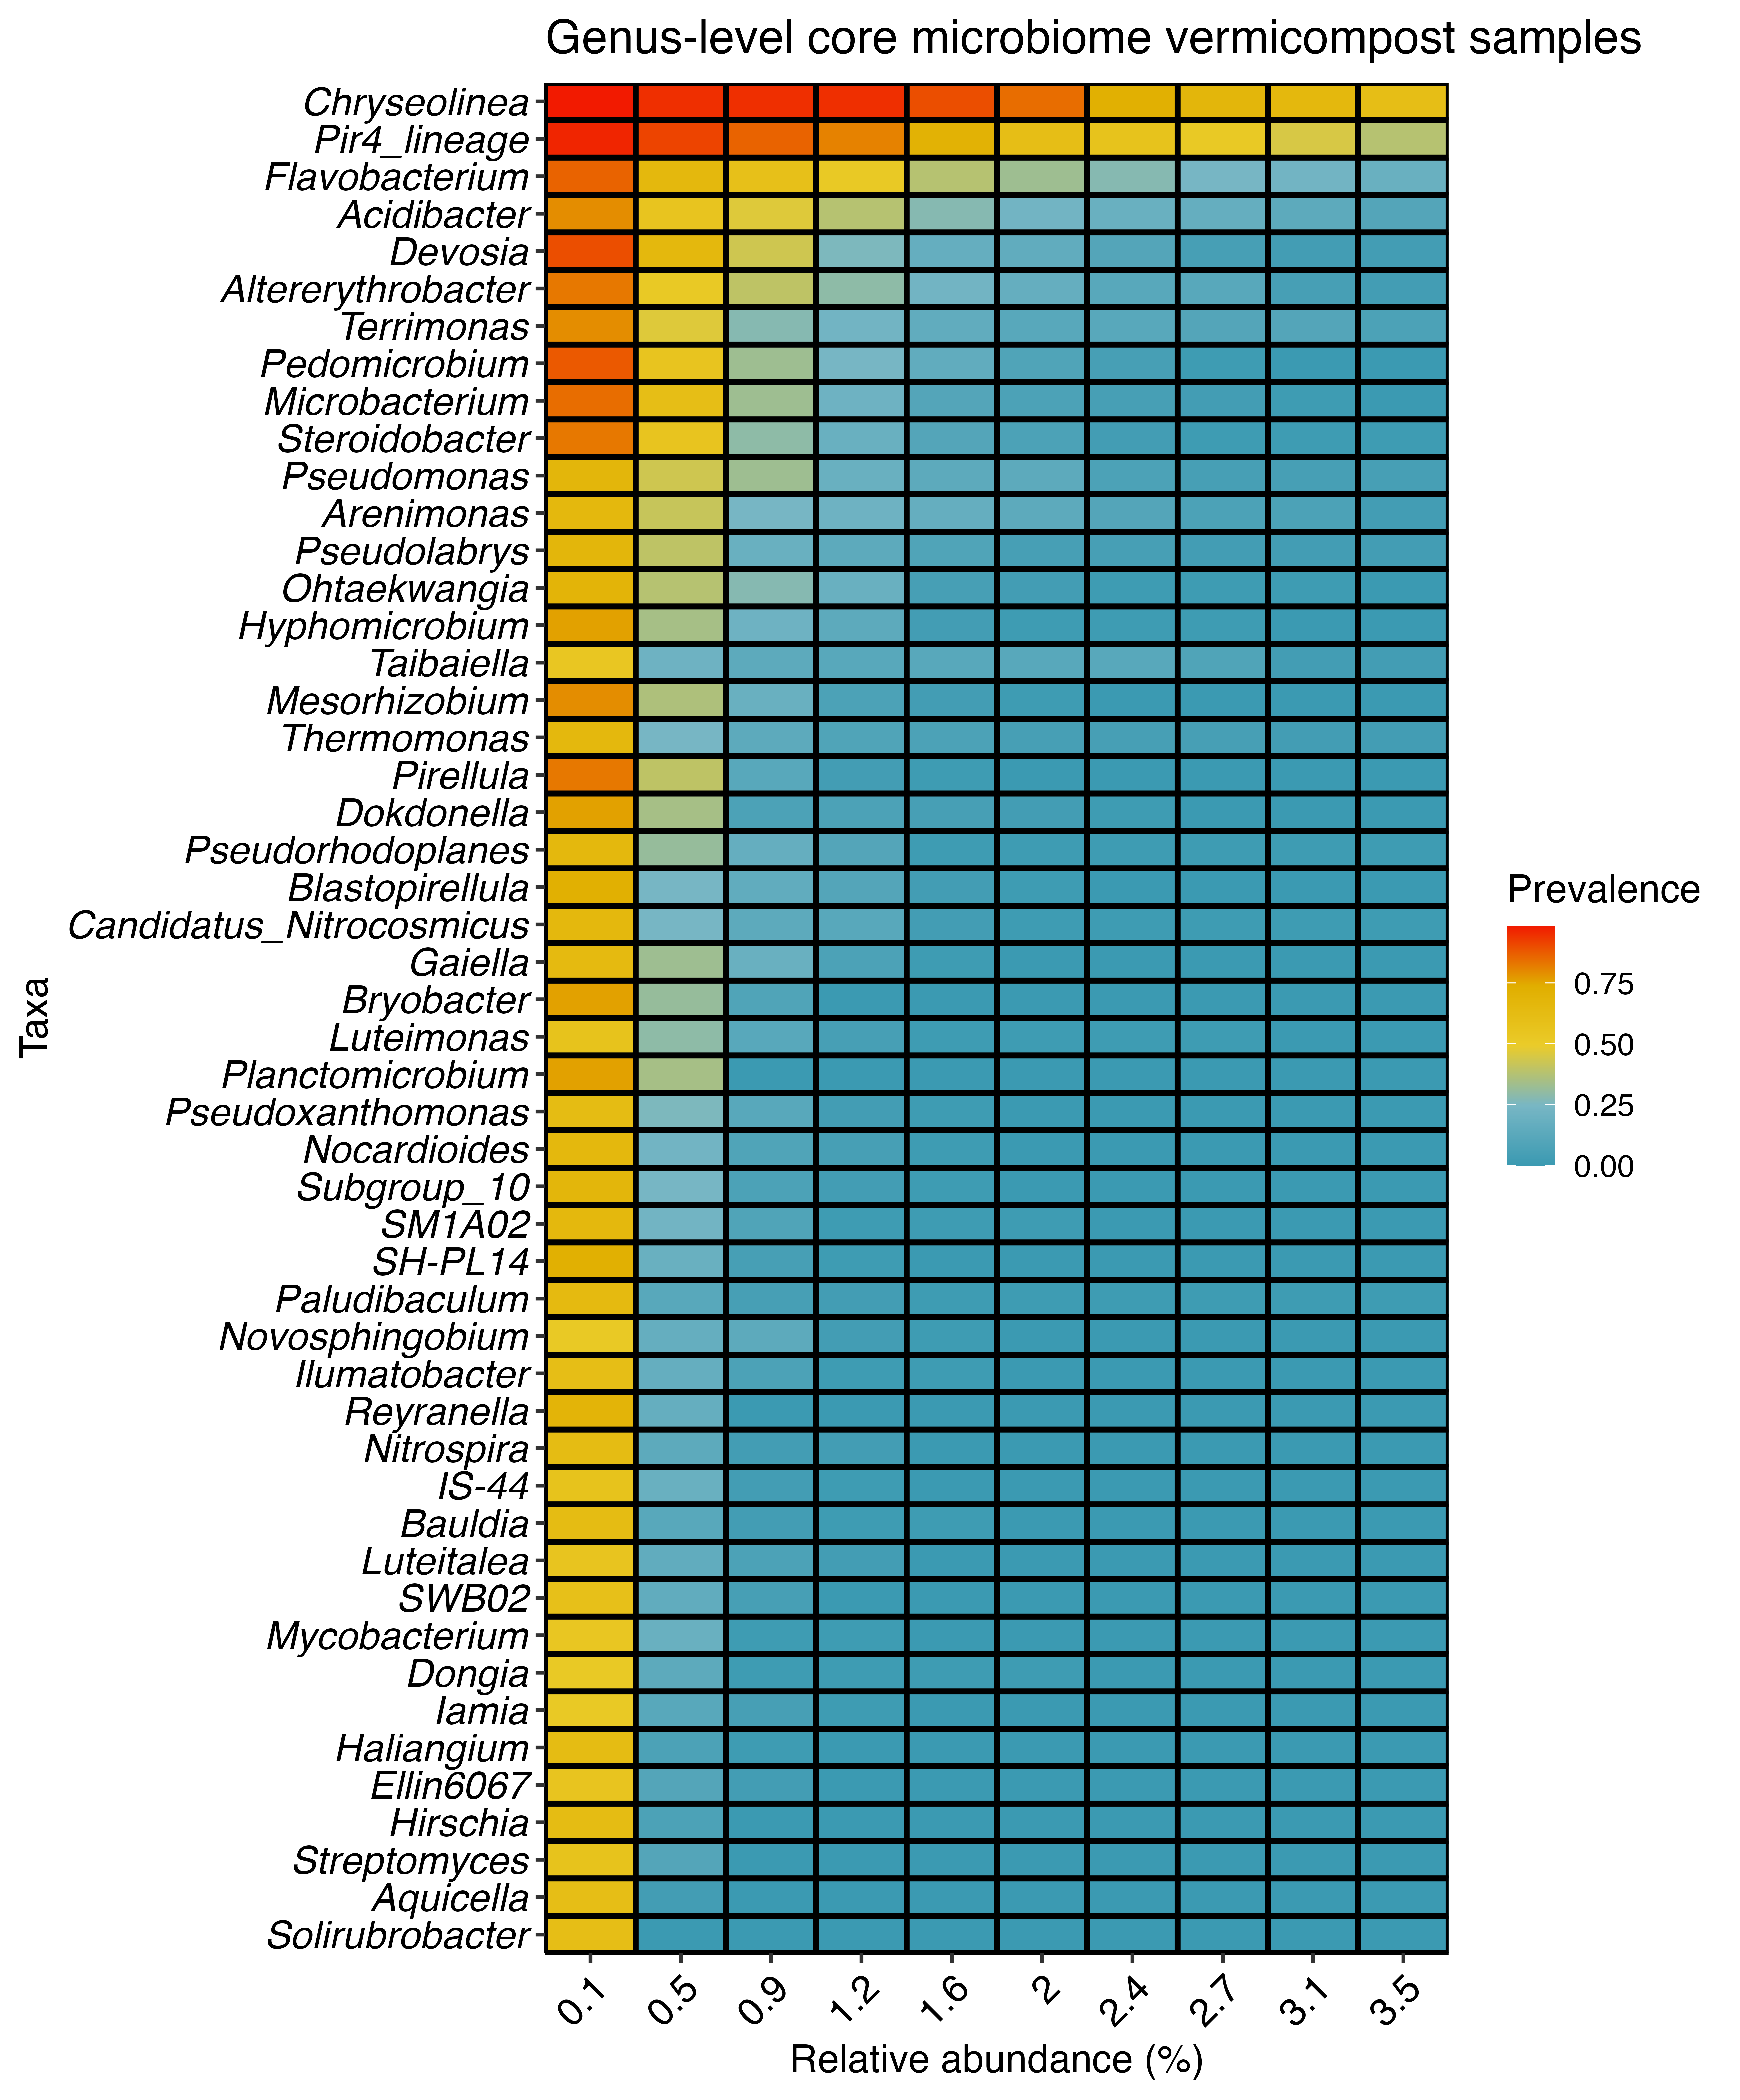
Looking at the genus level heatmap above (Figure 22), the most common and abundant organisms are in the genus Chryseolinea. They are seen in nearly every vermicompost sample with at least 1% relative abundance as indicated by the 4 red bars. About half of the vermicompost samples have at least 3.5% of Chryseolinea as indicated by the last yellow blue bar.
A recent study on tomatoes, showed that Chryseolinea were the defining organism of the root microbiome of tomato plants amended with vermicompost. In this study vermicompost amended tomatoes performed just as well as synthetic fertilized tomatoes hinting that that this genus of organism could in part be responsible. Species of this genus have also been shown to suppress plant diseases such as Fusarium, and was found to be promoted by the application of bio-stimulants. A species of this organism has also been patented for the use of promoting cabbage growth in Korea.
The "Pirellula-related" genus, Pir4 lineage, is the second most common genus and unfortunately contains no cultured members. This means not much is known about it because no member has ever been isolated and grown in pure culture. However, it has been seen associated with rice roots.
Flavobacterium is a broad and common collection of soil and aquatic microorganisms so it isn't surprising to see them as the third most common genus. Another taxonomic group that jumps out is Devosia, which is also known to contain plant growth promoting species such as Devosia rhizoryzae.
Based on this analysis, we can start to understand that while all vermicompost samples might have slightly different communities, they also contain a core group of organisms. As we have seen, potentially many in this group of organisms has been shown to promote plant growth and colonize roots. This finding can help explain why vermicompost of all types is generally beneficial to plants despite not being nutrient rich.
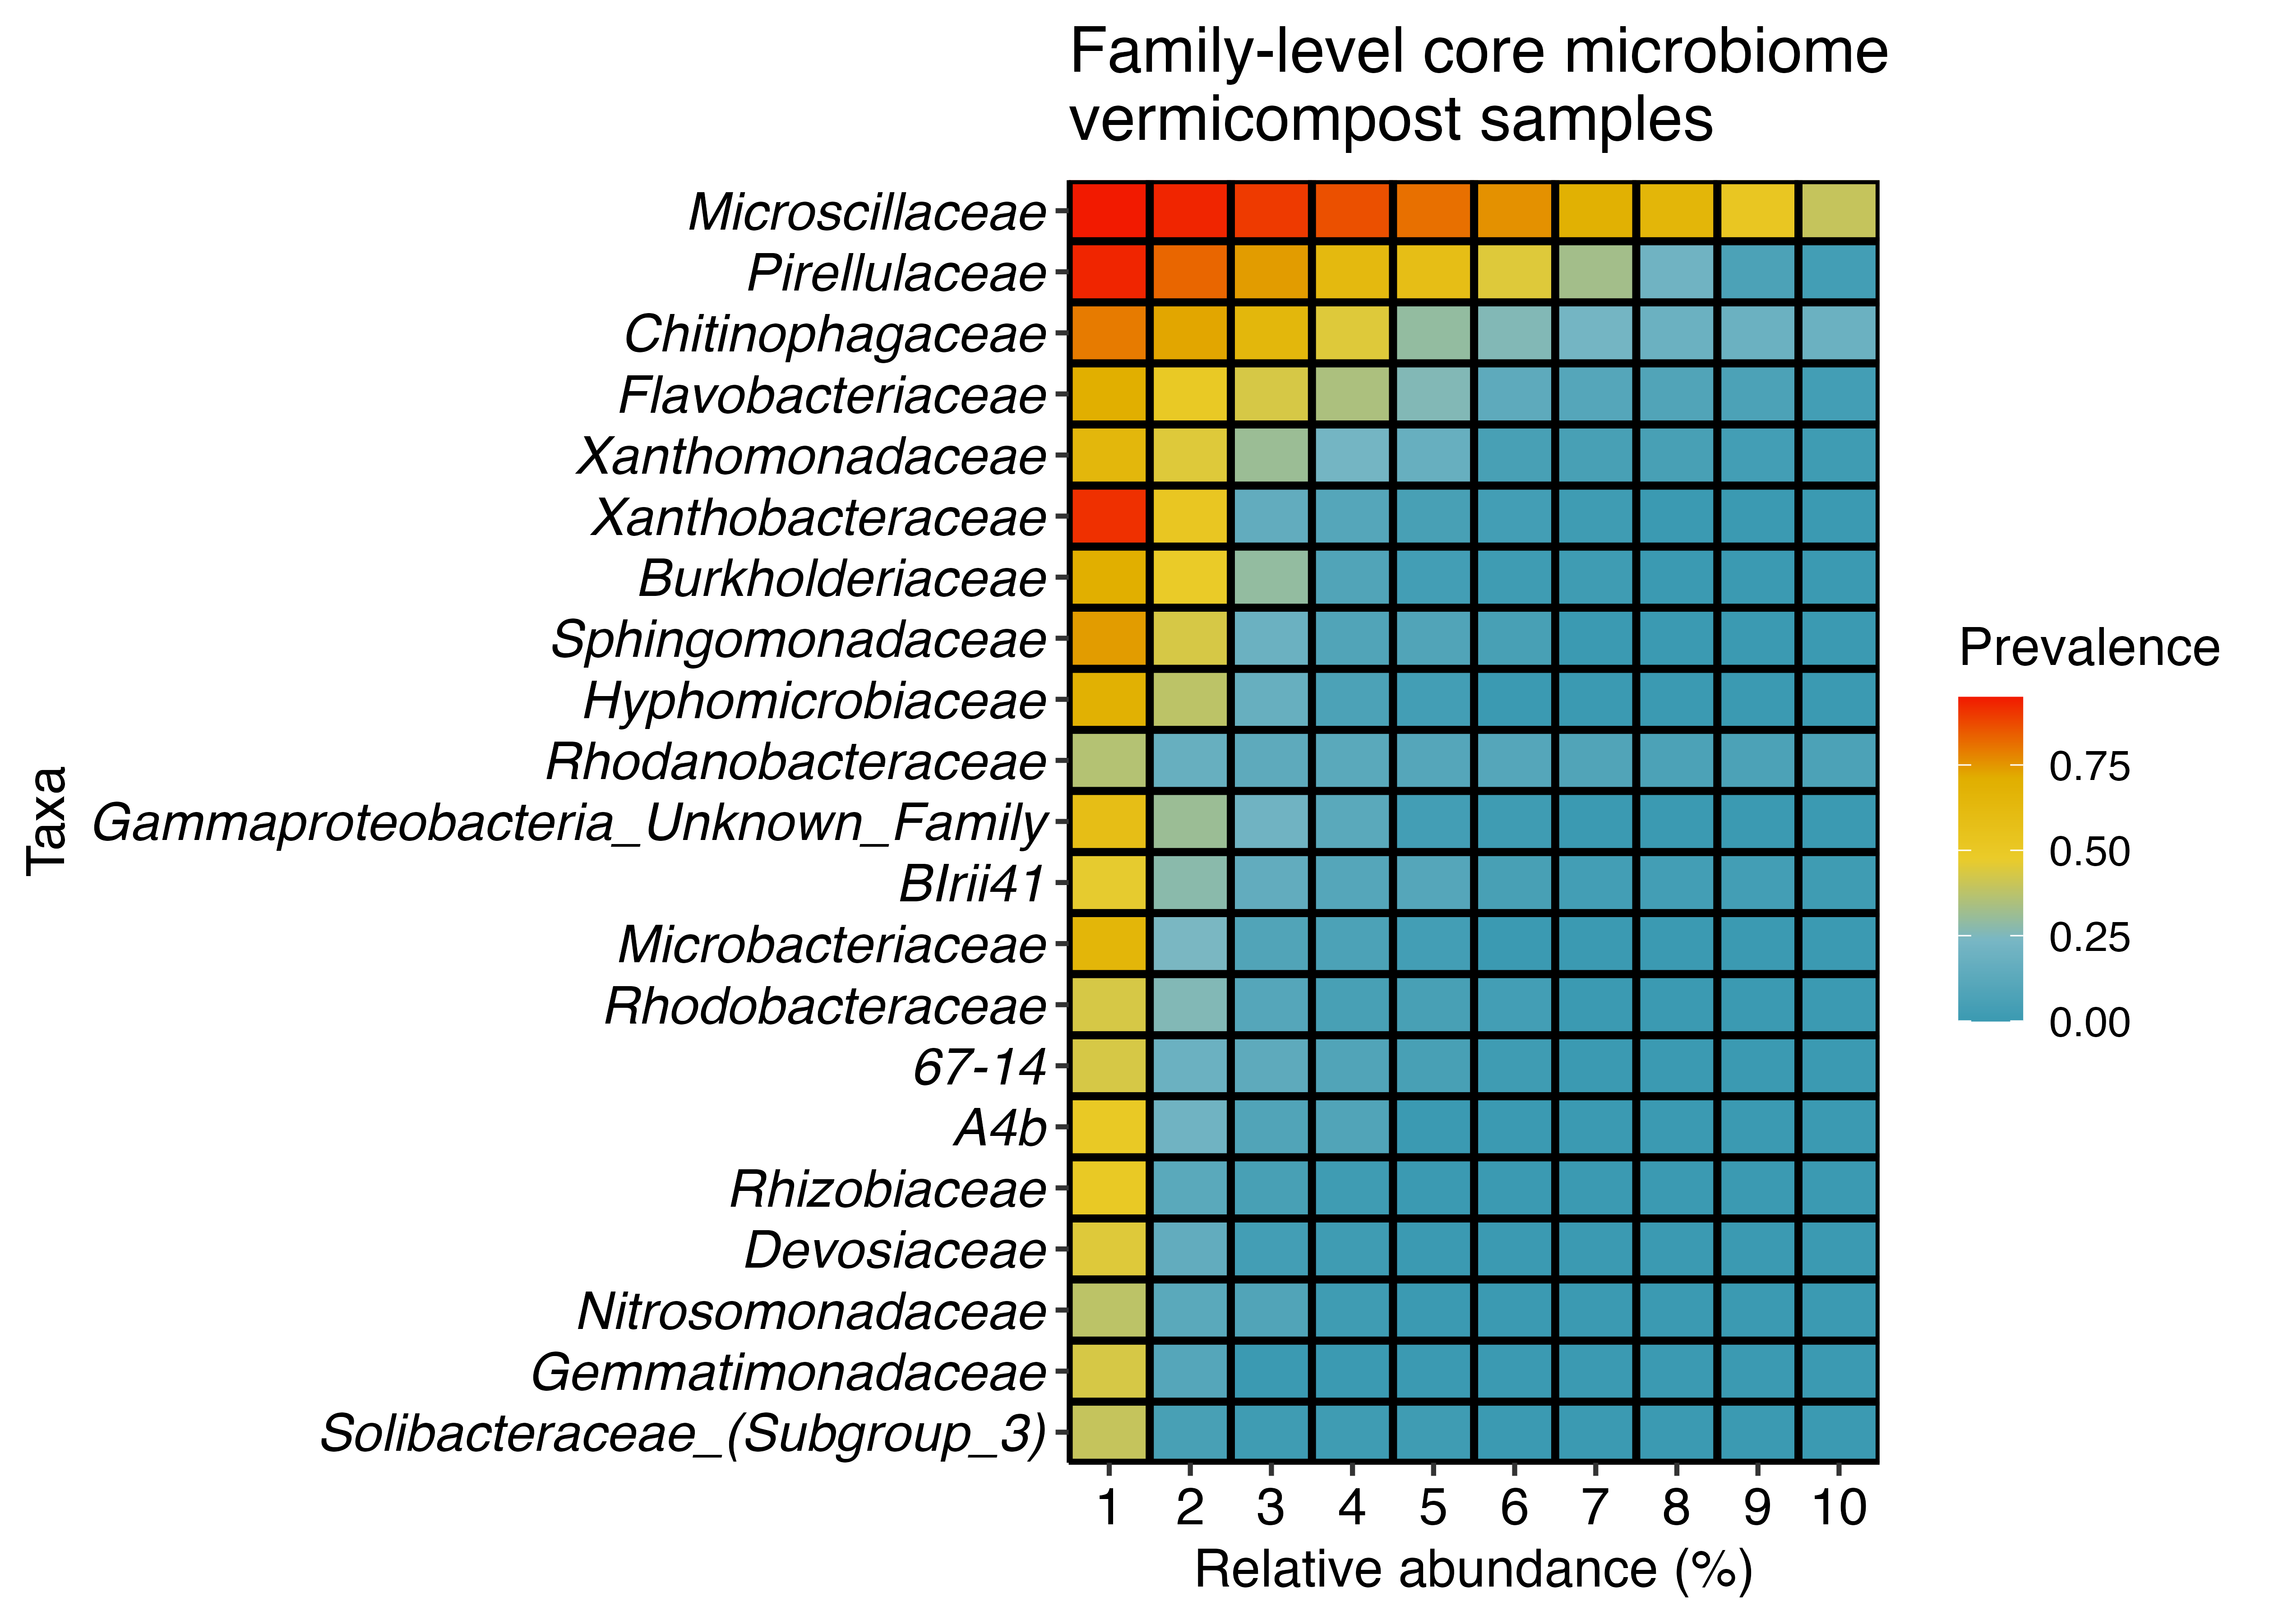
In the family level core microbiome (Figure 23), Microscillaceae was the most prevalent and by far the most abundant family of organisms found in vermicompost. It was found in 94% of all samples with at least 1% relative abundance . In 40% of samples, this family was found to be at least 10% of all sequences in the sample indicated by the last box. This family was previously seen in vermicompost used for bioremediation. It has been noted to degrade chemicals like atrazine, a widely used pesticide.
The second most abundant family in our core microbiome is the Pirellulaceae that was found in >90% of all vermicompost samples. 40% of samples had at least 7% relative abundance so very similar to Microscillaceae. This family contains the Pir4 Lineage above. Interesting, the only study found highlighting this family had to do with earth worms, arbuscular mycorrhizal fungi (AMF), and how they help with antibiotic degradation. The key finding of the paper was that worms and AMF promote the growth of Pirellulaceae which increase antibiotic degradation.
The final family to highlight is Chitinophagaceae, the third most common family. It contains many species that are known plant growth promoting organisms such as Arachidicoccus rhizosphaerae. It is also associated with organic matter degradation which helps explain why it might be common in vermicompost.
Beta Diversity
The topic of beta diversity was also introduced to producers and as means of comparing complex communities. Beta diversity is thought of as a measurement between ecosystems which ecologists typically use to measure the change in communities along gradients. It is a form of data or dimensional reduction in which the microbial community information is turned into matrices using their phylogenetic trees. The two vectors that describe the most difference between matrices of all the samples are selected for the x and y axis. The axis values are abstract and can be thought of as "difference between samples explained." Each sample (or group of samples) is reduced to a single point and in essence the closer the dots the more similar the microbial communities of the samples are. Because it is a form of data reduction, it paints an incomplete picture which can make interpretation tricky.
In order to try and associate producer and sample metadata, a series of principle component analysis (PCoA) were performed. Generally, one is looking for a clustering of samples with a specific trait as selective pressure on the microbial community. Because not all samples have sequencing data and replication was lost, interpretation was challenging. Additionally, the number variables between all of samples and producers was immense and it is likely that even a broader sample set is needed to begin to make valuable insights with this approach.
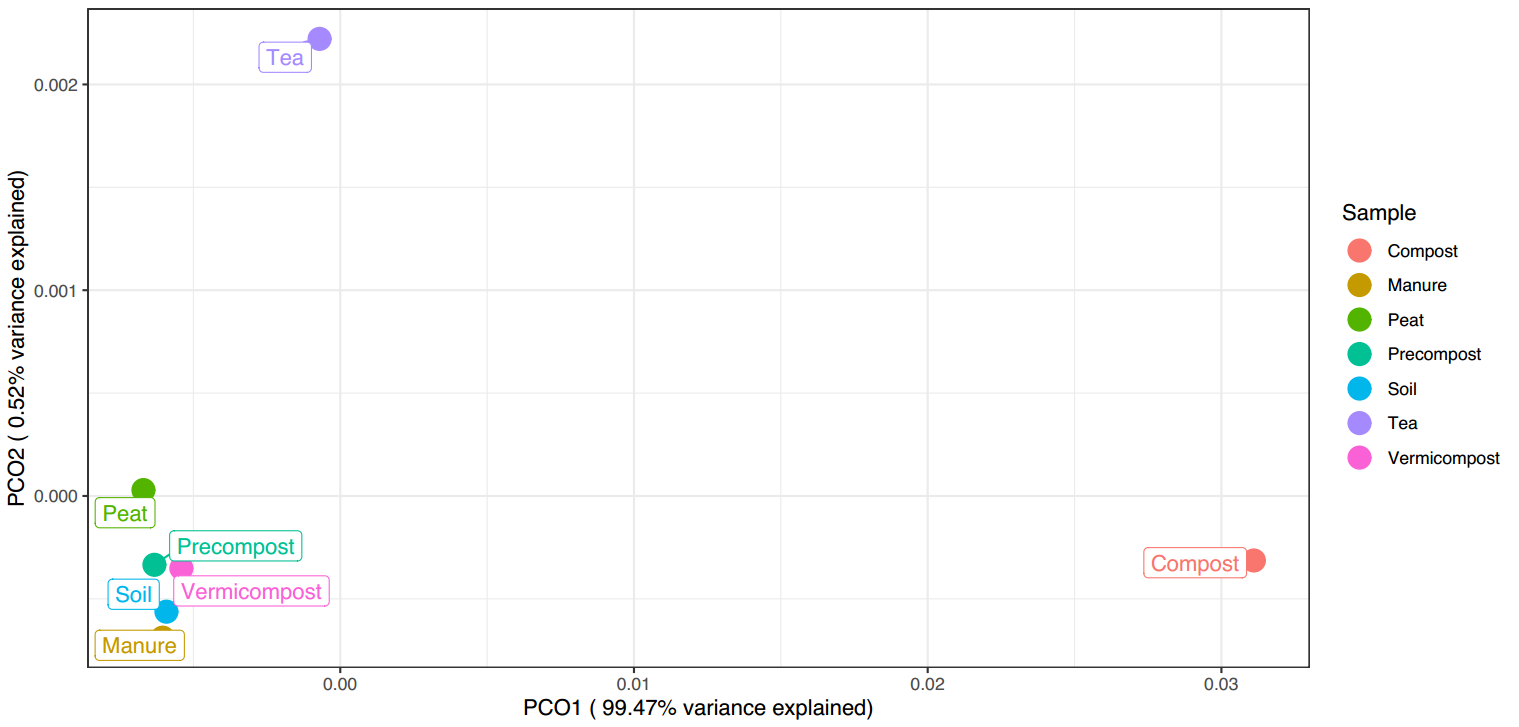
From the PCoA plot above, (Figure 24) it is apparent that vermicompost is more similar to soil, precompost, and manure than to tea or compost. Tea and compost are also not similar to each other. Much of this difference can be overserved in the taxonomic heatmaps as mentioned above. With such extreme difference in samples the bottom left cluster of samples is poorly differentiated even with the "worm" samples removed for additional clarity.
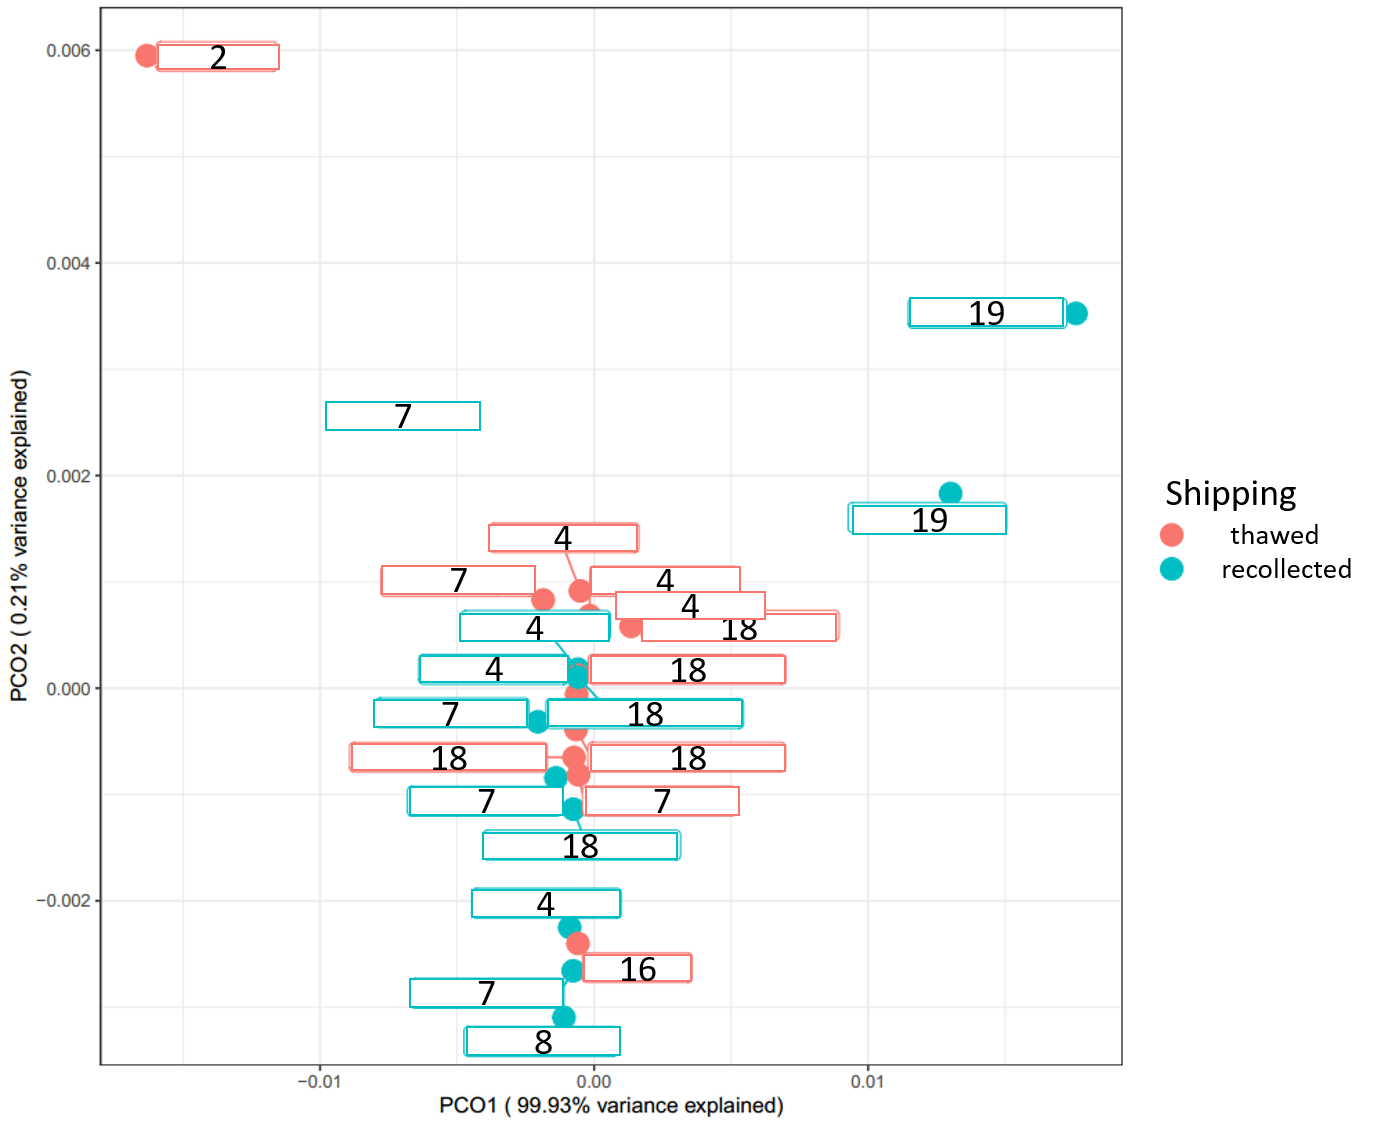
Above (Figure 25), in pink are the samples that thawed and turquoise are the samples that were successfully recollected. The numbers for each sample are the randomly assigned producer numbers from the Midwest Lab data. Generally, the pink and blue samples all clustering together, and it's safe to say the thawing of samples had very little, if any effect. Clearly the samples by producer #19 and #2 are the most different. Interestingly, producer #19 uses spent grain as bedding and #2 uses peat while the rest of samples use manure for bedding except for #16 and #8.
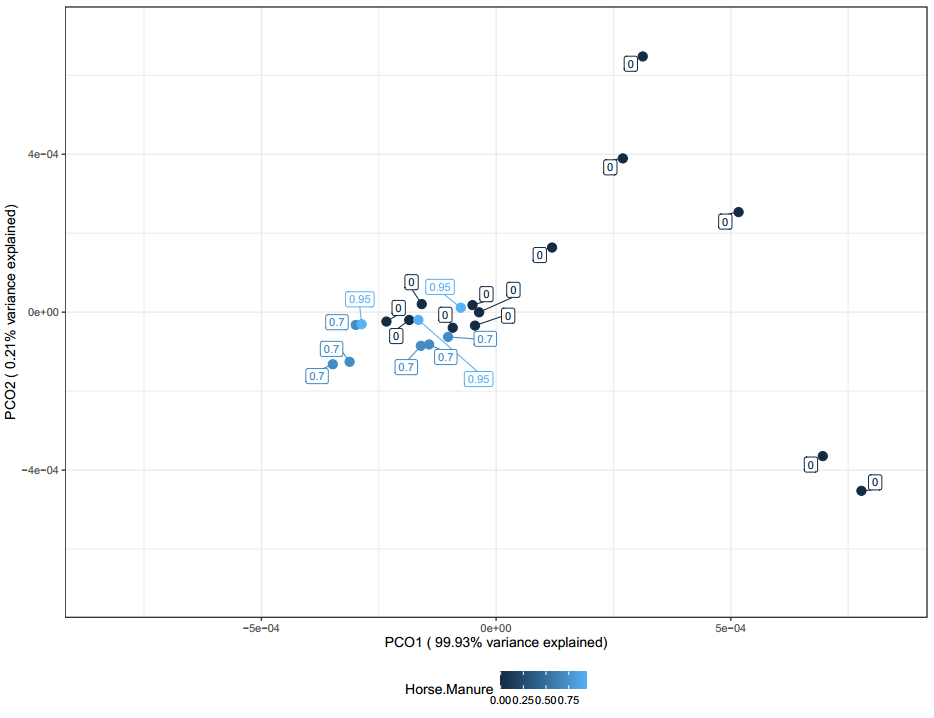
The PCoA above (Figure 26) shows potential sample clustering by horse manure. However, this clustering could likely be a result of an over abundance of samples from producer 7 who has 70% manure. Samples without manure also clustered closely with manure samples meaning there are larger factors at play in shaping the microbial communities of these samples.
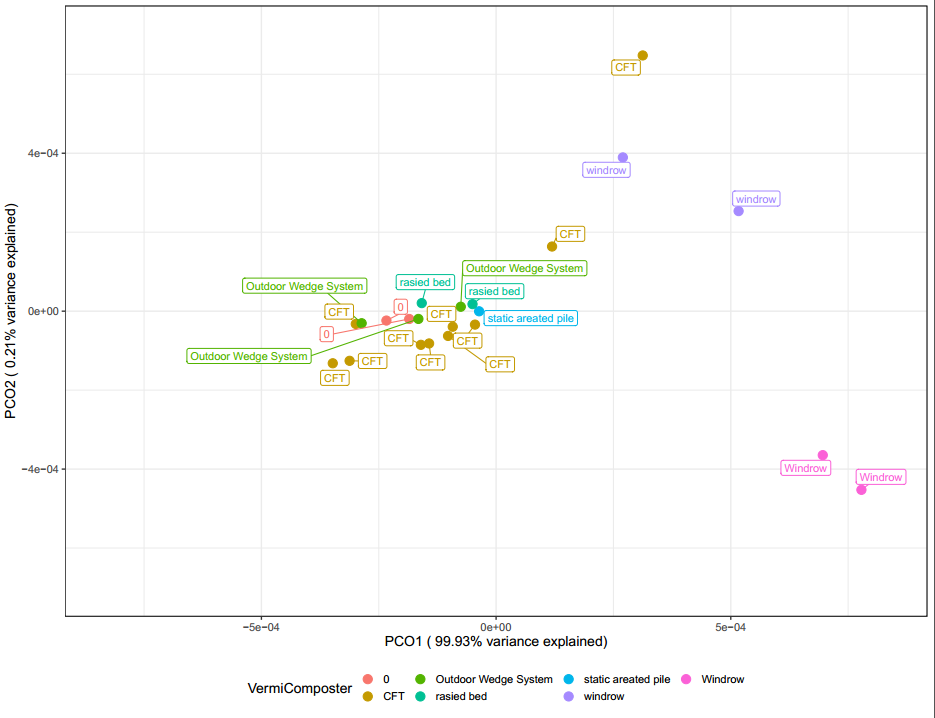
Interestingly, when samples are labeled by vermicomposter type (Figure 27) above, the samples from windrow systems are separate. It could be possible that these outdoor in ground systems are having the largest effect on shaping the microbial community. With so many variables compared to samples it is difficult to confirm this observation with confidence.
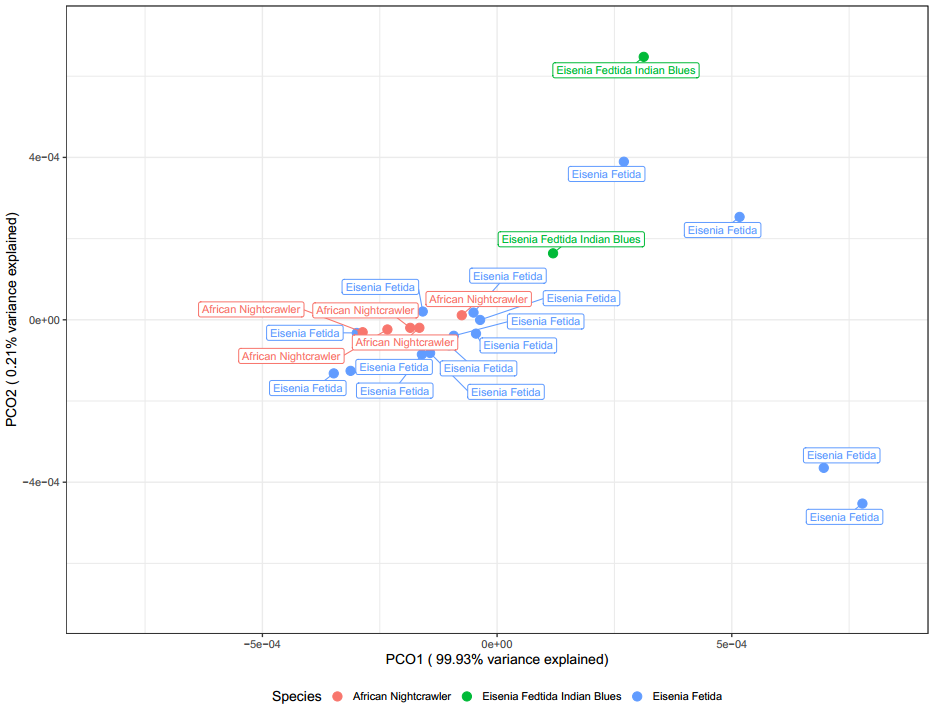
Based on Figure 28, worm species appears to have little effect, if any on the microbial communities found in vermicompost.
Samples with associated chemical characteristics from Midwest Labs were also visualized with PCoA (Figures 29-32). Samples mostly clustered by replicate from producers, however those clusters of samples demonstrated some difference in chemical composition .
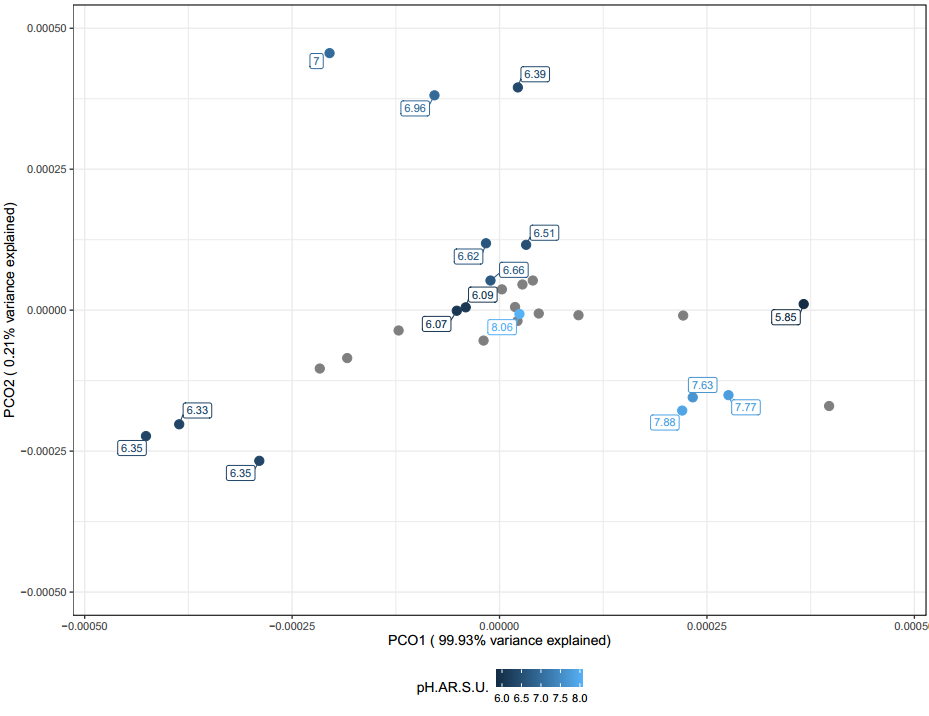
In soils, pH is typically one of the few characteristics that can significantly be associated with microbial communities. In the figure above (Figure 29) there are some distinct clusters but again these clusters are due to replicates from producers. While pH might be a useful indicator of microbial community characteristics, it is typically difficult to inform vermicomposting processes as pH is the end result of many different variables.
The following PCoAs for conductivity (Figure 30), carbon (Figure 31), and phosphorous (Figure 32) can generally be interpreted in the same way. When looking at all of these PCoA's, a rough trend can be observed. Mainly samples that are not clustered around the middle tend to have more extreme values.
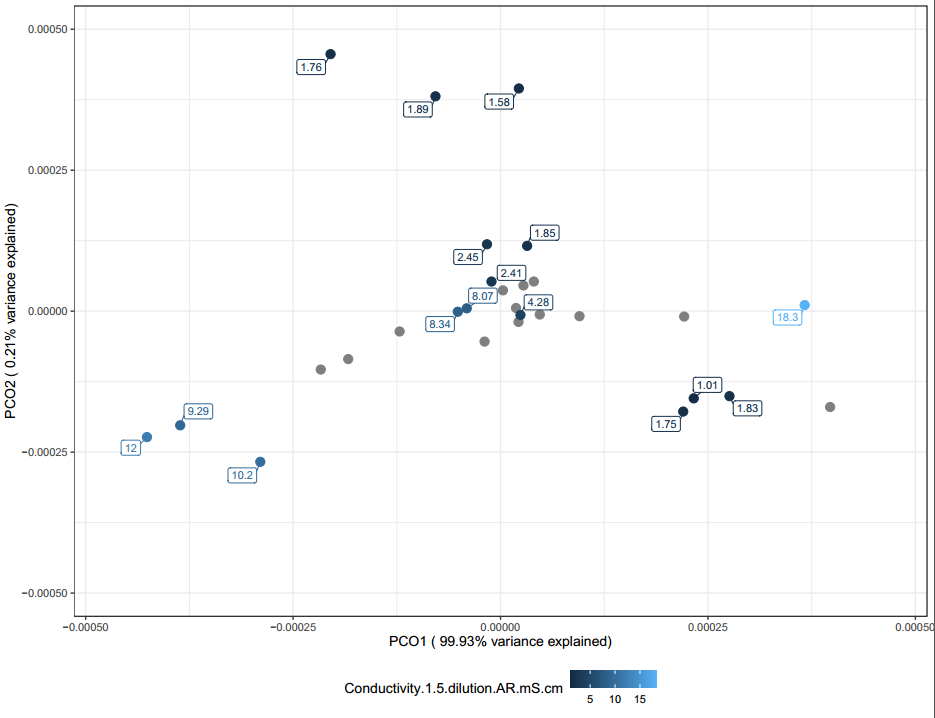
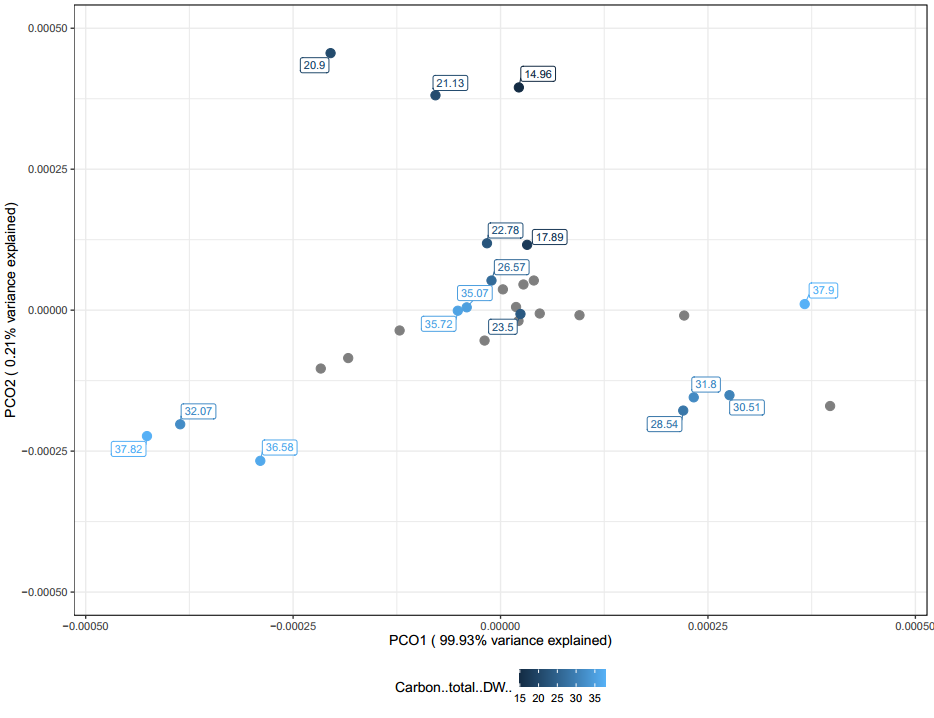
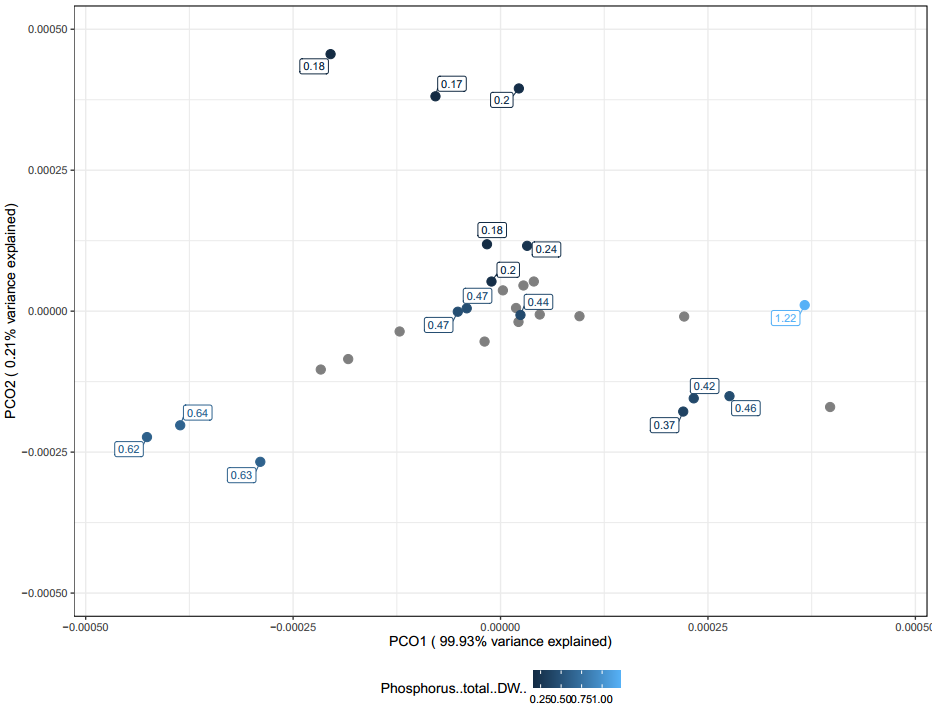
It is likely these chemical differences are a large driving difference in the microbial communities found in the vermicompost, however far more samples are needed to confirm this observation. Overall, these PCoAs lend credibility to the fact that one might be able to tailor their vermicompost communities by modifying it's chemical characteristics based on inputs used. Generally, they also demonstrate that when samples have sequencing replicates they clustered with their replicates. This means that vermicompost can be homogenous and potentially each producer is making a somewhat unique, but consistent community overtime.
Research outcomes
Education and Outreach
Participation summary:
At the beginning of the project, each producer was contacted over the phone to discuss their vermicompost operation and which samples for DNA sequencing would be most beneficial for research as well as their operation/business. About 0.5-1 hr was spent with each producer discussing how and what to sample. While time consuming given there was about 25 producers, we learned a lot and got to understand them and their operation on a more personal level.
Personal consultations and discussions were conducted over the phone, blog, and email ranging from topics of DNA sequencing, microbiology, new technology for vermicomposting, and best testing practices and labs. These producers have many great research ideas in which DNA sequencing technology can be used to further their own research endeavors. So far one letter of support has been written to this end for an NSF grant.
Most of the education and outreach was done via the project blog: vermimicrobiomeproject.com. While waiting for sequencing data, a series of lessons on microbial ecology was made. These lessons covered the basics of diversity and the fundamentals behind the science that makes this technology possible. Project progress, as well as an introduction to academic literature, has also been logged there throughout the 2 years of the project. There are currently 83 subscribers to the blog and a total of 681 page views.
While the initial part of the project was meant to be decentralized, COVID has caused the NC State vermicomposting conference to be cancelled for 2020 and 2021. I tried to help put together and help organize a virtual NC State conference with Rhonda Sherman but with COVID resurging it was cancelled both in persona and virtually. The 2022 NC State Vermicomposting conference was recently announced in which we plan to attend. We hope to have a presentation to share our findings and interact with many of the participants on a more personal level. The project poster will also be presented at the Front Range Microbiome Symposium at Colorado State University in Fort Collins on April 15th 2022.
A virtual interview of Dr. Jones was conducted by Steve Churchill of Urban Worms. A summary of the project including results and conclusions was shared with the Urban Worm Company email list of over 13,000 people world wide including 9,500 domestically.
Education and Outreach Outcomes
Overall, I think the project approach is great. Both the research and outreach greatly benefit from a community based scientific approach. By sampling from a large community of vermicompost producers, we were able to see how vermicomposting methods, inputs, and the final product compared.
Given the size of the participant group, I think the blog was a great way to communicate project status and results. It also gave a place for vermicomposters to ask questions and communicate with each other. However, I feel this aspect was lacking and perhaps could be improved through the creation of a blog form. Hopefully, the 2022 NC state vermicomposting conference provides an opportunity to interact in person with most producers.
In the future, I would modify how producer metadata was collected. An online questionnaire would be much easier to collect data vs transcribing into a spreadsheet. It would also greatly help with data consistency as many producers had to be re-emailed for clarifications.
A more in depth study on vermicompost and the teas they produce would be interesting. There are several different ways of making vermi-teas with different amendments. These variables would make for a great study using DNA sequencing.