Final report for SNE20-001-CT
Project Information
The Tri-State project was designed to increase the knowledge and skills of agricultural service providers who assist livestock producers in Connecticut, Massachusetts and Rhode Island and their engagement with producers on these issues.
Problem and Justification: Data provided by respondents to a needs assessment survey sent to our project’s listserve, feedback from the project advisory group and direct contact with many agricultural agencies/interest groups throughout the region showed that further education is desired and necessary in the areas of pasture management, soil health and manure management
Solution and Approach: Over the course of the three-year project, multiple delivery methods were used to help participants gain knowledge and skills through several learning environments. These included: classroom and field training workshops, frequent on-line correspondence, online access to all presentations, short videos, group discussions and collaboration at all workshops. Content and curricula for this project was finalized in collaboration with the project advisory group which includes agricultural service providers, representatives from the agricultural industry and interested farmers in each of the respective states. The project offered a certificate program for those interested in participating. Electronic pre and post evaluation questions helped the project director understand the knowledge level of the participants both before and after each workshop. Follow-up questionnaires administered via a Qualtrics online survey were conducted throughout the duration and after the completion of the project to quantify the number of participants who were able to utilize the knowledge and skills learned and apply it to their daily work with farmers. The project facilitator also conducted phone interviews with participants to gather evaluations.
Learning outcomes and actions: As a result of participating in at least one project workshop, 181 service providers and farmers increased their knowledge and skills in the area of pasture management for livestock production. Learning outcomes included how to create and write a grazing plan, soil health and nutrient management. Participants became proficient in understanding what comprises a grazing plan and how to write and analyze one. Additionally, they learned management practices that affect soil health, how to take a proper soil sample and read and interpret test results. Participants also acquired knowledge in on farm nutrient management, including best practices and key design elements for heavy use areas.
Every program the project hosted provided learning tools which reinforced the concepts taught. These tools included: analysis worksheets, case study scenarios, calculation exercises and fill in the blank worksheets, to name a few. Over the course of the three year project, 80 participants (service providers and farmers) who responded to the project team via annual year end follow up surveys indicated that they have utilized their acquired knowledge and skills and shared the learning tools with the producers they work with.
35 agricultural service providers who learn through the project will provide education and assistance (i.e. workshops, one-on-one consultations, articles, videos, websites, fact sheets, and project materials) regarding the recommended sustainable livestock production practices learned to 230 farmers in CT, MA and RI who manage livestock (bovine, goats, poultry, sheep, swine).
The 2017-2020 project established a solid knowledge and skills base for participants specific to the basic principles of pasture management and infrastructure. The project team members built on that momentum by, providing more advanced training and education in areas related to pasture management. These areas included soil health and manure (nutrient) management, both of which are recognized as key elements in sustainable agriculture, helping to advance environmental stewardship when managed properly. Many of the participants involved in 2017-2020 project also took part in this project, thereby further increasing their knowledge, skills and understanding of the interrelations and synergistic relationship that pasture management, soil health and manure management have on livestock production. Agricultural Need: The topics listed above were identified as a priority among those who responded to the needs assessment administered in January 2020. Results of the survey showed that nearly 50% (38) of the respondents (19 ASP) selected pasture management and infrastructure as an area that required further training. Another 45% (35) of the respondents (21 ASP) indicated that soil health and manure management was an area of necessary education. Additionally, representatives from Connecticut and Rhode Island NRCS and the Rhode Island Division of Agriculture agreed in discussions with the project director further training was necessary in both soil health and manure management. Proposed Solution: Participants increased their knowledge and skills in the area of pasture management, soil health and manure management. Participants also learned a variety of concepts and practices during the three-year period and expanded their knowledge in areas including but not limited to the creation of a grazing plan, pasture scoring, the understanding and interpretation of soil test results, the use of soil data, maps and calculators, and nutrient management plans. The project team identified two potential barriers the project could face. One of those barriers was the limited time agricultural service providers have to dedicate to the project. Many service providers find themselves with multiple responsibilities/duties, but lack of time by ASP didn’t become a reality as attendance at workshops was as expected and steady throughout the three years. The project team did record and post the workshops and presentations to the project webpage for those who couldn’t attend. Another potential barrier in this project was the distance traveled to workshops by participants. Historically, the classroom workshops were held in one central location.During and post COVID the project team moved to a virtual learning platform which was well received by participants. The field training workshops were strategically selected to help cover all geographical locations of the project, eliminating the concern for this barrier. Agricultural Service Provider Interest: This project gathered ASP from the Tri-State region including, but not limited to: Extension, NRCS, FSA, state Departments of Agriculture and animal health care professional personnel. Throughout the three-year project, the project director worked with involved participants to be sure that the project was meeting their desired training needs. The project director engaged with and talked to participants on an individual basis, both at workshops and via email and/or telephone correspondence. This connection with participants encouraged their continued engagement throughout the duration of the project.
Advisors/Cooperators
- - Technical Advisor (Educator)
- (Educator)
- - Technical Advisor - Producer
- (Educator)
- - Technical Advisor
- - Technical Advisor (Educator)
- - Technical Advisor
- - Technical Advisor (Educator)
- - Technical Advisor
- (Educator)
- - Technical Advisor
- - Technical Advisor (Educator)
- - Technical Advisor - Producer
Educational approach
This section was updated after the completion of each project year.
Recruitment
Agricultural service providers recruited for this project included University Extension faculty/staff, agricultural educators, personnel from federal and state agricultural agencies, animal health care professionals and non-profit agricultural service providers. Farmers were also welcome to participate as co-learners. Direct contact via the project’s listserv, created in 2010 and continually growing, was the primary method for recruiting beneficiaries. The Tri-State project currently has a listserv of 505 ASP and farmers from which the project recruited. Of those, 139 (78 service providers and 61 farmers) participated in at least one of the workshops conducted in 2017-2020. Some of the participants from 2017-2020 continued to play an active role in all three years of the 2020-2023 project. Others on the listserv became active participants for the first time. Secondarily, other recruitment strategies included direct telephone contact, website postings, newsletters/other appropriate publications and contacting other agricultural agencies/organizations in the Tri-State area directly. Before the conclusion of the project, ASP will be supported by being offered analysis testing (i.e. soil, fecal and forage) for the farmers they work with, subject to funding. This should provide incentive for them to apply what they have learned through the project in their work with farmers. All participants had (and will continue to have) multiple opportunities to provide feedback on topics of focus they wish to learn more about. This gives those who are actively involved an opportunity to voice their opinion ensuring their continuation of interest and participation in the project.
Education
The needs assessment and other feedback, determined the following project topics.
- Pasture Management (grazing plans, pasture scoring, soil health and manure management, carbon farming)
- Soil Health (conservation, link to climate change and manure management)
- Nutrient Management (nutrient content, planning, composting, soil testing, storage)
*Prior to the start of the 2020-2021 programming, the project team with approval from the SARE Program Coordinator made the decision to conduct all classroom programming virtually due to COVID restrictions*
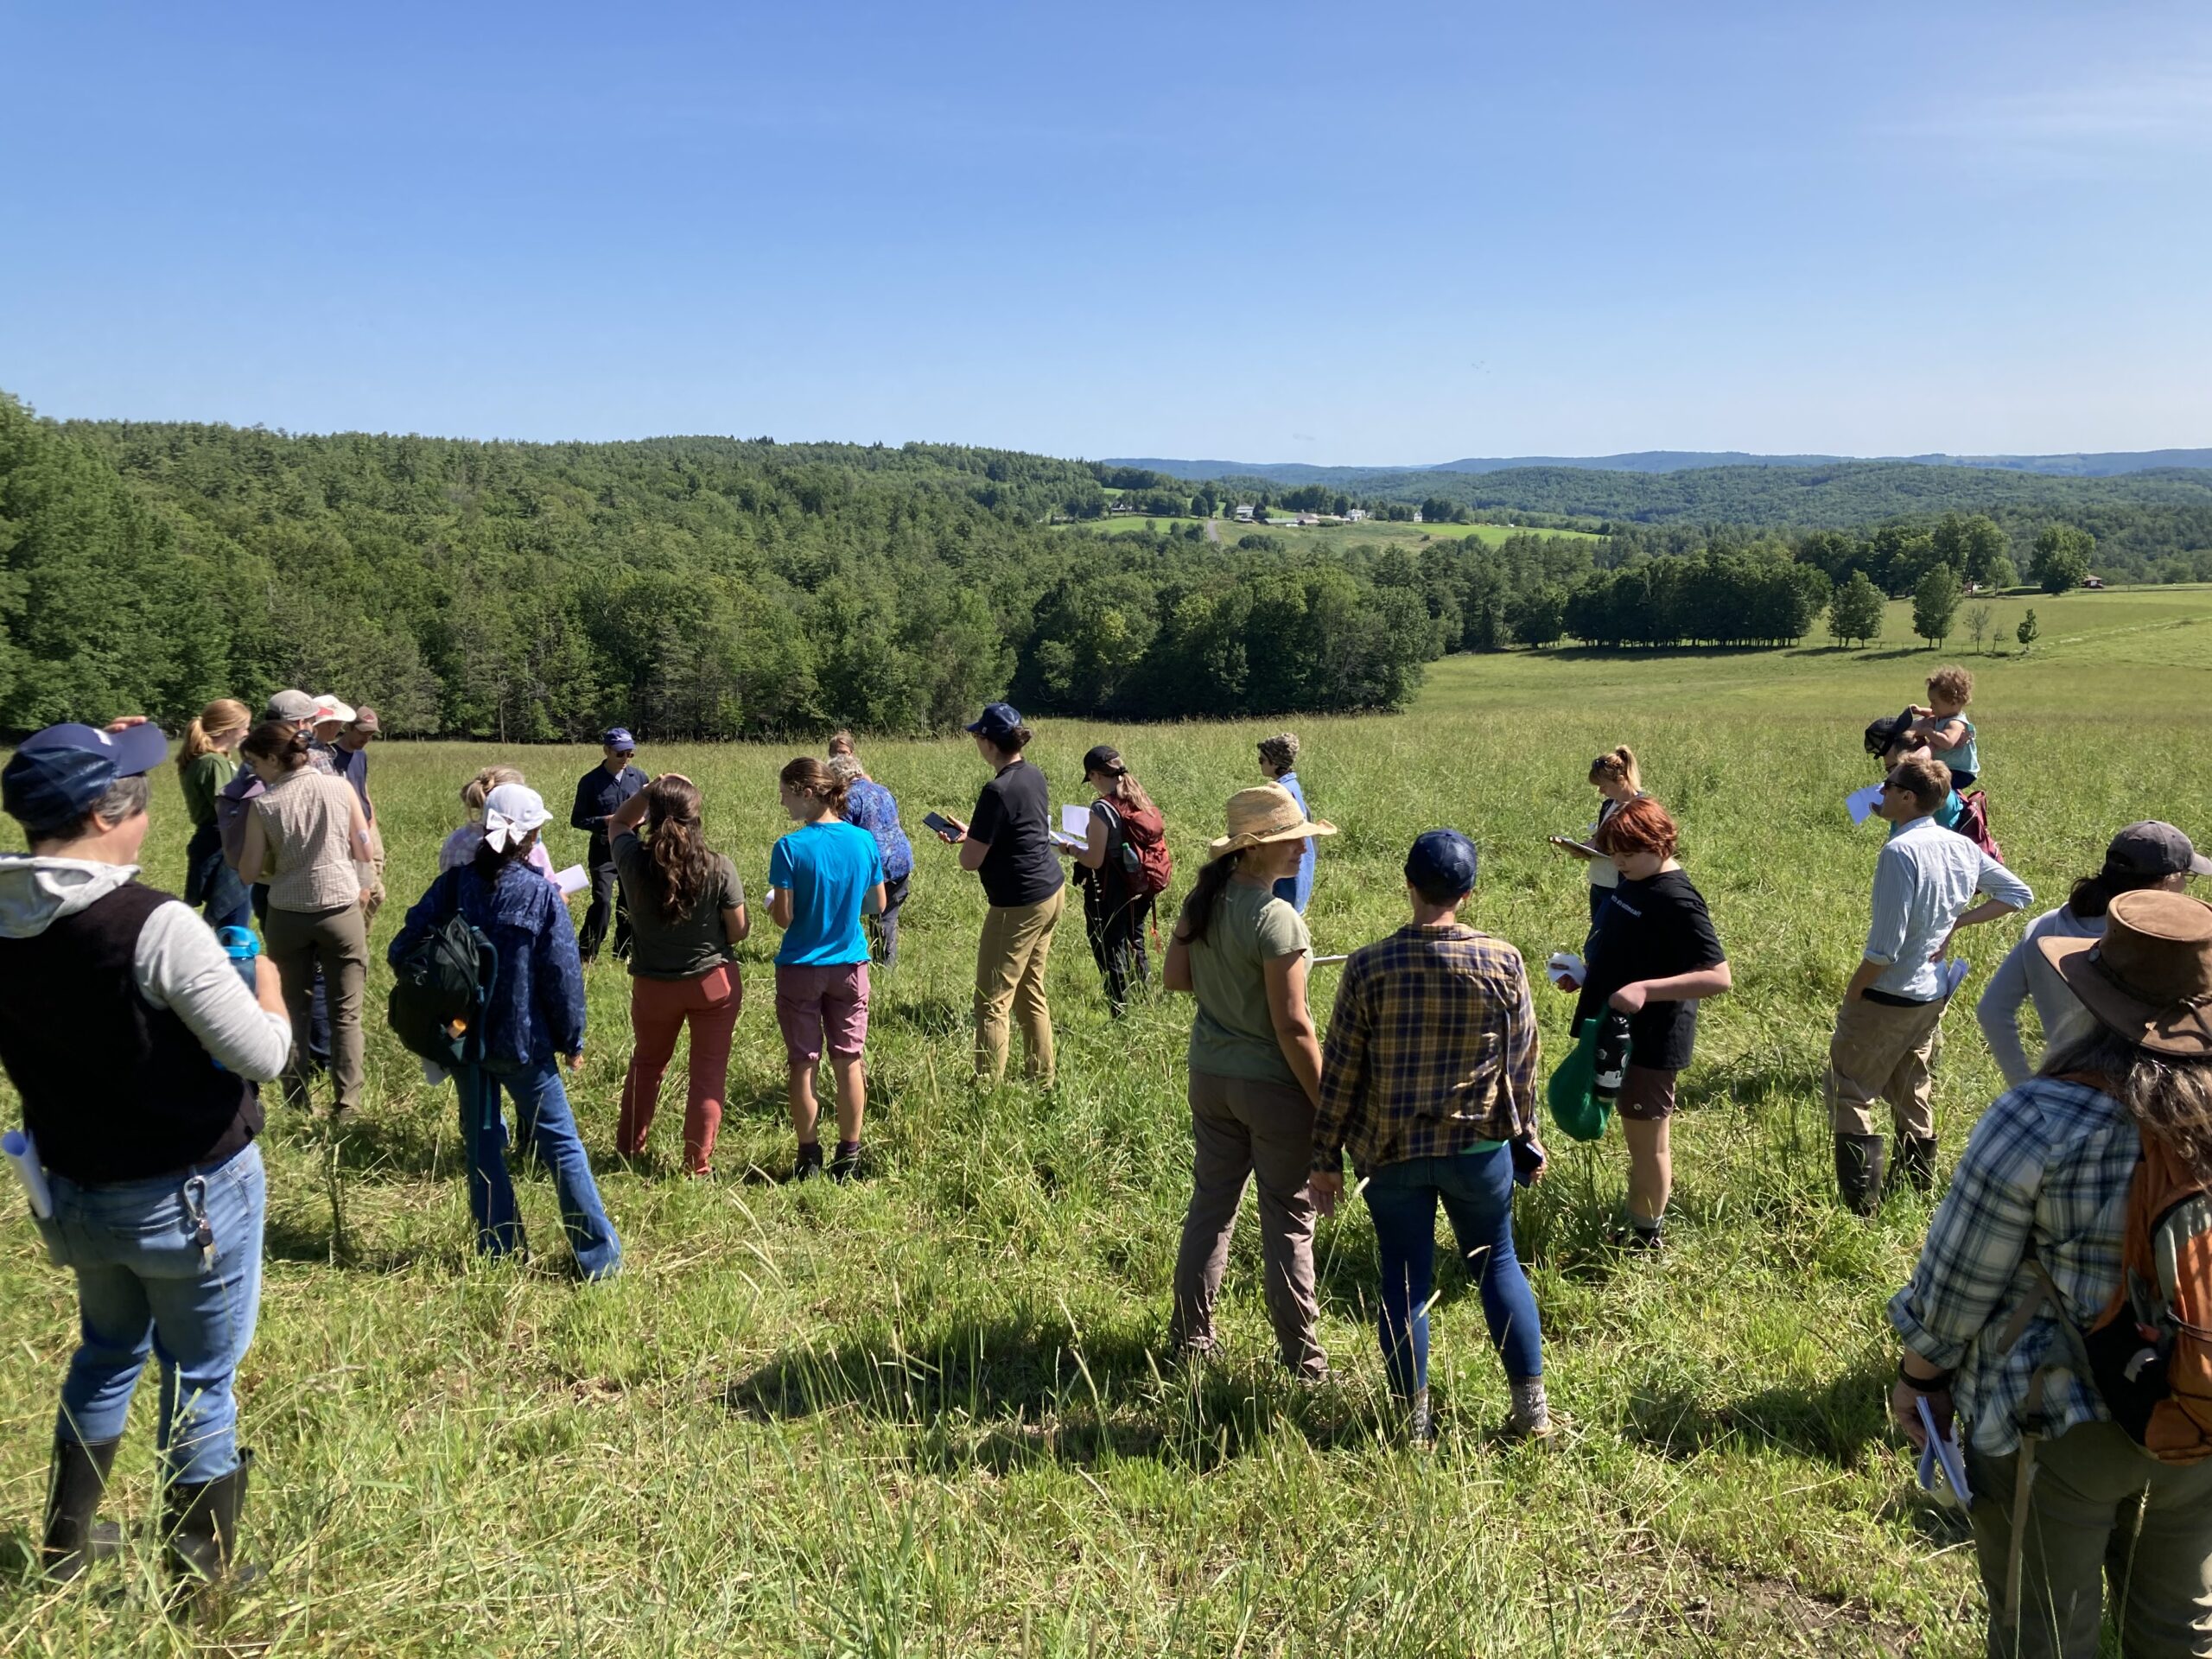
The primary educational delivery methods were through webinars and field workshops. All project programming was developed to meet the needs of ASP and farmers. Webinars were planned as a series, each session building on the next. Though they could also be attended as stand-alone workshops. Field workshops applied the concepts learned in the webinars, through a hands-on approach. The project director invited topic specialists to present. Participants were both instructors and co-learners, building their knowledge and skills in new areas. Each webinar had dedicated time for group discussion via the use of breakout rooms. They were structured and moderated giving participants time to discuss ideas for advising about content learned and developing plans to implement those ideas. The discussions allowed for service providers and farmers within the room to interact with one another and gain an understanding of each others’ perspective. A variety of adult learning strategies were employed, including but not limited to small groups working on situational scenarios. At each webinar in the first year during the breakout sessions, participants worked on a piece of their grazing plan and by the conclusion of the webinars, (if all 4 were attended) they had a created a basic grazing plan unique to their farm. The documents that were used during the breakout sessions were posted on the project website and served as a source of information for those who could not be in attendance. Each field workshop included an analysis of concepts presented in the webinars with participants given time to assess the farm and apply the concepts learned previously. The host farm understood the intention and objectives of the technical analysis and was willing to take feedback provided by participants. Participants learned the goals of the farm, and were given time to assess the farm and provide the farmer with feedback and recommendations. This allowed for co-learning in a team setting, further discussion and application of the concepts learned. On-going communication with participants was maintained monthly via email, allowing them to share questions, challenges and successes of implementing concepts learned, if they were so inclined. Videography was used to enhance the project programming of the field workshops during year 1. The field workshops were either a hybrid situation or held virtually. Since programming was held virtually for the most part, participants did not receive a binder that would allow them to keep all information from the project. All presentations from the workshops were posted on the project website to serve as a reference and to enable others to learn. Consistent and regular communication with the group facilitated a community of learning and enabled the formation of a cohort of Tri-State service providers allowing for cross-border networking and collaboration.
Verification
The project director gathered information and was able to assess baseline knowledge and skills, verify participants learning and identify their needs for additional learning at each program. A series of pre and post evaluation questions administered electronically at the beginning and end of each workshop was conducted via Slido. A Qualtrics online survey was distributed 4 to 6 months after the completion of the training workshops in the first year and will be done in subsequent years as well. Every participant attending at least one of the workshops conducted received the follow-up survey. The survey was designed in such a way to present questions to each participant based on the program(s) they attended. This survey verified how well the participants were able to follow through in applying the knowledge and skills learned to teach and advise farmers. They also had the opportunity to share any comments/thoughts they had on the workshops and made suggestions for future programming. The project offered a certificate program for participants. The program required the participant to attend all webinars and at least one field training workshop each year. In order to earn the certificate, after the completion of the yearly workshops, each participant had a phone conversation with a member of the project team, discussing how they have applied the skills and knowledge learned to their everyday work. They shared information on how many farmers they have worked with in regard to what they have learned as a result of this project and what educational tools they used when providing the training and education.
Milestones
Every January, 450 unique individuals (agricultural service providers and farmers) receive an announcement describing the classroom workshops planned for the Tri-State SARE professional development project (one announcement per year, 3 in total for the project). The announcement includes an invitation to provide feedback to the Project Director and the opportunity to register for one or all of the classroom workshops to be held that year. Moving forward throughout the project year, planned workshops will be promoted and advertised on the project website (https://livestock.extension.uconn.edu/) and with the help of agricultural service provider organizations/groups and publications.
450
January 31, 2023
Completed
January 16, 2023
January 2021 - First Year
An announcement, showcasing the 2021 winter webinar series was distributed to 484 service providers and farmers on the Tri-State SARE mailing list in January. This announcement was also sent to agricultural service provider groups and organizations throughout the region. The recipients were invited to look at the project website for more information and encouraged to use the link provided to register for the webinars.
January 2022 - Second Year
An announcement, showcasing the 2022 webinar series was distributed to 521 service providers and farmers on the Tri-State SARE mailing list in January. This announcement was also sent to agricultural service provider groups and organizations throughout the region. The recipients were invited to look at the project website for more information and encouraged to use the link provided to register for the webinars.
January 2023 - Third Year
An announcement, showcasing the 2023 webinar series was distributed to 581 service providers and farmers on the Tri-State SARE mailing list in January. This announcement was also sent to agricultural service provider groups and organizations throughout the region and disturbed to the project advisory committee for dispensation through their channels. The recipients were invited to look at the project website for more information and encouraged to use the link provided to register for the webinars.
Each year, a series of three half day classroom training workshops will be held in a central location to the Tri-State region (3 workshops per year, 9 in total for the project). The project director will invite content area specialists to these workshops, allowing participants to increase their knowledge and skills in the area of soil health and manure management as they relate to grazing management. This milestone will be attended by single attendees who may participate in multiple workshops.
225
July 31, 2023
Completed
April 19, 2023
First Year (2020-2021)
*Prior to the start of the 2020-2021 programming, the project team with approval from the SARE Program Coordinator made the decision to conduct all classroom programming virtually due to COVID restrictions*
The project hosted a winter webinar series (4 in total) on the topic of creating (writing) a simple grazing plan. The Project Director invited 4 content area specialists from across the Northeast to be a part of the series, all of whom participated in at least 2 of the webinars. This helped in keeping consistency and continuity throughout the series. Many participants were a part of more than one webinar (47 of the 60 participants total attended at least two of the four webinars). The Tri-State SARE project collaborated with the New England Grazing Network (funded through the Cedar Tree Foundation) on the series. The Network's Project Coordinator was a part of all 4 webinars and offered one on one follow up support for those who attended the webinar(s).
The first webinar (Introduction to the development of a simple grazing plan) was held on February 19th. 25 ASP and 25 farmers attended. 47 (94%) participants completed the 'on-site' evaluation. Initially, 27 (57%) participants reported having minimal knowledge of the components of a grazing plan. At the end of the webinar 20 (43%) reported having moderate knowledge while another 10 (21%) noted they had considerable knowledge. 36 (77%) participants indicated they had either minimal or moderate understanding of how to develop their grazing plan goals prior to the start of the webinar. 31 (66%) said they had either moderate or considerable understating of goal development after the webinar. 25 (53%) participants indicated they they plan to integrate the information learned into their work, while only 1 (.02%) said they have no plans to use the information.
The second webinar (Grazing plan calculations) was held on March 10th. 25 ASP and 18 farmers attended. 38 (88%) participants completed the 'on-site' evaluation. 26 (68%) participants indicated they had minimal to moderate understanding of the forage calculations that needed to be worked through when developing a grazing plan while 9 (24%) had no knowledge of the calculations. At the conclusion of the webinar zero (0) participants reported having no knowledge of the calculations while another 29 (76%) reported having moderate to considerable knowledge. Only 2(.05%) participants indicated having considerable understanding of a forage balance sheet prior to the start of the webinar. By the end of the webinar 18 (47%) participants indicated they had considerable understanding.
The third webinar (Integrating fence and water infrastructure) was held on March 23rd. 22 ASP and 15 farmers attended. 30 (81%) participants completed the 'on-site' evaluation. 7 (19%) participants indicated having non existent understanding of the topics that would be covered during the webinar. By the conclusion of the webinar, zero (0) respondents reported having non existent understanding of any of the topics. Only 2 (.05%) attendees had previously integrated these topics into their work prior to the webinar while another 20 (54%) indicated that they plan to integrate the topics into their work.
The fourth webinar (Refining your grazing plan) was held on April 6th. 20 ASP and 11 farmers attended. 27 (87%) participants completed 'on-site' evaluations via the use of Slido. 16 (52%) participants indicated they had moderate to considerable understanding of the value in monitoring and assessing their grazing plan at the start of the webinar. At the conclusion, 30 (97%) participants indicated they had moderate to considerable understanding of the value in assessing their grazing plan. Only 2 (.06%) attendees had previously integrated these topics into their work prior to the webinar while another 14 (45%) indicated that they plan to integrate the topics into their work.
Second Year (2021-2022)
It was decided to continue these half day training sessions virtually as they have been done since COVID. This delivery method has proven just as effective in teaching the concepts while still allowing for interaction and discussion. In fact, a larger group of participants (covering an even larger geographical footprint) have been able to participate because of the virtual setting.
The project hosted a webinar series on the topic of soil health as it relates to pastured livestock production. The Project Director invited 5 content area specialists to be a part of the series. Roughly half of the participants were a part of more than one webinar (29 of the 57 participants total attended at least two of the three webinars).
The first webinar (Assessing soil health) was held on February 15th. 22 ASP and 9 farmers attended. 17 (55%) participants completed on site evaluations via the use of slido. Prior to the start of the webinar, 9 (56%) of participants indicated they had a minimal understanding of reading and interpreting Cornell’s Comprehensive Soil Health Assessment (CASH) report. Another 5 (31%) had moderate knowledge while only 2 (16%) indicated they had considerable knowledge. By the end of the webinar (which included a breakout session focusing on this topic) 9 (53%) indicated they have moderate knowledge while another 8 (47%) said they had considerable knowledge in reading and interpreting the report. 15 (88%) of participants have either integrated the topics of the webinar into their work or plan to integrate it moving forward. 8 (47%) provided an action step they planned to take as a result of attending the webinar.
The second webinar (The value of soil health: soil, plant and animal interactions) was held March 22nd. 25 ASP and 13 farmers attended. 21 (55%) completed on site evaluations via the use of slido. 17 (81%) participants said they had either no understanding or minimal understanding of how low soil respiration coincides with the summer slump. By the end of the webinar, 18 (94%) reported having moderate to considerable knowledge of this while only 1 (5%) still had a minimal understanding. 7 (37%) participants had already incorporated the topics into their daily work while 19 (58%) plan to incorporate the topics learned into their daily work moving forward. 10 (53%) participants listed an action step they plan to take as a result of attending the webinar.
The third webinar (Creating positive soil health change) was held April 19th. 20 ASP, 11 farmers and 1 student attended. 25 (78%) completed on site evaluations via the use of slido. 21 (84%) participants indicated they had a minimal to moderate understanding of the positive effect that dung beetles have on soil health which another 3 (12%) said they had no understanding. After the webinar, 7 (37%) reported they had considerable knowledge and 0 participants reported that they had minimal to no understanding. At the beginning of the webinar, 1 (4%) participant indicated they had no understanding of how winter management practices could affect soil health. 11 (44%) participants had a minimal understanding and another 11 (44%) had a moderate understanding. Only 2 (8%) participants had a considerable understanding. By the end of the webinar all participants indicated they had either a moderate (12, 60%) or considerable (8, 40%) understanding. 20 (95%) said that they have already started or plan to integrate some of the topics learned into their daily work. 12 (60%) of participants listed an action step they planned to take as a result of attending the webinar.
Third Year (2022-2023)
The project hosted a webinar series (3 webinars in total) on the topic of nutrient management as it relates to pastured livestock production. The Project Director invited 5 content area specialists to be a part of the series. There were 49 unique individuals who participated in at least one of the three webinars. 22 (45%) of the participants were a part of more than one webinar and 13 (27%) attended all three webinars.
The first webinar (Principles of Nutrient Management) was held on February 22nd. 23 ASP and 4 farmers attended. 18 (67%) participants completed on site evaluations via the use of slido. Prior to the start of the webinar, 10 (56%) participants indicated that they had minimal understanding of the data that is needed to estimate whole farm mass balances while another 3 (17%) indicated their understanding was nonexistent. By the end of the webinar, 15 indicated they had moderate (39%) or considerable (44%) understanding of the data that is needed to estimate whole farm mass balances. 14 (78%) have either integrated the topics of the webinar into their work or plan to integrate it moving forward. 9 (50%) participants provided an action step they planned to take as a result of attending the webinar.
The second webinar (Integration of Pasture Management and Nutrient Management) was held on March 15th. 23 ASP and 5 farmers attended. 18 (64%) participants completed on site evaluations via the use of slido. This webinar focused on the affects that grazing management has on nutrient distribution in a pasture as well as heavy use areas. Prior to the start of the webinar, 3 (17%) participants indicated their knowledge of the difference between stocking rate and stock density was nonexistent while another 6 (33%) said they had minimal knowledge in this area. By the end of the webinar 15 (83%) indicated they had either moderate (7) or considerable (8) knowledge of the difference, while 0 participants indicated they had a nonexistent understanding. Prior to starting, 7 (39%) participants indicated that they had no knowledge (1) or minimal knowledge (6) of the key design elements of a heavy use area. After the webinar, which contained a presentation and breakout session on the topic of heavy use areas 0 participants indicated they had no or minimal knowledge on the topic. 11 (61%) indicated they had moderate knowledge and 6 (33%) indicated they had considerable knowledge. 14 (78%) have either integrated the topics of the webinar into their work or plan to integrate it moving forward.
The third webinar (Nutrient management decision making based on soil testing) was held on April 19th. 24 ASP and 5 farmers attended. 19 (66%) participants completed on site evaluations via the use of slido. This webinar focused on reading and interpreting soil test results and determining nutrient sources within a pasture system. Prior to the start of the webinar, 1 (5%) participant indicated they had no knowledge of reading/interpreting soil nutrient analysis results while another 5 (26%) indicated they only had minimal knowledge. By the end of the webinar 12 (63%) indicated they had a moderate level of knowledge and another 6 (32%) indicated they had considerable knowledge. Similar findings were seen when participants were asked about their knowledge of the variety of nutrient sources that can be incorporated into a pasture based system. 1 (5%) participant indicated they had no knowledge while another 5 (26%) indicated they only had minimal knowledge. By the end of the webinar 9 (47%) indicated they had a moderate level of knowledge and another 8 (42%) indicated they had considerable knowledge. 18 (95%) have either integrated the topics of the webinar into their work or plan to integrate it moving forward. 7 (37%) participants described an action step they plan to take as a result of attending.
At each classroom workshop, participants will engage in group discussions (3 in total for the year, 9 in total for the project). By the end of the discussion, participants (as a group) will generate ideas and develop a list of steps that can be taken to teach and advise farmers as a result of the knowledge acquired and skills learned during the workshop. The farmers will be asked to determine what of the concepts learned can apply to their own situation. This milestone will be attended by single attendees who may participate in multiple workshops.
225
July 31, 2023
Completed
April 19, 2023
First Year (2020-2021)
Each webinar consisted of instruction and time for interaction and collaboration among participants. Because the meeting was held virtually, the group discussion that would have occurred if the workshops were in person became breakout room sessions. Each webinar had 1-2 breakout sessions. These sessions were led by moderators who were part of the project team and/or the content area specialists who were invited to be speakers. The sessions, which consisted of 5 to 8 participants in each, worked through exercises that helped reinforce the content taught. By the end of the 4 webinar series, participants worked through all of the basic steps to create a simple grazing plan. The participants were also asked after each webinar via a post evaluation what action step(s) they planned to take as a result of attending the webinar.
Second Year (2021-2022)
Each webinar consisted of instruction and time for interaction and collaboration among participants. The virtual breakout sessions worked well in the first year, so the same structure was maintained in year 2. Each webinar had 2 breakout sessions (6 total for the year). These sessions were led by moderators who were part of the project team, recruited by the project director and/or the content area specialists who were invited to be speakers. The sessions, which consisted of 5 to 8 participants in each, either worked through exercises that helped reinforce the content taught or allowed time for discussion and opportunity to have specific questions answered. The participants were also asked after each webinar via a post evaluation, a series of questions to understand how much was learned and what action step(s) they planned to take as a result of attending the webinar (see milestone 2 for questions asked and participant responses). Some examples of the worksheets that were used in the breakout sessions are available to look at here: breakout session 2 worksheet Breakout session 2- case study Breakout session worksheet
Third Year (2022-2023)
Each webinar consisted of instruction and time for interaction and collaboration among participants. There were 2 breakout sessions (6 total for the year) in each. These sessions were led by moderators who were part of the project team, recruited by the project director and/or the content area specialists who were invited to be speakers. The sessions, which consisted of 5 to 8 participants in each, either worked through exercises that helped reinforce the content taught or allowed time for discussion and opportunity to have specific questions answered. The participants were also asked after each webinar via a post evaluation, a series of questions to understand how much was learned and what action step(s) they planned to take as a result of attending the webinar (see milestone 2 for questions asked and participant responses). Some examples of the worksheets that were used in the breakout sessions are available to look at here: 2023 SARE field workshop flyer breakout session 1 - grazing calculations breakout session 2 - moderator slides
Every April, 450 unique individuals (agricultural service providers and farmers) receive an announcement describing the field training workshops planned for the Tri-State SARE professional development project (one announcement per year, 3 in total for the project). The announcement includes an invitation to provide feedback to the project director and the opportunity to register for one or all of the field workshops to be held that year. Moving forward throughout the project year, planned workshops will be promoted and advertised on the project website (https://livestock.extension.uconn.edu/) and with the help of agricultural service provider organizations/groups and publications.
450
April 30, 2023
Completed
May 15, 2023
First Year (2020-2021)
An announcement, showcasing the 2021 field webinars (2 in total) was distributed to 505 service providers and farmers on the Tri-State SARE mailing list in July. This announcement was also sent to agricultural service provider groups and organizations throughout the region. The recipients were invited to look at the project website for more information and encouraged to use the link provided to register for the webinars.
Second Year (2021-2022)
A soil trailer tour announcement, showcasing the 2022 field workshops (5 in total in collaboration with other organizations in the region including AFT, UMass, and Rhode Island Farm Bureau) was distributed to 512 service providers and farmers on the Tri-State SARE mailing list in April. This announcement was also sent to agricultural service provider groups and organizations throughout the region. The recipients were invited to look at the project website for more information and encouraged to use the link provided to register for the webinars.
Third Year (2022-2023)
An announcement, (2023 SARE field workshop flyer) showcasing the 2023 field workshops (2 in total, one planned in collaboration with AFT) was distributed to 586 service providers and farmers on the Tri-State SARE mailing list in May. This announcement was also sent to agricultural service provider groups and organizations throughout the region. The recipients were invited to look at the project website for more information and encouraged to use the link provided to register for the webinars.
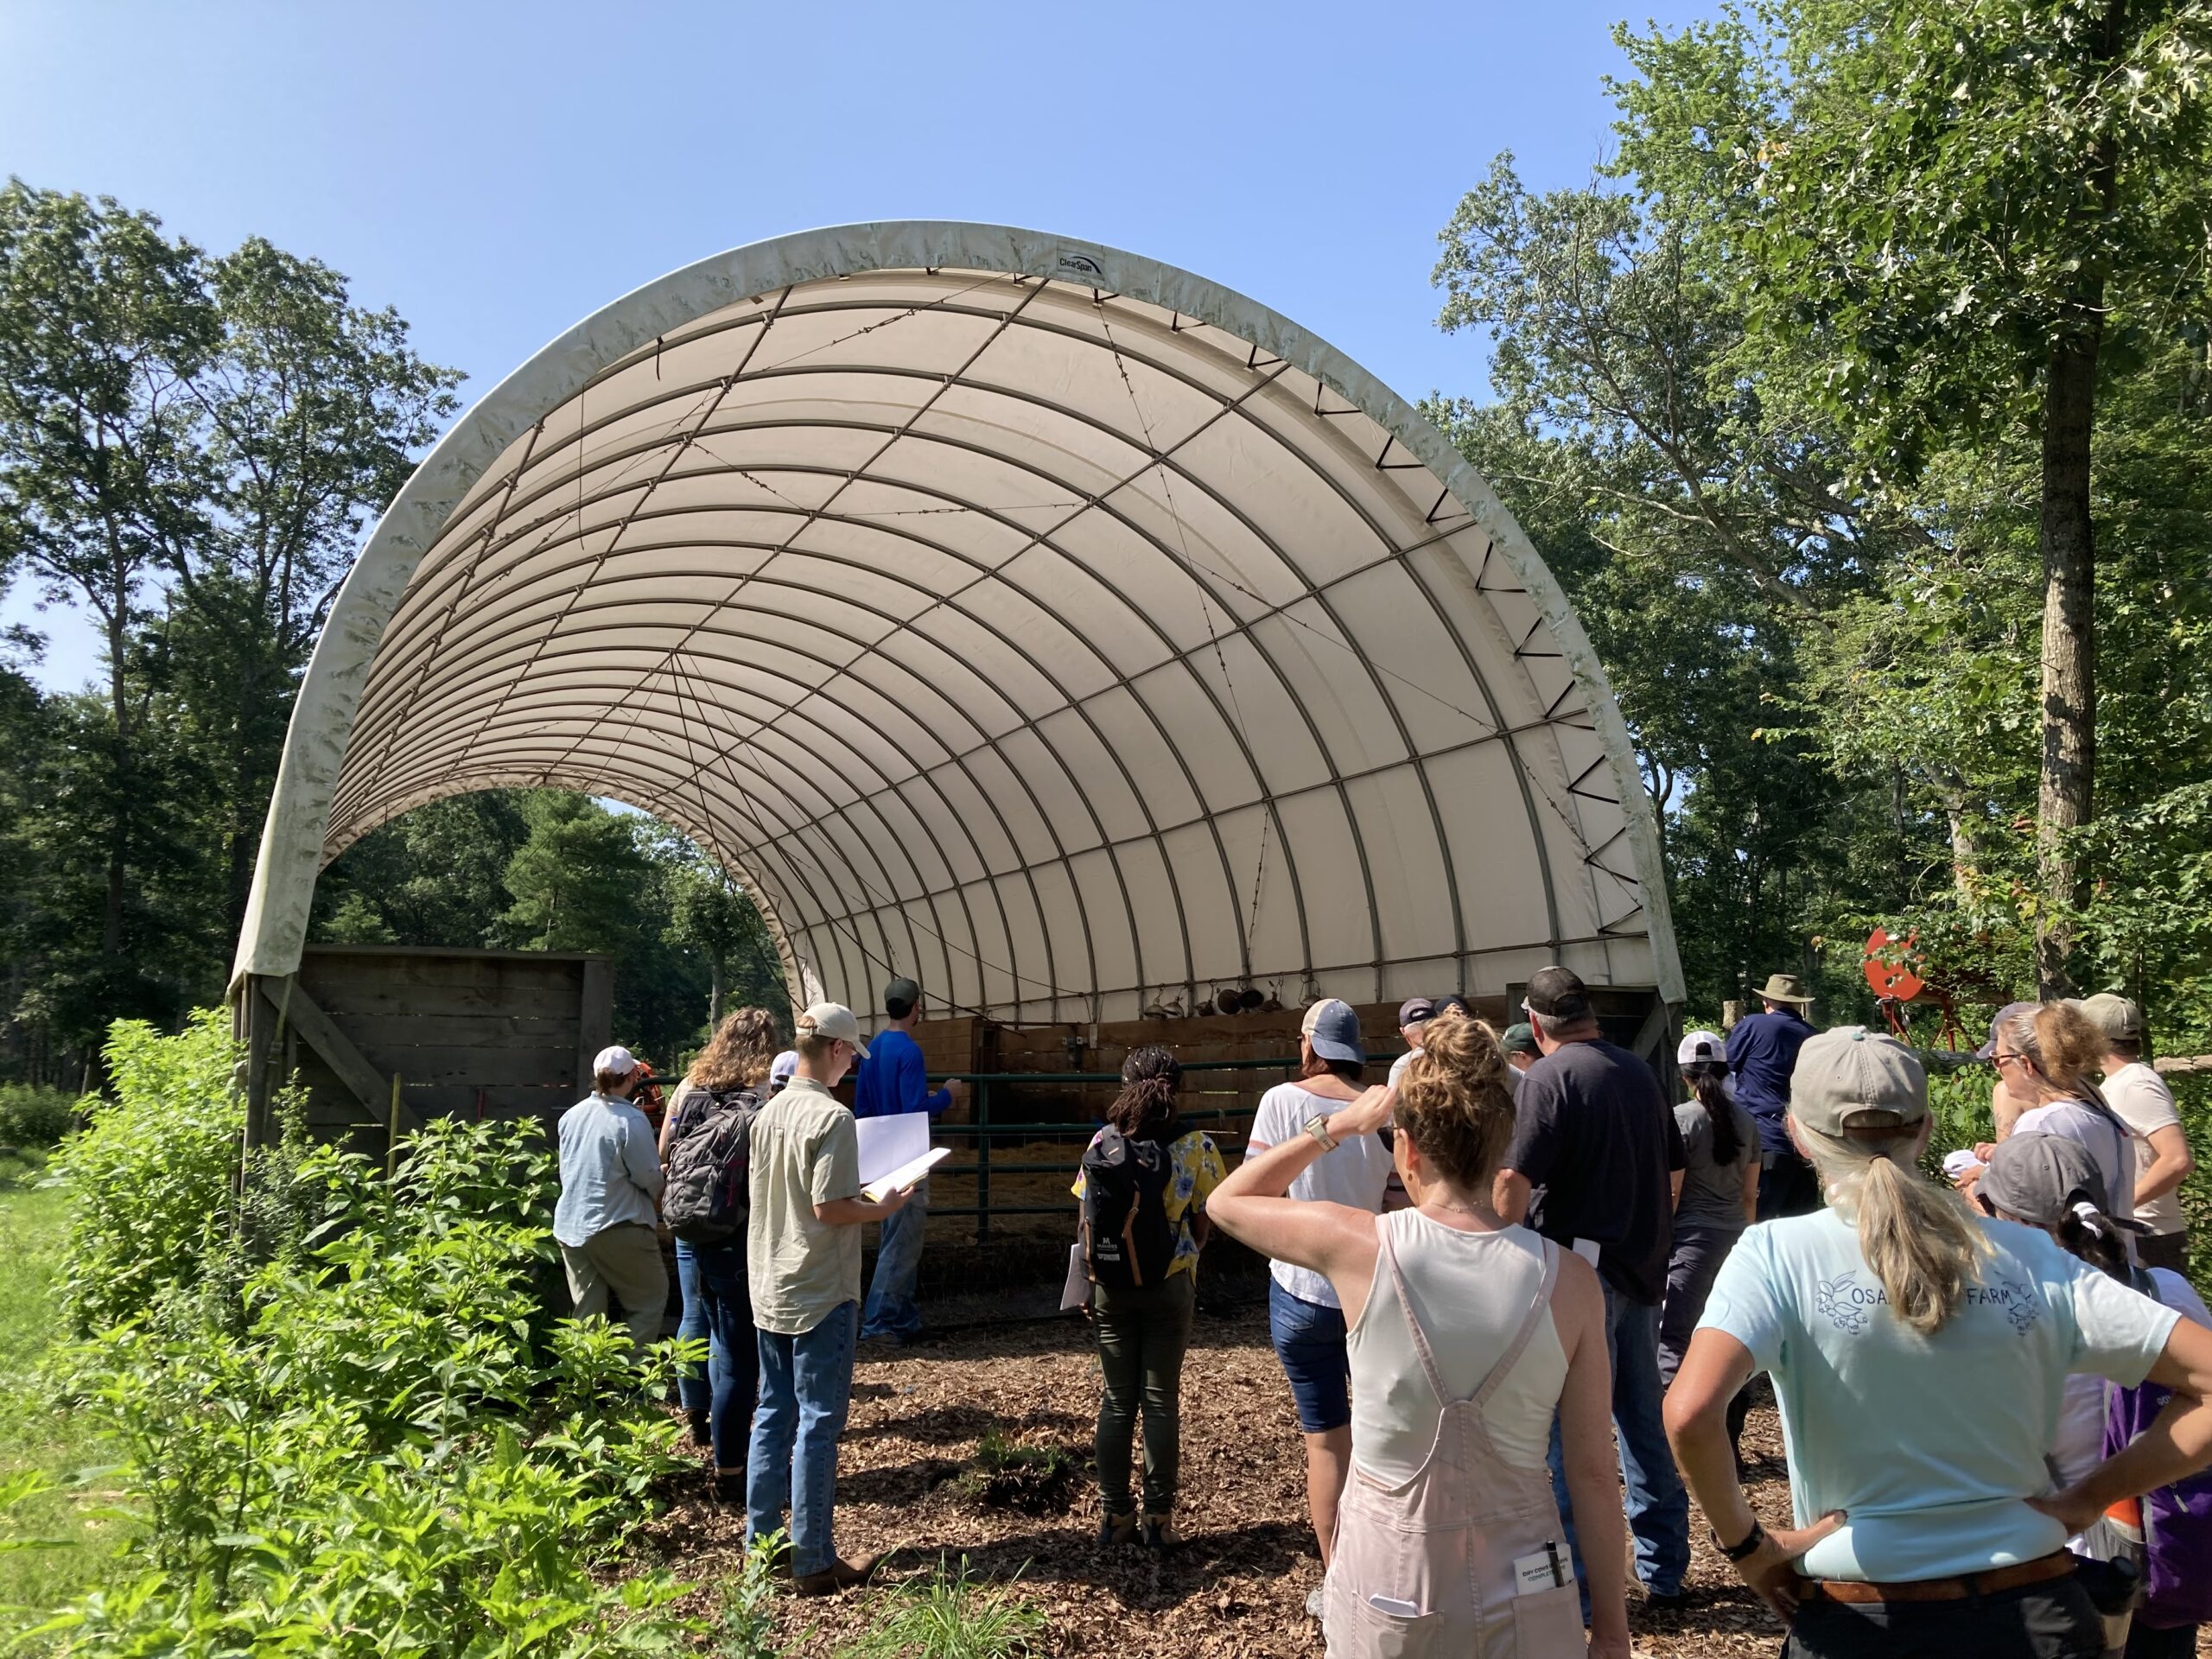
Each year, two half day field training workshops will be held (2 workshops per year, 6 in total for the project). These workshops will highlight the recommended practices taught in the classroom training workshops. To the best of the project director’s ability, these workshops will be planned and hosted by a farmer who is also a participant in the project, working to implement the concepts learned throughout the classroom workshops. These workshops will allow for continued learning and further discussion about the topic and concepts learned in the classroom. This milestone will be attended by single attendees who may participate in multiple workshops.
90
August 31, 2023
Completed
July 06, 2023
First Year (2020-2021)
*The project team with approval from the SARE Program Coordinator made the decision to conduct all field programming virtually due to COVID restrictions*
The project hosted 2 virtual field training workshops. The first webinar, held on August 11th, covered pasture assessment and looked specifically at the use of the Pasture Condition Scoring (PCS) method. 12 ASP and 11 farmers attended. 7 (30%) participants completed the 'on-site' evaluation. At the conclusion of the workshop, 5 (22%) noted that they had considerable understanding of the value in assessing a pasture, while only 1 (.04%) noted that at the start of the workshop. 6 of the 7 (86%) participants mentioned they already do or plan to integrate what they learned into their daily work. The second webinar was held on August 25th. 10 ASP, 6 farmers and 11 high school Vo-Ag students attended. 12 (75%) participants completed the 'on-site' evaluation. Initially, 6 (38%) participants noted they had minimal knowledge in the aspects of a grazing plan that should be considered when assessing grazing management. In the post evaluation, zero (0) participants noted they had minimal knowledge while 6 (38%) noted they had considerable knowledge in the aspects to consider when assessing grazing management. 9(56%) participants said they plan to or have already started using the information learned during the webinar in their daily work. The webinar, titled Grazing Management Analysis, was meant to be a direct follow up to the winter webinar series allowing participants to analyze and provide direct feedback to the farmer with regard to their grazing plan/management. In an effort to bring the field to the participants, both webinars included a 15 minute pre-recorded video that the SARE project staff created with the help of a professional videographer. The video created for the pasture assessment webinar was filmed in front of a live audience allowing those attending (9 in total) to participate in real time. The final videos were not only used during the webinar but were also made available on the project website. Each webinar also contained pre and post evaluation questions as a way to measure the knowledge and understanding of the participants before and after the webinar.
Second Year (2021-2022)
The project collaborated with several other organizations (AFT, UMass and Rhode Island Farm Bureau) in the region to host a soil trailer tour featuring the Cornell Soil Health Trailer. The week long tour included 5 workshops in 4 states around New England. A total of 140 people participated. The tri-state SARE project hosted the workshop that took place in Somers, CT on June 24th (21 people attended). Please note, the 119 (140-21) people who attended one of the 4 other soil trailer workshops are included as 'other' in the beneficiaries chart under milestone activities and participant summary further down in this report. All the organizations involved utilized the same registration form and set of evaluation questions. The responses from all 5 workshops were then input into one document for all groups to see and utilize. This was especially important for our project which covers three of the four states that hosted a workshop. Many people who have participated regularly in the tri-state SARE project workshops and webinars participated in one of the three other workshops that were held in both MA and RI. 78 (56%) participants completed the 'on-site' evaluation. Initially, 33% noted they had minimal or nonexistent (6%) knowledge and understanding of soil health concepts. At the conclusion of the workshop, all 78 respondents indicated they had either considerable (38%) or moderate (62%) knowledge and understanding of the soil health concepts discussed. All (100%) participants indicated that the hands on demonstrations made the concepts easier to understand. 65% of the respondents indicated an action step they planned to take as a result of attending and/or specified what further training they would participate in with regard to soil health.
Third Year (2022-2023)
The project hosted 2 field training workshops in MA and RI. The MA workshop was held in collaboration with American Farmland Trust (AFT). Both workshops focused on the nutrient management concepts covered in the winter webinar series. Content area specialists as well as the farmers were speakers.
The first workshop was held at Wheel View Farm in Shelburne MA on June 22nd. 26 people attended- 21 ASP, 4 farmers and 1 student. The focus was on nutrient management of pastured beef cattle. Several pastures were toured as well as the sacrifice area. Soil tests were taken in advance so that they could be discussed at the workshop. An on-farm analysis worksheet, created by the project director was used by participants to help organize thoughts and jot down notes. At the conclusion of the workshop, participants engaged in discussion that helped reinforce the concepts and provide the farmer with some suggested areas for improvement as it related to nutrient management. 18 (69%) participants filled out the on-site evaluation. Initially, 17 (94%) indicated they had a minimal or moderate level of knowledge on the nutrient management concepts discussed. After the workshop, 18 (100%) indicate they had moderate or considerable knowledge. 11 (61%) said that they found the on farm analysis worksheet helpful while another 6 (33%) did not answer the question. Many chose to list an action step they plan to take as a result of attending the workshop.
The second workshop was held at Wild Harmony Farm in Exeter, RI on July 6th. 26 people attended 18 ASP, 8 farmers. The focus was on nutrient management of pastured pigs and beef cattle. Several pastures were toured including their silvopasture as well as the composting area. A on-farm analysis worksheet, created by the project director was used by participants to help organize thoughts and jot down notes. At the conclusion of the workshop, participants engaged in discussion that helped reinforce the concepts and provide the farmer with some suggested areas for improvement as it related to nutrient management. 14 (54%) participants filled out the on-site evaluation. Initially, 12 (86%) indicated they had a minimal or moderate level of knowledge on the nutrient management concepts discussed while another 2 (14%) said their knowledge was nonexistent. After the workshop, 12 (86%) indicated they had moderate or considerable knowledge, while 2 (14%) said they had minimal knowledge and understanding. 13 (93%) said that they found the on farm analysis worksheet helpful while another 1 (7%) did not answer the question. All respondents (100%) indicated that the topics covered were relevant to their daily work.
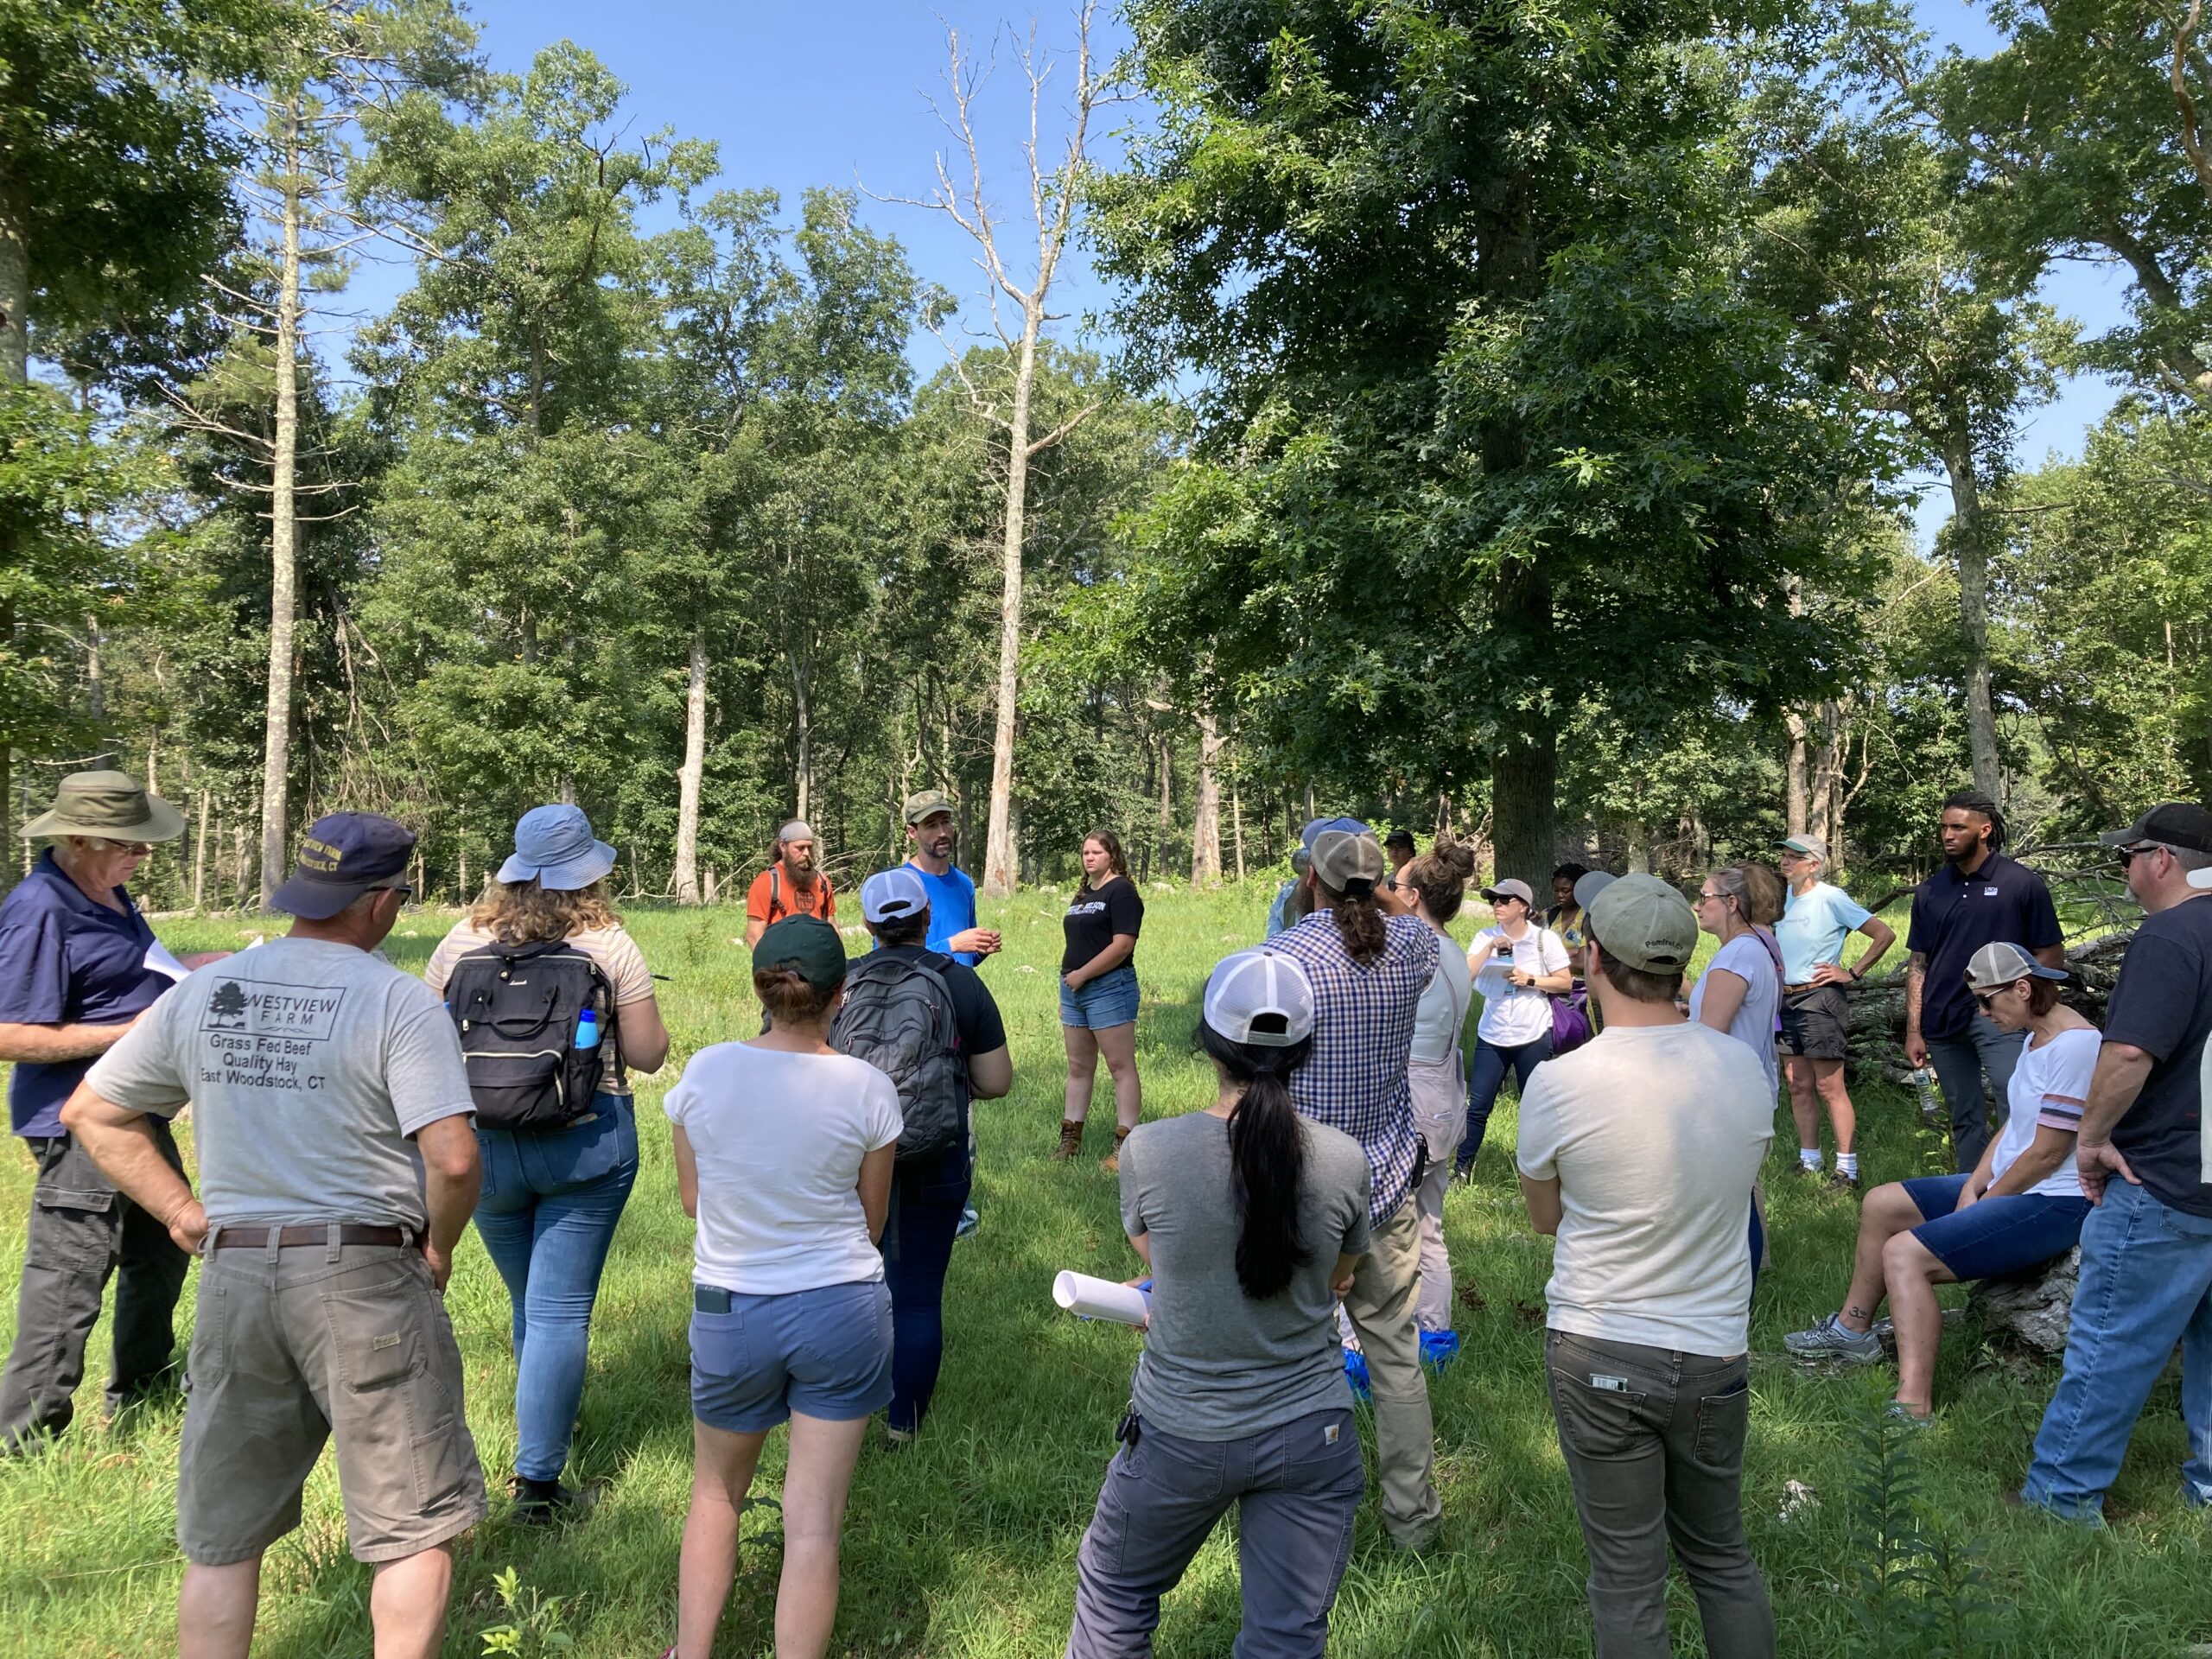
At each field workshop, participants will complete an analysis of the farm (2 in total for the year, 6 in total for the project). Prior to the end of each workshop, analyses will be shared and recommendations will be made to the host farm regarding the pasture management, soil health and manure management practices on their farm. This milestone will be attended by single attendees who may participate in multiple workshops.
90
August 31, 2023
Completed
July 06, 2023
First Year (2020-2021)
*The project team with approval from the SARE Program Coordinator made the decision to conduct all field programming virtually due to COVID restrictions*
Both field training webinars included breakout sessions to allow for discussion and reflection. During the pasture assessment webinar, participants were able to ask further questions and comment on their own situations. Some of the discussion included if they had ever assessed their own or a client's pasture and what they plan to do with the information they learned. The grazing management analysis webinar had 2 breakout sessions to allow for discussion and analysis of the farm and additionally, had time for questions and answers with the farmer. At the end of the webinar each breakout group selected a representative to present the groups thoughts and suggestions for change to the farmer.
Second Year (2021-2022)
All participants that attended the tri-state SARE project hosted workshop which took place in Somers, CT on June 24th were provided with a worksheet (worksheet for on-farm analysis SVF) at the beginning of the workshop that they could use to take notes, jot down observations and ideas to be shared with the farm owner at the end of the workshop. After watching the soil trailer demonstrations (Faye Benson, Cornell University), everyone participated in a pasture walk (Jim Hyde, CT NRCS and Joe Emenheiser, UConn Extension) which allowed them to draw upon the concepts discussed and assess the farm. Cornell Soil Health tests were performed in advance in 3 fields and results were looked at during the workshop. A 'soil your undies' experiment to look at soil microbiology was also performed in the 3 fields. The participants were encouraged to write down some things the farm is excelling in, some areas the farm can improve and some action steps that can be taken in the future. The workshop wrapped up with a 20 minute discussion with the farm owner where participants summarized their findings and offered some thoughts for how the farm can improve their soil health.
Third Year (2022-2023)
The Project Director , with the help of the host farm created a worksheet for each workshop that participants could use to organize their thoughts, take notes and jot down ideas that they could share at the end of the workshop. Each workshop wrapped up with a 15 minute discussion with the farmer to talk about the observations made. Discussion included things that the farm is excelling in and areas where the farm could improve. Participants were also able to ask questions of the content area specialists during this time. An example worksheet is linked here.
All uniquely individual project participants receive monthly updates from the project director. These updates will allow for the sharing of questions and information throughout the project and facilitate a community of learning among participants.
50
September 30, 2023
Completed
September 22, 2023
First Year (2020-2021)
Each month (January - September) the project director sent a monthly correspondence email to all project participants. The email list was updated with each passing webinar to include any new project participants. Information such as project correspondence, follow up resources and references as well as opportunity to ask questions were all part of the monthly correspondence the project director had with the group.
Second Year (2021-2022)
Each month (January - September) the project director sent a monthly correspondence email to all project participants. The email list was updated with each passing webinar and workshop to include any new project participants. Information such as project correspondence, follow up resources and references as well as opportunity to ask questions were all part of the monthly correspondence the project director had with the group. There were 70 people on the email list by the end of the 4 webinars/workshops that were hosted during the year.
Third Year (2022-2023)
Each month (January - September) the project director sent a monthly correspondence email to all project participants. The email list was updated with each passing webinar and workshop to include any new project participants. Information such as project correspondence, follow up resources and references as well as opportunity to ask questions were all part of the monthly correspondence the project director had with the group. This year the project director also started including a section for other agricultural events/information in the region that participants may find useful. There were 71 people on the email list by the end of the 5 webinars/workshops that were hosted during the year.
All participants involved in the project will be eligible to receive a certificate at the end of each project year (can earn up to 3 in total for the project). The requirements include: attending all classroom workshops (3 per year), at least one field workshop per year and being in direct communication with the project director discussing how they have applied the knowledge and skills learned throughout the year in their day to day work.
10
September 30, 2023
Completed
August 22, 2023
First Year (2020-2021)
A total of 10 participants (6 ASP, 4 Farmers) earned a Certificate of Participation in 2020-2021. All participants attended the winter webinar series (4 total webinars) focused on the creation of a grazing plan. Additionally, each recipient scheduled time for a telephone call (follow up interview) with the project facilitator. They were asked several questions but the focus was on how they were using the information learned in the workshops or planned to use it in the future. A participant survey report captured the findings/outcomes of these calls. (Please note, not all those who participated in the follow up interviews fulfilled the remaining requirements to receive the certificate).
Second Year (2021-2022)
A total of 8 participants (4 ASP, 4, farmers) earned a Certificate of Participation in 2021-2022. All participants attended the three webinars focused on soil health. Additionally, each recipient scheduled time for a follow up interview with the project facilitator and/or participated in one of the soil trailer tour workshops. 6 participants participated in the follow up interview.
Third Year (2022-2023)
A total of 6 participants (4 ASP, 2 farmers) earned a Certificate of Participation in 2022-2023. All participants attended the three webinars focused on nutrient management. Additionally, each recipient participated in one of the field workshops. None of the certificate recipients needed to participate in a phone call with the project facilitator as they had already fulfilled the certificate requirements, though 4 project participants did participate in the follow up interview.
4 to 6 months after the completion of each project year all uniquely individual participants who attended at least one of the 5 workshops (3 classroom and 2 field) held will respond to a follow-up survey (3 in total for the project) from the project director. Service providers will report on actions taken to teach and advise farmers using the knowledge and skills learned through the workshops, while farmers will report on what changes they have implemented on their farm.
35
December 31, 2023
Completed
November 01, 2023
First Year (2020-2021)
The Project Director sent out a follow -up survey in October 2021 to those who participated in at least 1 of the 6 webinars held in the 2020-2021 grant year. The survey was customized to the respondent based on whether they were an ASP or farmer and which webinar(s) they attended. ASP were asked how/if they have shared the information that was taught and farmers were asked if they have/plan to implement any of the information that was taught. Other questions included how they shared the information, the numbers of animals/acres they own, virtual learning and what topics they'd like to learn about in the future. The survey was sent to 73 participants in total, 39 ASP and 34 farmers. The respondents were given about 1 month to respond to the survey. There was a 40% response rate overall. The findings are reported in the performance target outcome section.
Second Year (2021-2022)
The Project Director sent out a follow-up survey in October 2022 to those who participated in at least 1 of the 3 webinars and/or the 1 soil trailer field workshop hosted by the Tri-State SARE project in the 2021-2022 grant year. The year end follow-up survey was not distributed to those who attended any of the other 4 soil trailer workshops held by the collaborating organizations. Data and information from those workshops was only used in milestone and educational activities reporting, not in the performance target outcomes.
The survey was customized to the respondent based on whether they were an ASP or farmer and which webinar(s) they attended. ASP were asked how/if they have shared the information that was taught and farmers were asked if they have/plan to implement any of the information that was taught. Other questions included how they shared the information, the numbers of animals/acres they own, virtual learning and what topics they'd like to learn about in the future. The survey was sent to 61 participants in total, 39 ASP and 22 farmers. The survey was not sent to those who participated in a follow up interview with the project facilitator as the same questions in the survey were asked in the interview. The respondents were given about 1 month to respond to the survey. There was a 43% response rate overall. The findings are reported in the performance target outcome section.
Third Year (2022-2023)
The Project Director sent out a follow -up survey in October 2023 to those who participated in at least 1 of the 5 webinars/workshops held in the 2022-2023 grant year. The survey was customized to the respondent based on whether they were an ASP or farmer and which webinar/workshop they attended. ASP were asked how/if they have shared the information that was taught and farmers were asked if they have/plan to implement any of the information that was taught. Other questions included how they shared the information, the numbers of animals/acres they own, virtual learning and what topics they'd like to learn about in the future. The survey was sent to 89 participants in total, 74 ASP and 15 farmers. The respondents were given 1 month to respond to the survey. There was a 27% response rate overall. The findings are reported in the performance target outcome section. Note, the survey was not sent to those who participated in a follow up interview with the project facilitator as the same questions in the survey were asked in the interview. The numbers above only reflect the surveys sent via email and not the follow up interview calls.
Milestone activities and participation summary
Participation summary:
Learning Outcomes
YEAR 1 (2020-2021)
Cumulatively, over the 6 webinars held in 2021, 73 participants (39 ASP, 34 farmers) reported changes in knowledge, skills and/or attitudes as a result of their participation in the webinars as reported by the pre and post evaluation questions. The evaluation questions asked them to report changes in knowledge, skills or attitudes and also to tell us whether they intended to use this knowledge gained from this project in their work with farmers. The evaluation questions (through Slido) allowed participants to report what action steps they planned to take as a result of participating in the workshop.
Key areas in which the participants reported a change in knowledge, attitudes, skills and/or awareness on evaluation forms completed at the workshop are as follows:
-The key components of a grazing plan
-Developing and defining grazing goals and objectives
-Understanding of what comprises a farms inventory
-Watering systems and fencing types that can be used with grazing livestock
-Contingencies as part of a grazing plan
-Winter feeding plans
-Pasture Assessment using the condition scoring method
-Analyzing and assessing a grazing plan
YEAR 2 (2021-2022)
Cumulatively, over the 4 webinars/workshops held in 2022, 70 participants (39 ASP, 30 farmers, 1 student) reported changes in knowledge, skills and/or attitudes as a result of their participation as reported by the pre and post evaluation questions. The evaluation questions asked them to report changes in knowledge, skills or attitudes and also to tell us whether they intended to use this knowledge gained from this project in their work with farmers. The evaluation questions (through Slido) allowed participants to report what action steps they planned to take as a result of participating in the workshop.
Key areas in which the participants reported a change in knowledge, attitudes, skills and/or awareness on evaluation forms completed at the workshop are as follows:
-Reading and interpreting Cornell’s Comprehensive Soil Health Assessment (CASH) report
-Understanding the definition of soil health and how it varies from soil quality
-Taking a proper soil sample for meaningful test results
-Management practices that affect soil health
-Management practices that can positively impact soil health
-How to make positive soil health change
YEAR 3 (2022-2023)
Cumulatively, over the 5 webinars/workshops held in 2023, 80 participants (62 ASP, 17 farmers, 1 student) reported changes in knowledge, skills and/or attitudes as a result of their participation as reported by the pre and post evaluation questions. The evaluation questions asked them to report changes in knowledge, skills or attitudes and also to tell us whether they intended to use this knowledge gained from this project in their work with farmers. The evaluation questions (through Slido) allowed participants to report what action steps they planned to take as a result of participating in the workshop.
Key areas in which the participants reported a change in knowledge, attitudes, skills and/or awareness on evaluation forms completed at the workshop are as follows:
-Understanding how grazing management affects nutrient management in pastures
-The data collection and record keeping that is necessary for on farm nutrient management
-Key design elements of Heavy Use Area's that will maximize nutrient management
-Reading and interrupting soil nutrient analysis results
-Ideal levels of the macronutrients that are found in soil
-Role that soil pH plays in nutrient availability
**PLEASE NOTE: the evaluations are anonymous and therefore the numbers of service providers and farmers reported above is a best estimate of the project team. All attendees noted at some point throughout the project that they have increased/verified their knowledge/skills/awareness in some area(s) and plan to use that knowledge and skills in their work. The total number reflected above are the unique number of individual service providers and farmers who attended at least one of the webinars/workshops the project hosted in 2020-2023**
Performance Target Outcomes
Performance Target Outcomes - Service Providers
Target #1
35 agricultural service providers who participate in this project will provide a range of workshops, one-on-one consultations, articles, videos, websites, fact sheets and project materials about the recommended pasture management, soil health and manure management practices learned to 230 farmers they work with.
| Year 1 | Year 2 | Year 3 |
|---|---|---|
| 14 | 15 | 22 |
Please see Performance target outcome narrative for service providers, below for an explanation of the educational action(s) taken
| Year 1 | Year 2 | Year 3 |
|---|---|---|
| 93 | 364 | 118 |
| Year 1 | Year 2 | Year 3 |
|---|---|---|
was not asked |
915 animals |
3,406 animals |
| Activity | Year 1 | Year 2 | Year 3 | Total |
|---|---|---|---|---|
| Curricula, factsheets and other educational tools | 2 | 5 | 1 | 8 |
| Consultations | 9 | 8 | 14 | 31 |
| Online trainings | 1 | 0 | 0 | 1 |
| Published press, articles, newsletters | 2 | 0 | 0 | 2 |
| Study circles / focus groups | 0 | 2 | 0 | 2 |
| Webinars, talks and presentations | 0 | 3 | 1 | 4 |
| Workshops and field days | 2 | 4 | 2 | 8 |
| year 1: high school animal science teacher-incorporate concepts into the curriculum as they fit. year 2: Secondary education in animal science lessons and shared the handouts and worksheets that were presented in the webinars. | 1 | 6 | 0 | 7 |
YEAR 1 (2020-2021)
3 months after the completion of year 1, the Project Director distributed a follow-up survey to the service providers and farmers who attended at least one of the six workshops held. The survey was created in Qualtrics and formatted in such a way that presented the questions based on the webinars that the respondent attended, therefore not all respondents received the same questions. The survey was distributed via an email link to 73 total participants, 39 service providers and 34 farmers. 29 participants, 15 service providers and 14 farmers responded (40%) to the survey. We were interested in learning what actions participants had taken since the webinars, how they used the information learned, how many they were able to share the information with and how useful the virtual learning platform was for them.
1 (0.06%) service provider indicated that they have not shared any of the information learned in the webinars they attended and did not indicate why. They did attend all 6 webinars (and gave our virtual learning platform an excellent rating) the project hosted so the project team is hopeful that the participant will use the information learned in the future. All other service providers who responded to the survey have shared or plan to share the best practices that were discussed in the 2020 webinars. 8 of 14 (57%) service providers have shared information regarding the key components of a grazing plan while another 5 (36%) plan to share the information. 8 of 12 (67%) service providers have shared information about the importance of goal setting and the resources that are considered inventory when developing a grazing plan. 3 (25%) service providers plan to share this information. 1 of 10 (10%) service providers shared how to calculate forage needs and yields and interpret those calculations with a forage balance sheet while 8 (80%) plan to share the information in the future. 8 of 11 (73%) service providers shared information about the importance of contingency plans while another 2 (18%) plan to share the information. 7 of 11 (64%) shared information about the importance of recording keeping for a grazing plan and another 3 (27%) plan to share the information. Only once, did 1 (0.06%) service provider indicate that they needed more information before sharing with others. This information was in regard to fencing and water infrastructure in a grazing set up. 7 of 12 (58%) service providers have shared this information and 3 (25%) plan to share the fencing and water infrastructure information. 2 of 7 (33%) shared information about what should be considered when analyzing a grazing plan while another 3 (50%) plan to share the information. An equal number of service providers shared (4 of 9, 44%) or plan to share (4 of 9, 44%) information about how to assess pasture using the pasture condition score method. 10 of 14 (71%) service providers indicated they also learned something in addition to the concepts that are mentioned above. 9 of 10 (90%) ranked the virtual learning setting either very good or excellent and said there was nothing that could be done to improve it in the future.
YEAR 2 (2021-2022)
4 months after the completion of year 2, the Project Director distributed a follow-up survey to the service providers who attended at least one of the four workshops held. The survey was created in Qualtrics and formatted in such a way that presented the questions based on the webinars that the respondent attended, therefore not all respondents received the same questions. The survey was distributed via an email link to 39 total service providers. Jean King, the project facilitator also conducted phone interviews for those who wished to participate. Overall, between the survey and phone calls 16 service providers responded (41%). We were interested in learning what actions the service providers had taken since the workshops, how they used the information learned, how many farmers they were able to share the information with, how useful the virtual learning platform was for them and what other training and education they were looking for.
1 (0.06%) service provider indicated that they have not shared any of the information learned in the webinars they attended and did not indicate why. All other service providers who responded to the survey have shared or plan to share the best practices that were discussed in the 2022 webinars. 5 of 11 (45%) service providers have shared information about how to take a proper soil sample for meaningful test results while another 4 (36%) plan to share the information. 3 of 14 (21%) service providers have shared information about how to read and interpret Cornell's Assessment of Soil Health (CASH) report. 9 (64%) service providers plan to share this information. 1 (7%) service provider indicated they needed more information about how to read and interpret the CASH report. When asked to provide detail on what further information they needed, they said they would like to run a test personally to better understand the process. An equal number of service providers shared (5 of 11, 45%) or plan to share (5 of 11, 45%) information about how the management of plants, animals and soil can increase or decrease soil organic matter. 5 of 9 (56%) service providers shared the management concepts to consider when working toward positive soil health change, while 3 (33%) plan to share the information in the future. 3 of 9 (33%) service providers shared information about the steps that can be taken to begin improving compacted soil while another 5 (56%) plan to share the information. 6 of 10 (60%) shared information about the impact covered and healthy soil has on improved water infiltration and reduced runoff. Another 3 (27%) plan to share the information. 7 of 14 (50%) service providers provided comment on what else was learned in the 2022 workshops that they have either used or plan to use in their daily work with farmers. 9 of 16 (56%) service providers listed an action step that they have taken in their daily work since attending the 2022 workshops. One comment that stuck out was that one service provider now carries a shovel to all farm visits so that they can help the farmer look under the plants and see the roots and soil. 10 of 11 (91%) service providers indicated that their experience was either excellent (36%) or very good (55%) with the virtual learning setting in 2022. When asked what could be done to improve the experience, no one chose to comment.
YEAR 3 (2022-2023)
3 months after the completion of year 3, the Project Director distributed a follow-up survey to the service providers who attended at least one of the five workshops held. The survey was created in Qualtrics and formatted in such a way that presented the questions based on the webinars that the respondent attended; therefore not all respondents received the same questions. The survey was distributed via an email link to 77 total service providers. Jean King, the project facilitator also conducted phone interviews for those who wished to participate. Overall, between the survey and phone calls 22 service providers responded (29%). We were interested in learning what actions the service providers had taken since the workshops, how they used the information learned, how many farmers they were able to share the information with, how useful the virtual learning platform was for them and what other training and education they were looking for.
In most questions 1 (5%) service provider indicated that they do not plan to share any of the information learned in the workshops they attended and did not indicate why. In some questions, 2 (10%) service providers indicated they don not plan to share any information, again with no explanation as to why. All other service providers who responded to the survey have shared or plan to share the best practices that were discussed in the 2023 workshops. 10 of 21 (48%) service providers have shared information on the types of data collection and record keeping that is necessary for on farm nutrient management while another 7 (33%) plan to share the information. 3(14%) indicated that they needed more information before sharing. When asked what information was needed they mentioned data collection suggestions in writing while another said they don’t recall this part of the workshop. 13 of 21 (62%) service providers have shared information about how grazing management affects nutrient distribution in pastures. 7 (33%) service providers plan to share this information. 9 of 19 (47%) service providers shared information about the key design elements of heavy use areas to maximize nutrient management, while 7 (37%) plan to share the information in the future. 8 of 16 (50%) service providers shared information about how to read and interpret soil nutrient analysis results, while 3 (19%) plan to share the information in the future. 4 (25%) service providers indicated they needed more information before sharing. When asked what further information was needed they mentioned needing more guidance about what nutrients to look at, making management decisions based on the results and resources that can help make those decisions. 5 of 10 (50%) service providers shared information about what the ideal levels of the major nutrients (N, K, P) found in soil are and how to maintain them, while 2 (20%) plan to share the information in the future. 2 (20%) service providers indicated they needed more information before sharing. When asked what further information was needed they mentioned needing more guidance about amending soils and applying nutrients. 7 of 11 (64%) service providers shared information about the role soil pH plays in nutrient availability, while 2 (18%) plan to share the information in the future. 8 of 9 (90%) service providers indicated that their experience was either excellent (56%) or very good (33%) with the virtual learning setting in 2023. When asked what could be done to improve the experience, one commented on having longer breakout sessions.
Overall, the project team feels that all aspects of the performance target were hit. The team recognizes there is still room for more education in the area of raising livestock on pasture, but each year has proven successful for those who attended.
Performance Target Outcomes - Farmers
Please note that there were no performance targets written into the project for farmers as service providers are the main focus of this PDP grant and therefore target and verified numbers are not included for farmers. The narrative included below is more so for supporting information about what farmer participants took away from the project since all those who participate regardless of how they classify themselves receive the year end project surveys each year.
YEAR 1 (2020-2021)
3 months after the completion of year 1, the Project Director distributed a follow-up survey to the service providers and farmers who attended at least one of the six workshops held. The survey was created in Qualtrics and formatted in such a way that presented the questions based on the webinars that the respondent attended, therefore not all respondents received the same questions. The survey was distributed via an email link to 73 total participants, 39 service providers and 34 farmers. 29 participants, 15 service providers and 14 farmers responded (40%) to the survey. We were interested in learning what actions participants had taken since the webinars, how they used the information learned, how many they were able to share the information with and how useful the virtual learning platform was for them.
None of the farmers who responded to the survey indicated that they have no plans to implement what was taught. Prior to attending the webinars, half (5 of 10, 50%) of the farmers had a grazing plan for there farm while the remaining 50% did not. 4 of 10 (40%) already had goals set as part of their grazing plan while another 6 (80%) either started or plan to start developing and setting goals to include in their grazing plan. 1 of 10 (10%) was already determining their inventory based on the resources they had on the farm. 5 (50%) started doing this since the webinars, 3 (30%) plan to start doing this and 1 (10%) indicated they have no plans to determine their inventory. 2 of 8 ( 25%) farmers mentioned they have already been calculating and interrupting their forage needs while 5 (58%) said they have started or plan to do this. 1 (12.5%) said they need more information before using and interrupting the calculations. 6 of 9 (67%) farmers were already laying out their fencing and water infrastructure within their grazing plan while another 3 (33%) have started doing it since the webinars. An equal number of farmers were doing (3 of 6, 50%) or plan to start (3 of 6, 50%) developing contingency plans to include in their grazing plan. 4 of 6 (67%) farmers plan to begin keeping records for their grazing plan while 1 (17%) was doing it before the webinar and 1 (17%) started after attending the webinar. Only 1 of 6 (17%) farmers were assessing their pasture using the pasture condition score method prior to the webinar while 2 (33%) plan to start and 2 (33%) started since the webinar. 9 of 13 (69%) farmers indicated they also learned something in addition to the concepts that are mentioned above. 4 of 4 (100%) ranked the virtual learning setting either very good or excellent. 3 of 4 (75%) said there was nothing that could be done to improve it in the future, while 1 (25%) said to do the same sessions but earlier in the year so that there was more time for planning and implementation.
YEAR 2 (2021-2022)
4 months after the completion of year 2, the Project Director distributed a follow-up survey to the farmers who attended at least one of the four workshops held. The survey was created in Qualtrics and formatted in such a way that presented the questions based on the workshops that the respondent attended, therefore not all respondents received the same questions. The survey was distributed via an email link to 22 farmers. Jean King, the project facilitator also conducted phone interviews for those who wished to participate. Overall, between the survey and phone calls 10 famers responded (45%). We were interested in learning what actions the farmers had taken since the workshops, how they used the information learned, how useful the virtual learning platform was for them and what other training and education they were looking for.
6 of 10 (60%) farmers said they were doing some soil testing prior to attended the 2022 workshops while the remaining 40% were not. Only 1 of 8 (12.5%) farmers had an understanding of how to read and interpret Cornell's Assessment of Soil Health (CASH) report prior to the workshops. 5 (62.5%) farmers either started or plan to start submitting soil samples in the future for assessment and have confidence in reading and interpreting those results. 1 of 5 (20%) farmers we already managing the interaction between plants, their animals and the soil as a way to increase soil organic matter while another 4 (80%) started (2, 20%) or plan to start (2, 20%) doing this moving forward. 3 of 5 (60%) farmers were already using management practices that help lead to positive soil health change while another 2 (40%) started (1, 20%) or plan to start (1, 20%) doing this. 1 of 5 (20%) farmers we already taking steps to improve compacted soils on their farm while another 3 (60%) started (2, 40%) or plan to start (1, 20%) doing this moving forward. 1 (20%) farmer indicated that they don't plan to use this information because compacted soil is not an issue on their property. 2 of 6 (33%) farmers said they were already taking steps to improve water infiltration and reduce run off on their farm while 3 (50%) indicated they plan to start doing this and another 1 (17%) has already started doing this.
YEAR 3 (2022-2023)
3 months after the completion of year 3, the Project Director distributed a follow-up survey to the farmers who attended at least one of the five workshops held. The survey was created in Qualtrics and formatted in such a way that presented the questions based on the workshops that the respondent attended; therefore not all respondents received the same questions. The survey was distributed via an email link to 15 farmers. Jean King, the project facilitator also conducted phone interviews for those who wished to participate. Overall, between the survey and phone calls 6 farmers responded (38%). We were interested in learning what actions the farmers had taken since the workshops, how they used the information learned, how useful the virtual learning platform was for them and what other training and education they were looking for.
1 (16%) respondent said that they do not plan to manage grazing to maximize nutrient distribution in pastures with no further explanation as to why. All other respondents (5, 84%) said they were either doing this before or plan to do it as a result of attending. In all other questions asked in the survey, 100% of the responses were that the respondent was doing this before the workshop, started doing it since attending or planned to do it as a result of attending. Below is a list of the remaining statements asked based on what was taught in the 2023 workshops.
-Understanding how to read and interpret soil nutrient analysis results
-Testing soil to monitor and maintain the ideal levels of the major nutrients (N, K, P) found in soil
-Monitoring soil pH to maximize nutrient availability
One respondent (16%) indicated that one action step they have taken since attending has been to make sure that they are keeping all bare ground covered by either plants, mulch or hay. All (100%) farmers indicated that their experience was either excellent (33%) or very good (67%) with the virtual learning setting in 2023. When asked what could be done to improve the experience, one commented on having longer breakout sessions. This comment was also made by a service provider and has encouraged the project team to make some changes to project milestones in 2023-2026 to allow for this type of interaction.
Additional Project Outcomes
| Year 1 | Year 2 | Year 3 | Total |
|---|---|---|---|
| 0 | 0 | 0 | 3 |
YEAR 1 (2020-2021)
The project produced 4 professionally made videos in 2021. Two of the videos were incorporated into the field webinars in an effort to make them as hands on as possible. The remaining two videos helped illustrate a few of the concepts that were discussed throughout the project year. The four videos were: how to use the pasture condition score method, how to take a dry matter sample, how to utilize a pasture stick and a grazing management analysis video of a CT farm. All videos were available for viewing in early September 2021 on the project website and the UConn Youtube channel and as of Nov. 15th 2021 they received 82 views.
YEAR 2 (2021-2022)
The project worked with several organizations/groups in the region to sponsor a soil trailer tour. The University of Massachusetts, American Farmland Trust and the Rhode Island Farm Bureau were all part of the collaboration. All groups were satisfied with the effort and outcome and look forward to working together again on future events.
YEAR 3 (2022-2023)
The project worked with American Farmland Trust to host a field workshop in MA. Both groups agreed that we will collaborate on at least one in farm event each year moving forward as long as the interests of both groups would be met.
YEAR 1 (2020-2021)
Several farmers who participated in year 1 of the project commented in the year end follow up survey that was distributed. One said: "Very happy I was able to participate in the workshop; topics, handouts, and breakout sessions were very helpful. I feel much more informed and confident in approaching grazing". Another said: "great workshop. forage calculation really stimulated my thinking."
Someone who participated in year 1 as both a service provider and a farmer provided the following comment in the year end follow up survey: "I greatly appreciate these workshops. They have provided greater insight to me as a livestock producer and agricultural educator. They are thoughtfully created and do a great job of bringing producers together for real conversations - not just theoretical suggestions."
YEAR 2 (2021-2022)
A farmer provided the following comment in the year end survey: "The workshops solidified the plans we were already making regarding rotational grazing and reduced tillage." A service provider stated "I liked the diversity of experience shared by the presenters. Having a soils expert, agronomist and livestock specialist all bring different information to the workshop allowed different perspective on the topic. For example, relating the grazing period to soil health as well as nutritional value of the forage explored a new perspective to share with farmers."
As noted in the milestones, the project also offered a Certificate of Participation each year to those who fulfilled the requirements. The project team was pleased that every year several participants chose to actively engage in the project and fulfill those requirements to earn the certificate.
The project team feels we have found great success in project implementation. Providing virtual and in person programming for folks to attend what they have the time for and feel most comfortable with. Building in time for interaction and discussion to the programming has also proved valuable to our participants. We do recognize that the topic of pasture management for sustainable livestock production is a broad one and are looking forward to continuing to address topics under this umbrella moving forward into the 2023-2026 project year.
SARE Outreach
YEAR 1 (2020-2021)
Our SARE outreach is occurring through the online webinars in 2021. In the opening comments of each Tri-State SARE workshop the CT state SARE coordinator takes 3 to 5 minutes to discuss the different grant opportunities that SARE provides using the SARE grant comparison chart. The CT State SARE coordinator also created a short webinar about NESARE and the grant opportunities they have available. This webinar is on the project website.
YEAR 2 (2021-2022)
Our SARE outreach is occurring through online webinars in 2022. In the opening comments of each Tri-State SARE workshop the CT state SARE coordinator takes 3 to 5 minutes to discuss the different grant opportunities that SARE provides using the SARE grant comparison chart. The CT State SARE coordinator also directed participants to the short webinar (located on the project website) about NESARE and the grant opportunities that are available.
YEAR 3 (2022-2023)
Our SARE outreach is occurring through online webinars and in person conferences in 2023. In the opening comments of each Tri-State SARE workshop the CT state SARE coordinator takes 3 to 5 minutes to discuss the different grant opportunities that SARE provides using the SARE grant comparison chart (62 ASP, 17 Farmers). The CT state coordinator also attended the CT Farm Bureau annual meeting (3 ASP, 9 farmers), CT Pomological Meeting (2 ASP, 9 Farmers), the CT vegetable conference (2 ASP, 15 Farmers) and a livestock conference in MA (1 ASP, 4 Farmers). The Project Facilitator attended the Women In Agriculture conference in RI (15 ASP, 30 Farmers).