Final Report for SW13-043
Project Information
Sampling the bee community at four diversified farms in Montana over the last three years, we have found these farms support diverse assemblages of wild bees, with over 211 taxa (the vast majority resolved to species) documented. This has greatly added to our understanding of the biology, ecology, and diversity of wild bees in Montana and specifically those associated with farmlands. We found that bees varied among farms in abundance, richness, and community composition, though some farms were more similar to one another than others. Experimentally-planted native perennial flower strips, whose blooms spanned the entire growing season, supported a diverse and abundant bee community, with 130 taxa visiting flower strips across farms (62% of all bee taxa documented). Flower strips were visited by both common generalist bees, as well as rare specialist bee species. Individual plant species within the flower strips varied in their overall attractiveness to bees (i.e., abundance, richness, and community composition). Several plant species were particularly attractive to bees, though each of these plant species was generally visited by a different assemblage of bee species. Other plant species were less attractive to bees, but these tended to be rare bees. Therefore, particular plant species could be selected for specific conservation goals, such as supporting high bee abundance, diversity, or particular bee species. Overall, flower strips did not increase bee visitation to the crops we studied or enhance crop pollination (reproductive success of crops). For squash, this could be because the primary visitors to flowers were honey bees, not native bees, though native bees were abundant on farms. Income from the sale of seeds produced by flower strips can provide economic benefits, even in the absence of improved pollination services. Our findings have value to producers, conservationists, government agencies, and other audiences interested in enhancing habitat for bee conservation. Our results provide data to help guide plant selection and incentives for supporting pollinators and creating sustainable agroecosystems.
To communicate our projects’ progress and findings, we gave numerous presentations during the past three years to diverse audiences. In general, our presentations covered topics including the importance of pollinators in agriculture and natural ecosystems, native bee biology and identification, using native perennial flower strips for enhancing bee habitat, and current findings from our project. We also participated in several field days, a farmer’s market educational booth, and workshops. We surveyed participants at talks and outreach events and found that their level of knowledge increased for many of the topics we discussed, particularly native bees and native bee conservation. We also created a web page with photos of research and outreach activities to further share details of our project and display our outreach materials.
The objectives of this research and education project were to
1) evaluate the use of native perennial flower strips as a strategy for supporting native bees on farmlands,
2) determine the value of flower strips for improving crop pollination and yields through changes in the abundance, diversity, or behavior of native bees,
3) evaluate the potential of flower strips for native seed production and sales, and
4) execute a research-based outreach program to communicate our findings to producers, land managers, agricultural professionals (e.g., NRCS personnel and Extension agents), scientists, and the general public.
The health, productivity, and sustainability of agricultural systems are strongly linked to pollination services provided by bees (Goulson 2003, Klein et al. 2007, Allen-Wardell et al. 2008, Whittingham 2011). Native bees are increasingly recognized as important components of pollinator communities, partly due to recent declines in honey bee health and increased awareness of the risks of relying too heavily on this one non-native species for our crop pollination needs (Goulson 2003, NRC 2007, Winfree et al. 2007). However, some native bee populations are declining due to factors such as diseases, pesticides, and habitat loss (Goulson et al. 2015). Consequently, conservation of native bees has become an important priority to a wide constituency, including agricultural producers, land-managers, government agencies, and conservationists. Of particular importance is research addressing evaluation of on-farm management strategies to encourage diverse and abundant native bee communities (Kearns et al. 1998, Kremen et al. 2002, Goulson 2003, NRC 2007).
Among the most important resources required by bees are pollen and nectar, which must be available throughout the growing season (Michener 2000). Furthermore, constraints on foraging and dispersal distances of many bees require that sufficient floral resources be available within a localized area (Gathmann and Tscharntke 2002). Therefore, one promising strategy for enhancing pollinator habitat in agroecosystems is to incorporate non-crop flowering plants to supply food resources beyond the blooming period of crops.
Recently, the use of native perennial plants for supporting pollinators is receiving increased attention (e.g. Tuell et al. 2008, Isaacs et al. 2009, Russo et al. 2013, Blaauw and Isaacs 2014, Williams et al. 2015). Using common garden experiments, several studies have evaluated the attractiveness of native perennials to bees and identified candidate plant species for use in pollinator conservation efforts (Tuell et al. 2008, Russo et al. 2013). In addition, government cost-share programs (e.g. Environmental Quality Incentives Program) are available to encourage producers across the United States to provide pollinator habitat on managed lands using native plants. However, few studies have documented the value of native wildflower plantings for supporting wild bees on farms or increasing crop pollination and yields. The most comprehensive study to date was conducted in Michigan (North Central Region) and showed that wildflower plantings next to blueberry fields increased the abundance of wild bees as well as blueberry yield in the third and fourth year after seeding (Blaauw and Isaacs 2014). In addition, the costs of implementing and maintaining plantings were offset in 3-5 years. Whether similar effects can be achieved in other crops and in other regions is poorly understood. Montana, the location of our research, is particularly understudied with respect to its bee diversity and the role of native bees in agriculture.
For this research and education project, we set out to better understand perennial flower strips on farmlands as a strategy for conserving pollinators and improving pollination services and crop yields. Because the expense of implementing wildflower plantings could be limiting wider use, we were also interested in knowing whether flower strips could serve an additional function by providing wildflower seed for sale to not only offset the costs, but generate income. This research provides data for producers to evaluate the potential benefits of adopting this management practice. It also provides valuable information on the biology and ecology of native bees on farmlands in Montana.
Cooperators
Research
Objective 1. Evaluate the use of native perennial flower strips as a strategy for supporting native bees on farmlands.
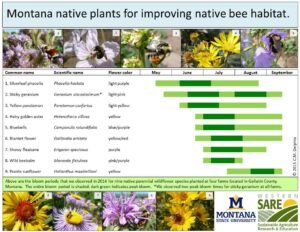
Flower strips. We established flower strips comprised of nine native perennial wildflower species at four participating farms in the Gallatin Valley, Montana: Gallatin Grown, Gallatin Valley Botanical, Rocky Creek Farm, and Towne’s Harvest Garden. We chose plant species with different colors and floral morphologies and with bloom times that would span the entire growing season in order increase the likelihood of providing food for a diversity of bee species (Table 1). We also chose plants that would do well in agricultural settings with limited water and full sun. In the spring of 2013, we propagated wildflower plugs in cone-tainers (SC10U-98 cells per tray) in the greenhouse to use in flower strips. We used plugs rather than seeding to hasten flower strip establishment. Wildflower plugs were transplanted in early June into strips (one per farm; 4ft x 108ft=432ft2) consistent with each sites’ farming methods, including bare soil, Infrared Transmitting (IRT) plastic mulch, or black landscape fabric. Each strip was divided into 27 plots to accommodate three replicates of each of the nine plant species. Plugs of each species were planted at different densities, depending on their growth habits to maximize space. At all farms, flower strips were positioned at one edge of the farm to reduce interference with farming activities. Plants were hand-watered for the first two weeks, after which time they received water weekly either via overhead irrigation or drip tape according to the site’s farming methods.
Floral abundance. In 2014 and 2015, we conducted weekly measures of floral abundance of the nine species in the flower strips throughout the flowering season to assess the relative amount of supplemental food resources available to foraging bees across farms. We did not conduct weekly measures of floral abundance in the flower strips in 2013, since we did not expect plants to bloom the year they were transplanted.
Bee sampling. We sampled the bee community in 2013-2015 to better understand the diversity and abundance of wild bees on farms and to identify plant species important as food resources for wild bees throughout the growing season. Sampling in 2013 provided baseline data before flower strips started blooming in 2014. We focused on two sampling methods, hand netting and yellow pan traps.
Collecting methods. Different sampling methods, such as hand netting and pan traps, target different subsets of the bee community (Cane et al. 2000, Roulston et al. 2007). For example, certain bees, like bumble bees (Bombus spp.) and other large bees in the family Apidae (i.e., Anthophora spp., Melissodes spp.) are generally less likely to be captured in pan traps and are more likely to be collected with a net, whereas other types of bees are generally very abundant in pan traps, including small sweat bees like Lasioglossum (Dialictus) spp. (Roulston et al. 2007). Furthermore, the effectiveness of pan traps is thought to vary depending on floral availability (Cane et al. 2000). Therefore, to obtain the most complete understanding of the wild bees present on farms, we utilized both hand netting and yellow pan traps.
Hand netting. We captured bees visiting flowers on the established flower strips (2014 and 2015) at each farm during weekly timed observations from May-September. Each plant species in the flower strip was observed for a total of 30 min (10 min per rep) in 2014 and 21 min (7 min per rep) in 2015. Bees were freeze-killed, pinned, and identified to the lowest taxonomic level, usually to species (see Bee species identifications).
Yellow pan traps. We used yellow pan traps filled with soapy water to passively sample the bee community at each farm weekly from May-September in 2013-2015. We placed six pan traps along each of the four, 108ft-linear transects: along the flower strip and at 20, 60, and 180 m from the flower strip (see experimental crop strips below). Pan traps were placed out between 0900 and 1000, evenly spaced along transects (c. 21ft apart), and left for c. six hours. Bees collected from the pan traps were placed into Whirl-paks® with alcohol until they could be processed and identified as above.
Bee species identifications. Because of the difficulties associated with identifying bees to species, and because the bee fauna of Montana is poorly known, we traveled to Logan, Utah to get assistance from bee specialists at the USDA Bee Biology and Systematics Laboratory. We spent two weeks total working with a team of experts learning how to identify species within several difficult genera and having species identified and/or verified to add to our reference collection. We also sent specimens within the genus Melissodes to a graduate student at the University of New Mexico for species determinations.
Data analyses. We used analysis of co-variance (ANCOVA) to compare abundance and richness of bees across sampling methods among years (2013-2015) and farms. We used ANCOVAs to compare abundance and richness of bees visiting flower strips among years (2014 and 2015), farms, plant species, and their interactions. We used ANCOVAs to compare abundance and richness of bees captured in pan traps among years, farms, distances, weeks, and their interactions. Significant ANCOVAs were followed by Tukey’s honestly significant difference (HSD). We used permutational multivariate analysis of variance (PERMANOVA) to compare community composition of bees across sampling methods among years (2013-2015) and farms, as well as community composition of bees visiting flower strips among years (2014 and 2015), farms, plant species, and their interactions. We also used PERMANOVA to compare community composition of bees captured in pan traps among years, farms, distances, weeks, and their interactions.
Objective 2. Determine the value of flower strips in improving crop pollination and yields through increases in the abundance, diversity, or behavior of native bees.
Crop strips. To evaluate the effects of flower strips on pollination services to crop plants and determine whether crops are pollen-limited on farmlands, we established three experimental crops strips comprised of squash and sunflower plants at each farm. Crop strips were planted at varying distances from the flower strips (20, 60, and 180 m) to determine the degree to which proximity to flower strips influenced crop pollination services. We chose these plants because they likely attract different suites of bees due to their different floral morphologies and bloom times and therefore may reveal crop-specific differences in pollination services. We grew squash and sunflower plants from seeds in the greenhouse in late May (2013-2015) and transplanted crop plants onto each farm in mid-June. Each crop strip measured 3ft x 16ft. Every week after the onset of flowering, we performed standard supplemental pollination treatments on half of the squash and half of the sunflower plants in each crop strip and allowed the remaining half to be open-pollinated by bees. The degree to which squash and sunflower crops were pollen-limited was assessed by comparing reproductive success (i.e., fruit set and seed set, fruit mass, dry seed mass) between open and supplemental pollination treatments at the end of the growing season in each crop strip at each farm. We estimated sunflower biomass (mm2) by measuring the height (mm) and stem width (mm) of each plant. We determined the biomass of each squash plant as dry mass. These biomass metrics were used as covariates in analyses. Sunflowers at one farm were destroyed by deer in 2014 and 2015, and thus were excluded from our analyses
Bee sampling. To determine which bee species visited crop plants and bee visitation rates, we conducted bi-weekly timed observations in 2013 (sunflower only) and weekly observations in 2014 and 2015 (squash and sunflower) at each of the three crop strips at each farm during flowering (July-September). Squash observations were not conducted in 2013 at the experimental crops, but were conducted on the large squash and/or pumpkin plantings present at each farm. Each observation period was 10 minutes in duration, and we captured all bees observed visiting flowers. Bees were freeze-killed, pinned and identified to the lowest taxonomic level possible (see Bee species identifications). Prior to observations, we counted all open flowers.
Data analyses. For both squash and sunflower, total number of seeds per plant, total seed mass per plant, and mass per seed were correlated across plant individuals, and plants responded similarly to our supplemental pollination treatment for each of these metrics. Thus, we only report results for total seed mass per plant. Total seed mass per plant for squash and sunflower (2013-2015) were analyzed using ANCOVA with farm, distance from flower strip, supplemental-pollination treatment, and the interaction between distance and supplemental-pollination treatment as fixed effects and plant biomass as a covariate. Bee visitation rates for squash (2014 and 2015) and sunflower (2013-2015), were calculated as total bees per flower per minute and were analyzed using two-way ANOVA with farm and distance from flower strip as fixed effects.
Objective 3. Evaluate the potential of flower strips for native seed production and sales.
Harvesting and cleaning native seed. To measure seed yields for calculating potential income from seed sales, we hand-harvested seeds weekly from all plant species in flower strips as it matured in 2014 and 2015. Plant species varied in the time and effort required to collect and clean (i.e., remove chaff) seeds due to differences in plant growth habits and the timing of seed maturation.
Cost-benefit analysis. To understand the potential of flower strips to provide an additional economic benefit through the sale of native wildflower seed, we conducted a cost-benefit analysis. From 2013-2015, we recorded all labor and monetary costs associated with installing and maintaining flower strips, including plant materials, planting the strips, watering and weeding. We also recorded labor associated with harvesting and cleaning seed in 2014 and 2015, as well as the cost of obtaining proper licensing to sell seed in Montana. We calculated potential income from seed sales using seed yields and current market value for retail seed packets. We compared all costs against the projected income from wildflower seed sales. We calculated the costs and benefits associated with flower strips by individual plant species since each had unique attributes that contributed to the overall labor costs involved with planting and weeding as well as harvesting and cleaning seeds, and therefore potential profitability. All labor was calculated at minimum wage in Montana ($8.05 h-1).
Objective 4. Execute a research-based outreach program to communicate our findings to producers, land managers, agricultural professionals (e.g., NRCS personnel and Extension agents), scientists, and the general public.
To improve producers and the public's awareness of native bees and using native perennial wildflowers as a management strategy to improve bee habitat on farmlands, and other types of managed lands, we have taken part in a number of outreach efforts over the course of this project that have reached well over 500 individuals (see “Publications/Outreach” for more details about specific events). We have participated in field days and a farmer’s market educational booth, conducted workshops, and given numerous presentations to a variety of audiences at different venues. Presentations have focused on the importance of pollinators in agricultural, native bee biology and identification, bee nesting resources, and the use of flower strips for enhancing bee habitat, including results from our research project. After our flower strips bloomed for the first time (2014), we used this information to create a handout with the observed peak bloom times of our nine native wildflower species and distributed it at all following outreach events (Table 1). For all presentations where it was feasible, we brought several display drawers of pinned native bee specimens to further highlight the diversity of species found on farms specifically and in Montana in general (Figure 1). We also brought examples of bee nesting materials and bee houses, relevant books, and bee identification guides for those interested in learning more about conserving native bees. Participants were particularly interested and excited to see real bee specimens and also to learn how to provide bee nesting habitat.
To assess initial understanding and evaluate whether participants gained knowledge from our presentations on native bees, native plants, sustainable agriculture, and habitat management, we used pre and post surveys when appropriate. At several events we gave away wildflower seed that we harvested from our flower strips for participating in our surveys. For pre surveys, we were interested in assessing participants’ understanding of various topics prior to giving our presentation, including their awareness of the declines of honey bees and other pollinators, their familiarity with native bee diversity, native plants, and crop pollination, as well as their interest in learning more about these topics. In post surveys, participants were asked if our presentation improved their awareness of native bees, native bee conservation, native plants, habitat management strategies, and sustainable agriculture, as well as whether we provided new knowledge and modified their opinions and/or attitudes.
Objective 1. Evaluate the use of native perennial flower strips as a strategy for supporting native bees on farmlands.
Flower strip establishment. In general, plants had low winter mortality in both years (2014 and 2015). In 2014, compared to 2013, we saw a marked increase in vegetative growth and flowering of all nine species at all four farms (Figure 2). In 2015, plants appeared similar in size and abundance of blooms compared to 2014. This suggests the majority of plants reached their maximum size in 2014, one year after planting from plugs. If we had established flower strips from seed (instead of using plugs), it would likely have taken an additional year for plants to reach their maximum size, though this remains to be tested.
Bee sampling. Across all sites, years, and collecting methods, we found that the farms harbor a diverse assemblage of wild bees. We collected almost 11,000 bees belonging to five families (Figure 3). Among these families, we identified over 211 wild bee taxa (two of which are undescribed species) belonging to 34 genera. The vast majority of bees were resolved to species, with the exception of two difficult subgenera in the genus Lasioglossum and the genus Sphecodes; therefore we use the term taxa.
Across collection methods, mean bee abundance varied among years (P < 0.01), but not among farms (P > 0.05; Figures 4, 5). We found differences in mean bee richness among years (P < 0.01) and among farms (P < 0.02; Figures 4, 5). Across farms bee community composition varied among years, with higher similarity between 2014 and 2015 compared to 2013 (P < 0.01; Figure 6a). This is likely due to the fact that flower strips were not established until 2014. Bee community composition also varied significantly among farms (P < 0.01; Figure 6b).
Hand netting. Among the 211 taxa present across farms, we captured 130 bee taxa visiting flower strips or 62% of the total bee taxa. We also found that 39 bee taxa were unique to flower strips (i.e. only sampled on flower strips). These results demonstrate that flower strips were able to support a diversity of wild bees present on farms and/or in the nearby surrounding habitat.
Plant species varied in their importance as food resources for native bees. When looking at bee visitation to flower strips across farms and years (2014 and 2015 after flower strips established), we found that mean bee abundance (P < 0.01) and richness (P < 0.01) varied significantly among plant species (Figure 7). Plant species that attracted the overall greatest abundance of bees included E. speciosus, G. viscosissimum, H. maximiliani, and M. fistulosa. Those plant species that attracted the fewest individuals overall included C. rotundifolia and P. confertus. Plant species that attracted the greatest number of bee species overall included G. viscosissimum, H. maximiliani, E. speciosus, and G. aristata. Those plant species that attracted the fewest bee species overall included C. rotundifolia and P. hastata.
We also found that different flower strip species were visited by different bee assemblages (P < 0.01; Figure 8). For example, some of the plant species that supported the greatest abundance and richness of bees, including E. speciosus, G. viscosissimum, and H. maximiliani, were visited by very different bee assemblages from one another. Furthermore, the bee assemblages visiting each plant species varied across farms (P < 0.01). For example, the bee assemblage that visited H. maximiliani at Gallatin Grown was different than that which visited H. maximiliani at Gallatin Valley Botanical.
These types of data can help identify which plant species would be used by the most diverse suites of bee species, if limited in the ability to plant numerous species, or to guide other conservation goals like supporting particular groups of bees, like bumble bees, or rare bee species. For example, some plant species supported bee assemblages that overlapped considerably with others, suggesting that a subset of plant species could be chosen for planting, while still supporting highly diverse bee communities. However, some plants supported several bee species that were not documented visiting any other plant species. Together, our results suggest that a carefully chosen suite of plant species could support diverse groups of common and rare species.
Yellow pan traps. Among the 211 bee taxa documented across farms, we collected 161 taxa using yellow pan traps, which comprised 76% of the total bee taxa on farms. Of these 161 taxa, 85 taxa were also collected on flower strips using nets and 70 taxa were unique to pan traps (i.e. only sampled in pan traps). It is possible that with additional sampling, we may collect taxa on the flower strips that had originally only been observed in pan traps and vice versa. It is also possible that our flower strips are lacking plant species to support those bee taxa only collected in bowls.
We found no differences in mean bee abundances in pan traps among farms or years (P > 0.08), but we did find significant differences among sampling weeks and distances (both P < 0.01). We found the highest bee abundances furthest from the flower strips (180m) and the lowest bee abundances in pans located at the 20m position, followed by those alongside the flower strips, and then those at the 60m position. As with bee abundances, we found no differences in mean bee richness in pan traps among years (P = 0.928), but we did see differences among farms and sampling weeks (P < 0.03). We also found significant difference among distances (P < 0.01), with the highest bee richness furthest from the flower strips (180m), followed by pan traps alongside the flower strips, at the 60m position, and then the 20m position. In addition, bee community composition varied among years, farms, sampling weeks, and distances (all P < 0.01).
Our pan trap findings with respect to distance appear counter to expected (i.e., we hypothesized that pan traps would capture the most bees and species close to the flower strip), but there are several factors that could help explain our results. For example, it is possible that pan traps are less attractive when near the flower strip. In the absence of flowers, farther from the flower strips, pan traps may act as magnets that are highly attractive to bees seeking floral resources. Additionally, because of the size and layout of farms, the 180m location was positioned at one edge of the farm. This could have resulted in an unintended edge effect, with bees first encountering the 180m pan traps as they moved onto the farm from the surrounding landscape.
Objective 2. Determine the value of flower strips in improving crop pollination and yields through increases in the abundance, diversity, or behavior of native bees.
Bee visitation to squash. Honey bees (Apis mellifera) were the most dominant visitors to squash flowers (>70%) throughout the study, followed by small sweat bees, Lasioglossum (Dialictus) spp. in 2014 and 2015. In 2014, there were no differences among farms or with distance from the flower strip in bee visitation rates to squash flowers (P > 0.05). In 2015, bee visitation rates to squash flowers varied significantly among farms and declined marginally with distance from the flower strip (farm P < 0.05; distance P = 0.074).
Squash pollination. Reproductive success of squash (as measured by total seed mass per plant) was pollen limited across farms in 2013 and 2015, but not in 2014 (P < 0.04). Total seed mass of supplementally-pollinated plants was 14-15% higher than open-pollinated plants in 2013 and 2015. The magnitude of pollen limitation, however, did not vary with distance to the flower strip in either 2013 or 2015 (i.e., there were no pollination treatment by distance interactions; P > 0.05), indicating that squash crop proximity to the flower strip did not influence pollination services. Furthermore, variation in bee visitation rates to experimental squash strips among farms was not related to the magnitude of pollen limitation of squash reproduction.
It is possible that our flower strips lacked influence on squash pollination for several reasons. First, all farms had large squash and/or pumpkin plantings in addition to our small crop strips. These large cucurbit plantings offered plentiful flowers and therefore may have drawn bees away from our less-attractive crop strips. Second, honey bees were the most abundant flower visitors to squash in our crop strips, but they are not always the most efficient pollinators (Garibaldi et al. 2013). While native bees were abundant on these farms, they were not frequent visitors to squash flowers. Therefore, in this case, adding flower strips to support native bees may not enhance pollination of squash because native bees are not visiting squash. Third, the squash bee, Peponapis pruinosa, is a native squash specialist and very important throughout the U.S. for pollinating cucurbits. However, this species is not known to occur in Montana.
Bee visitation to sunflower. Bees visiting sunflowers in the experimental crop strips in 2013-2015 comprised four families (Andrenidae, Apidae, Halictidae, and Megachilidae). The long-horned bee Melissodes agilis (sunflower specialist) and honey bees were the most dominant visitors to sunflowers, followed by bumble bees (Bombus spp.) and the sweat bee Halictus ligatus. There were no differences among farms or with distance from the flower strip in bee visitation rates to sunflowers in any year (P > 0.05).
Sunflower pollination. Reproductive success of sunflowers (as measured by total seed mass per plant) was not pollen limited on any farm in any year (P > 0.05). Although sunflower reproductive success varied among farms in all years and was influenced by distance from the flower strip in 2013 and 2015 (farm P < 0.05; distance P < 0.03), these effects were not related to variation in pollination services.
Objective 3. Evaluate the potential of flower strips for native seed production and sales.
Cost-benefit analysis. Among the nine plant species, H. villosa, P.confertus, G.aristata, and M. fistulosa had the highest overall projected income from two years of seed sales (>$3,500 for each species). Helianthus maximiliani, C. rotundifolia, and E. speciosus had the next highest overall projected income (>$1,000 for each species). Phacelia hastata had the lowest projected income (<$100) and G. viscosissimum was calculated at a loss.
Costs of establishing and maintaining flower strips. The cost to purchase plant materials for a flower strip of the size we used (c. 432 ft2) depends on whether plugs are purchased wholesale (c. $20-$36 per species) or retail (c. $55-$100 per species). Because we planted each species at different densities to maximize floral display, there were also differences in estimated costs between species resulting from the increased labor to plant and water more plugs of the species with smaller growth habits (c. $8-12 per species). Estimated costs associated with weeding in 2013 were the same among species (c. $4 per species) because of similarities in the amount of open ground due to the small size of flower plugs. In subsequent years, as plants grew larger and filled out, estimated costs associated with flower strip maintenance (i.e. hand weeding) varied among species and ranged from c. $7-$14 per species in 2014 and from c. $5-$9 per species in 2015.
Costs of harvesting and cleaning seed. When taking a seed sales approach, estimated costs associated with processing and cleaning seed was the largest expense incurred and varied from c. $8-$86 per species in 2014 and from c. $2-$72 per species in 2015. Estimated costs associated with seed harvesting ranged from c. $5-$22 per species in 2014 and from c. $2-$22 per species in 2015. The cost of obtaining the appropriate licensing to sell seed in Montana given this scenario is $225 per farm and this cost was divided among the nine plant species ($25 per species).
Income from seed sales. There were large differences among plant species in potential income from seed sales which ranged from c. $100 to $10,000 per species in 2014 and from c. $63 to $7,200 per species in 2015.
Our cost-benefit analysis indicates that collecting wildflower seed for sales has the potential to be profitable and completely pay for the expenses associated with establishing and maintaining the flower strips in the first year (2013) as well as the maintenance costs incurred in the second year (2014). Notably, several of the major costs were only incurred in the first year of implementing flower strips, but the potential benefits of flower strips were observed on a yearly basis with few additional costs. But, the level of profitability depends on factors associated with both the individual plant species and the farm itself. Potential income could be even higher if producers took a more targeted approach and only collected seed of those plant species with the greatest profitability. Some of the largest estimated costs incurred in 2014 and 2015 resulted from the labor associated with undertaking a seed sales approach. However, if producers are not interested in harvesting seed for sales, it should be noted that flower strips do require continuous weeding to maintain. Flower strips did not increase yields of the crops on the farms we studied, but in cases where crop yields are increased by incorporating flower strips, those profits can offset the yearly costs of maintaining flower strips (Blaauw and Isaacs 2014).
Objective 4. Execute a research-based outreach program to communicate our findings to producers, land managers, agricultural professionals (e.g., NRCS personnel and Extension agents), scientists, and the general public.
In total, 147 surveys were filled out (74 pre- and 73 post-surveys). In pre-surveys, participants were the least knowledgeable on the subject of native bees. While more than 70% of participants responded ‘yes’ they were aware of honey bee and other pollinator declines, less than 11% responded ‘yes’ they were familiar with the diversity of native bees and their life cycles (though 41% responded they were ‘somewhat’ familiar; Figure 9). Almost 95% of participants responded ‘yes’ they would like to learn more about native bee diversity. Less than 25% of participants responded ‘yes’ they were familiar with native plants of Montana and with habitat management practices that use native wildflower plantings to enhance food and habitat for pollinators. Those pre-survey participants that were also farmers were asked to answer additional questions including whether they manage their farms with pollinators and beneficial insect in mind, whether they are familiar with government cost-share programs for supporting pollinators, and questions about pollination services (Figure 10). More than 90% of participants said ‘yes’ they would consider adding native wildflowers to their farm management scheme if they were shown to increase native bees AND pollination services to crops. Even more encouraging for adoption, 75% responded ‘yes’ they would consider adding native wildflowers to their farm management scheme if they were shown to increase native bees, BUT NOT pollination services to crops.
In post-surveys, more than 73% of participants responded ‘yes’ for all questions and 100% of participants responded ‘yes’ to increasing their awareness of native bees and providing new knowledge (Figure 11). In 95% of post surveys, participants responded they would share the information they learned from our presentations with at least one other person. The greatest number of participants (39%) responded they would share this information with 3-5 people (Figure 12). For example, one participant, who said they would share this information with 10+ other people, wrote “Am attending a symposium on Gardening and Changing Climate. Am sharing this handout on Montana native plants for improving bee habitat. Fabulous!”.
References:
Allen-Wardell, G., P. Bernhardt, R. Bitner, A. Burquez, S. Buchmann, et al. 1998. The potential consequences of pollinator declines on the conservation of biodiversity and stability of food crop yields. Conservation Biology 12:8-17.
Blaauw, B.R. and R. Isaacs. 2014. Flower plantings increase wild bee abundance and the pollinations services provided to a pollination-dependent crop. Journal of Applied Ecology doi:10.111/1365-2664.12257.
Cane, J.H., R.L. Minckley, and L.J. Kervin. 2000. Sampling bees (Hymenoptera: Apiformes) for pollinator community studies: Pitfalls of pan-trapping. Journal of the Kansas Entomological Society 73, 225-231.
Garibaldi, L.A., I. Steffan-Dewenter, R. Winfree, M.A. Aizen et al. 2013. Wild pollinators enhance fruit set of crops regardless of honey bee abundance. Science 339, 1608-1611.
Gathmann, A., and T. Tscharntke. 2002. Foraging ranges of solitary bees. Journal of Animal Ecology 71:757-764.
Goulson, D. 2003. Conserving wild bees for crop pollination. Food, Agriculture & Environment 1:142-144.
Goulson, D., E. Nicholls, C. Botias, and E.L. Rotheray. 2015. Bee declines driven by combined stress from parasites, pesticides, and lack of flowers. Science 347, 1255957 doi: 10.1126/science.1255957
Isaacs, R., J. Tuell, A. Fiedler, M. Gardiner, and D. Landis. 2009. Maximizing arthropod-mediated ecosystem services in agricultural landscapes: the role of native plants. Frontiers in Ecology and the Environment 7:196-203.
Kearns, C.A., D.W. Inouye, and N.M. Waser. 1998. Endangered mutualisms: the conservation of plant-pollinator interactions. Annual Review of Ecology and Systematics 29:83-112.
Klein, A.M., B.E. Vaissiere, J.H. Cane, I. Steffan-Dewenter, S.A. Cunningham, C. Kremen, and T. Tscharntke. 2007. Importance of pollinators in changing landscapes for world crops. Proceedings of the Royal Society B-Biological Sciences 274:303-313.
Kremen, C., N.M. Williams, and R.W. Thorp. 2002. Crop pollination from native bees at risk from agricultural intensification. Proceedings of the National Academy of Sciences of the United States of America 99:16812-16816.
Michener, C.D. 2000. The Bees of the World. The Johns Hopkins University Press, Baltimore and London.
NRC (National Research Council). 2007. Status of pollinators in North America. The National Academies Press, Washington, D.C.
Roulston, T.H., S.A. Smith, and A.L. Brewster. 2007. Comparison of pan trap and intensive net sampling techniques for documenting a bee (Hymenoptera: Apiformes) fauna. Journal of the Kansas Entomological Society 80, 179-181.
Russo, L., N. DeBarros, S. Yang, K. Shea, and D. Mortensen. 2013. Supporting crop pollinators with floral resources: network-based phenological matching. Ecology and Evolution 3:3125-3140.
Tuell, J.K., A.K. Fiedler, D. Landis, and R. Isaacs. 2008. Visitation by wild and managed bees (Hymenoptera : Apoidea) to eastern US native plants for use in conservation programs. Environmental Entomology 37:707-718.
Walton, N.J. and R. Isaacs. 2011. Influence of native flowering plant strips on natural enemies and herbivores in adjacent blueberry fields. Environmental Entomology 40, 697-705.
Whittingham, M.J. 2011. The future of agri-environment schemes: biodiversity gains and ecosystem service delivery? Journal of Applied Ecology 48: 509-513.
Winfree, R., N.M. Williams, J. Dushoff, and C. Kremen. 2007. Native bees provide insurance against ongoing honey bee losses. Ecology Letters 10:1105-1113.
Figure 2-Flower strip establishment
Figure 4-Bee abundance and richness among years
Figure 5-Bee abundance and richness among farms
Figure 6-Bee community composition among years and farms
Figure 7-Bee abundance and richness among plant species
Figure 8-Bee community composition among plant species
Figure 9-Pre-survey results questions 1-8
Prior to this research, very little was known about the types of native bees associated with agroecosystems in Montana. At the most basic level, this research has increased our understanding substantially of the diversity, biology, and ecology of wild bees on farmlands in Montana. During the course of this project, we have assembled a large reference collection of wild bees with expert identifications that will aid future native bee research in the state. It also contributes to our long-term goal of developing a comprehensive bee species list and reference collection for Montana, since no such information exists.
Few studies have documented the value of native perennial wildflower plantings as a habitat management strategy for supporting wild bees on farms or increasing crop pollination. Our research has contributed to this knowledge gap. We have provided practical information on implementing wildflower strips, as well as data on the abundance, richness, and assemblages of wild bees that visited wildflower plantings. We have identified plant species important as food resources throughout the growing season for wild bees. In doing so, we have provided data to help guide stakeholders in plant selection and make informed bee conservation decisions, since much of the information on plant selection for habitat enhancement is anecdotal. We found that flower strips did not enhance pollination or bee visitation to the crops we studied, though they may be important for other crops or in other agricultural settings. We increased understanding of the bees that visited squash and sunflower crop plants on farms.
Improved crop pollination and yield is one potential economic benefit of incorporating wildflower plantings into farmlands. We have demonstrated that flower strips could also provide an economic benefit via income from the sale of wildflower seeds. To our knowledge, no previous research has explored this possibility, but it provides another incentive for adopting this strategy for supporting pollinators.
We received positive feedback in person and via surveys at all outreach events. In addition, surveys demonstrated that participants gained knowledge on a variety of topics, including native bees, native bee conservation, native plants, and habitat management strategies. The majority of participants filling out surveys (95%) also indicated they would share that knowledge with at least one other person, increasing the potential impact of our efforts. As data continues to accumulate and benefits of wildflower plantings are demonstrated, we suspect that more producers and land managers will adopt this strategy for pollinator conservation.
Research outcomes
Education and Outreach
Participation summary:
Over the course of this project we participated in numerous outreach events detailed below.
Field days and a farmer’s market booth:
- MSU Horticulture Farm and Towne’s Harvest Garden Field Day sponsored by Montana State University College of Agriculture and Montana Organic Association (June 2013).
- NRCS Bridger Plant Materials Center Field Day which featured conservation plant solutions (approx. 50-60 participants including scientists, NRCS personnel, Extension agents, and the general public; conducted surveys after participants visited our educational station; Bridger, Montana; June 2015).
- MSU Horticulture Farm Field Day sponsored by Montana State University College of Agriculture (approx. 35 participants including producers, scientists, and the general public; July 2015).
- Educational booth at the Gallatin Valley Farmer’s Market (alongside the Master Gardeners with MSU Extension; conducted outreach surveys; distributed native seed collected from our flower strips; August 2015).
Workshops:
- We presented a workshop titled “Introduction to Montana native bees” at the Montana Native Plants Society (MNPS) Annual Meeting where participants had the opportunity to build their own bee hotels (general public; 15 participants; June 2014).
- We presented a “Pollinator Identification Workshop” at the 8th Annual Montana Plant Conservation Conference, sponsored by the MNPS, Montana Natural Heritage Program, U.S. Forest Service, and NRCS (approx. 100 participants including scientists, NRCS personnel, Extension agents, and the general public; February 2014).
Invited presentations:
- MNPS Valley of the Flowers chapter, “Attracting and conserving native bees using native plants in Montana”, (approx. 50-60 participants; January 2014).
- Annual Montana Plant Conservation Conference, sponsored by the MNPS, Montana Natural Heritage Program, U.S. Forest Service, and NRCS, “Effects of Fragmentation on Pollinators and Plant-Pollinator Interactions”, (approx. 100 participants including scientists, NRCS personnel, Extension agents, and the general public; February 2014).
- MNPS Calypso chapter, 7th Annual Gardening with Natives Workshop, “Gardening for native bees”, (general public; more than 80 participants; April 2014).
- Cashman Nursery: local garden center, “Encouraging native bees in your garden”, (general public; 15-20 participants; May 2014).
- Montana Organic Association’s (MOA) 13th Annual Conference, “Identification and conservation of native bees”, one four concurrent talks (approx. 20 participants; conducted outreach surveys; gave away native seed from our flower strips). Among MOA’s goals are promoting organic agriculture for the good of the environment and the meeting was comprised of producers, processors, retailers, consumers, NRCS personnel, Extensions agents, and researchers (December 2015).
- Pollinator Protection Symposium sponsored by the Montana Department of Agriculture, “Identifying and conserving native bees”, (40 participants, all from the horticultural industry, including nursery owners, employees, and landscapers; September 2015).
- MSU Extension’s Small Acres Management Course, which is geared towards helping landowners and land managers create informed management plans by understanding the natural resources on these lands (14 participants; conducted outreach surveys; May 2015).
- Whitehall Garden Club, Identification and conservation of native bees”, (25 participants; gardeners and general public; April 2015).
- Museum Opening: “Supporting local bees and pollination services”, Audubon Society, Brinton Museum, Sheridan, WY (approx. 100 participants; August 2015).
- Montana Wilderness Association, “Wilderness and…wild bees and pollination”, Bozeman Public Library (approx. 50 participants; February 2016).
- Madison Watershed District, “Identifying and conserving native bees”, (17 participants; general public; conducted outreach surveys; May 2016).
- Southwest Montana Master Gardeners Association (SWMMGA), pollinator garden tour (15 participants; Master Gardeners; August 2016).
- C.M. Delphia, L.A. Burkle, and K.M. O’Neill. 2016. “Evaluating native perennial flower strips for enhancing native bees and pollination services on farmlands”, Invited symposium speaker, International Congress of Entomology (ICE) Meeting, Orlando, FL. September 25-30. Symposium title: Insights into the biology of wild and managed bees.
Student engagement:
- We hosted two WWOOF (World Wide Opportunities on Organic Farms) volunteers for a day at one of our participating organic farms. This is an organization that links organic farms in need of help with volunteers who would like to gain experience in organic farming. Using our approved pre- and post- outreach surveys, we surveyed the volunteers at the start of the day to determine their level of knowledge on several topics related to our project and again at the end of the day (after conducting sampling and talking with the volunteers about the project and its’ goals) to measure changes in their understanding and opinions of these same topics (July 2014).
- We also spoke to 20 students (many of which are hopeful future farmers) in the Sustainable Food and Bioenergy Systems Practicum at Montana State University about our research being conducted at Towne’s Harvest Garden, which is also the site of the hands-on learning aspect of the course (used pre- and post- outreach surveys to survey the students before and after speaking with them about our project; August 2014).
- We presented a guest lecture on native bees and native plants for a class titled ‘Insects and Society’ at MSU (19 students; February 2015).
- We hosted a First Year Research Experience (FYRE) student in the Undergraduate Scholars Program at MSU who worked primarily in the lab processing insect specimens, but also assisted at the BPMC field day. The goal of the FYRE program is to connect freshman with hands-on research experiences; February-August 2015).
- We hosted a student in the McNair Scholars Program who worked on an independent research project examining variation the quality (i.e., protein content) of pollen among the nine native plants in our flower strips and how this might influence bumble bee foraging. The McNair program is targeted toward students often underrepresented in graduate schools (first-generation/low income students or minorities; May 2015-May 2016).
- We hosted a student (senior in Organismal Biology) who conducted an undergraduate research project examining 2015 flower strip seed data. The student cleaned, weighed, and counted seed, as well as conducted seed germination and viability testing and data analyses (January-May 2016).
Media attention:
We were interviewed for a story for the MSU Magazine, Mountains & Minds, as well as University Communications (MSU News). The MSU News story was picked up by our local newspaper (The Bozeman Daily Chronicle) and the Billings Gazette and shortly thereafter we were interviewed by ABCFox MT, which was broadcast on the local evening news (Summer 2015).
- The Montana State University Magazine: Mountains & Minds, “Sweet Science”
http://www.montana.edu/mountainsandminds/article.php?article=15531
- University Communications: MSU News
http://www.montana.edu/news/15615/montana-bees-get-washed-fluffed-and-brushed-for-msu-researchers
- ABCFox MT
We were interviewed about our research by Steve Elliott, Communication Coordinator, Western Integrated Pest Management Center (May 2016). He created a video highlighting our research: www.youtube.com/watch?v=JuX5OKAcedo
Information products:
- For each of the nine species used in the flower strips, we developed a plant fact sheet, which includes information on blooming periods, plant establishment, seed collecting, and the types of native bees that visited each plant species.
- We developed a technical note outlining the techniques used to establish flower strips and the benefits of flower strips for pollinator conservation and seed sales.
- We created a web page (http://www.montana.edu/cdelphia/research/nativebees) highlighting our project that includes photos of field sites, flower strips, individual plant species, and native bees and also displays our outreach materials.
- We are preparing two manuscripts for publication based on the results from Objectives 1-3, including one focused on the use of flower strips for improving crop pollination and for wildflower seed production and another focused on the use of flower strips for supporting wild bees on farms.
Education and Outreach Outcomes
Areas needing additional study
We have demonstrated that perennial wildflower strips provided resources for a diversity of wild bees present on farmlands. While the methods we used to establish flower strips worked well considering the smaller sizes of the farms and strips, it may not be a practical approach for implementation at a larger scale. Therefore, research is needed to investigate how these plant species respond to seeding to establish larger flower strips rather than transplanting from plugs. Additionally, we worked with small, diversified farms that already harbored diverse wild bee communities. Research is needed to examine how well flower strips perform on larger, less diversified farms with likely lower overall bee diversity and at sites with different soil and climatic conditions. Research should also be aimed at testing flower strip plantings within different cropping systems to determine the degree to which they enhance crop pollination in other agricultural settings.
Information Products
- Technical Note: Establishing native wildflower strips for wild bee conservation
- Plant fact sheet-Campanula rotundifolia
- Plant fact sheet-Erigeron speciosus
- Plant fact sheet-Gaillardia aristata
- Plant fact sheet-Geranium viscosissimum
- Plant fact sheet-Helianthus maximiliani
- Plant fact sheet-Heterotheca villosa
- Plant fact sheet-Monarda fistulosa
- Plant fact sheet-Penstemon confertus
- Plant fact sheet-Phacelia hastata