Final report for SW22-933
Project Information
California’s 34 million acres of rangelands support diverse social-ecological resources, including some of the world’s major biodiversity hotspots, watersheds for nearly all of the State’s surface waters, and a >$3B annual livestock industry. Climate change and weather extremes threaten the economic viability and environmental sustainability of these highly valued systems. Rangeland management is also challenged by the characteristic climatic and biophysical diversity variability of these systems—resulting in high spatiotemporal variability in supply of ecosystem services, including forage productivity. If California rangeland managers had access to reliable data across these vast, dynamic landscapes, then they would be able to make cost-effective, climate-informed grazing decisions to sustainably enhance productivity and profitability.
Our interdisciplinary team will build accessible decision-support tools based on high spatiotemporal resolution satellite remote sensing data to provide rangeland managers actionable information directly relevant to rangeland sustainability and ranch-level profitability. The proposed tools focus on tracking forage production—a top grazing management goal—and residual forage dry matter (RDM)—a critical rangeland health indicator for California’s annual grasslands.
Our research makes use of multi-scale, multi-source remote sensing imagery, augmented with on-ranch measurements, and provides more realistic range condition monitoring in near real-time. This effort capitalizes on our newly established, collaborative on-ranch monitoring sites across 32 counties. The field-based measurements will be used to further refine and calibrate an algorithm we previously developed for Landsat based forage production estimations. An automatic workflow will be developed to fuse Sentinel-2 10 m imagery every 5 days with Landsat imagery, augmented with higher resolution NAIP and Planet imagery.
We will also develop an innovative machine learning approach to estimate end-of-season RDM, by integrating improved growing season production time series, preceding weather, and soil properties, with concurrent Landsat/Sentinel imagery. The RDM estimation algorithm will be trained with field measured RDM with data augmentation from unique hyperspectral imagery. To reduce potential adoption barriers, we will take advantage of the Google cloud platform and APIs to create accessible data visualization and decision-support tools.
We will engage ranchers and other rangeland stakeholders throughout the project via our project Advisory Group, on-ranch research, and in-person workshops. Extension education resources will be co-developed with our rangeland partners and will include online multimedia (decision-support apps, videos), fact sheets/policy briefs, newsletters, and open access journal publications. We will collect feedback on effectiveness of workshop content and decision-support tools via focus group discussions and on-site evaluations at each workshop.
Near real-time, scalable remote monitoring and decision-support tools, combined with effective and inclusive education, will help us broadly deliver information critical to rangeland agricultural sustainability. The data-driven tools will complement on-ranch monitoring, help ranchers accurately visualize rangeland health and thus optimize livestock grazing management to promote forage productivity and maintain beneficial RDM levels. Expected near- to mid- term outcomes include stakeholder adoption of decision-support tools and enhanced skills in integrating forage production and RDM monitoring into rangeland decision-making. Potential long-term impacts include enhanced sustainability and resilience of California’s rangelands and ranches through better resource management.
Research Objectives
- Collect and compile ground-truthed data in collaboration with UCCE and FSA to build an extensive field-based geospatial database for California.
- Develop a well-calibrated remote sensing algorithm scalable statewide for consistent forage production estimates in near real-time.
- Develop a locally-optimized RDM estimation tool with multi-sensor imagery.
- Prototype an online interactive app to help stakeholders improve ranch management and risk mitigation decision-making.
Education Objectives
- Assemble an Advisory Group of diverse rangeland stakeholders to provide immediately actionable, on-the-ground user input to developing accessible decision-support tools.
- Engage with ranching, policy, research, and management communities to extend research products and collect feedback on tool usability for rangeland decision-making.
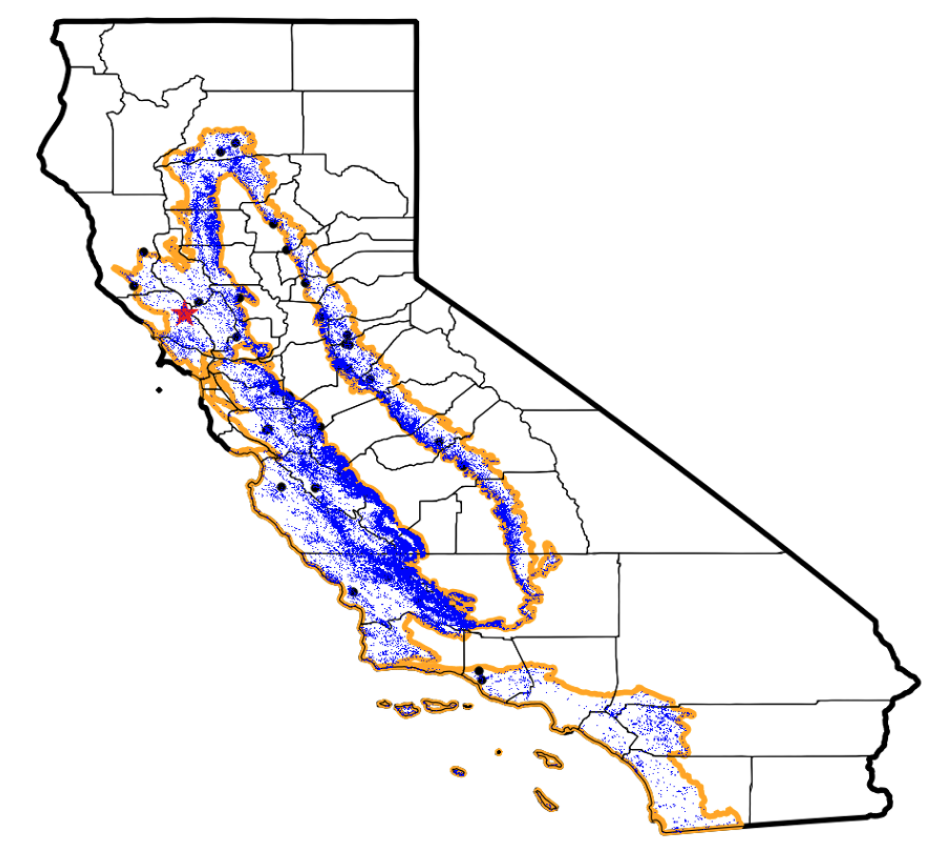
This timeline outlines major milestones and activities for project objectives. In support of Research Objectives 1 and 3, on-ranch monitoring sites have already been identified and installed in collaboration with ranchers and rangeland managers across 32 counties (Fig.1).
|
2022 |
2023 |
2024 |
2025 |
|||||||||
|
|
Q2 |
Q3 |
Q4 |
Q1 |
Q2 |
Q3 |
Q4 |
Q1 |
Q2 |
Q3 |
Q4 |
Q1 |
|
Research Objective 1 |
||||||||||||
|
Clip and measure forage production |
XXX | XXXXXXX | XXXXXXX | |||||||||
|
Collect RDM measurements |
XXX | XXX | ||||||||||
|
QA/QC and build the GIS database |
XXX | XXX | XXX | |||||||||
|
Research Objective 2 |
||||||||||||
|
Assemble NAIP imagery/environmental/weather data |
XXXXXXXXXXXXXXXXXXXXXXXXXXXXXXXXXXXXXXXXXX |
|||||||||||
|
Assemble Sentinel, Landsat and Planet imagery |
XXXXXXXXXXXXXXXXXXXXXXXXXXXXXXXXXXXXXXXXXXXXXX | |||||||||||
|
Generate herbaceous data layer |
XXX | XXX | ||||||||||
|
Develop multi-sensor data fusion |
XXXXXXXXXXXX | XXX | XXX | |||||||||
|
Calibrate/optimize light use efficiency parameterization |
XXXXXXXXXXXX | |||||||||||
|
Develop and test forage production workflow |
XXXXXXX | |||||||||||
|
Research Objective 3 |
||||||||||||
|
Customized ordering of PRISMA imagery |
XXXXXXX | XXXXXXX | ||||||||||
|
Develop and test PRISMA RDM approach |
XXXXXXX | XXXXXXX | ||||||||||
|
Develop/test operational RDM workflow |
XXXXXXX | |||||||||||
|
Research Objective 4 |
||||||||||||
|
Designing ideas for the API functions and dashboard |
XXX | XXXXXXX | ||||||||||
|
Prototype and implement forage production API |
XXX | XXXXXXX | ||||||||||
|
Prototype and implement RDM API |
XXXXXXX | |||||||||||
|
Prototype and test the decision support modules |
XXXXXXX | |||||||||||
|
App Roll out to the hosting sites and further refinement |
XXXXXXX | |||||||||||
|
Education Objective 1 |
||||||||||||
|
Identify project Advisory Group with producer cooperators and partners |
XXX | |||||||||||
|
Advisory Group meeting: identify types/scales of information relevant to management triggers |
XXX | |||||||||||
|
Advisory Group follow-up meetings: progress updates, beta-testing, and feedback |
XXX | XXX | XXX | |||||||||
|
Education Objective 2 |
||||||||||||
|
Develop in-person workshops with partners |
XXX | XXX | XXX | |||||||||
|
Promote workshop events, invite target audiences |
XXXXXXXX | XXXXXXXX | XXX | |||||||||
|
Finalize evaluations tools (workshop surveys/focus group questions) |
XXX | |||||||||||
|
Stakeholder decision-support tool workshops |
XXX | XXX | XXX | |||||||||
|
Analyze workshop evaluation data |
XXXXXXX | XXX | XXXXXXX | |||||||||
|
Develop online multimedia content: online hub, live-recorded presentations |
XXXXXXXXXXXXXXXXXXXXXXXXXXXXXXXXXXXXXXXXXXXXXX | |||||||||||
|
Develop educational resources: popular articles, fact sheets/policy briefs, newsletters |
XXXXXXXXXXXXXXXXXXXXXXXXXXXXXXXXXXXXXXXXXXXXXXXXXX | |||||||||||
|
Develop project reports and journal publications |
XXX | XXX | XXXXXXXXXXXXXXXX | |||||||||
Cooperators
- - Producer
- - Producer
- - Producer
- - Producer
Research
This project focused on California’s rangelands, where climatologically, ecologically, and topographically diverse landscapes pose the biggest challenge for sustainable ranching (Fig. 1).
Research Objective 1. Build an extensive field-based geospatial database on the aboveground biomass metrics over California’s rangeland, to be used to calibrate and evaluate the remote sensing-based monitoring algorithm.
In collaboration with UCCE and FSA collaborated (FSA funded field supplies and Loss Adjuster labor cost), we identified and established approximately 40 monitoring sites (700 m2) at the beginning of the project, providing a representative distribution of annual rangelands across all sub-ecoregions statewide (Fig. 1). In late spring of 2022, we reconvened our partners, revisited the exclosure site selection, and revised sampling and measurement protocol, based on the experiences during previous field season (September 2011 to March 2022). A total of 42 sites were finalized, representing the diversity of the annual grasslands across all sub-ecoregions statewide (Fig. 1). The exact locations of each sites were recorded by high precision Trimble GPS. To match the footprint size of available moderate to high spatial resolution satellite remote sensing data (~10 to 30 m), each site was situated in a large open grassland (> 45 x 45 m, a.k.a., Macro plots) and includes one large exclosure (14.63 x 14.63 m) to accommodate remote sensing and field clip-plot quantification. A total of 17 county based UCCE farm advisors and 5 regional FSA “Loss Adjusters” collected field data in 2021, 2022, and 2023.
Forage clippings were done once or twice a month from January to March to capture the rapid growth period, once in April/May to capture peak standing crop, and once from late September or October to capture RDM. Plant functional group composition (percent grass vs forb cover) was recorded at each sampling event (2021/2022 and 2022/2023 seasons); additionally, dominant species were recorded via the dry-weight-rank method at each site at peak standing crop (2022/2023 season). For the 2021/2022 season, clippings were specifically collected within non-grazed exclosures and in adjacent grazed areas. A subset of samples were sorted to separate new growth from old-growth (i.e., RDM) to measure the current year’s forage biomass to match satellite based estimations. This approach allowed us to assess the ability of the remote sensing platform to quantify forage biomass in paired grazed vs non-grazed areas, which can differ in build-up of RDM. For the 2022-2023 season, we continued to clip forage samples within grazing exclosures, field sorting samples with greater than 15% RDM cover.
For each monitoring site, 10-15 samples were clipped during each clipping event at each site. The clipping samples were averaged by date for each site, resulting in a total of 150 site-date data points for further analysis in Year 1. During Year 2 of the project, we continued forage clipping for another season following the same protocol, resulting in a total of 278 field clipping samples for model optimization (Obj. 2). RDM clipping was repeated during September - November, and a total of 85 data points were collected for RDM analysis and model building. Additionally, we also conducted quality assurance and quality control on all clipping data spanning three years. Overall, 32 sites had consistent field sampling between February and May in 2021, 2022, and 2023. By following the same protocols for sampling, field data collection, and preprocessing, we built a large geospatial database of forage production with high quality and consistency.
Research Objective 2. Develop a well-calibrated remote sensing algorithm scalable statewide for consistent forage production estimates in near real-time.
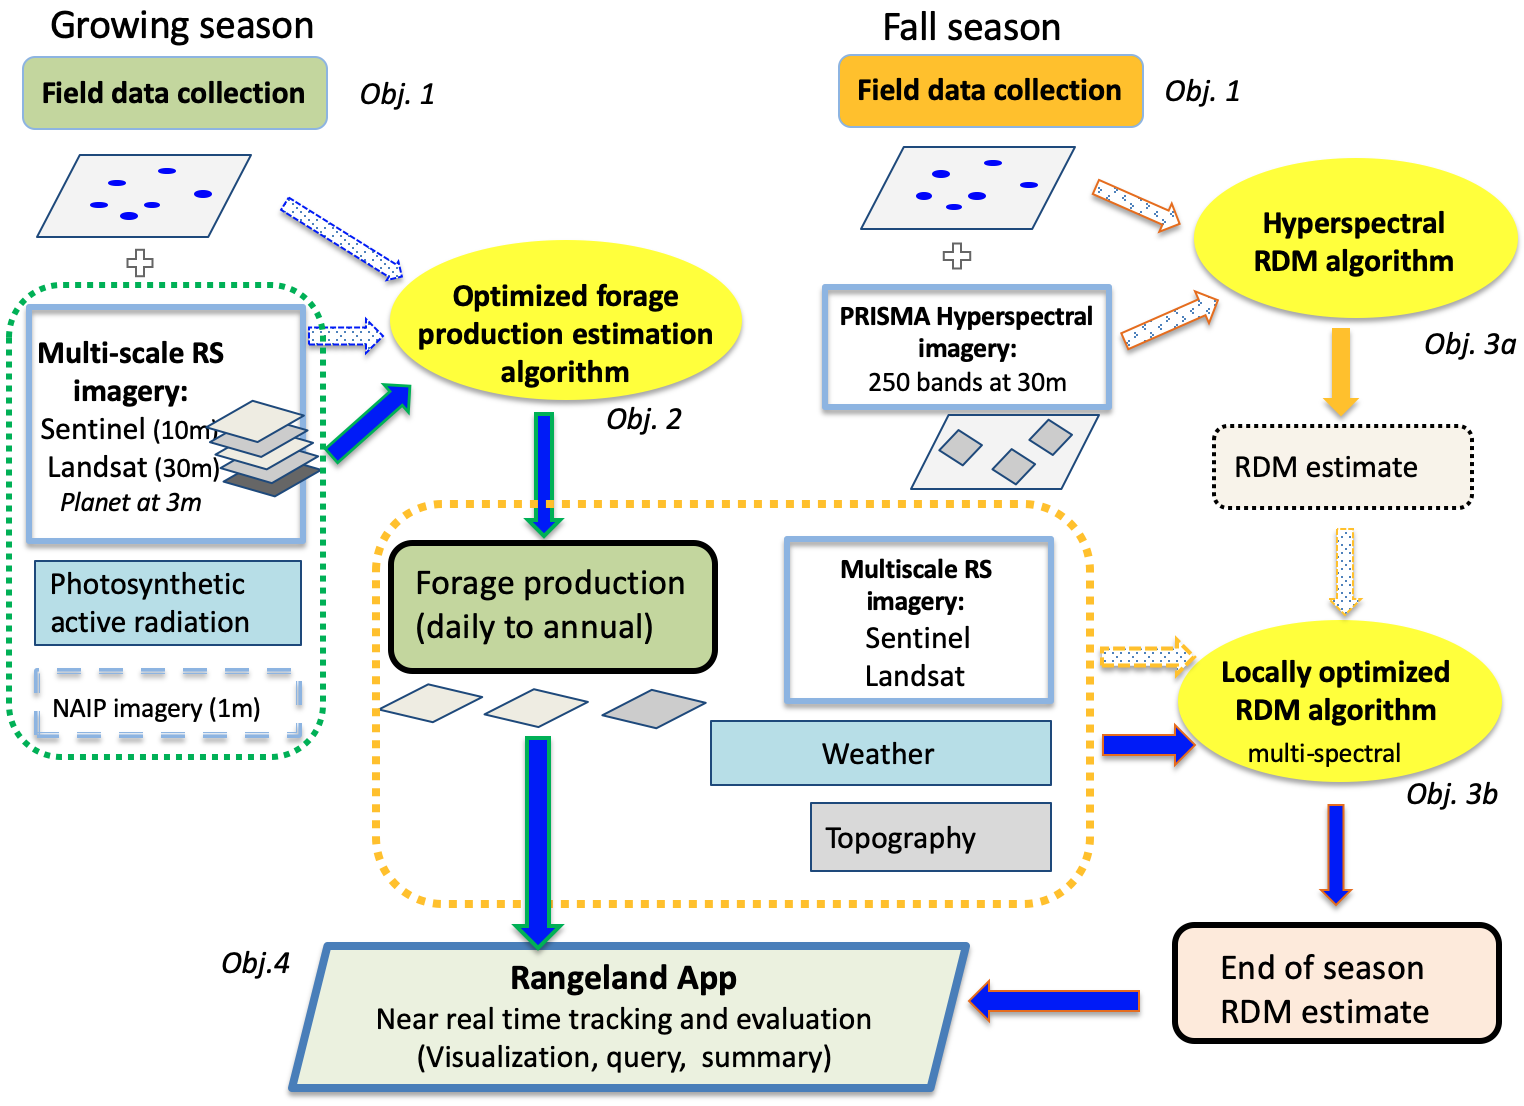
With this unique field dataset, we improved upon the remote sensing approach that we developed for forage production estimation using MODIS daily 250-m and Landsat 16-day 30-m satellite observations (Liu et al., 2021). Our prior approach was calibrated with limited exclosure site data. Moreover, it was applied only to herbaceous-dominated rangelands, to avoid the mixed woody-herbaceous pixel issue at 30-m resolution. In order to provide daily estimates for the majority of rangelands without the masking effects from shrubs and trees, higher spatial resolution imagery is needed as a main data stream. We relied on Sentinel 2A&B at 10 m every 5 days (plus Landsat), both publicly-available and free, for operational near real-time forage monitoring (Fig. 2).
Our focus was on all 10 ×10-m pixels without trees or shrubs. A first version of the base mask for herbacious cover at 10m was generated by first combining herbaceous or grasslands pixels from CalFire’s vegetation map and the 2023 National Land Cover Database (NLCD). Only pixels with NDVI lower than 0.3 in mid-August were retained for further analysis since the presence of trees and other perennial vegetation within a 10m pixel would increase the NDVI value compared to senescent grasses.
To estimate forage production, we adopted the similar biophysical light use approach, developed from our previous studies (Liu et al., 2019, 2021), and further improved the accuracy and robustness, especially with higher spatial and temporal resolution of Sentinel 2 satellite imagery than previously used Landsat 30m imagery, and leveraging the substantial field data from the newly established network of the exclosure sites for model training and testing.
We assembled weather data, including incoming solar radiation, temperature, precipitation, from CIMIS and PRISM, and the topographical indices such as elevation and soil data such as soil organic matter. We have downloaded Sentinel 2A & 2B imagery at 10m to 20m with repeated observations every 5 days from 2021 to May 2024. Images with more than 30% cloud cover were removed from the analysis. An automatic preprocessing workflow has been developed to generate a daily time series of remote sensing metrics, e.g., the Savitzky-Golay filter was applied to the original NDVI time series to fill the gap and remove the abnormal values; a linear interpolation was then performed to generate the daily time series of NDVI.
For each individual 10 m pure grass pixel, we have already identified the phenological metrics in California annual grasslands such as the start of the growing season (SOS), end of the growing season (EOS), and length of the growing season (LOS). The Sentinel-2 NDVI time series of each pixel was fitted with two sigmoidal curves (for dates before and after NDVI reached peak value) and the rate of change was then used to identify the SOS and EOS and estimate the growing season length, which was fed into the daily accumulation of forage production.
We improved the light use efficiency optimization with the available field data and extracted Sentinel-2 data. The baseline model was based on a constant light use efficiency determined by the accumulated absorbed photosynthetically active radiation (APAR) and the field measured forage production before and at the peak production. The improved optimization of LUE factored the impact of environmental stressors such as temperature and moisture stressor. In particular, the moisture scalar was represented by the Land Surface Water Index (LSWI), a remote sensing indicator sensitive to vegetation water content and soil moisture based on thee contrast of the surface reflectances in Sentinel 2 band B8A (Red Edge 4) and in the shortwave infrared band (B11).
The model parameters, including LUEmax and Topt, were optimized by the Stochastic Gradient Descent (SGD) algorithm, which updates model parameters via randomly selected subsets of the training data . We used 70% of the field data, randomly selected, for the optimization process, and the remaining 30% of the data for validation. Model performance was evaluated by the coefficient of determination (R2) and the root mean squared error (RMSE). Independent model validation was also conducted using the field data from the Pepperwood Preserve. Additionally, we also compared the herbaceous biomass data from field clipping and our estimation with those from the existing Rangeland Analysis Platform (RAP).
We applied the optimized light use efficiency model statewide and generated the forage production maps on Google Earth Engine (GEE). To characterize interannual variability, the temporal dynamics of forage production were analyzed for two recent years (2023 and 2024). In addition, San Luis Obispo (SLO) county and the Pepperwood Preserve were selected for case studies to further examine the spatial patterns and interannual variability of forage production from 2021 to 2024. Two years of statewide annual forage production was also generated to test the scalability of our approach. These products were shared with county advisors.
Research Objective 3. Develop a locally-optimized RDM estimation tool with multi-sensor imagery.
Recent work on variability and loss in RDM over the summer dry period (Larsen et al., 2020) suggests important implications for using remote sensing estimates of both growing and non-growing season above-ground biomass. To map RDM operationally during the dry season, our goal was to develop an innovative and scalable approach using locally optimized machine learning algorithms. We designed a two step approach: (1) scaling up the field measured RDM with unique hyperspectral measurements by PRISMA imager, operated by ASI (Agenzia Spaziale Italiana), over selected large areas, and (2) wall to wall cost-effective RDM mapping with the calibrated machine earning models to integrate improved growing season production estimates, factors related to decomposition, and coincident Landsat/Sentinel imagery.
We regularly submitted tasking orders to acquire PRISMA hyperspectral imagery at 30-m resolution from August 2022 to cover our monitoring sites. However, due to the low priority of US researchers to acquire PRISMA data, only a total of 10 and 11 scenes were acquired at a 30 × 30 km swath in 2022 and 2023, respectively. We also acquired another hyperspectral data set from NASA EMIT satellite. We are still exploring the relationship between cellulose absorption features at ~2100 nm and many other spectral features, such as Cellulose Absorption Index and the traditional broadband indices (NDRI) with field measured RDM. Work is ongoing to build a statistical model to identify the most important hyperspectral features and indices for RDM estimation across sites and estimate RDM with PRISMA/EMIT data. The calibrated model will then be applied to all herbaceous-dominated 30-m pixels to map RDM for each PRISMA scene. We will build a separate model to incorporate those broadband indices available from Landsat and Sentinel in fall, preceding weather, solar energy, and topography for a more robust RDM estimation, and then evaluate the improvement of PRISMA-based RDM method over existing approaches.
Research Objective 4. Prototype an online interactive app to help stakeholders improve ranch management and risk mitigation decision-making.
We have tested the capability of our approach in generating daily, weekly, and annual forage production at 10m across all California’s annual grassland. The calibrated algorithm for statewide application has been implemented on Google Earth Engine (GEE). This workflow automatically extracts and preprocesses remote sensing data from Sentinel 2 at 10m every 5 days. Time series of these remote sensing metrics were then integrated with weather data to automatically estimate forage production at daily time scale.
As an important aspect related to ranch management and risk mitigation decision-making, we analyzed the year-to-year fluctuation of historical forage production derived from remote sensing observations. The coefficient of variation (CV), defined as the ratio of the standard deviation divided by the mean, was used to represent the interannual variability in forage production as well as other vegetation and climatic factors. The 8-year moving window from 2001 to 2018 was applied to reduce the uncertainties caused by the disturbances such as drought. We applied the Mann-Kendall and the Theil-Sen methods to test the significance of and quantify the trends of the variability of forage production, for each 30m pixel, and then summarized over each sub-ecoregion. To further understand the trends of variability in forage production, the random forest model was built using a suite of remote sensing indices, climate indices as well as soil and topographical indices were used as predictors. The partial dependence plot was used to quantify how the trends of variations of forage production vary with each independent variable.
We have obtained the inputs from ranchers and local UCCE advisors on the key functional needs of an interactive API. A user-friendly dashboard will be designed to allow users to query, visualize, and summarize forage production and RDM at various scales. Various tabs will also permit users to examine spatial heterogeneity within and across management units. By combining with our previous historical daily forage production estimates at 30m resolution (Liu et al., 2020), end users can visualize deviations from average production (anomalies) at ranch, region, or state-wide scales, and make adaptive decisions.
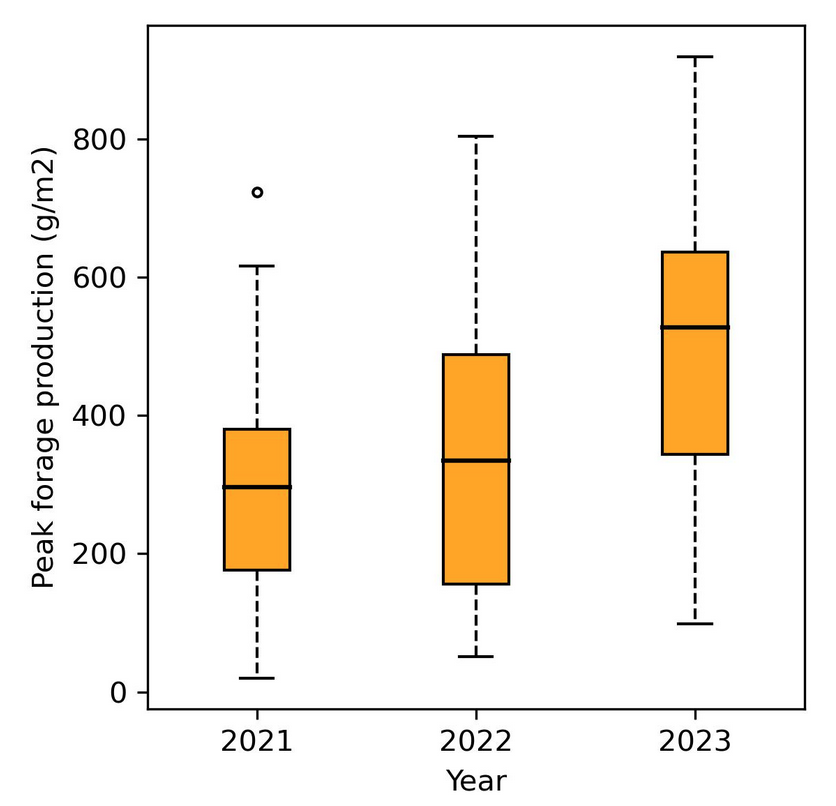
Field-based forage production variability
Our analysis of the field clipping data within the exclosures showed large variations among sites, with a peak biomass of 285 +/- 174 g/m2 during 2020-2021, 307 +/- 207 g/m2 during 2021-2022, and 524 +/- 207 g/m2 during 2022-2023 growing season (Figure 3). The least productive site occurred in Pulis in Tehama county, with a production of 79 g/m2 during 2020-2021 and 51 g/m2 during 2021-2022. In contrast, more productive sites, such as Gordon in Napa county, had a production of 723 g/m2 during the growing season of 2020-2021, and Orvis in Stanislaus county, had the highest forage production of 804 g/m2 during 2021-2022. Much higher production was found in spring 2023 than 2021 and 2022, most likely due to higher precipitation associated with exceptionally strong atmospheric river storms starting in December 2022 after three prior dry years. The most productive site in 2023, River Road in Monterey county, had an annual forage production of 919 g/m2.
LUE optimization and model evaluation
The LUE was optimized as a function of environmental stressors with weather and remotely sensed stress indicators from Sentinel 2, using the 70% of the field data within the exclosures from three years of data collection. As an example, APAR time series of the SJER site showed a strong seasonality and interannual variability (Fig. 4a); the regulation of lower temperature on LUE was captured by the temperature stressor in winter season, while the moisture scalar captured the impact of rainfall (timing and magnitude) and thus moisture on LUE (Figure 4b).
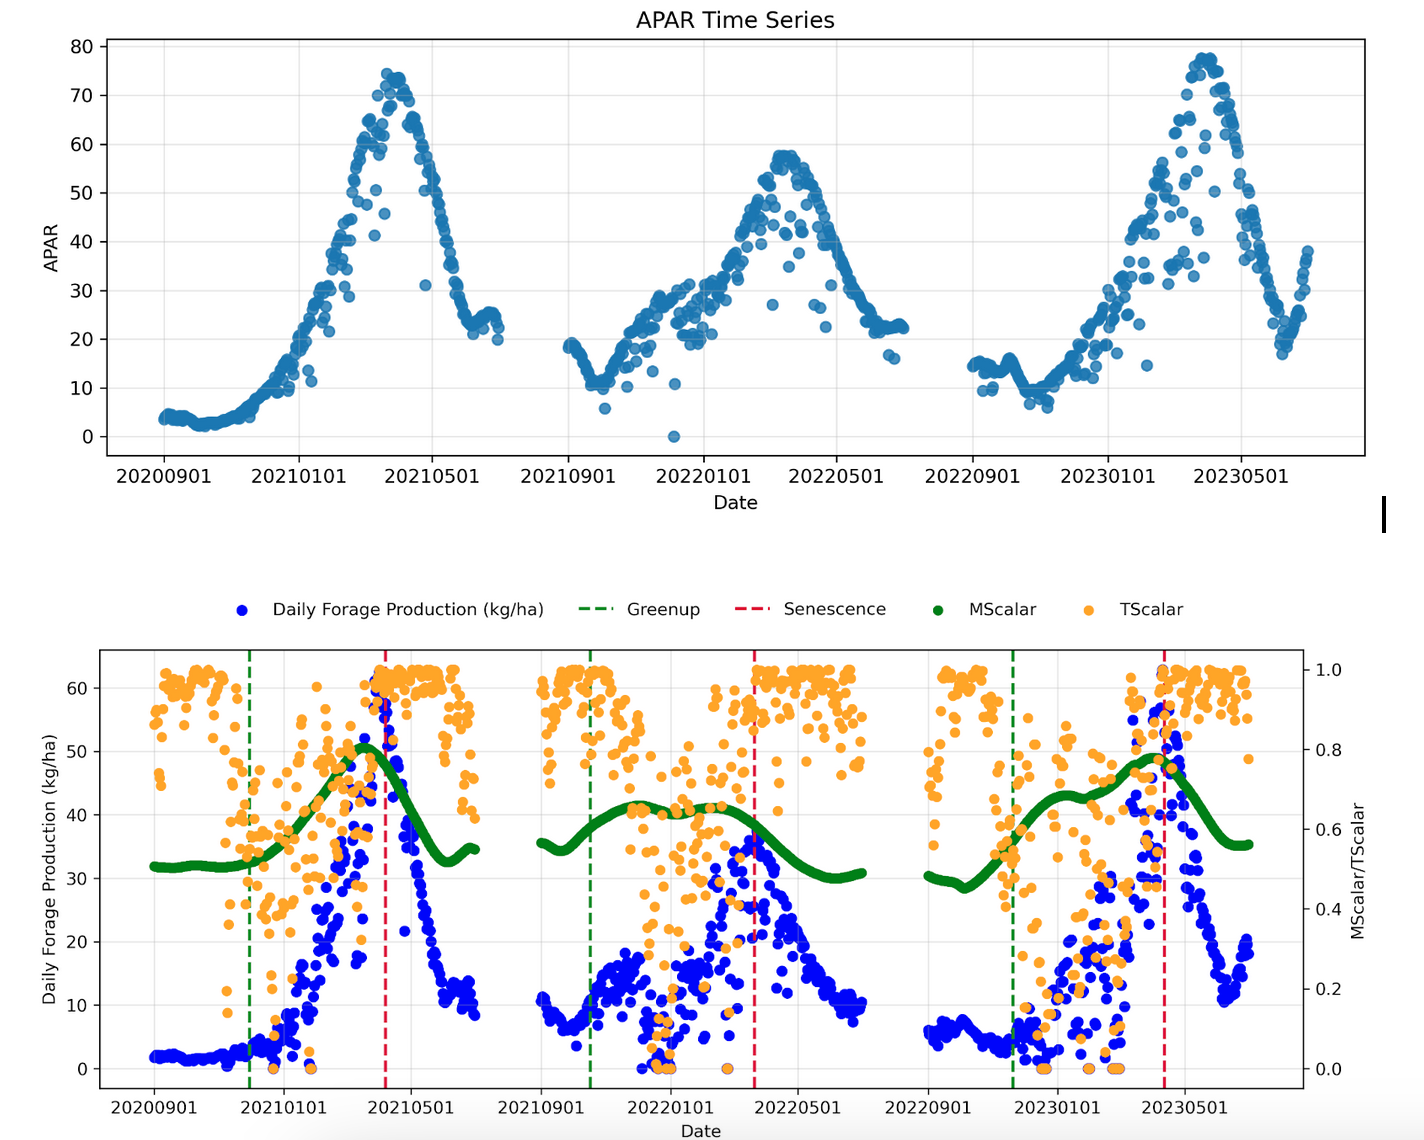
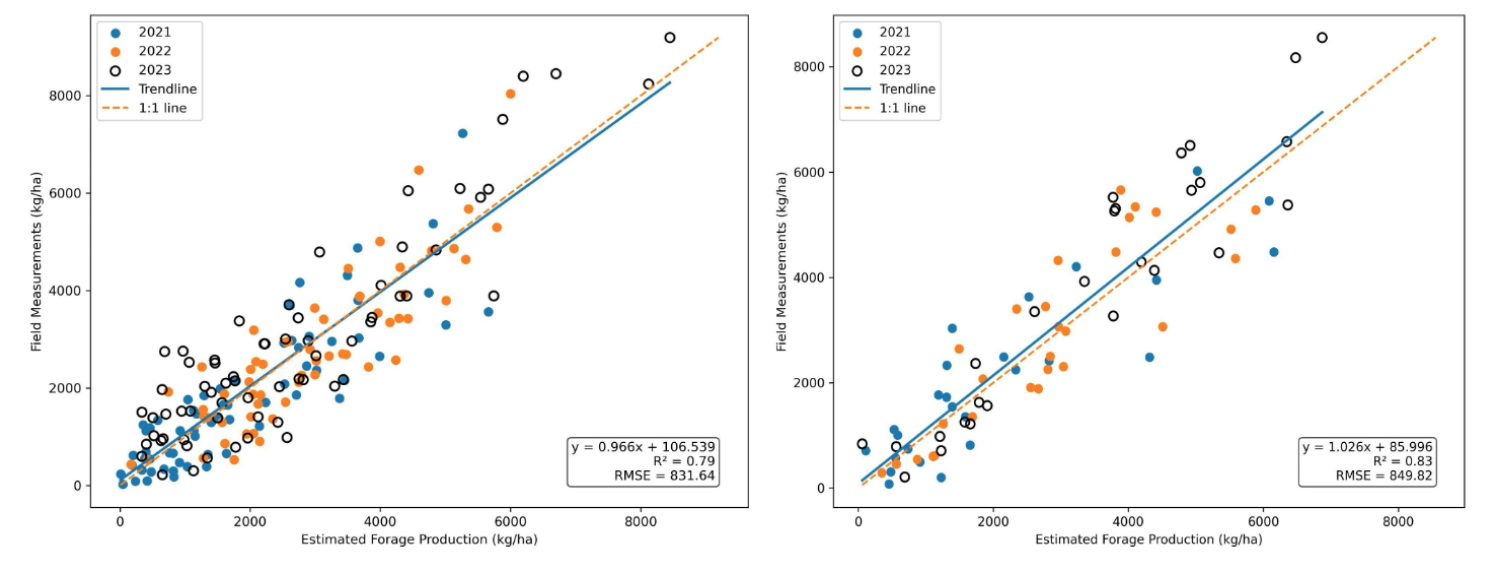
The estimated forage production with integrated APAR multiplied by LUE regulated by temperature and moisture scalars during the growing season agreed well with the dry biomass measurement, when compared with the 30% of the data used for testing, capturing 83% of variance and with RMSE of 849.8 kg/ha (Figure 5). As a comparison, the baseline model optimization with a constant LUE showed a slightly poorer performance, capturing lower variance (76%) and with a higher RMSE of 1009.3 kg/ha, highlighting the importance of including temperature and moisture scalars for forage production estimation.
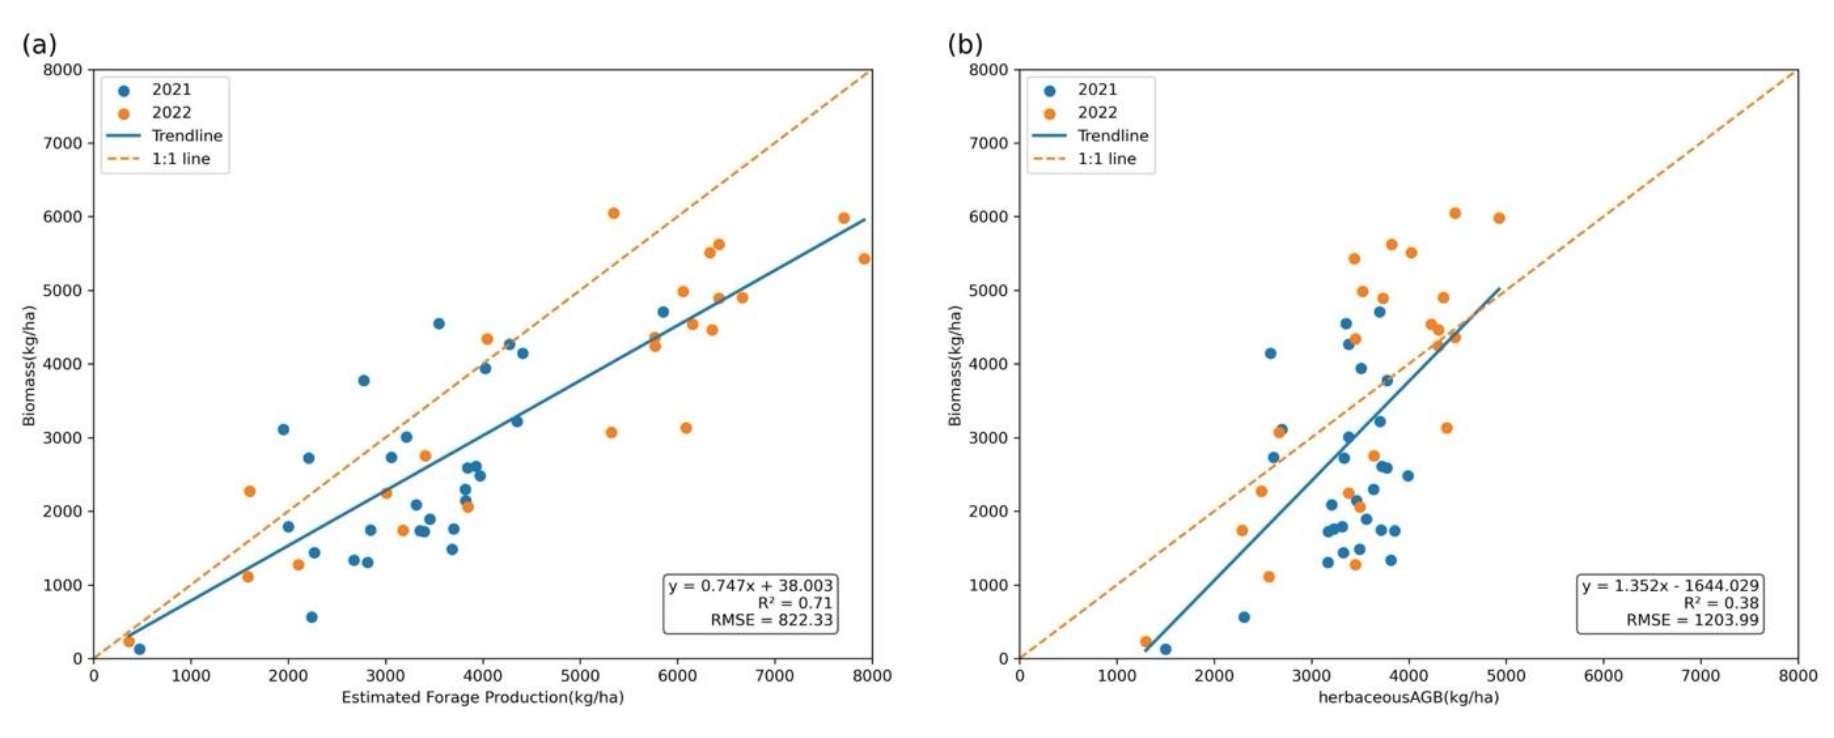
Independent testing with clipping data from the Pepperwood Preserve further showed the high of estimated forage production from the optimized LUE model (R2 = 0.71, RMSE = 822 kg/ha) (Figure 6a). In contrast, the herbaceous biomass estimation over same sites from the existing Rangeland Assessment Platform (RAP) had a much lower correlation with field measurements (R2 = 0.38, RMSE = 1204 kg/ha), with RAP estimates clustering within a narrower range and underestimating the forage production (Figure 6b).
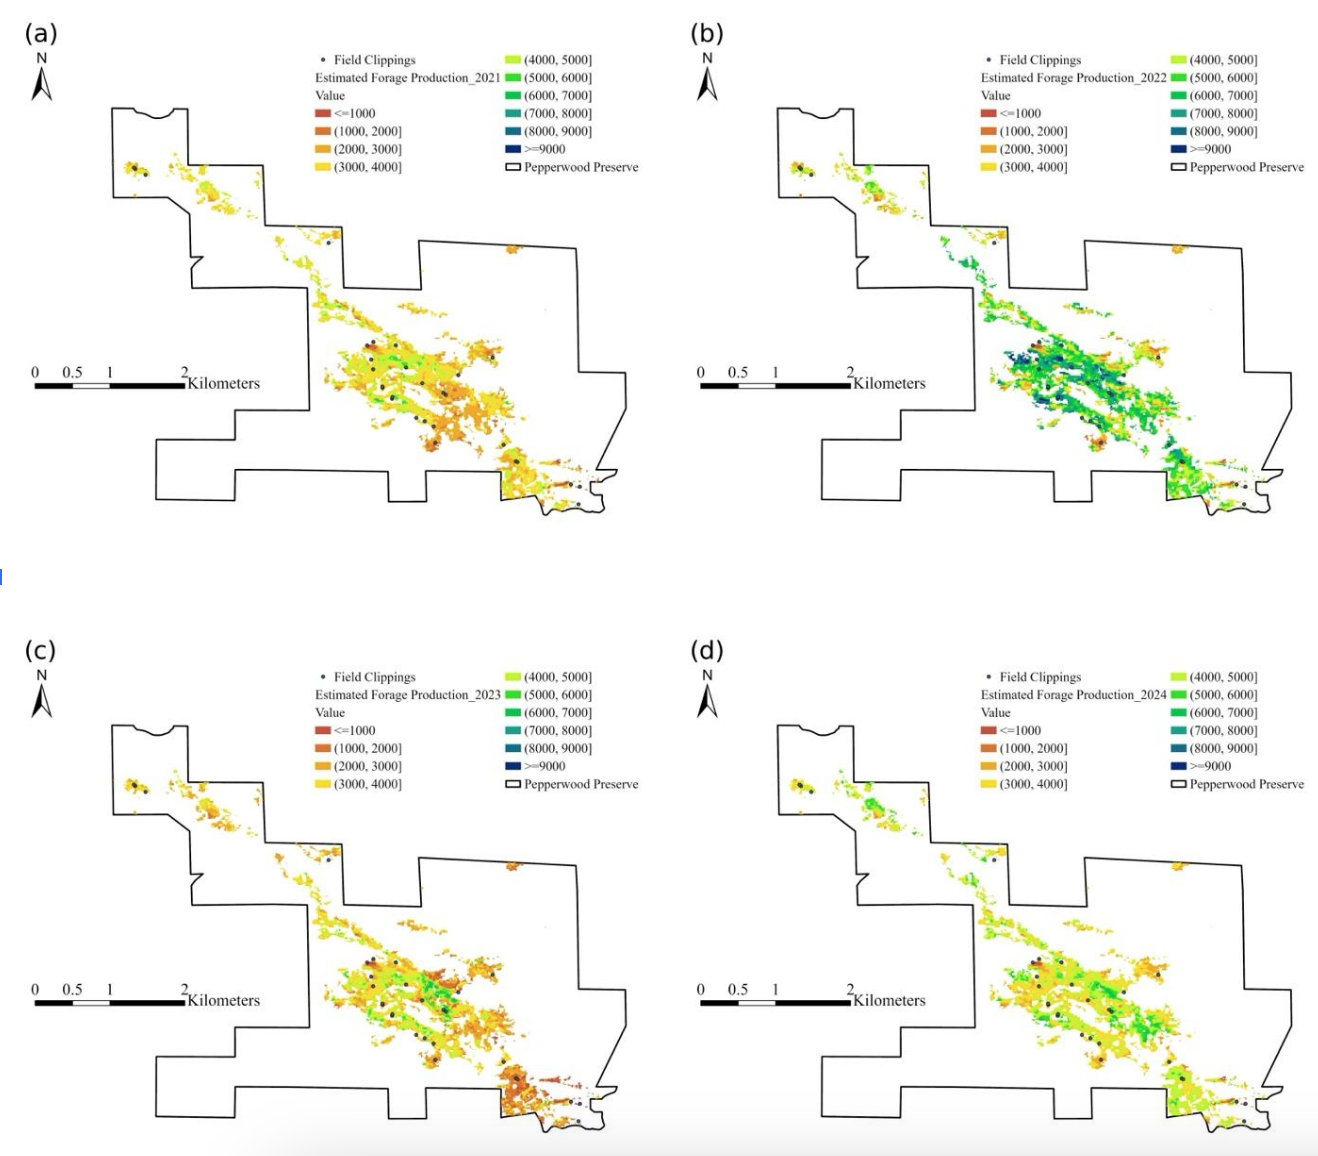
We mapped annual forage production at 10m from 2021 to 2024 over all grassland pixels over the Pepperwood preserve (Fig. 7). Forage production in 2022 was 3661.9 +/- 1182.1 kg/ha, much higher than that in 2021 (2324.1 +/- 569.9 kg/ha), consistent with the clipping data. Our estimation also captured the spatial variability of forage production in the Pepperwood Preserve (Figure 7).
The estimated forage production with the optimized LUE model and Sentinel 2 time series satellite observation showed that there is a large spatial variability within each county. For example, coastal areas were generally more productive than inland areas within San Luis Obispo County(Figure 8). Forage production also fluctuated significantly from year to year, e.g., much higher in 2023 and 2024 growing seasons than those in 2021 and 2022. Estimation for a couple of other counties was also done and shared with the advisors.
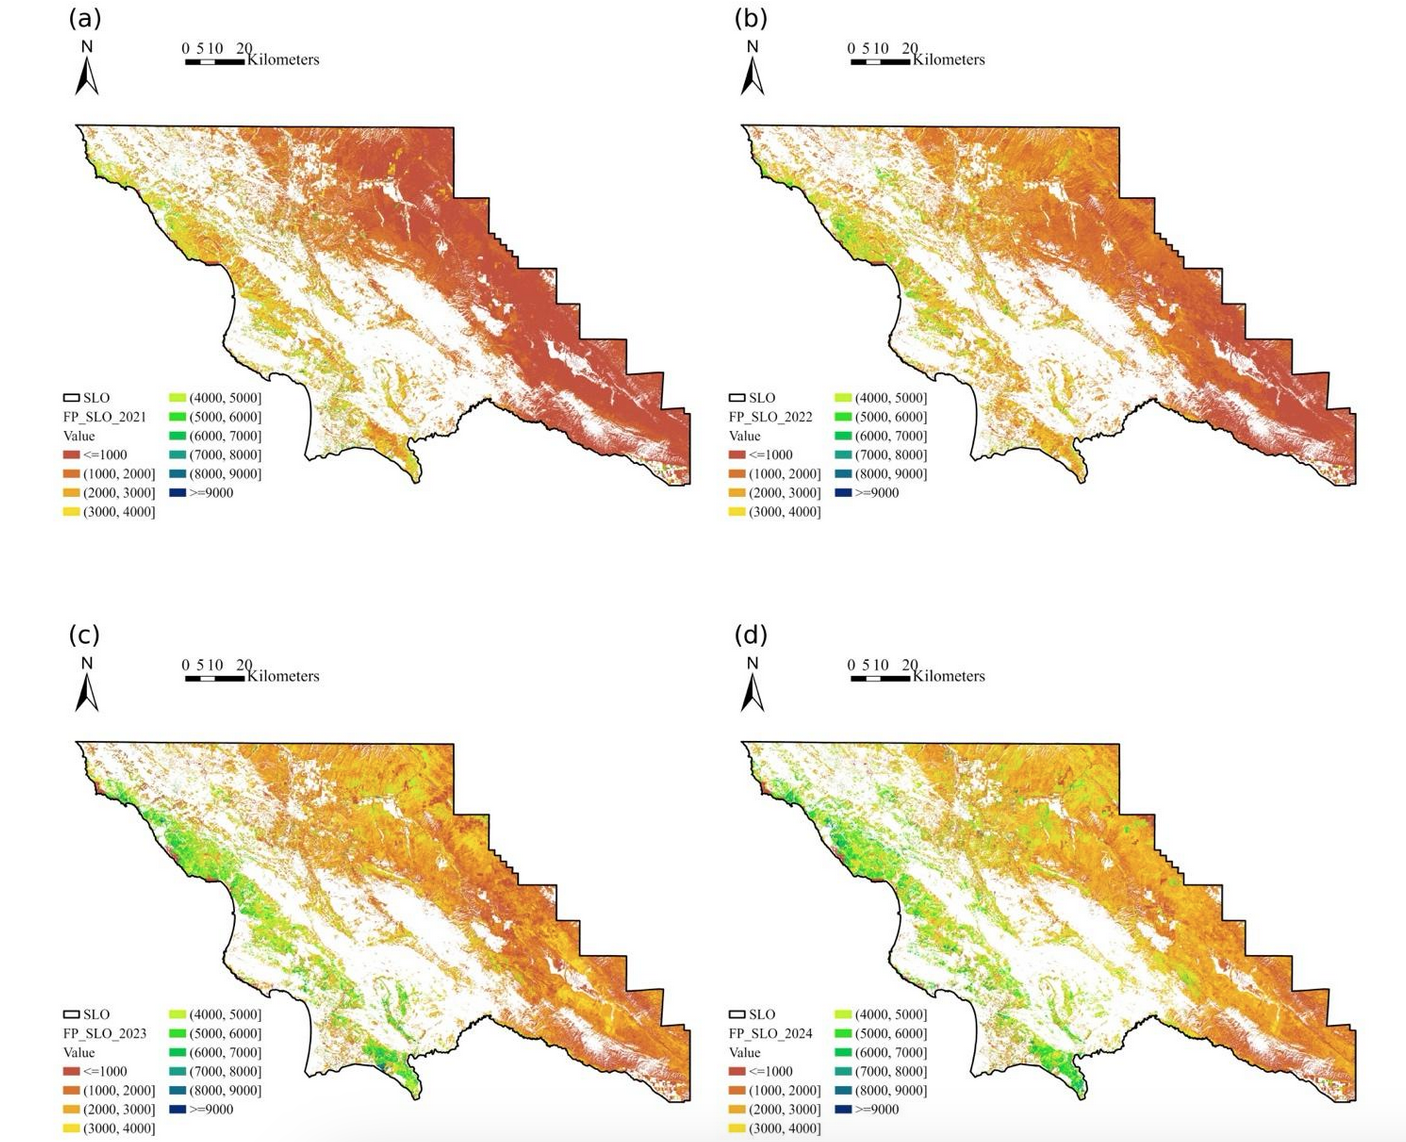
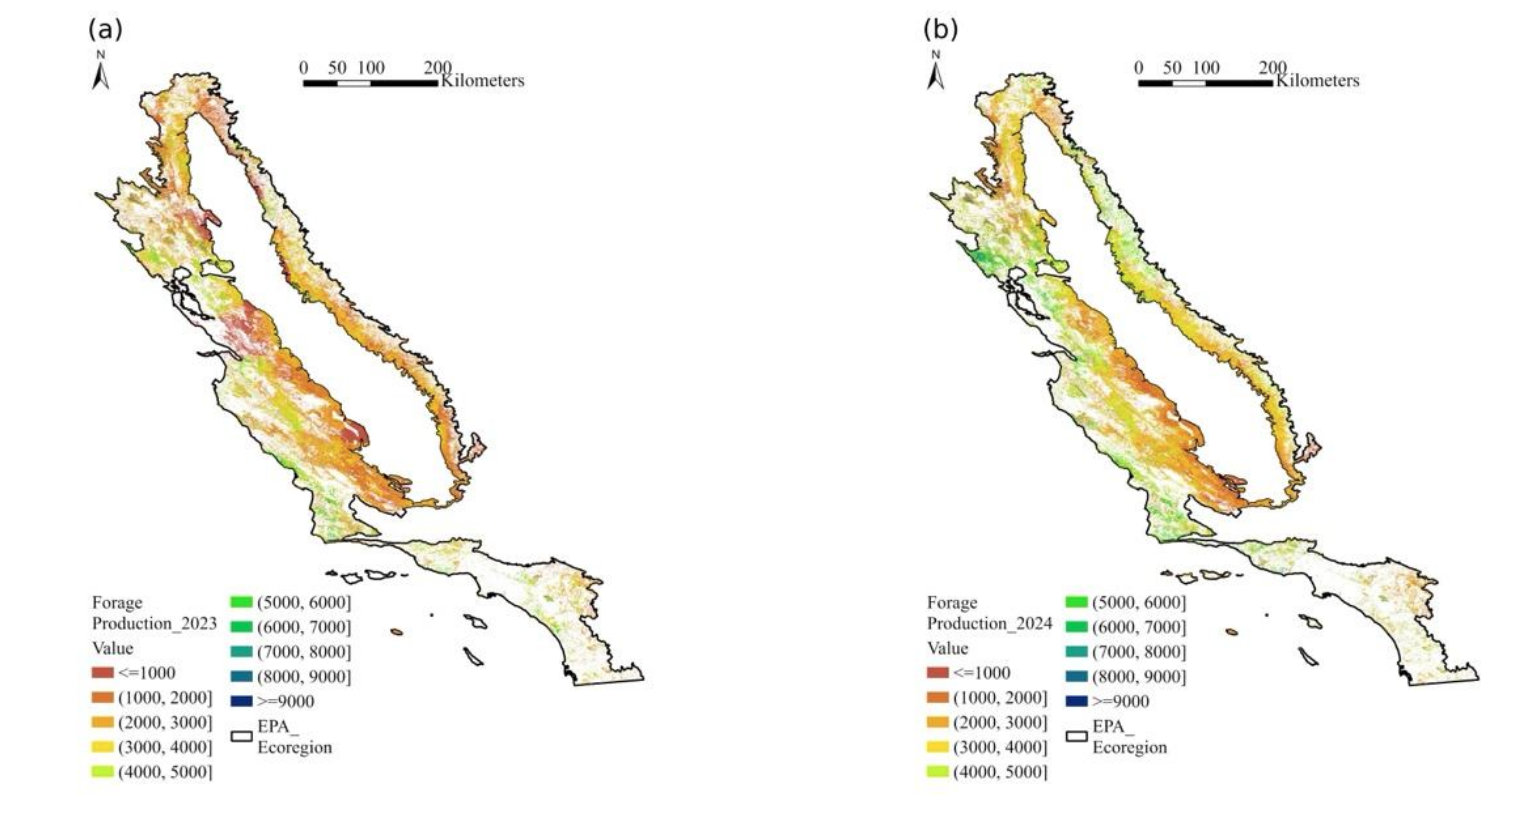
The scalability of our monitoring approach was demonstrated by the statewide forage production estimation (Figure 9). Forage production across the statewide study area showed stronger spatial variability during 2023 and 2024 (Figure 9a,b), ranging from less than 500 kg/ha in low productivity regions to more than 8000 kg/ha in high productivity regions. Higher productivity was primarily concentrated in the coastal and central foothill regions, while lower production was primarily distributed in the more arid southeastern California (Figure 9).
There was also interannual variability in forage production between 2023 and 2024. In 2023 (Figure 9a), forage production largely ranged from 1000 kg/ha to 4000 kg/ha, with only a small portion of regions–primarily along the coast and in the southern portion of the study area– exceeding more than 5000 kg/ha. In 2024 (Figure 9), forage production increased across much of the study area, particularly in coastal regions. These statewide results highlight the optimized LUE model’s sensitivity to interannual fluctuations in forage production as well as its ability to capture spatial variability across California’s annual grasslands.
The estimated forage production with the optimized LUE model and Sentinel 2 time series satellite observation showed that there is large spatial variability, e.g., within San Luis Obispo County (Figure 5) and Sacramento County (Figure 6). Forage production is much higher in 2023 growing season than that in 2022. Estimation for a couple of other counties was also done and shared with the advisors. The statewide estimation is almost done. We have also visited the Pepperwood Preserve, who agreed to share their clipping data and will use our forage map for their management. We will be hosting a workshop this fall to get the feedback from the producers and advisors. A manuscript is in preparation.
Trend of year–to-year forage production variability
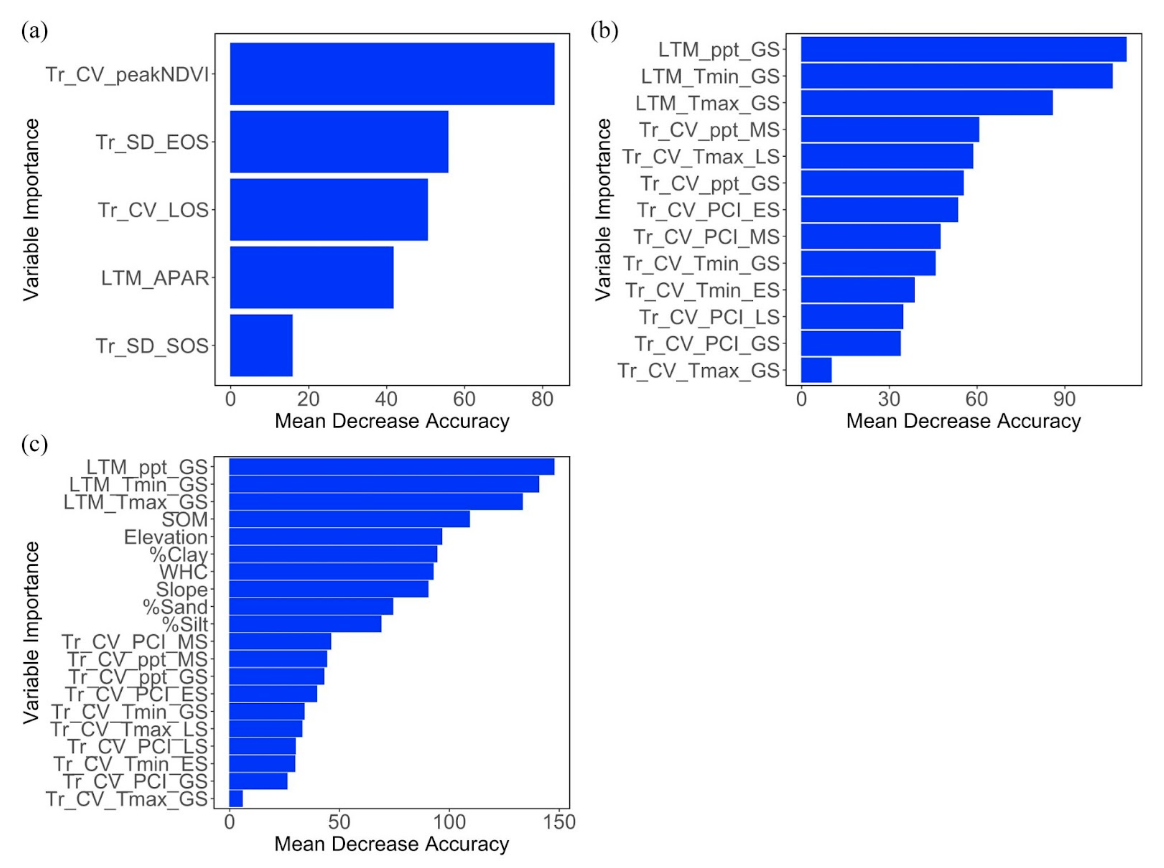
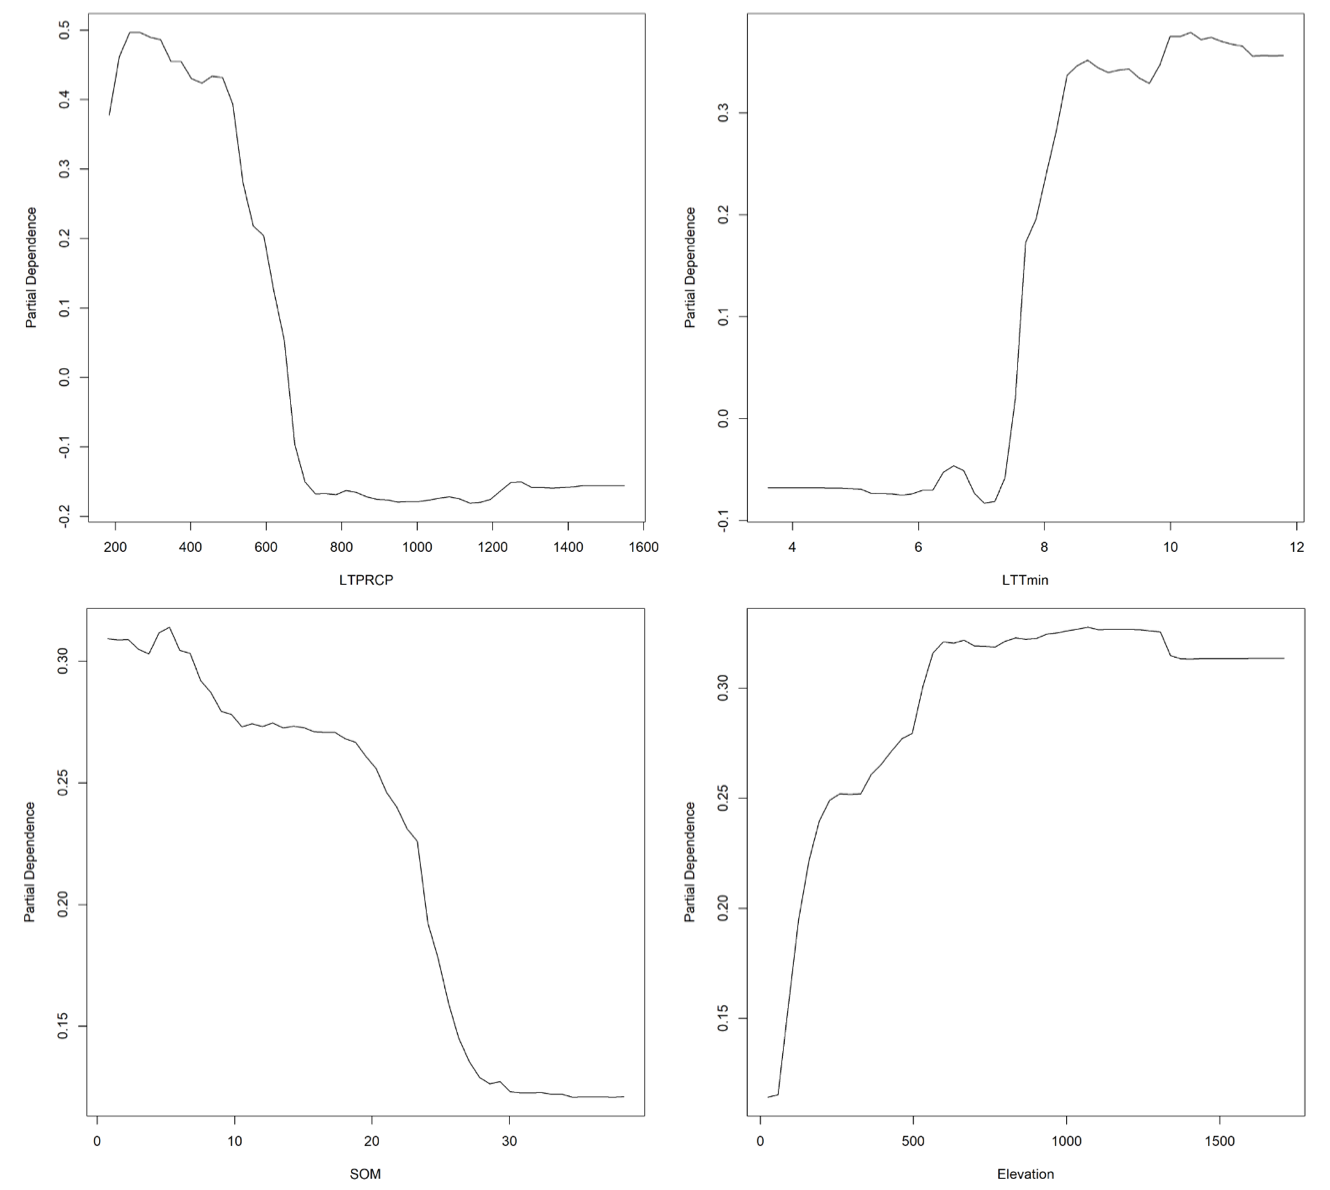
The analysis of the historical forage production maps at 30m from 2001- 2018 showed an increasing trend of year to year fluctuation in forage production over many ecoregions in California annual grasslands. The trends were found significant in many subsections including Ultrabasic Complex, Tehama Terraces, Lower Foothills Metamorphic Belt and Lower Granitic Foothills. We built three sets of random forest models to understand the driving factors determining the spatial differences in the trend of the variability in forage production, using a combination of topography, (a) remote sensing based phenological variable, (b) climate, and (c) climate and soil variables. Phenological variability, especially the trend of the fluctuation in peak growth, the end and length of the growing season explained the majority of the spatial patterns (Figure 10). The key environmental variables driving the observed fluctuation trend included long-term mean annual precipitation, long-term annual minimum temperature, and soil organic matter (Fig. 10). We found that drier areas, especially when mean annual precipitation less than 700 mm/year, were very sensitive to changes in precipitation, and drought would lead to larger interannual variability, making ranching decisions more challenging (Figure 10). Over areas with warmer winter, especially the annual minimum temperature between 7 and 8.5 C, warming would enhance the year to year fluctuation. Regions with higher soil organic matter were found to be more resilient to climate change (Figure 11).
Analysis of the RDM pattern
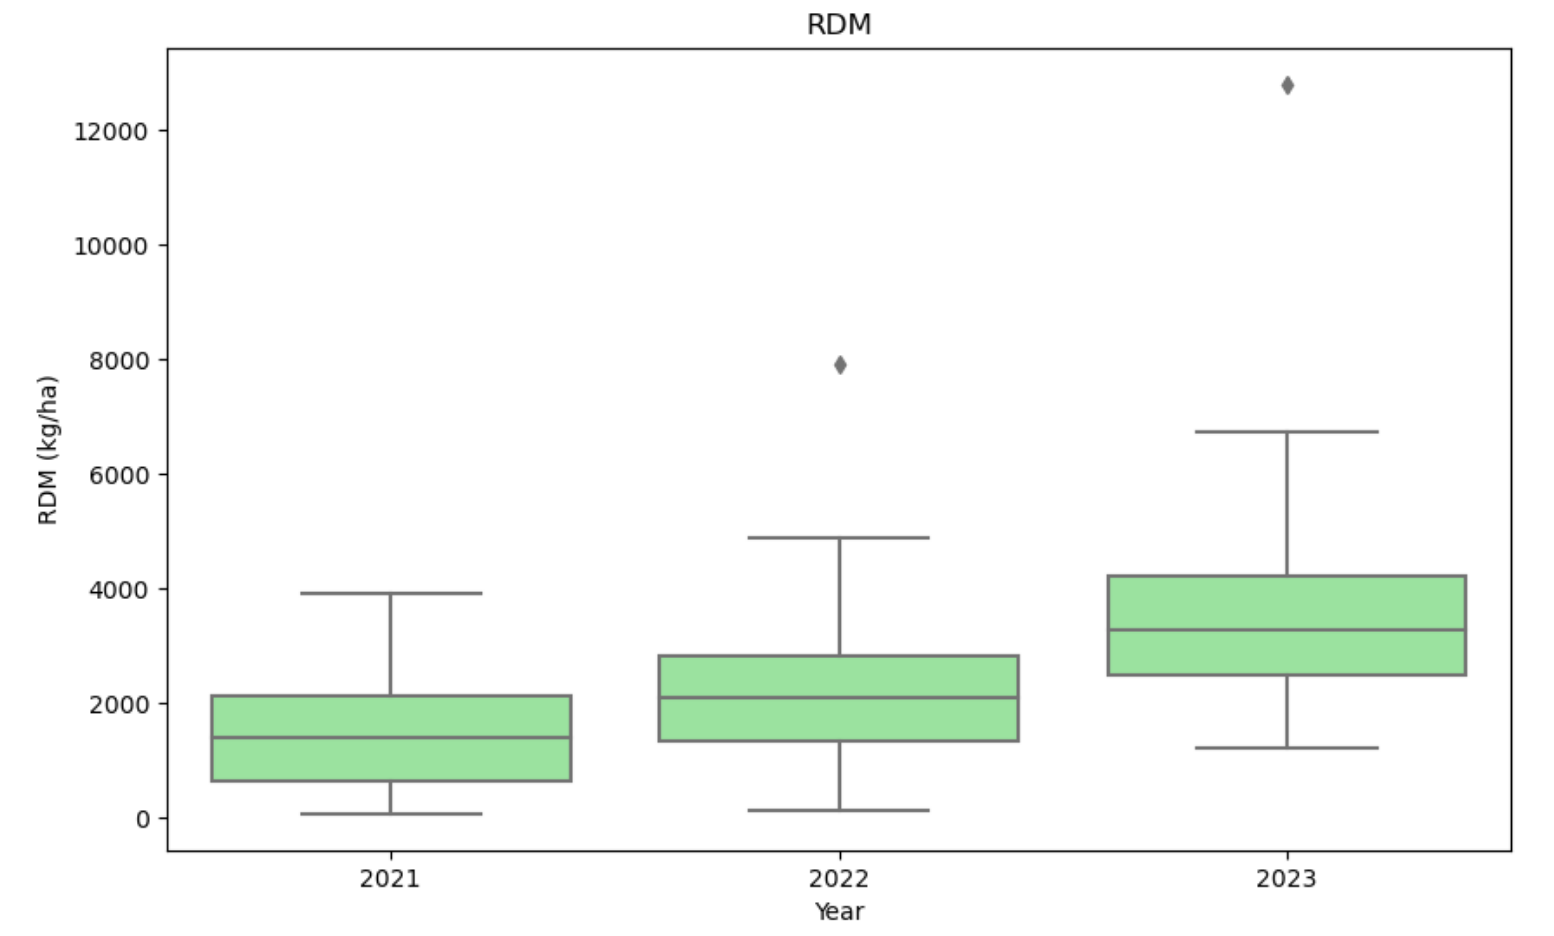
Compared to peak biomass, fall RDM measurements showed even larger variability across sites (Figure 12), 154+/-140 g/m2 fall 2021 vs 228 +/- 212 g/m2 in fall 2022. The lowest 2021 fall RDM also occurred in the Pulis site (7.4) g/m2), while the CPW6 site in San Luis Obispo county had the largest RDM of 394 g/m2. The 2023 fall RDM is much higher than those from 2021 and 2022 (Figure 12). We will be analyzing the associations of RDM with preceding forage production and other environmental layers. We will also use these RDM sample points to train the model with hyperspectral and other multi-spectral satellite observations for large scale mapping.
Research outcomes
The near real time monitoring of forage production is expected to help ranchers to make better in-season on-ranch decision-making, e.g., allowing producers who cannot regularly access lands to make critical decisions regarding stocking rates, pasture rotations, and shipping dates with substantially greater precision and accuracy, and therefore enhancing the sustainability of ranching industry.
Shifting climate baselines and increasing variability are expected to impact forage production in California annual grasslands, which pose considerable challenges to rangeland management decision-making. By leveraging large sample sizes from remote sensing observations across the state over a long-time span, this study provided a comprehensive assessment of the temporal trend and spatial patterns of forage production fluctuations. Our findings about the impact of both long term climate and weather on the trend of year-to-year variability in forage production ]provided useful insights for rangeland managers, aiding in both long-term planning and short-term risk management strategies.
Education and Outreach
Participation summary:
To support stakeholder education and ensure project success, we assembled an interdisciplinary team of scientists, producers, and rangeland managers to collaboratively identify critical gaps and inform design and development of decision support tools. Collaborating producers and rangeland managers specifically provided advice on on-ranch monitoring and interpretation of results, as well as potential barriers to support tool adoption. We also engaged a diversity of stakeholders through the project advisory group, extension events, and regular on-ranch data collection.
Education Objective 1. Assemble an Advisory Group of diverse rangeland stakeholders to provide immediately actionable, on-the-ground user input to developing accessible decision-support tools.
We worked with our collaborators and partner networks including producer associations (e.g., California Cattlemen’s Association, California Rangeland Trust), public agencies (e.g., USDA California Climate Hub, USDA Farm Service Agency), and UC Cooperative Extension (UCCE) to consult on design, development, and implementation of the project. These partners helped identify and provide regular feedback on stakeholder needs in terms of types and scales of information most relevant to critical management triggers.
Education Objective 2. Engage with ranching, policy, research, and management communities to extend research products and collect feedback on tool usability for rangeland decision-making.
The project team extended research products and engaged with ranching, policy, and management communities through a combination of stakeholder-engaged research design, in-person workshops, online multimedia, and Extension education.
Stakeholder-engaged research design. In addition to establishing a stakeholder advisory group—composed of ranchers, natural resource managers, and technical advisors—we also used a participatory research approach to guide data collection, interpretation, and outreach activities. Additionally, we collected ongoing feedback through informal conversations, virtual project meetings, workshops, and field-based interactions. On-ranch data collection was coordinated with ranching cooperators to ensure relevance and feasibility. These field observations were then integrated with emerging remote sensing analyses to inform research findings and decision-support tool development.
Outreach and extension workshops. To ensure scalability of project results—providing capabilities for large to small operations as well as operations of varying structure—we engaged a range of producer operations, including multi-generational, large producers as well as small, moderate sized, and first-generation and beginning producers who often have fewer resources and less access to technical assistance (Munden-Dixon et al., 2019; Roche, 2016; Roche et al., 2015). We hosted 7 extension events (including 3 workshops, 1 symposium, 2 field tours, and 1 webinar) to collect stakeholder questions, information needs, and perspectives on agricultural technology and decision-support tools. Research findings were also shared at professional and producer-focused venues, including meetings organized by the California Cattlemen’s Association and the Society for Range Management. At these events, we targeted livestock producers, natural resource managers, policy decision-makers from public agencies, and resource managers from environmental non-governmental organizations to draw on a range of management, policy, technology, and science expertise. We shared preliminary and emerging results and plans for application development with advisors and other stakeholders through a series of meetings and local workshop events across the state and collected stakeholder feedback.
We designed and facilitated three rancher focus group workshops on climate-smart agriculture, sustainability, resilience to climate change, and technology adoption. In collaboration with the project advisory group and producer organizations, we recruited ranching participants who represented a range of backgrounds. During focus group workshops, we collected qualitative data from discussions to identify common themes related to decision-support tool interest, adoption barriers, and support needs.
We also co-hosted a final extension event that included research presentations and facilitated discussions on enhancing sustainability and resilience to climate change risks on California’s extensive working rangelands, including managing rangeland productivity and health in the face of extreme drought and wildfire. We collected stakeholder feedback via small and large group discussions, as well as on-site evaluations (see Results and Evaluation and Producer Adoption section).
Extension education resources. Project updates and supporting outreach materials were distributed through the UC Rangelands Research and Information Center online research and extension hub, as well as local UCCE newsletters. Once the rangeland decision-support tool is completed, it will be integrated into an online education hub hosted by UC Rangelands as well as the USDA CA Climate Hub’s web-based compendium of tools and data, Cal-Agroclimate, to ensure broad access.
Throughout the project, we worked with our advisory group and on-ranch partners to guide project design, support on-ranch field data collection, and provide iterative feedback through informal conversations and in-person and virtual meetings. We worked with 35 producers and land managers, including advisory group members, to collect on-ranch data for 3 growing seasons. This participatory research approach, including sharing emerging results with ranchers, natural resource managers, and technical advisors, helped us to refine research questions and practical relevance for toll development.
We shared project updates with livestock producers at the annual California Cattlemen's Association and California CattleWomen Convention (December 2022 poster session; approximately 100 producer attendees) and to a diversity of rangeland managers and scientists at the Society for Range Management Annual Meeting (February 2023 poster session; approximately 200 attendees). Additionally, we provided project updates to the Grass-Cast Science team and partners (March 2024; 10 attendees) and the Rangeland Partnership (April 2024; 20 attendees). These opportunities allowed us to get the project in front of a broad range of stakeholders and better understand the questions they have about this type of agricultural technology effort. We also presented project results through the UC Rangelands Working Rangelands Wednesdays webinar (Sept 2022; 34 attendees).
Project results were also shared during two technical field tours: San Joaquin Experimental Range sampling site, Madera County, Apil 2023, 50 attendees (2 producers and 48 non-producers); and Merced Vernal Pools & Grassland Reserve sampling site, Merced County, April 2024, 80 attendees (6 producers and 72 non-producers). These field tours allowed us to discuss the project with agricultural technical service providers and ranching cooperators and gain initial feedback on research questions and practical information needs, as well as approaches to make study results and outreach materials accessible to a broad range of stakeholders.
To better understand decision-support tool needs and adoption barriers, we hosted three producer focus groups on climate-smart agriculture: Group 1, Jul 2023, 7 producer attendees; Group 2, December 2023, 7 producer attendees; Group 3, December 2023, 8 producer attendees. Focus groups were organized in coordination with our advisory group partners and collaborating industry organizations. Across all focus groups, we recruited producers from a diversity of backgrounds, including mutli-generational producers as well as underserved and disadvantaged communities. These communities include first-generation and beginning producers, limited resource producers, and producers from minoritized backgrounds. The focus groups allowed us to effectively collect stakeholder feedback on potential application development. Preliminary analysis across focus groups indicates strong interest in decision-support tools, alongside a clear need for adoption and implementation support.
Feedback collected through the project’s on-ranch participatory research, stakeholder meetings, and extension events has been critical to developing the decision-support tool, as described below:
(1) Some producers expressed concerns on the relatively large uncertainties in the reported California rangeland production from other existing rangeland platforms targeted for nationwide applications. This motivated us for on-ranch data-collection intentionally rooted our remote analyses in on-the-ground conditions across operations in California, enabling us to develop a locally-calibrated, remote sensing-based monitoring algorithm. We added a detailed accuracy assessment on our estimation to make our algorithm and product uncertainty transparent to the end users. The tool design therefore also included the documentation and uncertainty as a critical component. This local collaboration with producers will help ensure the tool is operationally relevant and trusted.
(2) Producers confirmed the importance of being able to visualize forage productivity and fine fuels at multiple scales, from individual pastures to entire ranches or regions. In line with this feedback, the tool is being designed to allow users to summarize forage production and residual dry matter at various scales by drawing a Region of Interest (ROI) on screen or uploading a shapefile, and examine spatial variability within and across management units.
(3) Ongoing producer engagement shaped interpretation of both research results and identified key functional needs of the interactive API. For example, producers showed strong interests in comparing the current condition with historical long term mean baseline, which guided us to add a historical baseline forage map as an additional layer and also report the departure of current season production across their ROIs. Additionally, some producers emphasized that timely information on the magnitude–and especially the timing–of precipitation are critical to their decision-making and management triggers. In response, we are working on automating the workflow to reduce the latency of near real time estimation, and forecasting models will be further developed to incorporate forecast-based indicators to provide multi-week lead times in addition to near real-time data, supporting proactive management decisions.
(4) Engagement with various stakeholders underscored the need for intuitive and easy-to-navigate tools. As a result, the user interface will be simplified, required inputs reduced, and outputs structured for rapid interpretation with minimal training, directly reflecting stakeholder guidance.
At the statewide level, we collaborated with the California Air Resources Board (CARB) to improve grassland biomass carbon estimations for the State’s Natural & Working Lands Inventory. Results from this effort were released February 2026 (link to CARB report here).
We also co-hosted a large extension symposium with UC Rangelands in February 2025 (144 attendees, including 50 producers), in which we presented this research project in the opening keynote presentation (link to overview here). The symposium focused on sustainability and resilience to climate change risks on California’s extensive working rangelands and featured other presentations from UCCE and university scientists, livestock producers, and policymakers. Attendee feedback was overwhelmingly positive, with 100% of attendees agreeing they gained new knowledge and that they would recommend the event to others. On-ranch owner and land manager commented, “We appreciate your work and enthusiasm in working with ranchers and using practical science to seek solutions for California rangelands.”
Lastly, we have developed the framework for the research and extension hub site (via the UC Rangelands Research and Information Center) to host the final project resources and gather feedback on project outputs. This centralized research and extension hub will house project results, tools, and outreach products, as well as support beta-testing and adoption of the decision-support tool once it is ready.
Education and Outreach Outcomes
We found success with embedding dissemination within participatory research processes, which also helped us prioritize in-person, place-based learning opportunities. We also found multiple, complementary outreach formats helped broaden project reach.
The project improved stakeholder understanding of agricultural sustainability by linking climate, ecological processes, and management decision-making. Through repeated engagement throughout the project, stakeholders gained a clearer understanding of how on-ranch data can be integrated into decision-support tools and help inform rangeland management. Producers and land managers also reported increased awareness of how emerging tools can potentially support adaptive decision-making, while also voicing realistic concerns about data interpretation and capacity to implement additional new technology.
At broader scales, dissemination through venues such as industry and professional organization events and collaborations with state agencies helped connect local participatory research to statewide sustainability efforts. Extension activities further reinforced the role of applied science in supporting resilient working landscapes.
- forage production variability and forage monitoring tools
spatial heterogeneity in year to year variability of forage production