Progress report for SW22-941
Project Information
Concerns about water scarcity are mounting due to rapid urban growth, depleting groundwater supplies, and drought resulting from reduced and variable snowpack in the western United States. The mega drought of 2020-2021 compounded this problem for most of this region. Several areas of Idaho and Utah have frequent water shortages and droughts that cause about $95 million per year of loss. We propose Phase II of a long-term water optimization study to answer these two critical research questions: (1) Which combinations of irrigation and crop management practices result in optimal crop yield, crop profit, and water use efficiency? and (2) How can variable-rate irrigation become operational on production farms?
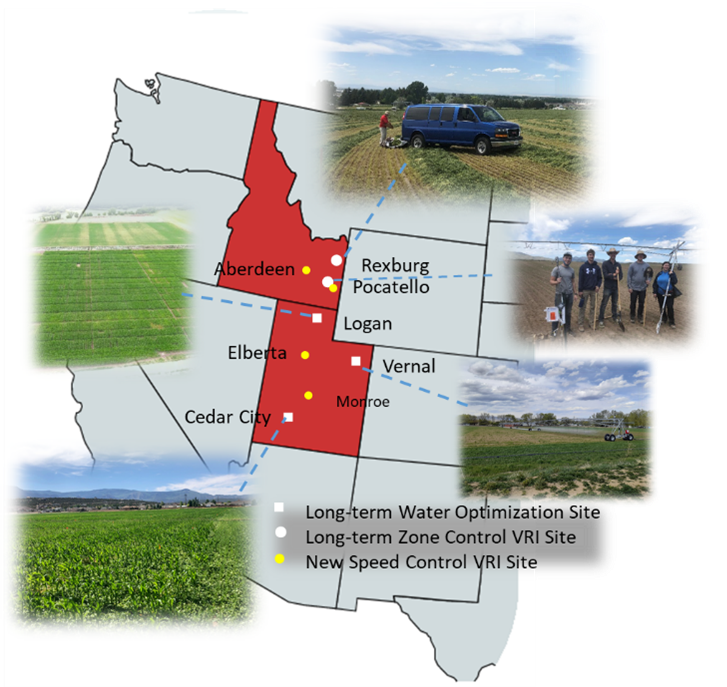
To address these research questions, we propose sustaining and expanding ongoing work to: i) conduct long-term experiments to identify how individual and ‘stacked’ water conservation practices (irrigation, crop genetics, and crop management) optimize water use and increase crop profit at three water optimization trials in Utah (Logan, Cedar City, and Vernal), and ii) continue long-term zone variable rate irrigation (VRI) research in Pocatello and Rexburg, Idaho and conduct four new on-farm trials in Idaho and Utah (Pocatello, Aberdeen, Elberta, and Richfield) to test and develop speed-control VRI. Results from these efforts will be the basis for an aggressive outreach and training effort reaching irrigators, irrigation suppliers, crop advisors, and conservation planners to improve knowledge and adoption of water optimization best practices. Dynamic outreach components will include interactive field days at the research sites, presentations and publications through Idaho and Utah Extension and professional associations, and a training event for irrigation advisors.
The anticipated project outcomes in the Western Region include:
- Over 300 stakeholders will engage in discussions and demonstrations of water conservation research at eight field days;
- Over 1,000 stakeholders will be educated on practices to optimize their water use during various Extension and professional presentations;
- Producers, agricultural professionals, and others will have access to timely information about practices that optimize water use through various Extension, farm press, and professional publications.
Producing and disseminating results on the suites of practices that economically and feasibly optimize water has and should continue to lead to greater acceptance and use of these practices. Results from Phase I of this work have shown that some combinations reduce irrigation use without impacting yield. We estimate that annual diversion of water could be reduced by 100,000’s of acre-feet if advanced practices were implemented by just half of the irrigators in Idaho and Utah. These outcomes would also assist producers and other stakeholders involved in proposing, creating, and administering cost-share or water bank programs to help optimize water use. Furthermore, we expect these trials will leverage the large foundation we have built during the last three years in Phase I of this project and provide valuable information concerning ideal short- and long-term water optimization strategies. This work has and should continue to spur further funding and support from the state and federal agencies where water conservation and optimization is a high priority.
- Identify combinations of six water conservation practices (irrigation system and rate, coupled with crop type, crop genetics, cover crops, and tillage) with the greatest ability to optimize crop production, crop profit, and water use. Years 1-3.
- Demonstrate variable-rate irrigation systems that improve water and energy use efficiencies in long-term trials and on production farms. Years 1-3.
- Deliver dynamic educational products and training on water optimization through Extension and coordinated outreach to increase awareness and adoption of proven water optimization practices. Years 1-3.
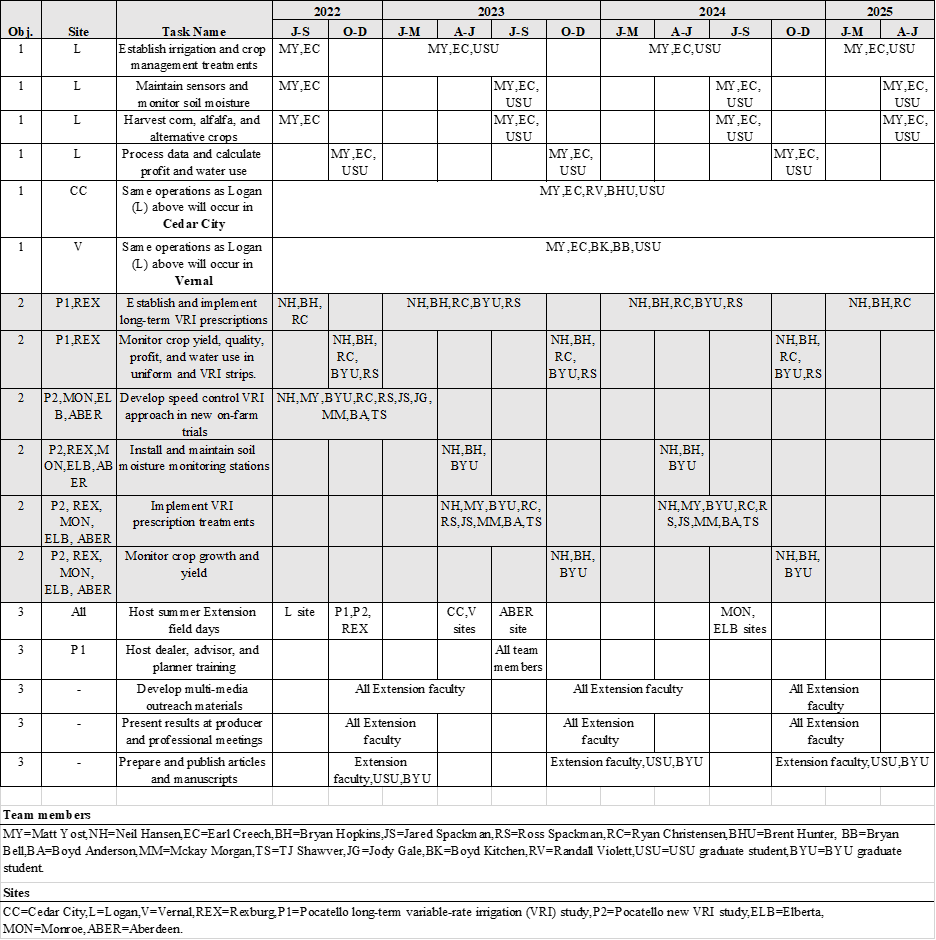
We created a Gantt table in excel. When I tried to paste it here I could not get it to fit on a portrait page so much of the table was cutoff. I've pasted it here as an image so the whole table is visible.
Cooperators
- - Producer
- - Producer
- - Producer
- - Technical Advisor
- - Producer
- - Technical Advisor
- - Producer
- - Producer
- - Technical Advisor
- - Technical Advisor
- - Technical Advisor
Research
Our first two objectives focus on research and are presented here. The third objective centers on education efforts and will be discussed in the education plan section.
Objective 1: Identify combinations of six water conservation practices with the greatest ability to optimize crop production, crop profit, and water use.
Three long-term water optimization trials were established in Utah in Phase I of this project. The first was established in Logan in 2019, the second in Vernal in 2019, and the third in Cedar City in 2021. At each site, a new linear move sprinkler (“lateral”) was installed with funding and support from several federal, state, and local partners. These stakeholders have invested in the infrastructure and Phase I helped establish the trials, while Phase II is critical to take advantage of the investments.
The treatments at each of the three sites include three replications of:
- four irrigation systems [the conventional mid-elevation spray application (MESA) system vs. low-elevation spray application (LESA), low energy precision application (LEPA), and mobile drip irrigation (MDI)];
- four irrigation rates (50, 50, 75, and 100% of evapotranspiration). One of the 50% irrigation rates is a partial irrigation strategy focused on applying more water during critical crop growth stages; and
- up to five crop management treatments depending on the crop:
- Corn has five treatments (conventional, drought-tolerant genetics, no-tillage, cover crops, and a fifth treatment that combines the latter three conservation practices)
- Alfalfa has two treatments (conventional vs. drought tolerant genetics)
- Small grain forage has two treatments (tillage vs. no-tillage)
- Alternative crops (teff, sorghum-sudangrass, and forage rye) do not have crop treatments but are tested against other traditional crops
The sixteen irrigation treatments (four systems x four rates) are arranged along each lateral (Fig. 2). Each span (150-180 ft long) has a different irrigation system with a random placement of the irrigation rates in four equally sized quarters. The rate differences were achieved by modifying sprinkler nozzles in each quarter. Crop management treatments were arranged perpendicular to the direction of the irrigation system to create replicated combinations of all crop management and irrigation system combinations.
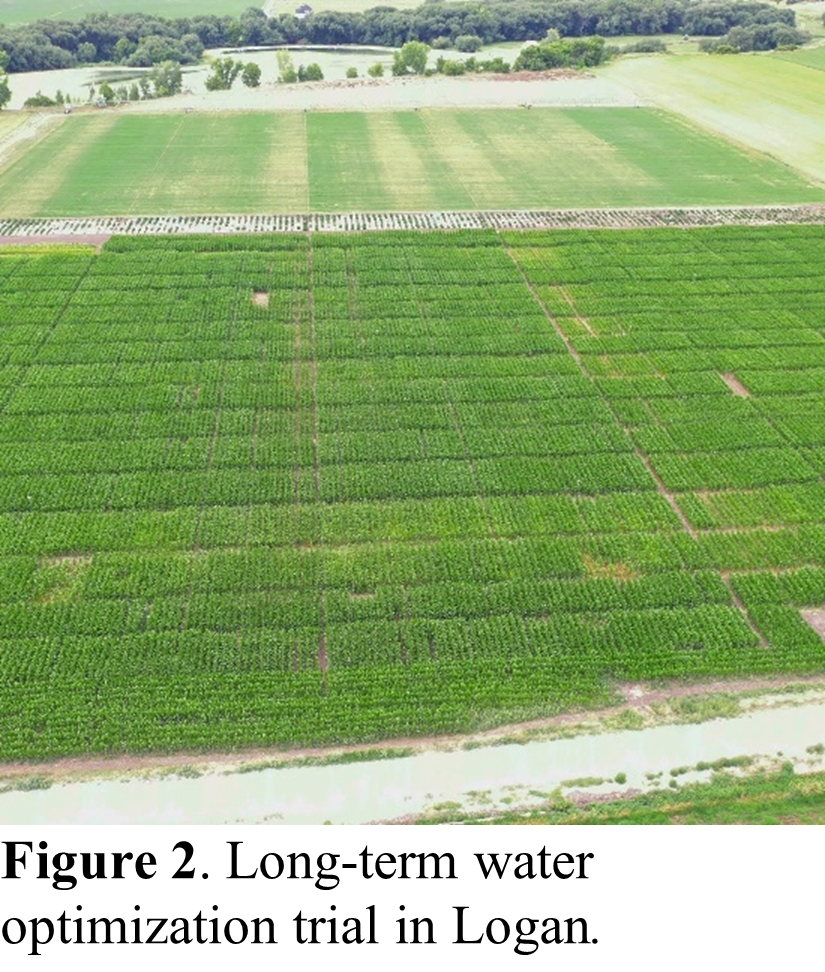
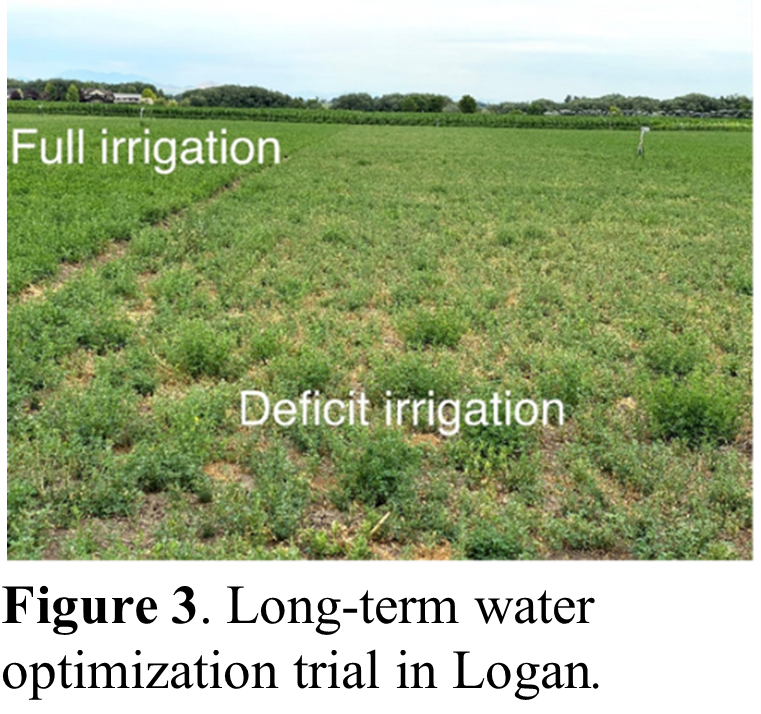
At each site, one block of about six acres is utilized for alfalfa. Three random strips perpendicular to the lateral were planted to a conventional alfalfa variety and another three were planted to a drought-tolerant alfalfa variety (Ladak II). Alfalfa yield has and will be measured in 96 plots at each location (16 irrigation treatments x 2 varieties x 3 replicate strips; Fig. 3) for each alfalfa cutting utilizing research or commercial harvesters. Another 6-acre block is used for a corn-corn-small grain forage crop rotation. This area has 256 small plots (20 x 30 ft) that includes three replications of the 16 irrigation treatments and five crop treatments. Corn is planted parallel to the lateral so sprinklers can irrigate and move between and not across corn rows. Corn silage yield has and will be measured each year in all plots using a two-row Gehl corn chopper with a pull-behind weigh wagon. Small grain forage yield is measured using the same methods as alfalfa. Finally, a 2-acre block is reserved for alternative crops at each site. This allows for three replicated strips each of two alternative crops. The two crops are rotated annually and have included safflower, teff, triticale, and sorghum-sudangrass in Phase I. Alternative crops have and will be harvested with research harvesters.
Forage quality will be estimated on all crops using near infrared reflectance spectroscopy (NIRS) and standardized calibrations. Forage quality parameters differ by crop but all parameters that influence crop selling price will be measured to allow profit calculation.
In order to measure water use efficiency, we will measure irrigation rates using flow meters that were installed on each lateral. We will also continue to monitor hourly soil moisture content at 40 plots at each site. In each plot, water content sensors are installed to three depths (6, 18, and 30 inches). The plots include eight of the irrigation treatments (4 systems x 2 irrigation rates – 50 and 100% evapotranspiration) in all three crops as well two of the crop treatments for alfalfa (conventional vs. drought-tolerant) and two for corn/small grains (conventional vs. the combined no-tillage, drought-tolerant genetics, and cover crops).
Phase I allowed us to install all the irrigation systems and soil moisture sensors, and to establish all the crop treatments. We were able to collect data mostly on corn because it is an annual crop and could be established rapidly (Fig. 4). Alfalfa, a perennial, and the most dominant crop on western farmland, took several years to establish. We trained two graduate students who have published preliminary data on early impacts of irrigation systems and deficit irrigation on corn, establishing alfalfa, and alternative crops.
In Phase II, we will examine how water optimization practices influence established alfalfa. We will also gather additional and needed data for two existing alternative crops (teff, sorghum-sudangrass) and two new alternative crops (Italian ryegrass and forage rye) that were highly recommended by local producers and crop advisors. The production, profit, and water use of these crops will be compared to alfalfa and corn. Our database of irrigation system evaluations will also grow, and we will expand examination of a new irrigation system [low-elevation rotator sprinkler (LENA)] in place of MDI at Cedar City. We will replace MDI because it has been extremely problematic in terms of water quality and repairs. Furthermore, now that our no-tillage and cover crop treatments have been in place for one to three seasons, we can begin to more adequately examine how they influence crop production and water use.
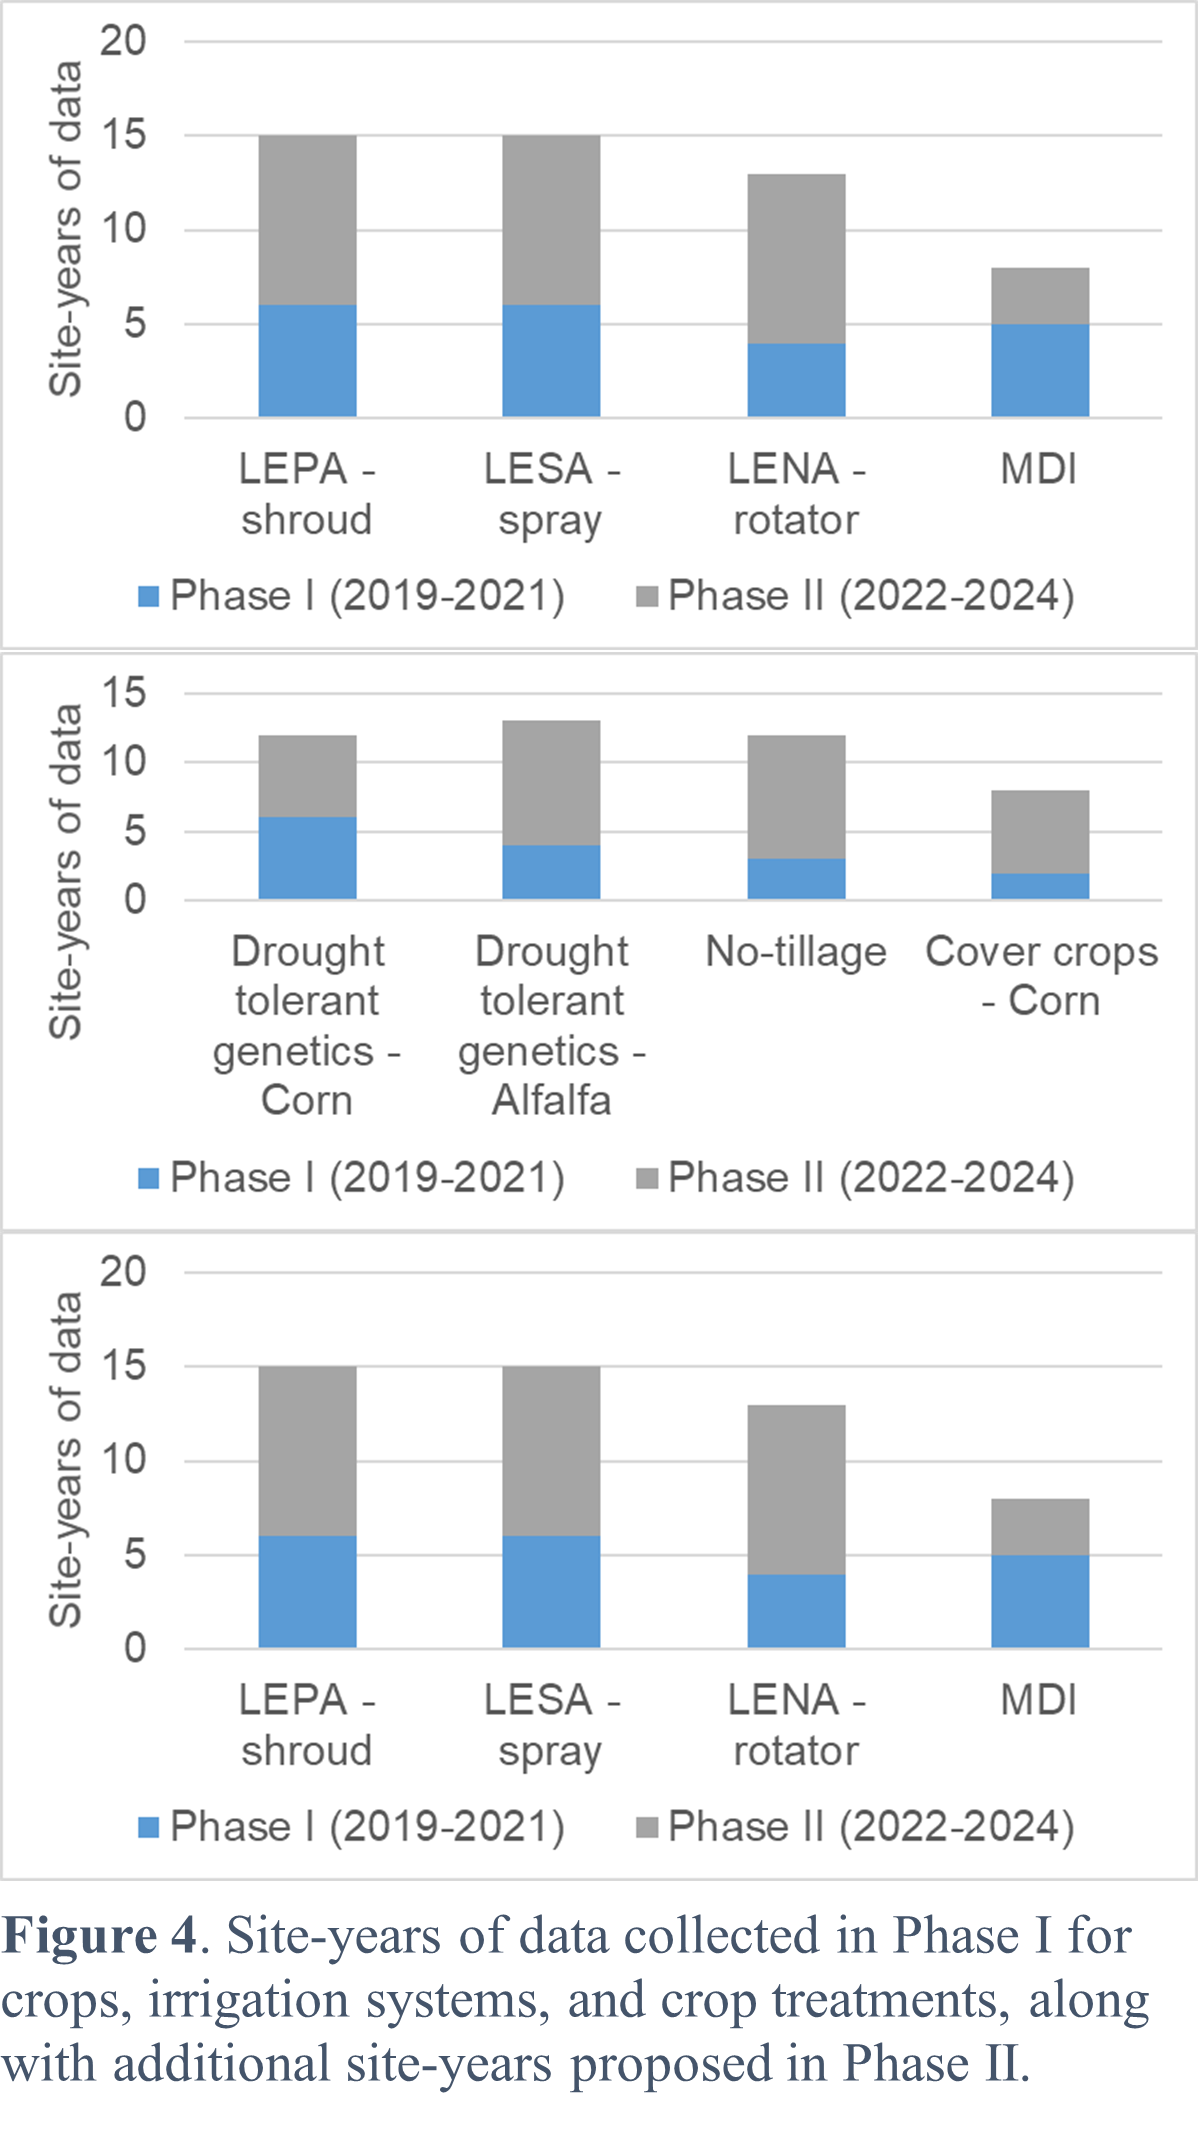
In summary, Phase II will include conducting the three water optimization trials at Logan, Vernal, and Cedar City for the 2022-2024 seasons following methods and procedures discussed above and vetted in Phase I. We will have at least 5-13 site-years of data on all the alternative crops, alfalfa, and corn. We will also have 8-13 site-years of comparisons of irrigation systems and crop treatments (no-tillage, drought-tolerant genetics, and cover crops). This additional data will greatly strengthen our results and demonstrate the crop production and water use impacts of water optimization techniques for major crops of the West.
Objective 2: Demonstrate variable-rate irrigation systems that improve water and energy use efficiencies.
Variable-rate irrigation (VRI) utilizes site information and irrigation technology to apply spatially variable irrigation rates that match site-specific growing conditions. VRI aims to improve energy and water use efficiency by avoiding areas of over- or under-irrigation. Two types of VRI are zone control and speed control. Phase I of this project developed and tested a zone control VRI system at two Idaho study locations (Pocatello and Rexburg). Zone control VRI allows differing irrigation rates for zones of any shape by regulating individual sprinklers. The zone control VRI system we developed in Phase I consists of:
- defining irrigation zones,
- characterizing soil water holding properties by zone using sensors,
- real-time, zone specific tracking of soil water depletion, and
- VRI recommendations that maintain soil water within a target depletion range.
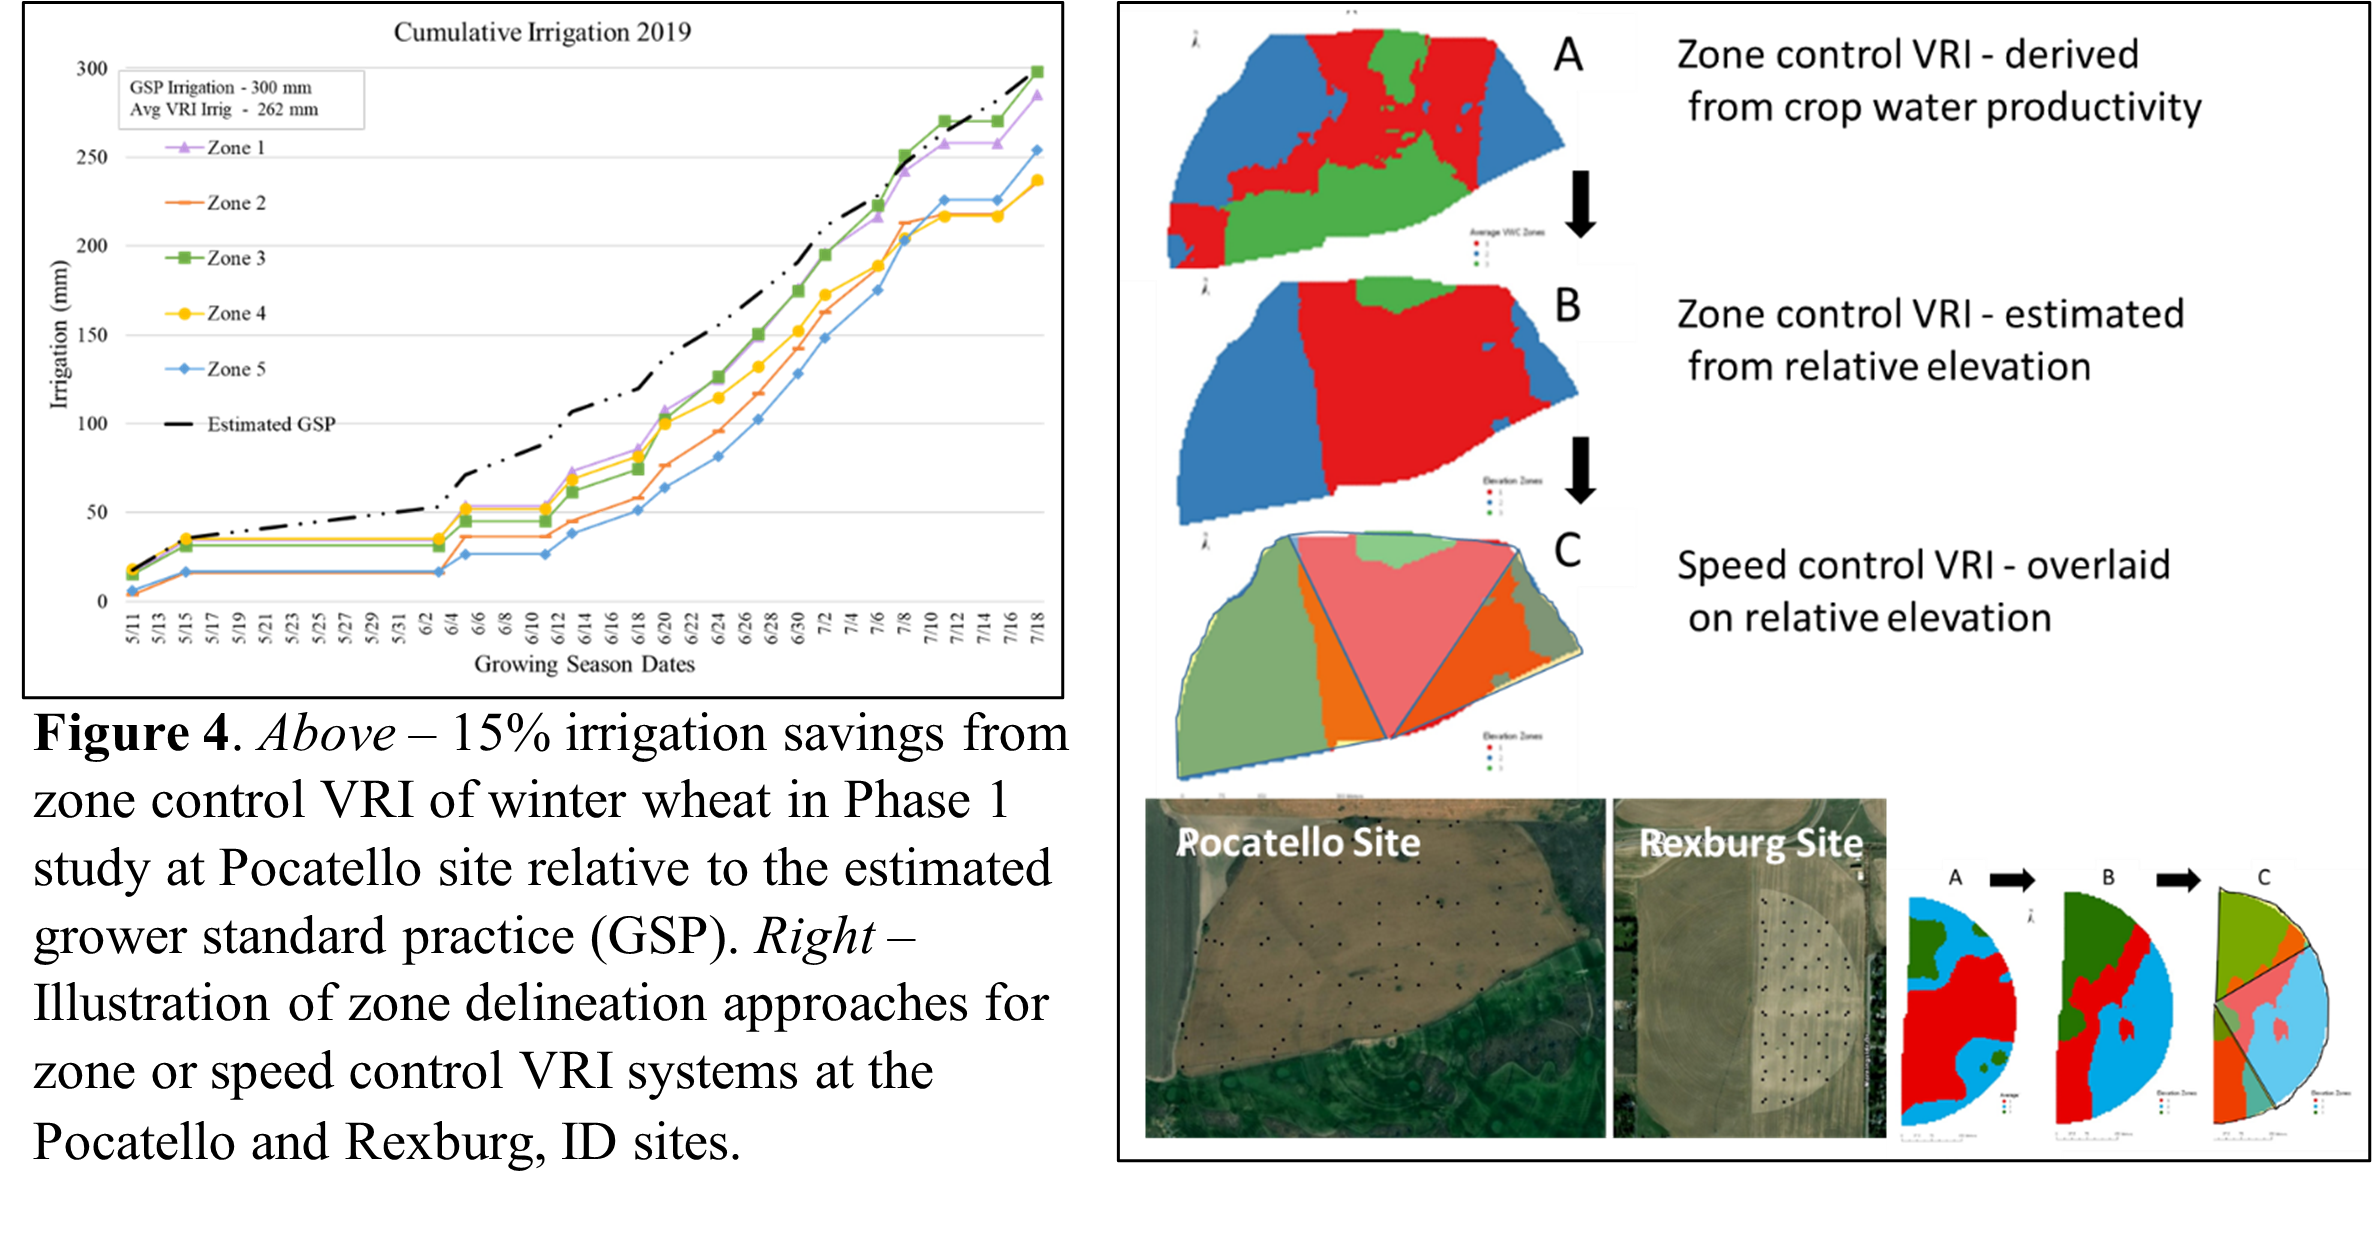
We documented a 15% irrigation water savings and similar total yield compared to the grower’s standard practice (Fig. 5). Other research has documented similar advantages of VRI (Sadler et al., 2002; Hedley and Yule, 2009; West and Kovacs, 2017).
Interest in VRI is increasing in southern Idaho because of recent water rights adjudications that allowed producers with zone control VRI to develop new irrigated land area equal to the unfarmed, un-irrigated rock outcroppings common in this area. However, adoption rates of zone control VRI are expected to proceed slowly. During Phase I, feedback from stakeholders indicated that VRI could be applied more extensively if approaches were simplified and developed for speed control VRI. Speed control VRI is limited to wedge-shaped zones created by changing the travel speed of pivots. Although less flexible, this approach can be implemented on nearly all existing pivots with minimal investment, while still gaining some of the water conservation advantages of zone control.
Long-term zone VRI trials
In Phase II of this project, we will continue to monitor and demonstrate zone VRI practices in 2022- 2024 at the long-term field sites in Pocatello and Rexburg, Idaho. Phase I allowed us to collect data mainly on wheat production. In Phase II, we will be able to assess the impacts of zone VRI on potato production in Pocatello (wheat in 2022-2023 and potato in 2024) and alfalfa production in Rexburg. At both sites, we will continue to test uniform irrigation zones vs. VRI to determine how zone VRI impacts crop yield, quality, profit, and water use. We anticipate that the advantages of VRI will be most pronounced in potato due to its high value but should also offer many advantages in alfalfa due to its high water use.
New speed control VRI on-farm trials
We propose additional on-farm trials that modify our VRI system for a simplified, speed control application that captures advantages similar to those of zone control VRI but are more easily adopted by producers. In Phase I, we used intensive soil sampling throughout the growing season under uniform irrigation to estimate crop water use to define VRI zones. This information was coupled with yield to estimate spatial variation of crop water productivity and to delineate precise zone control VRI zones. We then tested how well simple variables [electrical conductivity (ECa), slope, relative elevation, yield] could predict VRI zones. VRI zones predicted from relative field elevation most closely matched those derived from crop water productivity. In Phase II of this project, we will evaluate yield and water savings with speed control VRI zones delineated using relative field elevation at four new farm fields. This will include two sites in Idaho (Aberdeen and Pocatello) and two in Utah (Monroe and Elberta). At the Pocatello location, we will expand from one field location to include an additional speed control VRI field, with farm operations led by our producer representative, Ryan Christensen. The other three sites will be new collaborations with the producers that provided letters of commitment.
The four new speed-control VRI on-farm trials will be conducted for two growing seasons (2023-2024) with wheat or barley. We will develop and test speed control VRI prescriptions by dividing each field into eight large sectors. Four of the sectors will be four replications of uniform irrigation and the other four will have speed-control VRI. There will be four major steps to establishing sector-VRI prescriptions:
- Define VRI zones. We will work with cooperating producers to select one of their fields with variation in water need. Producers will share any prior yield maps from their field and we will collect digital elevation maps and soil ECa using a direct contact system (Veris V3150). These datasets will be paired to provide a starting point for a speed-control VRI prescription.
- Characterizing average soil water holding properties of soils. In Phase I, we documented that soil water retention properties (e.g., volumetric water content at field capacity, -10 kPa) varied among VRI zones within a field. In Phase II, we will install pairs of volumetric water content sensors (Meter, Teros 12) and soil water potential sensors (Meter, Teros 21) in each VRI zone. Paired sensors will allow us to determine zone specific, volumetric water content at irrigation upper and lower thresholds.
- Real-time, zone specific tracking of soil water depletion. The paired sensors in each VRI zone will be used to determine soil water depletion by comparing current volumetric water content values to the zone specific upper irrigation thresholds. We will monitor sensors in near-real time with remote access to the Meter Zentra Cloud system.
- VRI recommendations that maintain soil water within a target depletion range. Real-time, zone specific soil water depletions will be used to calculate VRI rates for every irrigation. The timing and rates of irrigation will be calculated to maintain soil water potential values between -10 kPa and -200 kPa. Soil data will be collected remotely each week through telemetry and prescriptions will be developed and shared with cooperating producers for implementation. This can be easily accomplished working with pivot manufacturer software such as FieldNet® as we have done in the past.
At the end of each growing season, we will work with cooperating producers to obtain a grain yield map of the entire field and the water use as recorded by their pivot software. We will also collect crop quality samples from each of the eight sectors prior to or at harvest by hand sampling. These data will be combined to assess how speed-control VRI impacts crop yield, quality, and profit, along with water use efficiency.
Objective 1 - Identify combinations of six water conservation practices (irrigation system and rate, coupled with crop type, crop genetics, cover crops, and tillage) with the greatest ability to optimize crop production, crop profit, and water use.
The ongoing water optimization or stacking conservation practice trial was conducted at Cedar City, Logan, and Vernal, Utah during the 2022-2024 growing seasons. Due to an extension of the grant, we also conducted the trials in 2025. The treatments at each of the three sites include three replications of:
- four irrigation systems [the conventional mid-elevation spray application (MESA) system vs. low-elevation spray application (LESA), low energy precision application (LEPA), and low-elevation Nelson advantage (LENA)];
- four irrigation rates (50, 50, 75, and 100% of evapotranspiration). One of the 50% irrigation rates is a partial irrigation strategy focused on applying more water during critical crop growth stages; and
- up to five crop management treatments depending on the crop:
- Corn has five treatments (conventional, drought-tolerant genetics, no-tillage, cover crops, and a fifth treatment that combines the latter three conservation practices)
- Alfalfa has two treatments (conventional vs. drought tolerant cultivar)
- Small grain forage has two treatments (tillage vs. no-tillage)
- Alternative crops (teff, sorghum-sudangrass, and forage rye) do not have crop treatments but are tested against other traditional crops
Major activities and findings:
The first major activity was to fully establish and maintain the three long-term irrigation sites near Logan, Vernal, and Cedar City Utah. It included removing MDI at the Vernal, UT site in 2022 and replacing it with LENA (based on cooperating farmer and stakeholder input and difficulty with filtration). Annual research activities included implementing 16-20 treatments at each site with a total of over 1500 individual plots.
A second major activity was to maintain a large soil moisture monitoring network at all three sites and use the data to calculate evapotranspiration (ET) of each treatment with a sensor installed. We used a soil moisture ET model (SMET) developed recently at Utah State University to estimate ET for plots with soil moisture sensors. The model requires daily soil moisture. Some of the soil moisture sensors were damaged by rodents or temporarily malfunctioned but we were able to collect data for several site-years for each crop. The objective of this effort was to compare the water use of various water optimization approaches. Results showed that the evapotranspiration (ETa) varied across crops, irrigation technologies, and years, with alfalfa generally exhibiting the highest ETa.
- In the alfalfa, small grain forage, and grain corn, low-elevation irrigation systems (LEPA, LENA®, LESA) resulted in greater ETa than MESA, likely due to reduced evaporative losses and wind drift. However, MESA performed better in silage corn with a higher ETa with an application of the same amount of irrigaiton.
- Deficit irrigation strategies did not reduce ETa, which might be due to overestimates of the ETc model or the SMET ETa or partial root-zone coverage with the installed sensor depth.
- Drought-tolerant genetics of alfalfa had a marginally greater ETa compared to conventional, while for corn and small grain forage, a reduced crop vigor under NT practice reduced the ETa compared to conventional practices.
- Alfalfa, SGF, and grain corn were the most water-productive crops under a low-elevation sprinkler system, while silage corn was under mid-elevation in terms of water productivity (WP).
- Deficit irrigation had mixed trends for WP but performed better most of the time compared to full irrigation.
- In general, DT genetics improved the WP in alfalfa, while conventional treatment performed better in small grain forage and corn compared to tillage and combined genetics, tillage, and cover crop treatment, respectively.
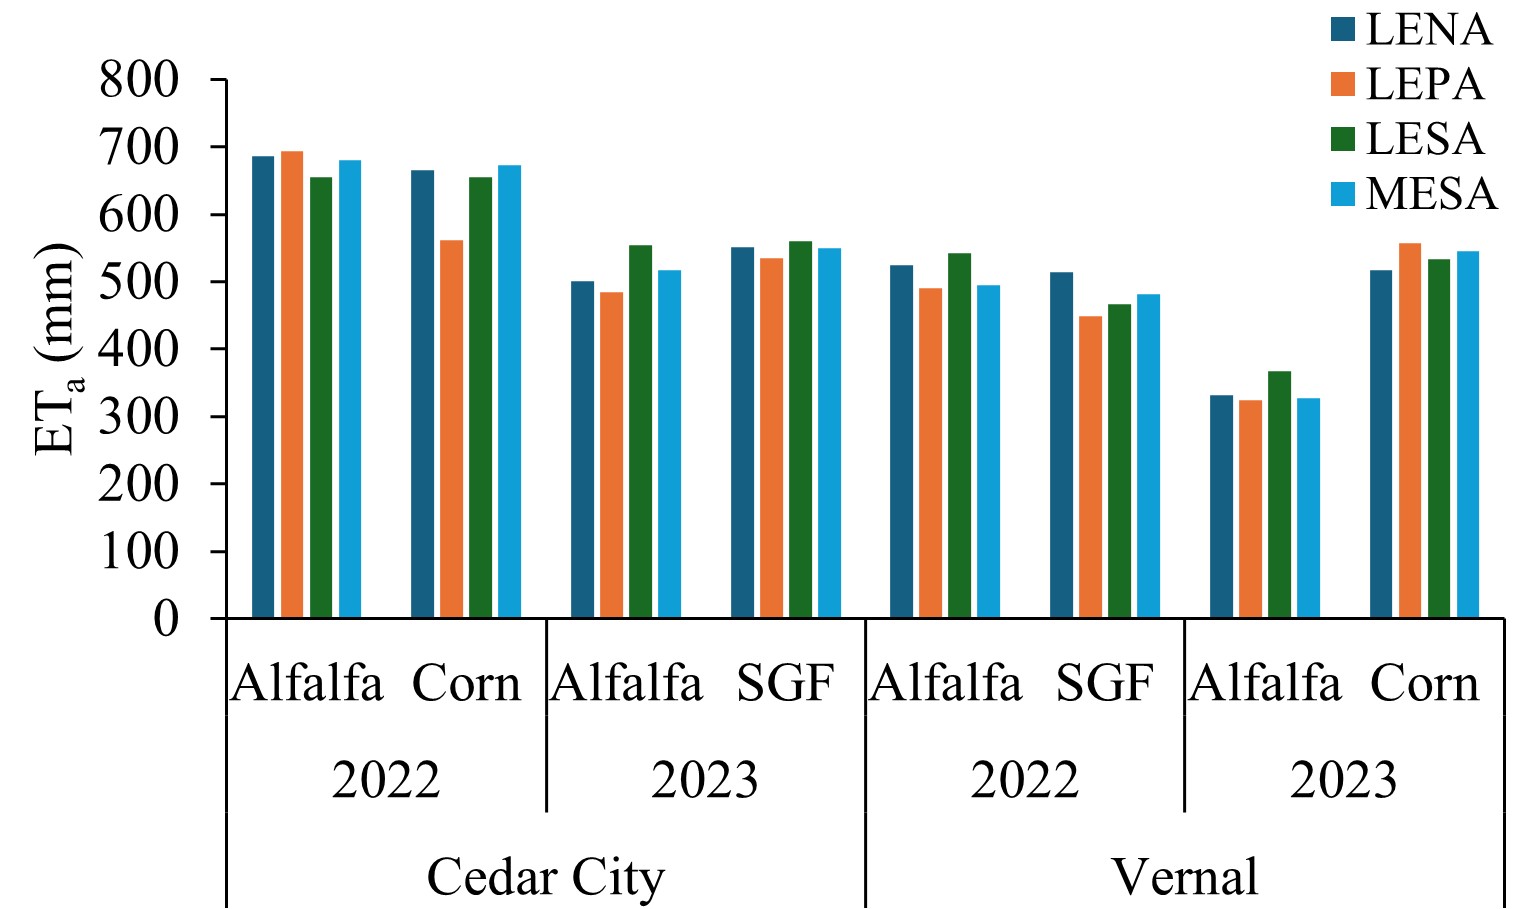
Figure 1. The effect of irrigation technologies: low-elevation Nelson Advantage® (LENA), low-elevation precision application (LEPA), low-elevation spray application (LESA), and mid-elevation spray applicators (MESA) on actual evapotranspiration (ETa) for different crops [alfalfa, corn grain at Cedar City (CC) and silage at Vernal (V), and small grain forage (SGF)]. Note: Volumetric water content data were missing from June 17th to July 12th for grain corn in LEPA in 2022 at CC, which led to variation in estimated ETa.
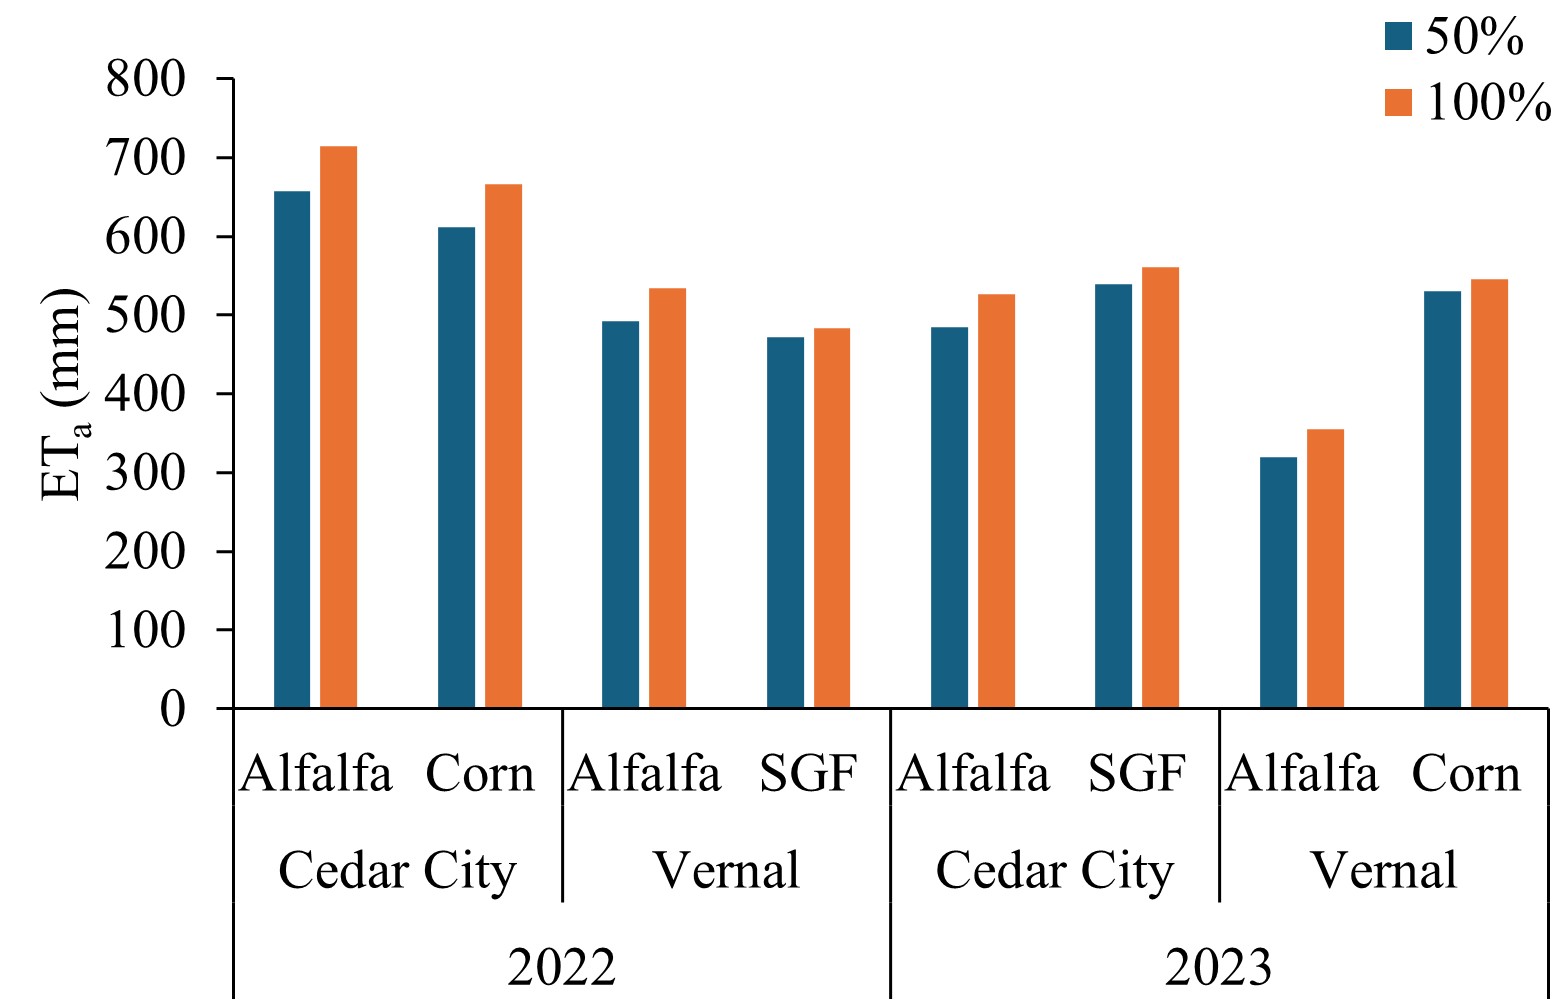
Figure 2. Effect of irrigation levels (100% or 50% of ETc) on actual evapotranspiration (ETa) of alfalfa, corn, and small grain forage (SGF) at Cedar City (CC) and Vernal (V), UT during 2022-23.
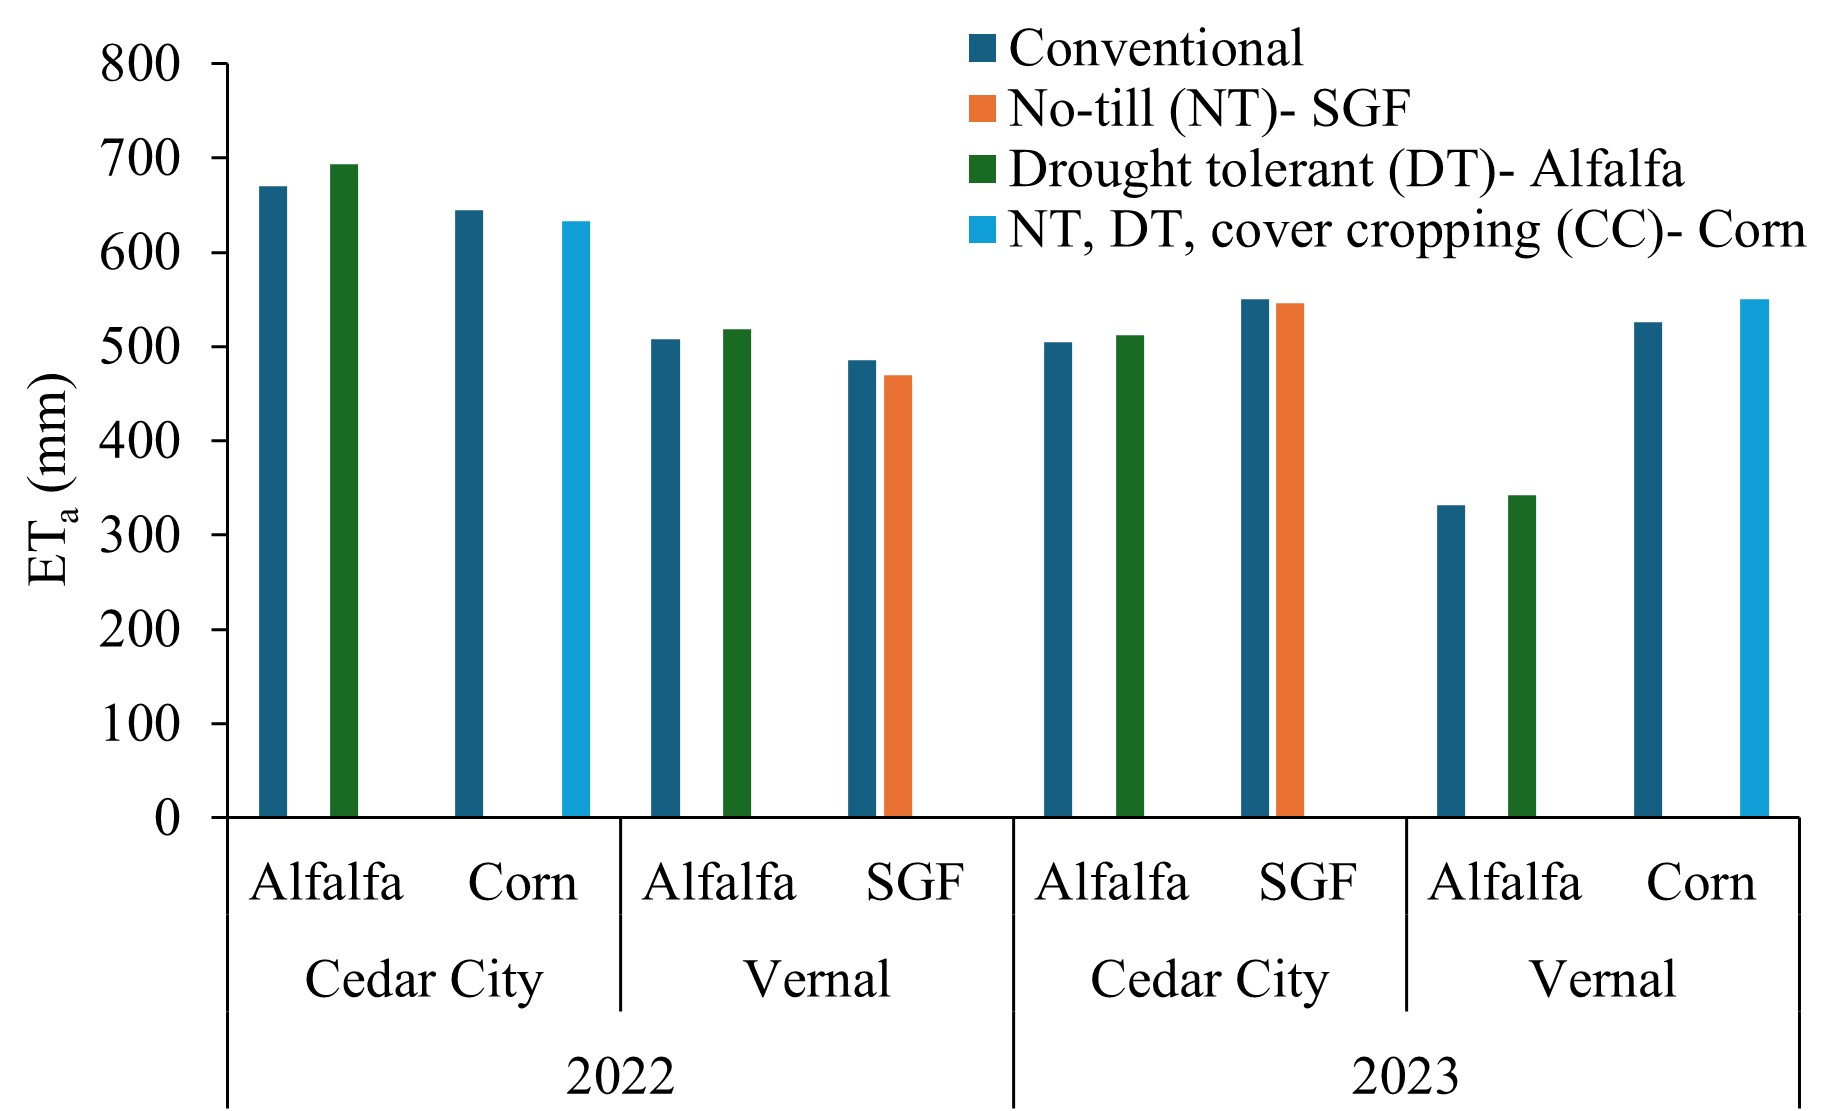
Figure 3. Effect of crop genetics [conventional and drought-tolerant (DT)] of alfalfa, no-till (NT) of small grain forage (SGF), and the combined effect of NT, DT genetics, and cover cropping (CCr) of grain corn at Cedar City (CC) and silage corn at Vernal (V) on actual evapotranspiration (ETa) during 2022-23.
A third major activity was to hire and train graduate students. Dakota Boren completed his Master’s degree in 2022, Tina Sullivan is finished her PhD in 2024, Kamal Deep completed his M.S. degree in 2025, and two additional students (Tejinder Singh – PhD and Shikha Swarma – MS) will complete their degrees in summer of 2026.
A fourth major activity included collecting yield, forage quality, and water use data from each of the >1,500 research plots in 2023-2025 and publishing and presenting the results. In addition, we collected data on existing and new alternative crops. In 2022-2025, we collected data for two existing alternative crops (teff, sorghum-sudangrass) and two new alternative crops (Italian ryegrass and forage rye) that were highly recommended by local producers and crop advisors.
The results of the alternative crops demonstrated that:
- Both irrigation level and irrigation technology can substantially influence the yield and nutritive value of alternative forage crops in semi-arid environments, though responses were highly crop and site-specific.
- For teff and sorghum-sudangrass, full and moderate deficit irrigation (≥75% of estimated ET), respectively, was generally required to maintain maximum biomass yield, particularly during early cuttings. However, 50% and 50% T irrigation level consistently enhanced forage nutritive value by increasing crude protein, fiber digestibility, and energy-related parameters while reducing structural fiber concentrations.
- Water productivity was generally enhanced under deficit irrigation, highlighting a trade-off between forage quantity and quality under water-limited conditions. Forage rye exhibited limited sensitivity to irrigation level, likely due to its cool-season growth habit and reliance on stored soil moisture though WP was maximum at 50% irrigation level.
- Irrigation technology effects were inconsistent across site-years; sprinkler-based systems tended to support greater yields, while MDI often improved forage quality but greatly reduced total biomass. No single irrigation technology consistently optimized both yield and quality across all crops and environments.
Overall, these findings highlight the importance of tailoring irrigation management to specific production goals. When water is a limiting resource, irrigation strategies should be guided by water productivity. Given the variability observed across sites and years, site-specific management and adaptive irrigation strategies will be essential for optimizing forage production under increasing water scarcity.
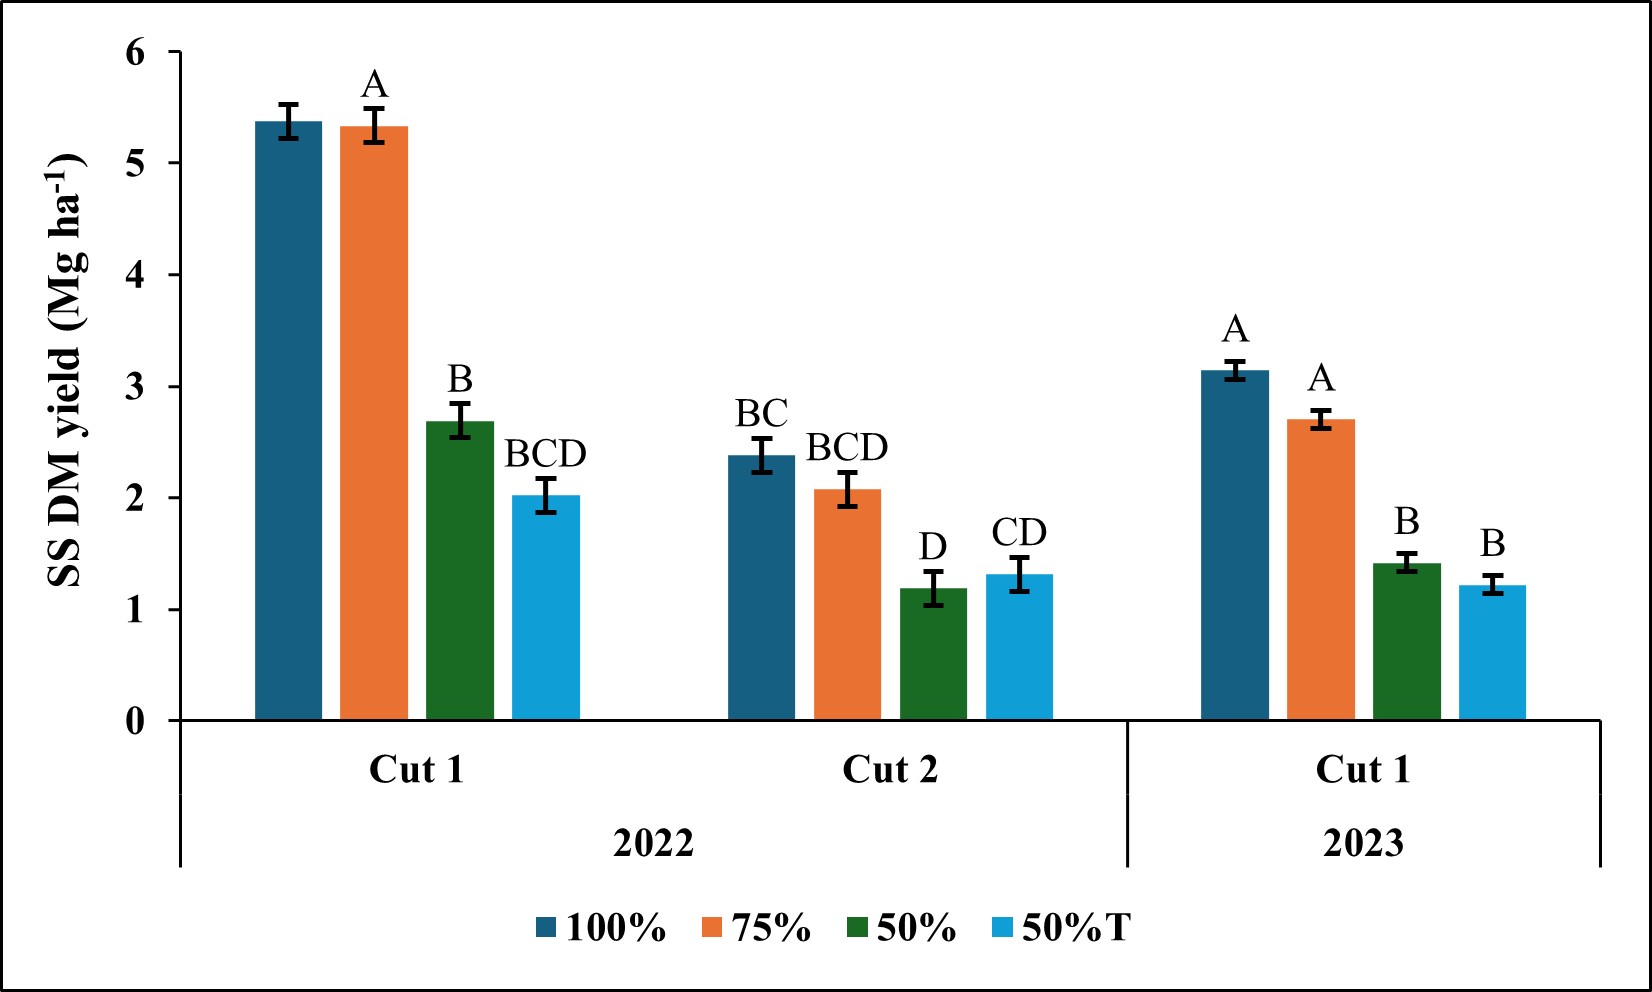
Figure 4. Effect of interaction between irrigation levels and cutting on dry matter (DM) yield of sorghum-sudangrass (SS) in 2022 and the effect of irrigation level in 2023 at a site near Vernal, UT, USA. The irrigation levels are full (100%), uniform reduction (75%, 50%) and 50% targeted reduction (50% T) of the estimated evapotranspiration. Different letters above bars represent statistically significant differences at α ≤ 0.05 for different irrigation levels within years. Error bars represent standard error (SE).
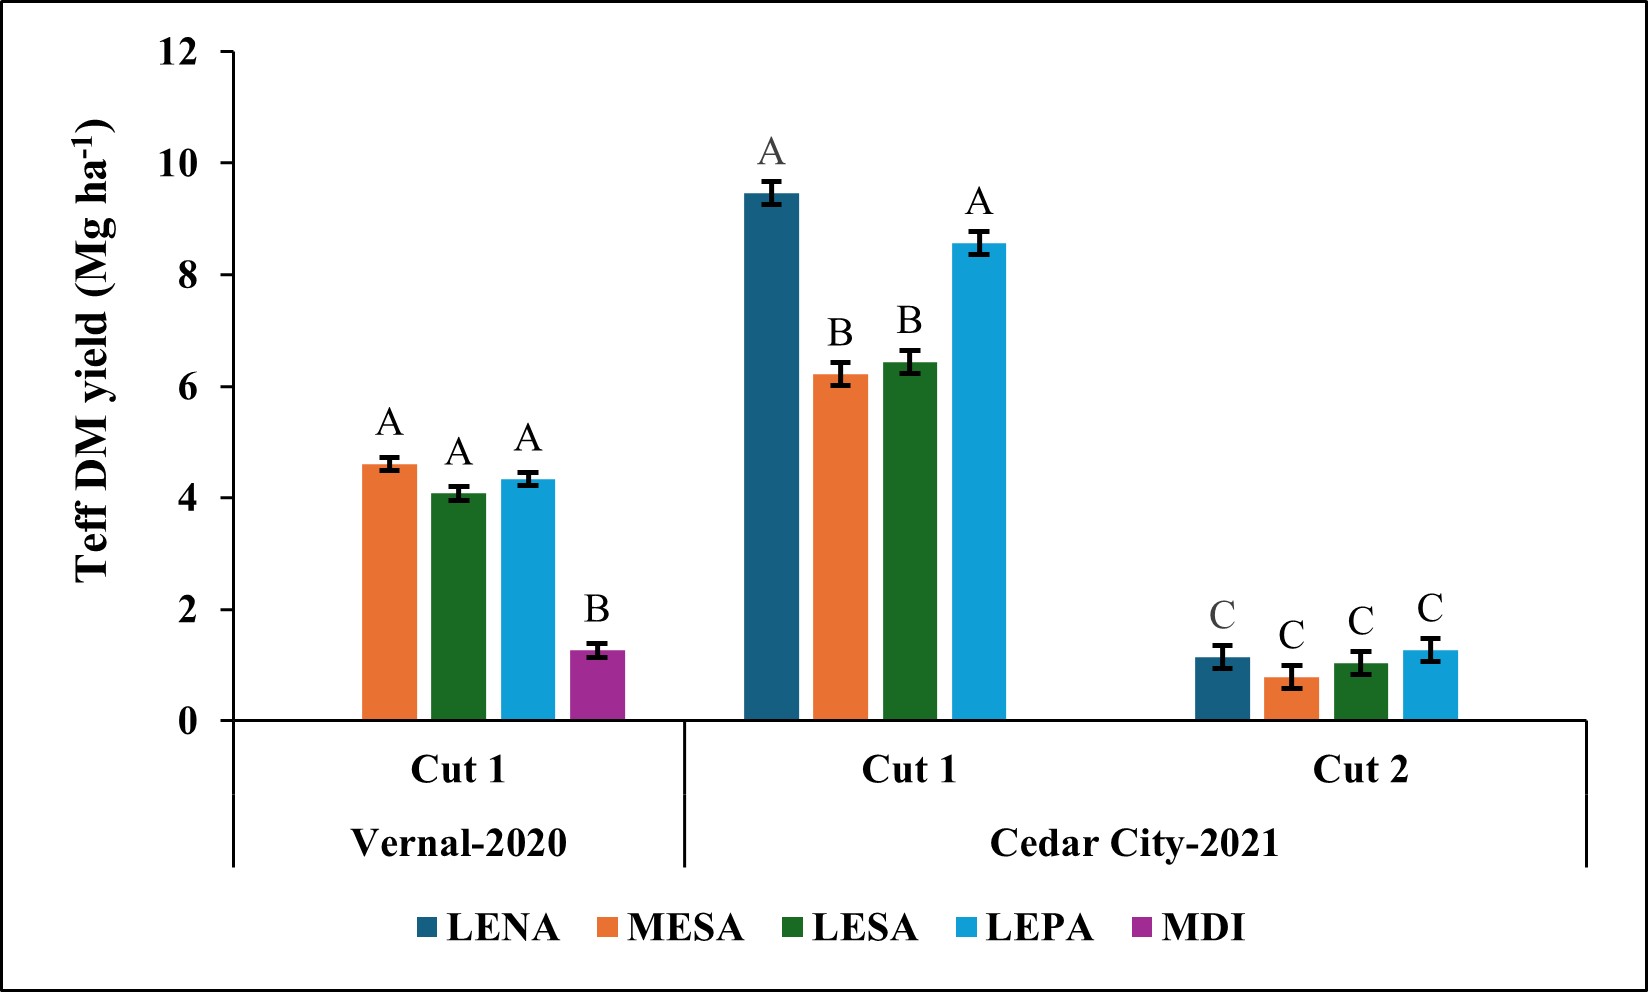
Figure 5. Effect of different irrigation technologies on total dry matter (DM) yield of teff in 2020 at a site near Vernal, UT, USA and the interaction effect of irrigation technologies and cutting on DM yield of teff in 2021 at a site near Cedar City, UT, USA. The technologies used included low-elevation precision application (LEPA), low-elevation sprinkler application (LESA), low-elevation Nelson Advantage (LENA), mobile drip irrigation (MDI), and mid-elevation sprinkler application (MESA). Different letters above bars represent statistically significant differences (at α ≤ 0.05) for different irrigation technologies within site-years. Error bars represent standard error (SE).
A fifth major activity was to summarize data on how longer-term no-tillage and cover crop use (4-6 years) influence crop production, quality, and soil health. The key takeaways from analysis suggest that:
- Growers in northern Utah can reduce irrigation by up to 50% without decreasing soil health, especially with NT and possibly CC in annual forage crops, such as silage corn and small grain forage.
- Alfalfa in moderate deficit (75%) not only maintains yield and improves forage quality but also consistently supports the strongest soil health indicators and infiltration capacity, making it the most resilient and reliable crop for water-limited systems.
- For silage corn, a uniform 75% irrigation strategy provides a safer balance between water savings, yield, and forage quality. But a 50% deficit showed reduced microbial activity and more variable infiltration responses.
- For growers in the southern part of Utah (Cedar City), water reduction may need to be limited to 25%, unless NT and CC are used to buffer the negative impacts of greater DI rates.
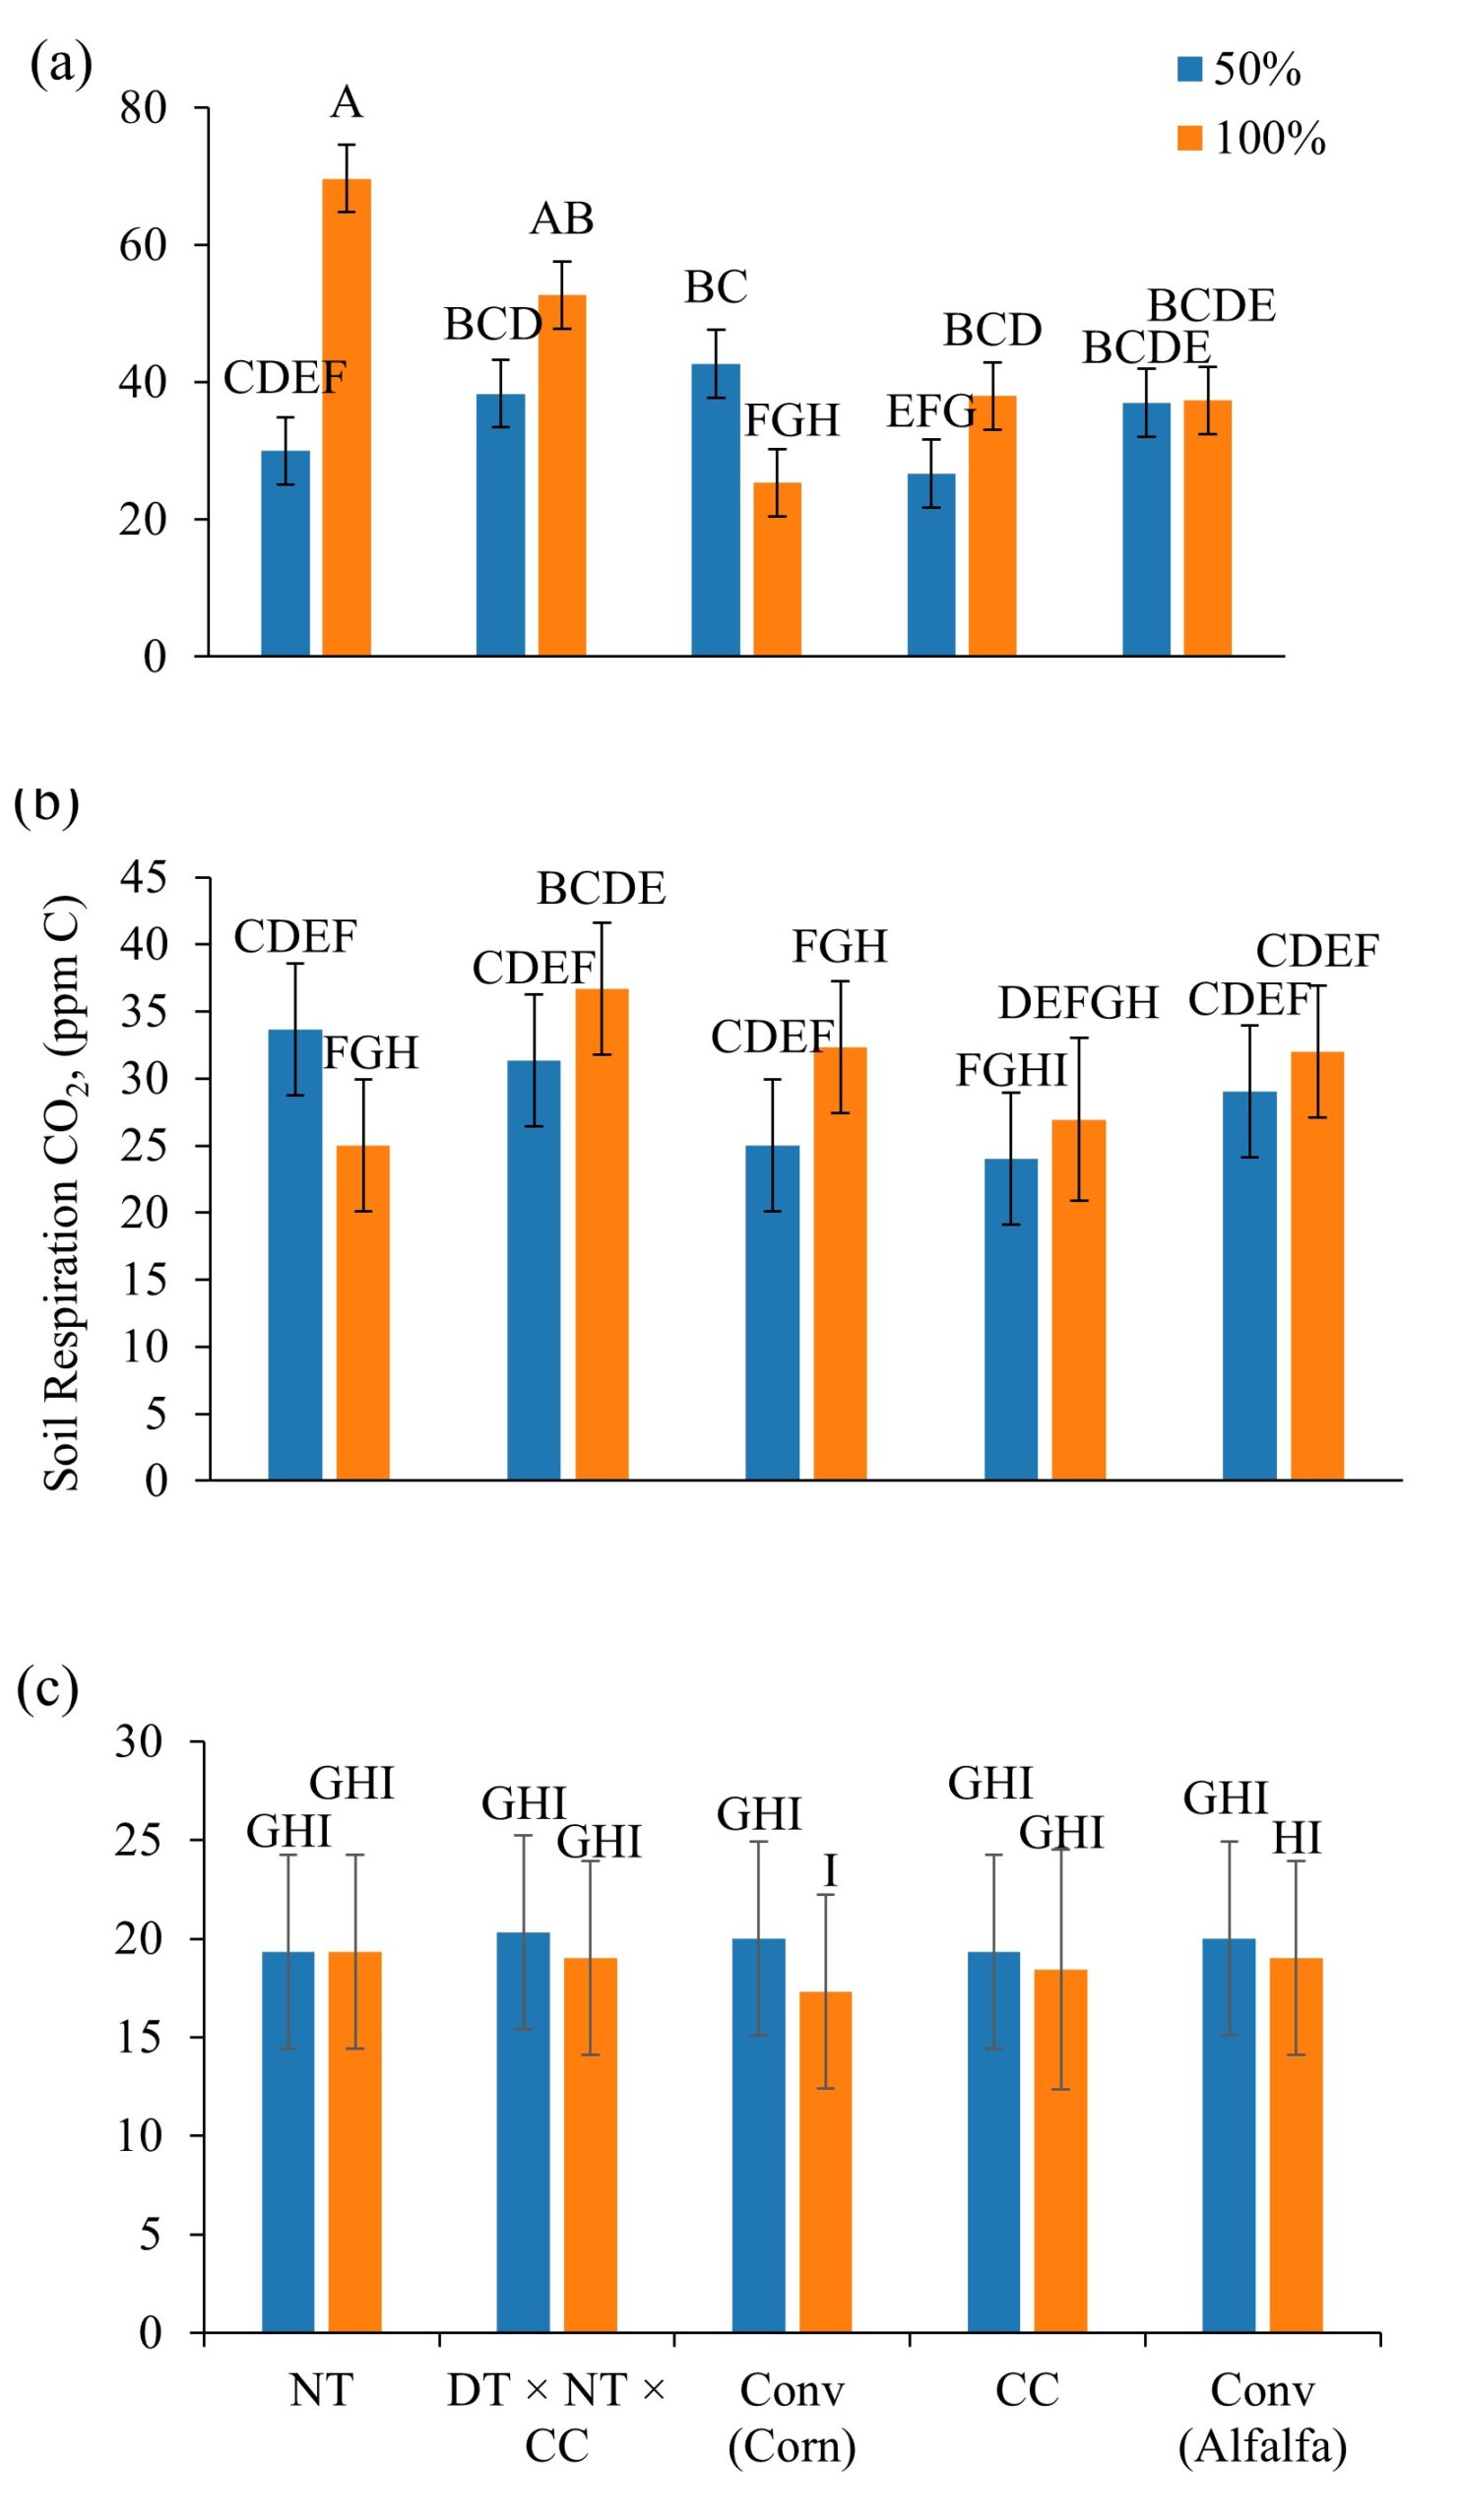
Figure 6. Effect of deficit irrigation on Soil Respiration CO2 C, (ppm C) during 2024 at Vernal (a), Wellsville (b), and Cedar City (c). Bars represent treatment means (±SE), and letters denote significant differences among treatments within each irrigation level, as determined by Tukey.
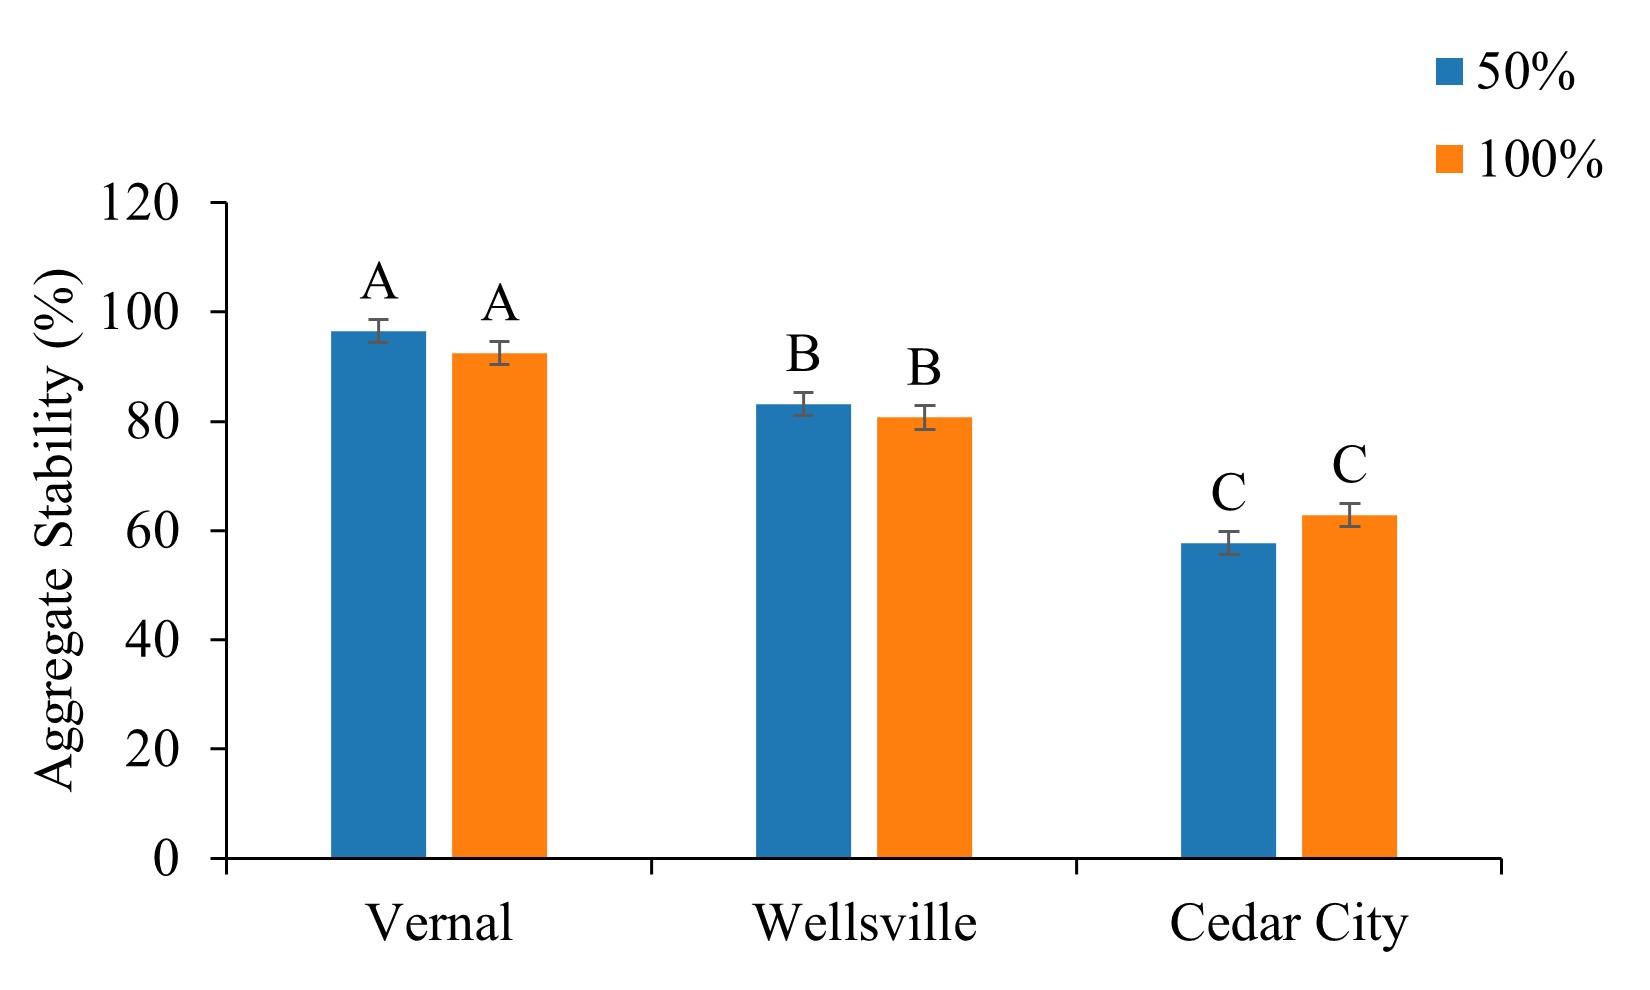
Figure 7. Effect of deficit irrigation on aggregate stability (%) during 2024 at Vernal, Wellsville, and Cedar City. Bars represent treatment means (±SE), and letters denote significant differences among treatments within each irrigation level, as determined by Tukey.
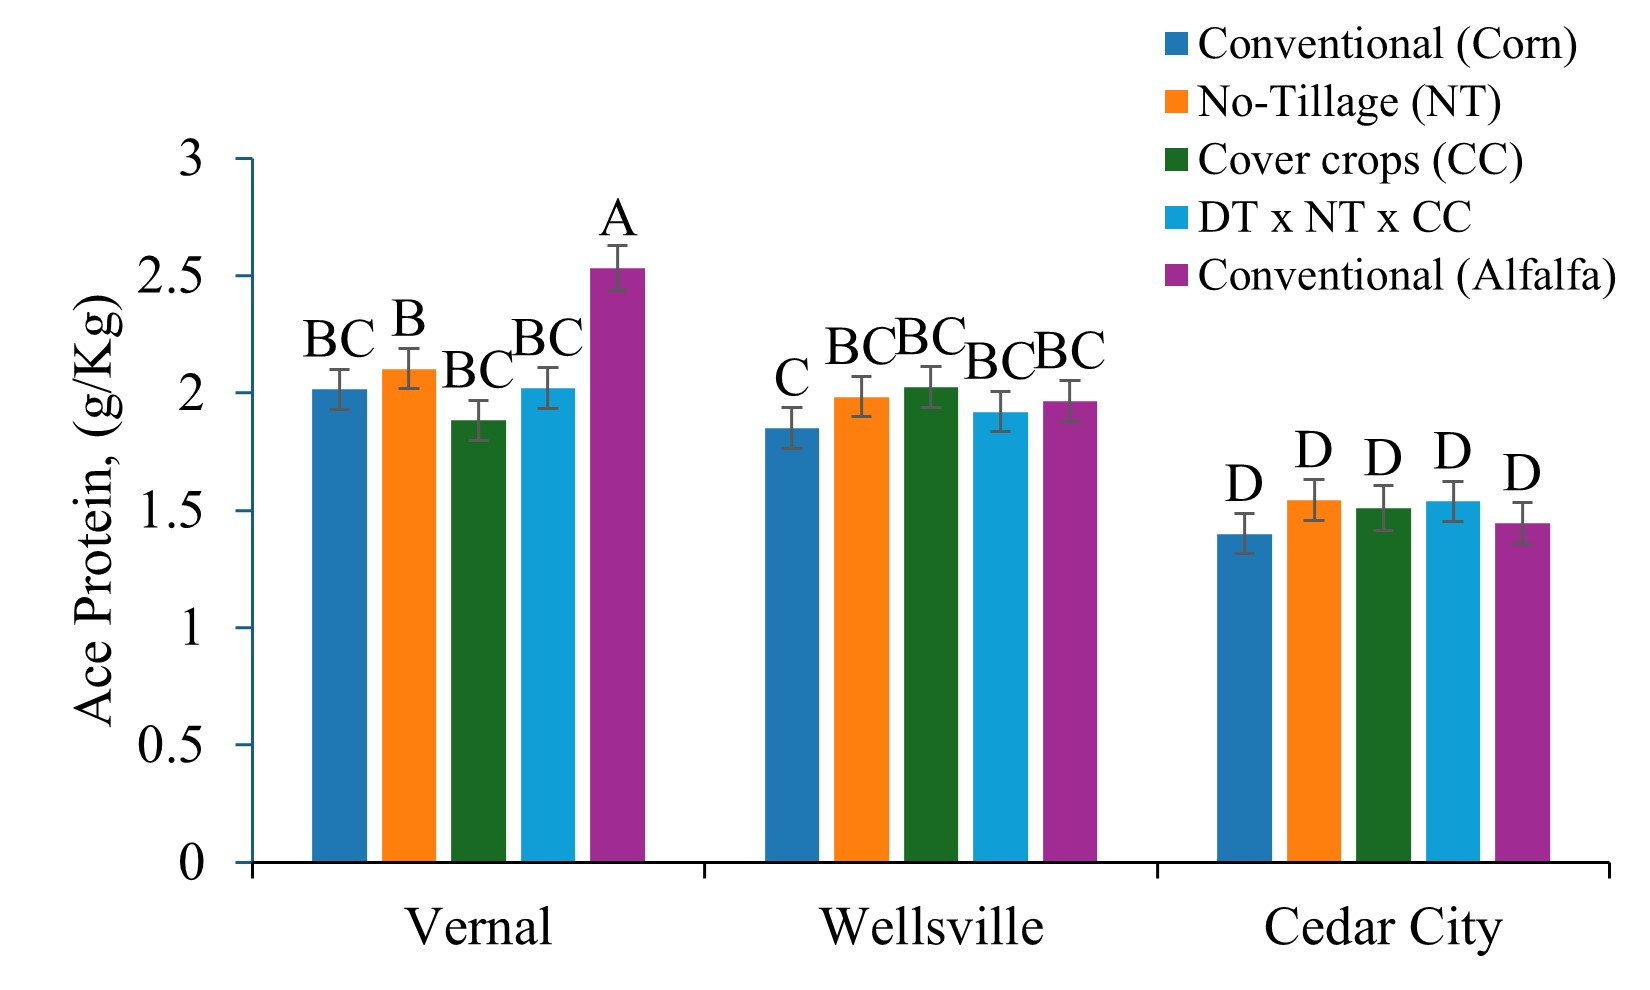
Figure 8. Effect of no-till, cover crop, and their interaction with drought-tolerant genetics in corn on ace protein (g/kg) during 2024 at Vernal, Wellsville, and Cedar City. Bars represent treatment means (±SE), and letters denote significant differences among treatments within each irrigation level, as determined by Tukey.
A sixth major activity was to evaluate the impacts of all treatments (irrigation technologies, deficit irrigation, cover crops, no-till, drought-tolerant genetics, and alternative crops) influence economic returns. It was a tremendous effort to compile all the economic data from all site-years included in this study from 2020-2025. We are in the process of summarizing this data across 2020-2025. A thesis chapter and manuscript are being developed and will be published in the summer of 2026.
Objective 2 - Demonstrate variable-rate irrigation systems that improve water and energy use efficiencies in long-term trials and on production farms.
Long-term zone VRI trials
In Phase II of this project, variable irrigation research was conducted at five irrigated field locations in Utah or Idaho, totaling eight site-years and six different crops (Table 1). At two field locations, the study evaluated speed control VRI, at two other locations the study evaluated zone control VRI, and one site was a VRI pilot study that evaluated spatial variation within the field under uniform irrigation. At all field sites, soil water content and water potential sensors were installed in multiple locations within the fields.
Table 1. Variable rate irrigation studies conducted during the 2023-2025 growing season
|
Crop |
Location (years) |
Farm Cooperator |
Description |
|
Alfalfa (’23) Silage Corn (’24) |
Enterprise, UT |
Tanner Holt |
Speed control-VRI; Full center-pivot sprinkler divided into 4 quadrants |
|
Winter wheat (’23, ’24, ’25) |
Elberta, UT |
Boyd Anderson |
Speed control-VRI; Full center-pivot sprinkler divided into 4 quadrants |
|
Barley (’23) |
Grace, ID |
Ryan Christensen |
Zone control-VRI; Half pivot divided into three zones |
|
Potato (’24) |
Grace, ID |
Ryan Christensen |
Zone control-VRI; Half pivot divided into three zones |
|
Canola Seed (’23) |
Pingree, ID |
T.J. Shaver |
Assessing variability under uniform irrigation; Full pivot |
We extended long-term trials to assess the impacts of zone VRI on potato (Tuberosum solanum) production, creating a unique and powerful dataset not previously studied and demonstrating a strong potential application of VRI. In Phase I of this project, we conducted a comparison of uniform irrigation vs. VRI at the field location near Grace, Idaho, to determine how zone VRI impacts crop yield, quality, profit, and water use. This is especially meaningful as a long-term study site because of the long-crop rotation commonly used for potato production. At the Grace, Idaho site, potato is grown every third year, with winter wheat grown the other two years in the crop rotation. With our long-term study, we now have potato data in 2018, 2021, and 2024. In each of these years, the potato study was conducted at field scale in a 22-ha field irrigated with a state of the art, zone-control VRI system. The primary objective was to examine water use and potato response to sensor-based VRI (Figure 9). Five irrigation zones were delineated from historical yield and evapotranspiration (ET) data (Figure 10). Soil sensors were placed at multiple depths within each zone to give real time data of the VWC values within each soil profile. For each irrigation event, irrigation rates were determined by comparing current soil volumetric water content to zone-specific soil field capacity values. Two control strips were created throughout each zone and irrigated based on the grower standard practice (GSP) for statistical comparisons.
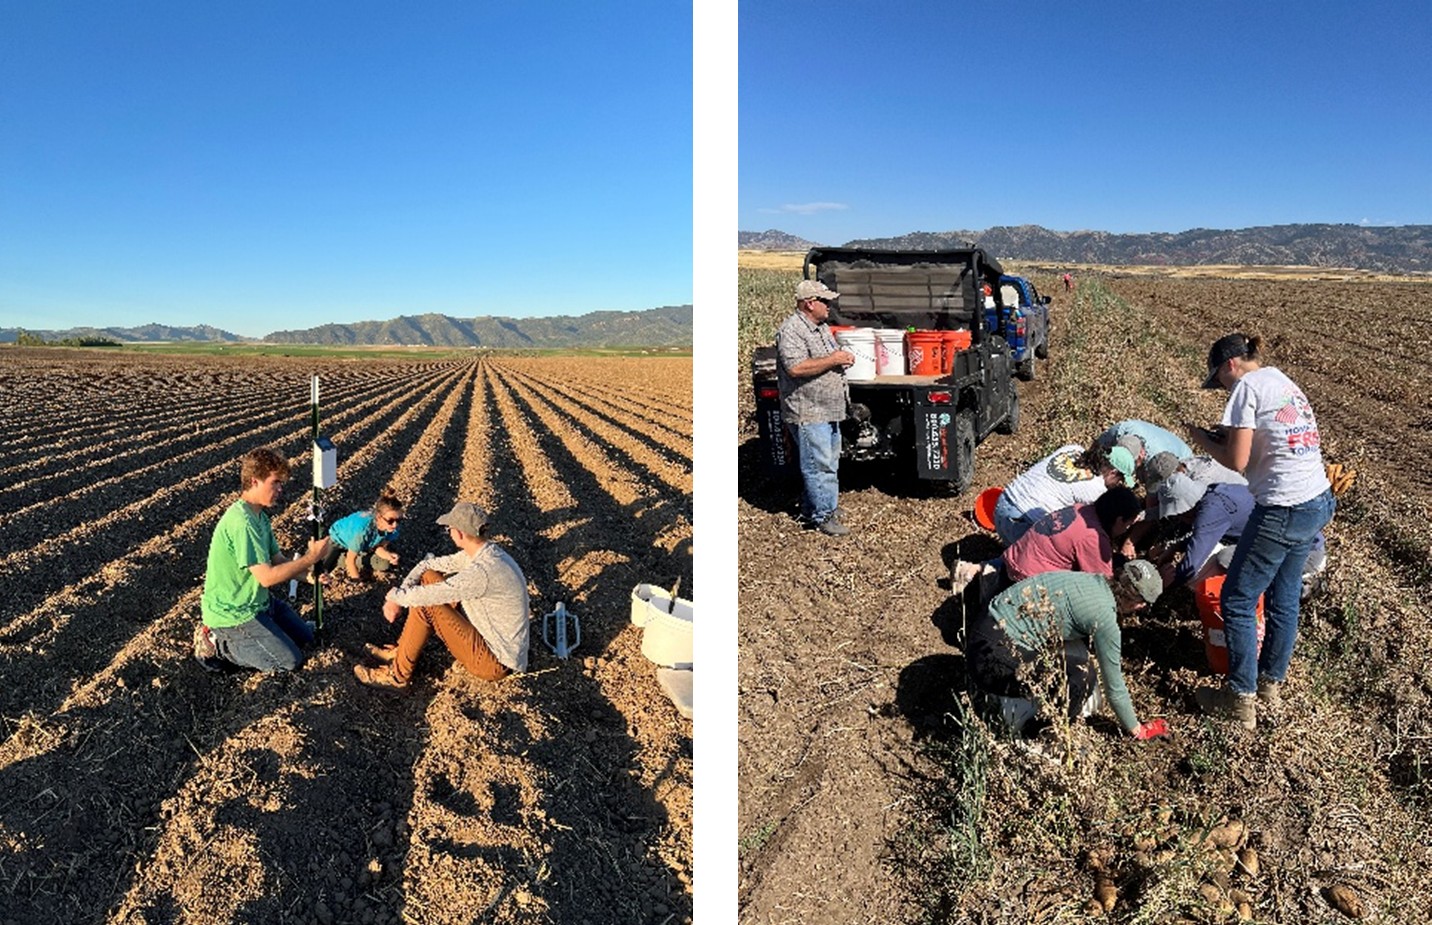
Figure 9. Team members installing soil sensors at the beginning of the 2024 Grace, Idaho potato research trial in Grace, Idaho (left) and collecting potato yield samples at the end of the trial (right).
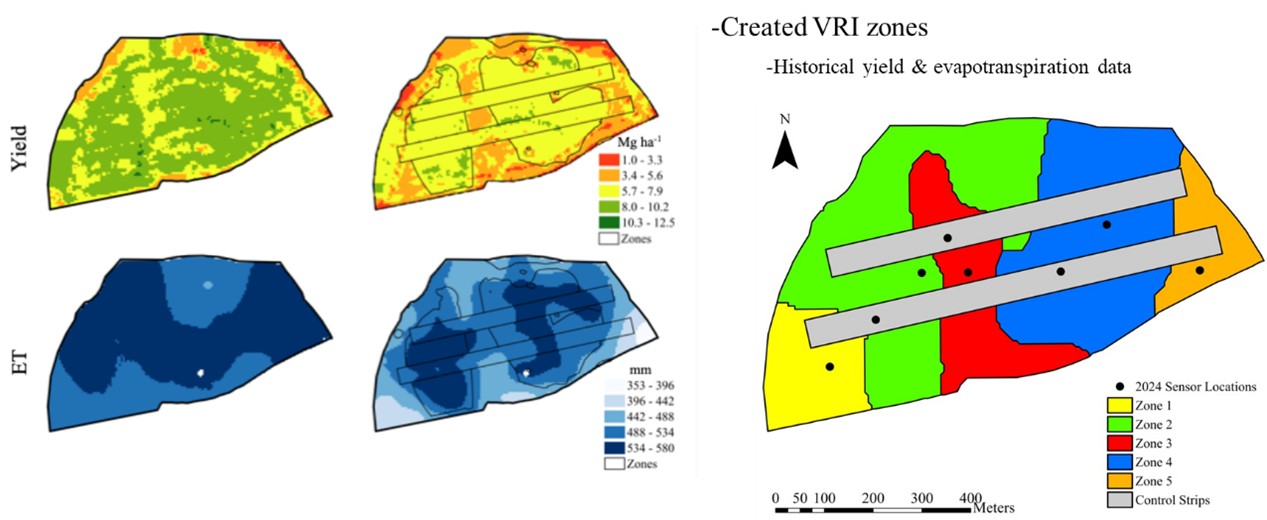
Figure 10. Potato yield and evapotranspiration (ET) data from the long-term study (2018) were mapped and used to create five variable rate irrigation (VRI) zones and uniform irrigation control strips for the 2021 and 2024 study years.
Cumulative irrigation rates varied among zones and years (Figure 11). In 2021, when averaged over zones, irrigation was significantly less for VRI compared to the control in 2021 and was similar on average in 2024. In both years, water applied in sensor-based VRI was less than the control strips in lower topographic areas of the field (zones 1 and 2). Historically, these areas have been excessively wet, resulting in diseased potatoes. Sensor-based VRI allowed for much better control of soil water throughout the field and a notable absence of diseased potatoes. In 2024, sensor-based VRI resulted in prescriptions for slightly higher irrigation in high yielding zones (zones 4 and 5). This illustrates the potential for VRI to reallocate water within a field from areas that previously were too wet to areas where the soil and crop can respond to increased water application. As such, even in 2024 when average water use was the same for VRI and control, the water use efficiency was much better. We analyzed total, marketable, and US. No.1 potato yield to evaluate the effects of VRI. The VRI procedure maintained or increased total, marketable and U.S. No. 1 yields (Figure 11). VRI increased tuber count, which resulted in a decreased of tuber size in some zones (data not shown). Overall, the data clearly documents the potential for VRI to benefit growers by improving yields, optimizing water usage, and reducing the negative affects of potato diseases in waterlogged areas of the field.
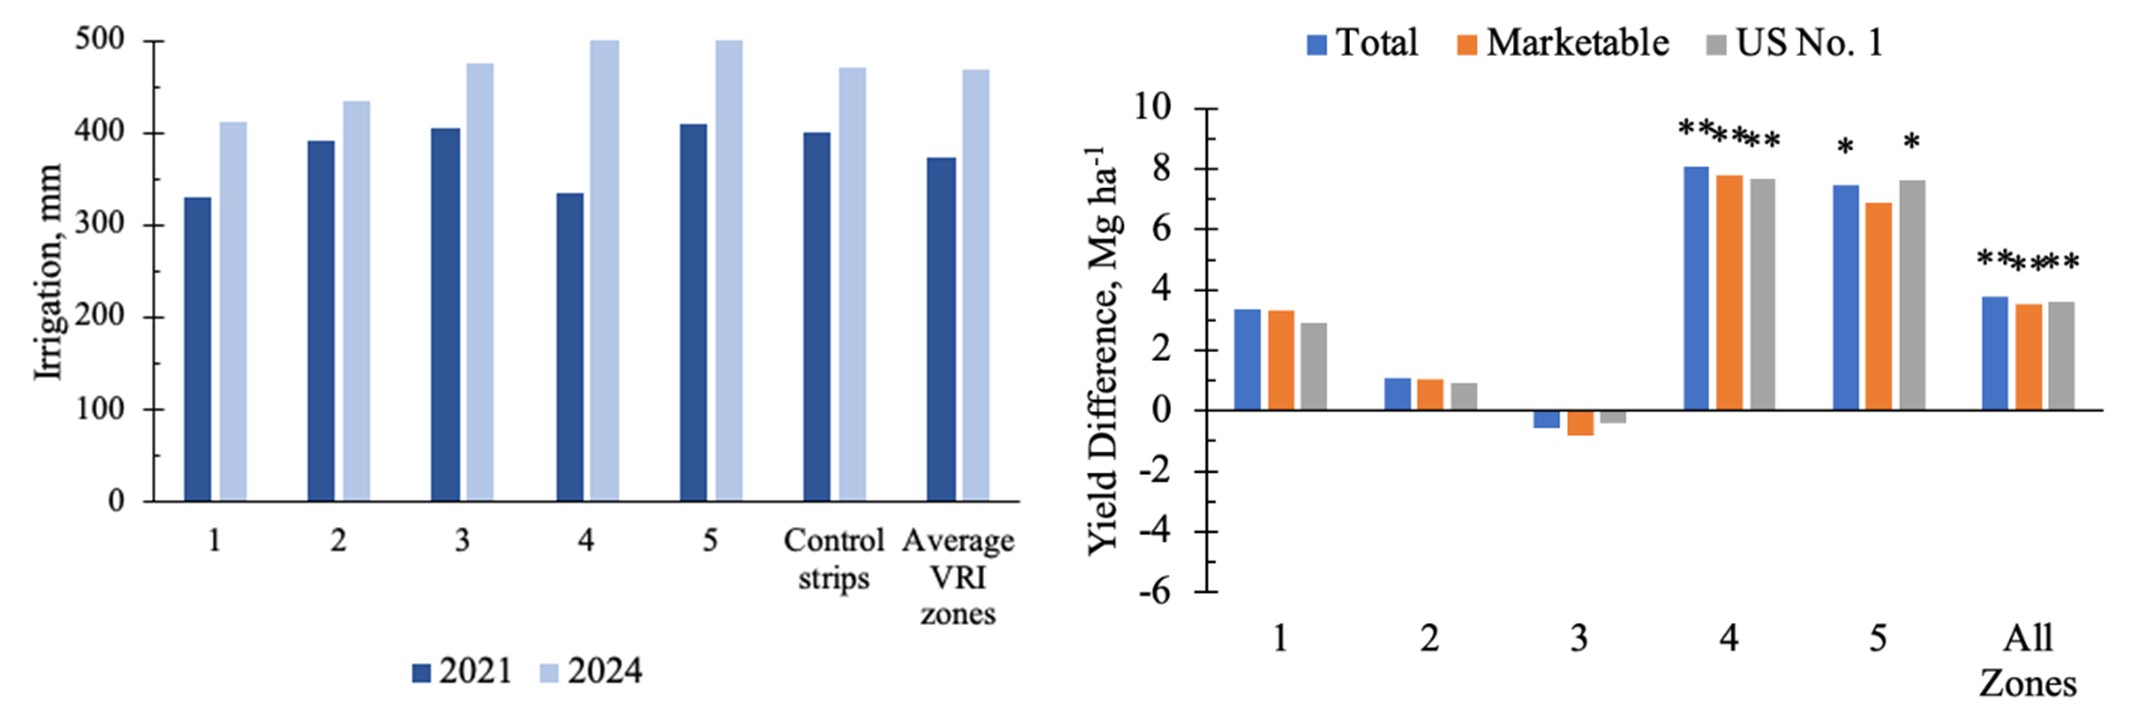
Figure 11. Left plot: Growing season cumulative irrigation for variable rate irrigation zones 1-5 compared to control strips with uniform irrigation rates for potato research at the Grace, Idaho location in 2021 and 2024. Right plot: The differences in potato total, marketable, and US No.1 yields between variable rate irrigation and control strips in 2024, by zone 1-5. Yield values for bars marked with * (p<0.10) or ** (P<.05) were significantly different than the yield for the growers standard practice control strips.
On Farm Trials of Speed Control VRI
While zone-control VRI systems offer the highest potential for precision water application, few growers have center-pivot sprinklers with zone control capabilities. Speed control VRI, limited to wedge-shaped zones created by changing the travel speed of center-pivot irrigation system, are less flexible, but have higher adoptability because this approach to VRI can be implemented on nearly all existing center-pivot sprinklers. In Phase 2 of our long-germ research project, we added on-farm studies to evaluate sensor-based, speed control applications.
Enterprise, UT Site. As an example research layout for one of the field locations, speed-control VRI was evaluated at the Enterprise, UT site (Figure 12). At this site, the full, 120 ac pivot field was subdivided into four quadrants (SW, 40 ac; NW, 40 ac; NE, 20 ac; SE, 20 ac), with spatial variation of soil texture being the key factor delineating the quadrants on the west and east sides. The soil textural classes were sandy loams on the west side quadrants (SW, NW) and silty or silty clay loams on the east side quadrants (NE, SE). The quadrants were assigned an irrigation treatment as either speed control VRI or a growers standard irrigation practice treatment as a control. Irrigation rates and timings for the standard irrigation practices were done as the normal practice by the farm cooperator. For the speed control VRI treatments, irrigation timing matched the standard irrigation practice, but rates were determined from the soil moisture sensors. The procedure for determining irrigation rates was first to determine site-specific soil water thresholds (volumetric water content at field capacity) for each VRI zone, then to compare volumetric water content measured with sensors at three depths with the thresholds and to calculate the irrigation rates needed for each VRI zone to bring the soil to the threshold.
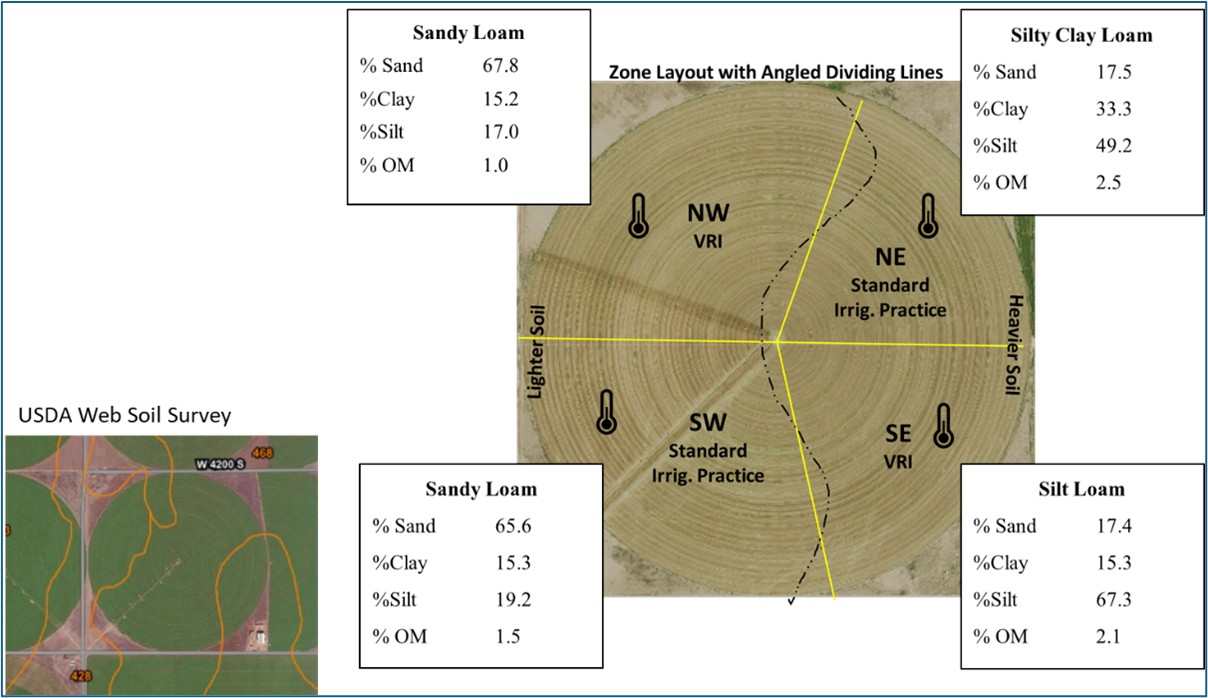
Figure 12. Experimental layout for speed control variable rate irrigation (VRI) study of alfalfa at the Enterprise, Utah location in 2023. The field was divided into four quadrants by soil texture class and by VRI or standard irrigation practice.
In 2023, the field had an established stand of alfalfa. There were a total of 38 irrigation events during 2023 and there were four alfalfa harvests. Total amounts of irrigation applied for each quadrant varied by harvest interval and between the standard irrigation and speed control VRI treatments (Table 2). On average, the speed-control VRI practice resulted in more than a 10-inch reduction in applied irrigation compared to the standard irrigation practice. Despite the differences in applied irrigation, there were no differences observed in alfalfa yield (Table 3).
Table 2. Rates of irrigation applied to alfalfa by irrigation treatment in 2023 at the Enterprise, Utah research location. Applied irrigation is shown by harvest interval or prior to greenup (Jan 01-Mar 31) or after the final harvest in 2023 (Sept 21-Dec 31).
|
Applied Irrigation (in) |
|||||||
|
Time Period |
Standard Irrigation Practice SW |
Speed Control VRI NW |
Standard Irrigation Practice NE |
Speed Control VRI SE |
Standard Irrigation Practice Average |
Speed Control VRI Average |
|
|
Jan 01-Mar 31 |
1.0 |
1.0 |
1.0 |
1.0 |
1.0 |
1.0 |
|
|
Harvest 1 Harvest 2 Harvest 3 Harvest 4 |
6.3 |
4.9 |
5.8 |
4.7 |
6.1 |
4.8 |
|
|
13.3 |
8.8 |
14.5 |
11.0 |
13.9 |
9.9 |
||
|
10.0 |
7.0 |
10.0 |
7.3 |
10.0 |
7.2 |
||
|
12.5 |
6.5 |
13.5 |
8.3 |
13.0 |
7.4 |
||
|
Sep 21-Dec 31 |
1.8 |
1.8 |
1.8 |
1.8 |
1.8 |
1.8 |
|
|
Total |
42.7 |
30.8 |
42.2 |
32.8 |
42.5 |
31.8 |
|
Table 3. Alfalfa yield by irrigation treatment and harvest period in 2023 at the Enterprise, Utah research location.
|
Yield Anova |
|||
|
|
Ton/acre |
|
|
|
Standard Irrigation Practice |
Speed Control VRI |
P value |
|
|
Harvest 1 |
3.8 |
3.7 |
0.791 |
|
Harvest 2 |
2.7 |
2.7 |
0.627 |
|
Harvest 3 |
1.7 |
1.6 |
0.394 |
|
Harvest 4 |
1.4 |
1.5 |
0.341 |
|
TOTAL |
9.4 |
9.4 |
0.556 |
The same field in Enterprise, UT was planed to corn silage in 2024 and the same study design was used to compare VRI to the growers standard practice. While the VRI prescriptions for alfalfa in 2023 resulted in significant differences in the amount of applied irrigation, this was not observed for corn silage in 2024. Two main factors help explain this: 1) much of the irrigation water savings for alfalfa happened early in the growing season (March-June), whereas corn silage isn’t planted until mid to late May and its greatest water use occurs later in the summer, and 2) the growing season precipitation was much less in 2024 than in 2023. This result illustrates that using sensor-based VRI does not guarantee water savings. It does, however, allow for informed irrigation scheduling and also provides a detailed record of the soil water conditions experienced by a crop, which can be helpful in documenting growing conditions and explaining yield observations.
Elberta, UT Site. As another example research layout, speed-control VRI was evaluated at the Elberta Research site (Figure 13). At this site, the full, 120 ac pivot field was subdivided into four quadrants (N, 30 ac; E 30 ac; S, 30 ac; W, 30 ac), with spatial variation of elevation and mapped soil series being the key factor delineating the quadrants. The soil textural class was loam for all four quadrants. The quadrants were assigned an irrigation treatment as either speed control VRI or a growers standard irrigation practice treatment as a control. Irrigation rates and timings for the standard irrigation practices were done as the normal practice by the farm cooperator. For the speed control VRI treatments, irrigation timing matched the standard irrigation practice, but rates were determined from the soil moisture sensors. The procedure for determining irrigation rates was first to determine site-specific soil water thresholds (volumetric water content at field capacity) for each VRI zone, then to compare volumetric water content measured with sensors at three depths with the thresholds and to calculate the irrigation rates needed for each VRI zone to bring the soil to the threshold.
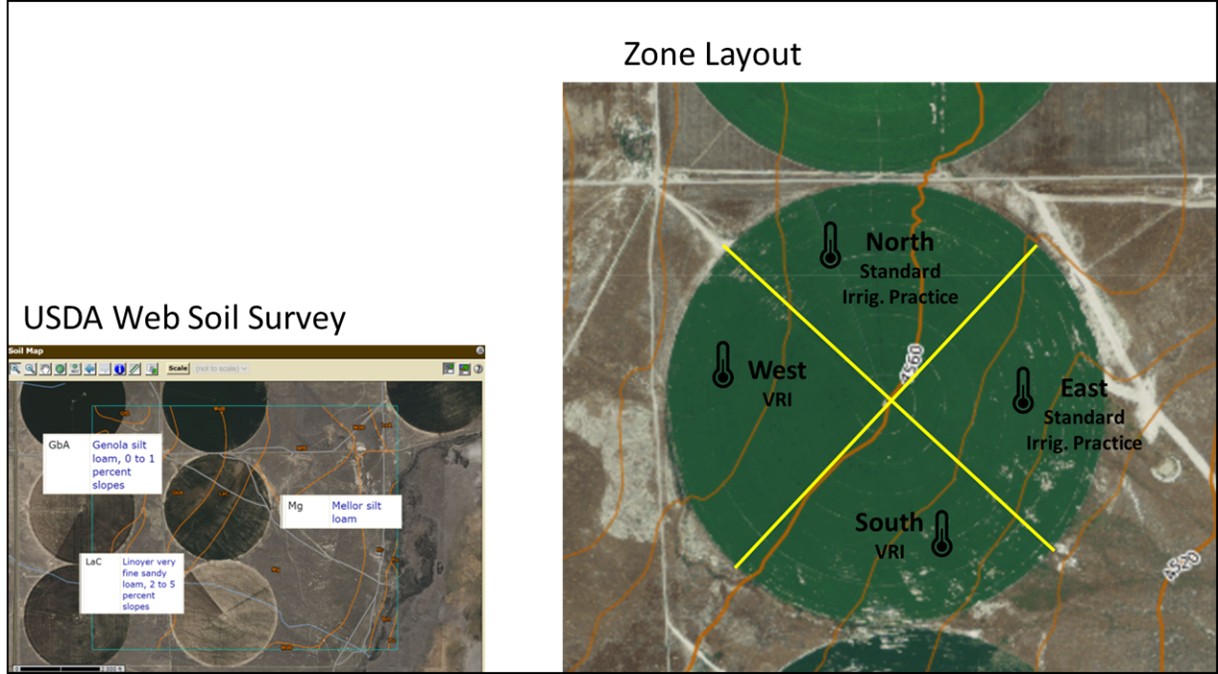
Figure 13. Experimental layout for speed control variable rate irrigation (VRI) study of winter wheat at the Elberta, Utah location in 2023 and 2005. The field was divided into four quadrants based on mapped soil type and by VRI or standard irrigation practice.
There were a total of 12 irrigation events during 2023 and 17 in 2025. Total amounts of irrigation applied varied between the growers standard irrigation and speed control VRI treatments (Table 4). On average, the speed-control VRI practice resulted in 2.1-inch reduction in applied irrigation compared to the standard irrigation practice. In both years, grain yield was greater for the VRI treatment than for the GSP (Table 3). Achieving consistently greater yield with lower irrigation rates is a very key result showing that using sensors and VRI permits modification of commonly used irrigation practices to both save water and improve productivity. Evaluation of the soil water dynamics during the growing season (Figure 14) shows potential reasons for this. Soil water content for the standard irrigation practice regulary exceeded the soil field capacity, leading to water movement deeper in the soil, which likely also leached nutrients from the soil. Conversely, soil water for the VRI treatment stayed within the plant available water zone and showed very little downward movement of water.
Table 4. Number of irrigation events, average depth of even irrigation, total irrigation, and grain yield for variable rate irrigation (VRI) and the grower’s standard practice (GSP) treatments. Rates of irrigation applied to winter wheat by irrigation treatment in 2023 and 2025 at the Elberta, Utah research location.
|
Time Period |
Number of Irrigation Events |
VRI Average Event Irrigation Depth (in) |
GSP Average Event Irrigation Depth (in) |
VRI Total Irrigation Depth
(in) |
GSP Total Irrigation Depth
(in) |
VRI Grain Yield
(bu/ac) |
GSP Grain Yield
(bu/ac) |
|
2023 |
12 |
1.1 |
1.25 |
13.25 |
15.0 |
75 |
69 |
|
2025 |
17 |
1.1 |
1.25 |
18.75 |
21.25 |
97 |
82 |
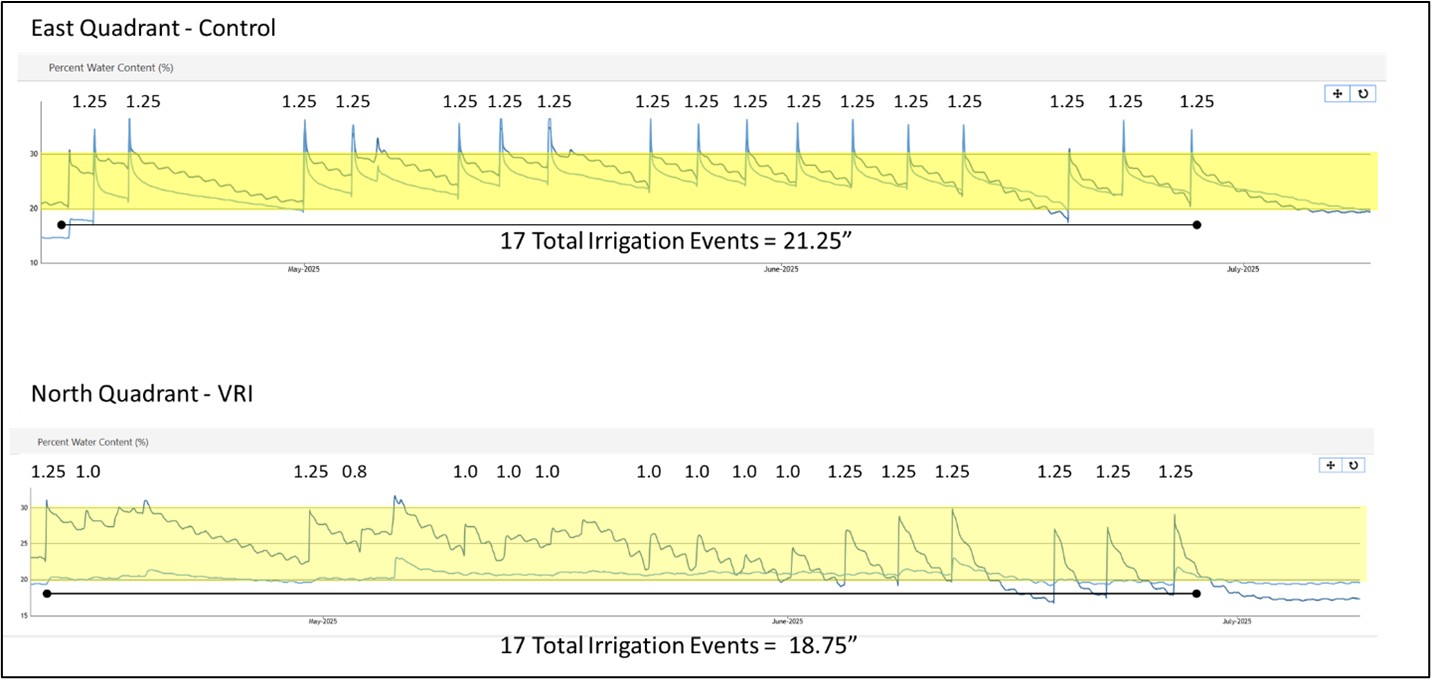
Figure 14. Soil water dynamics over the 2025 winter wheat growing season at the Elberta, UT study location. The upper figure (east quadrant) shows results of the growers standard irrigation practice, while the lower figure (north quadrant) shows results of the variable rate irrigation treatment (VRI). The yellow bands are the site-specific plant available water zones. Each plot shows soil water dynamics for a shallow sensor (6 inches) and a deep sensor (18 inches).
Research outcomes
- Drought-tolerant corn genetics and alfalfa cultivars with enhanced drought tolerance rarely or never improved crop yield under full or reduced irrigation rates. This indicates they may not be effective tools for conserving water.
- The low-elevation spray application sprinklers (LEPA, LESA, and LENA) often but not always maintained or improved corn and alfalfa yield with 25% less irrigation than conventional mid-elevation sprinklers. These systems have high potential to save water but benefits are site-specific and each field should be evaluated for ideal systems.
- Short-term use (4-6 years) of cover crops and no-tillage in silage corn production systems sometimes reduces corn yield. Cover crops and no-tillage individually or combined have not yet enhanced yield under water stress conditions but may over time as soil health builds.
- Cover cropping and no-till generally improved soil health (structure and biological activity) and should be considered as methods for building long-term soil health.
- Alternative forage crops such as sorghum sudangrass, teff, and forage rye can improve water use efficiency compared to alfalfa and silage corn.
-
Both zone‑control and speed‑control VRI can significantly enhance the sustainability of irrigated agriculture in the Western U.S. through improved water use efficiency, better soil-water dynamics, yield stability, and reduced disease pressure. Speed-control is an option for most existing pivots and should be considered as a first and low-cost step to advancing precision irrigation.
Education and Outreach
Participation summary:
The education and outreach plan is the third objective of our proposal and consists of five major activities to deliver dynamic products and trainings for producers, agricultural professionals, water managers, and related stakeholders.
- Host field days – in Phase II we planned to host field days at each of the eight locations in Idaho and Utah for Objective 1 and 2 to demonstrate treatments and present and discuss results. In addition to regularly planned field days, we hosted other tours and field days for other organizations such as conservancy districts, conservation district, state agencies, politicians, and other related stakeholders. We hosted field days at the Cedar City, Logan, Vernal, Beryl-Enterprise, and Aberdeen sites once or twice during 2022-2025. Each field day had 25-50+ people attend. In addition to these, we also held field days for conservancy districts, conservation districts, state agencies, and politicians. These groups were the main target audience at some events or were among the invited participants at others.
- Host a dealer, advisor, and conservation planner training – In Phase II, we hosted a joint training event in 2023 and 2025 with three groups of trainers (irrigation dealers, crop advisors, and conservation planners). This strengthened the synergy and trust we have created during the three trainings in Phase I. It was a one to two-day training held in late August and involved research presentations, panel discussions with participants from all groups, and facilitated working groups to identify needs and opportunities to collectively advance water optimization in Idaho and Utah. Nearly 100 trainers attended each event from Utah and Idaho, including strong participation by NRCS who could not participate in former trainings due to CO-VID.
- Develop multi-media outreach materials – Our multi-media outreach in Phase II included social media education, short e-articles, and short YouTube videos through the established USU Extension Crops team. We posted several social media posts on all three major social media platforms (Instagram, Facebook, and X), published over ten e-articles to highlight aspects of the water optimization research in objectives 1 and 2.
- Present results at producer and professional meetings – Results of this study have been presented in many crop schools in Idaho and Utah each year or every other during 2022-2025 at the Utah Hay Symposium, the Utah Water Users Conference, the American Society of Agronomy Annual Meetings, and many other local, regional, and international conferences and meetings. We estimate the results have been presented to nearly 5,000 people in over 120 presentations.
- Publish extension and journal articles–We have published 16 journal articles related to this research in 2022-2025. Another six are currently in review. We have published 14 fact sheets and 19 farm press and related articles in 2022-2025 to disseminate findings of this study.
One of the major education goals of phase II of this project was to host a training for a diverse group of trainers in Utah and southern Idaho. Irrigation dealers, NRCS planners, Utah Department of Food and Agriculture Planners, Crop Advisors, and USU Extension faculty were all invited to participate in the training that we held in September of 2023 at the Logan, Utah water optimization site. Our goal was to bring together government and industry planners to foster greater conservations and collaboration towards optimizing irrigation management in Utah and Idaho. We hosted the training in coordination with an irrigation supplier (WISH-NW). We had 105 people attend the 2-day training. We provided training and demonstrations on irrigation systems (subsurface drip, pivot, and wheel-line technologies), irrigation maintenance, and irrigation management. Nearly one-third of the participants completed the meeting evaluations and it represented attendees from all major categories (Figure 1). The training was repeated in 2025 at our research site near Grace, ID. The format and attendance was similar, with diverse participation from the irrigation and crop industry.
All respondents of the workshops indicated that they were satisfied with the material presented, the quality of the training, and the quality of the speakers. A majority (90%) indicated that their knowledge of irrigation systems, maintenance, and management was ‘somewhat’ or ‘much’ better because of the training (Figure 2). The participants advised or serviced farmers on small (5-10 acres) up to millions of acres. The cumulative acres that the 33 respondents advise for totaled over 4 million. The respondents had difficulty in estimating the economic impact that the training would have on the farmers they advise but many indicated that they may be able to help farmers save about $5-25/acre.
Crop school and other Extension presentations were delivered to over 3,000 farmers, crop advisors, and related stakeholders in 2022-2025. The majority of participants regularly report knowledge gain, intention to use and apply the research, and economic improvements on their farms and ranches as a result of the education.
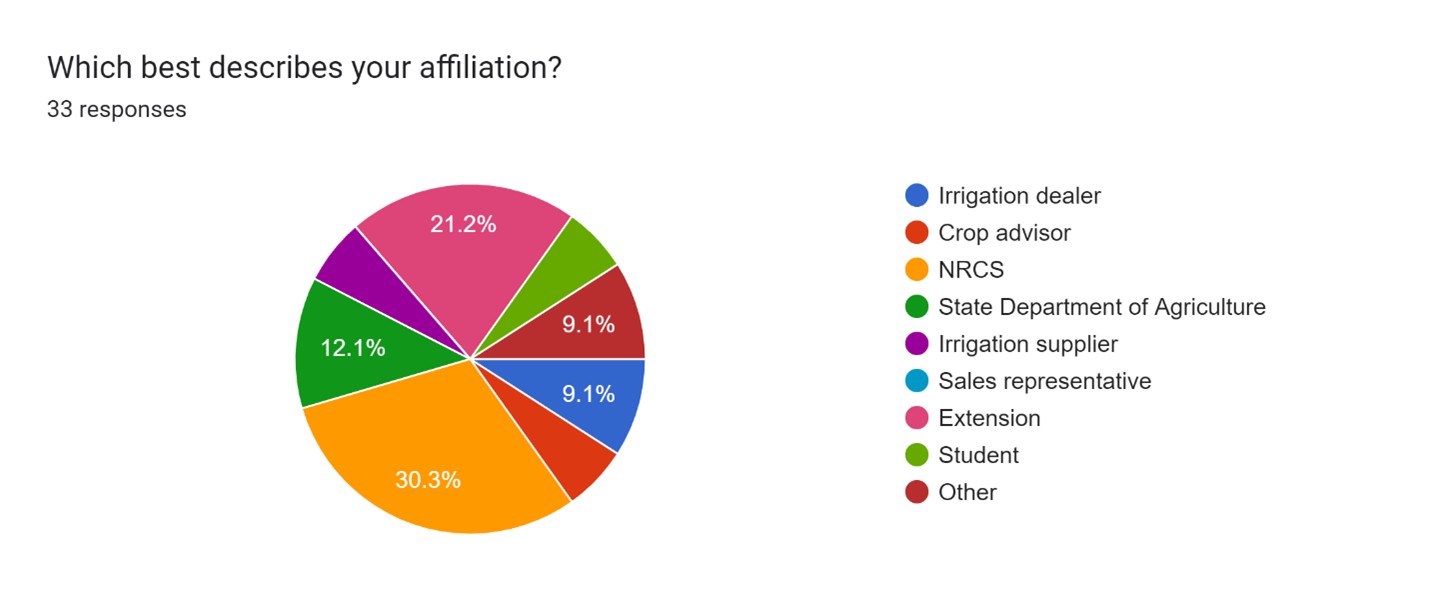
Figure 1. Affiliations of the irrigation advisor training.
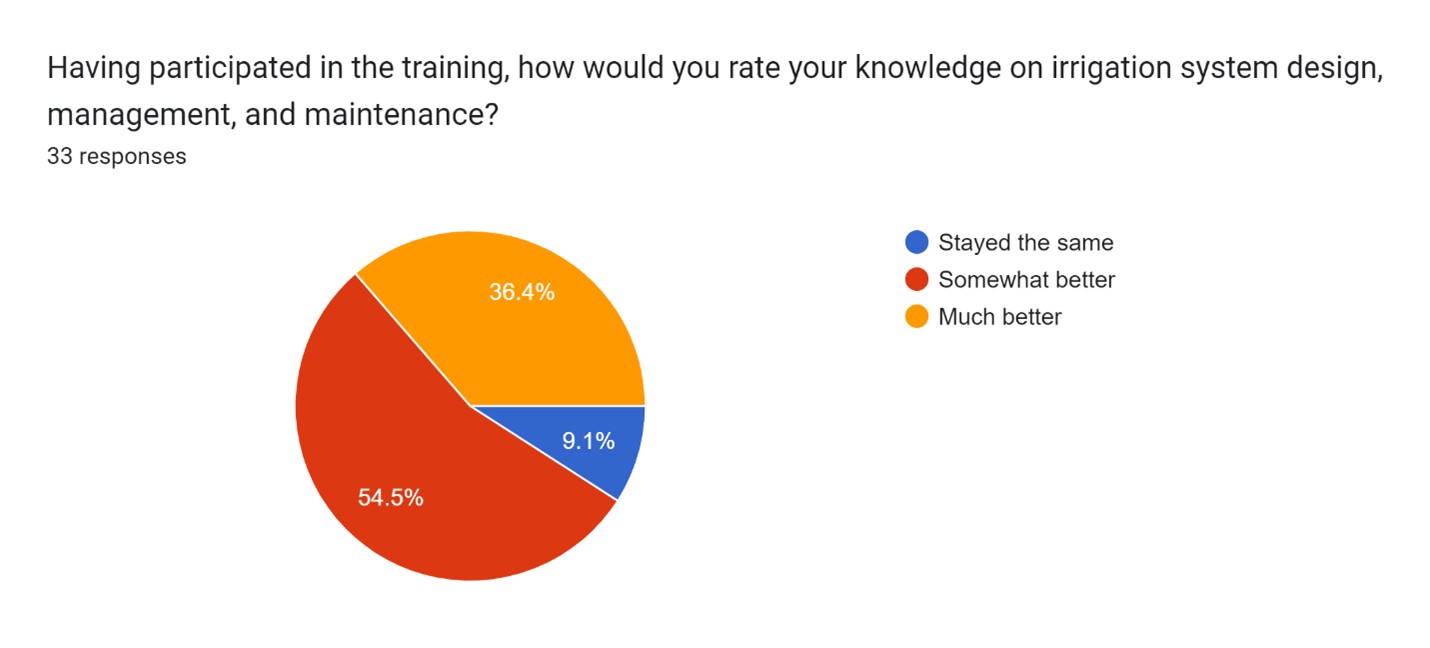
Figure 2. Knowledge gain responses of irrigation advisor training participants.
The eight e-articles that were written for this project were each sent to a list-serve of about 1,800 subscribers. Nearly 200-300 or more people opened and viewed each of these articles. They were also shared on social media with about 1500 total subscribers on the three major social media platforms.
Education and Outreach Outcomes
We have learned important lessons during the second phase of this long-term project. Many lessons learned about deficit irrigation, irrigation technologies, no-till, cover crops, alternative crops, soil health, and precision irrigation were published as USU Extension fact sheets. The results from objective 1 on combining water optimization practices have helped guide policymakers, state agencies, water managers, and many others in Utah and Idaho. The research helped inform the $270+ million-dollar investment in water optimization by the Utah legislature. This funding is helping to make improvements in optimization in many parts of Utah. Our research is helping to prioritize where that funding might have the greatest impact. We developed two online interactive tools to help identify the water consumption changes due to irrigation system changes, and the economics of those changes. These high demand tools have been used by many stakeholders in water optimization efforts. Recommendation: Development, expansion, and refinement of decision-aid and economic tools for water optimization are needed to help farmers, advisors, and governments effectively optimize water use in western agriculture.
We have also engaged the irrigation industry (both irrigation professionals and crop advisors) and government planners (NRCS, state department of agriculture) in a coordinated and statewide (and regional – southern Idaho) way that has never been done before. This resulted in new connections and collaborations between these important stakeholder groups who both assist growers in making irrigation decisions. Providing training and facilitating discussions to identify and meet needs, and to prioritize research efforts has helped make Extension efforts more pertinent and useful to these industries, and has and will further the use of evidence-based practices to optimize water use in Utah and in the region. Recommendation: Regular trainings and workshops with these advisors are needed to ensure that advisors are trained on the latest science, technology, and techniques.
We are continuing to identify conditions where variable-rate irrigation (VRI) might be feasible and economic. These appear to be where water requirements are highly variable, as caused by variable soils, variable yield, or variations in field conditions. Further, cooperating farmers have been eager to test sector-based VRI to learn how it might help save water and improve their production efficiency. These findings on zone (mainly phase I) and sector VRI (phase II) are being developed into a variable-rate irrigation guide that will serve Utah, Idaho, Washington, and Oregon growers in making decisions about precision irrigation implementation. This guide will also be useful to other areas in the West with overhead sprinkler irrigation systems. Recommendation: Additional development, testing, and demonstration of simple and effective approaches to sector VRI will be needed to increase adoption of this readily available, effective, and cost effective tool for water optimization.
- Water conservation with sprinkler irrigation systems for pivots
- Water conservation with irrigation management and deficit irrigation
- Water conservation with alternative crops
- Practical precision irrigation with sector control
- Use of openET to guide irrigation management
- Crop and soil management for water conservation
- Crop and soil management for improving soil health
Use of alternative pivot irrigation sprinkler systems such as LEPA, LESA, and LENA sprinklers
Use of alternative crops that use less water
Use of sector-based variable-rate irrigation with pivots
Use of soil health practices (no-till and cover crops)