2012 Annual Report for GNE11-025
Cover crop selection and manure placement for weed suppression and nitrogen use efficiency in a no-till organic corn system
Summary
The long-term profitability and sustainability of organic corn (Zea mays L.) production must include reliable weed and fertility management strategies that minimize production costs, conserve soil, and maximize nutrient use efficiency. This may be accomplished through integration of novel manure management practices (subsurface banding dry solids) with an optimal legume:grass cover crop mixture and supplemental high-residue cultivation. The specific goals of this graduate student project are to 1) determine carbon (C) and nitrogen (N) release and persistence of decomposing cover crop surface mulches that vary in legume:grass proportions; 2) evaluate the effect of poultry litter placement on soil N spatial and temporal availability; and 3) determine the cover crop species combination and poultry litter placement method/rate that optimizes N availability and corn N use efficiency. A field experiment was conducted beginning fall 2010 for preliminary data collection and method development. To address the research objectives, a collaborative field experiment was established in fall 2011, with a range of hairy vetch (Vicia villosa Roth.): cereal rye (Secale cereale L.) cover crop mixtures planted and baseline soil samples collected. Cover crop biomass, N content and decomposition were measured during summer 2012, along with crop and weed N uptake and spatio-temporal soil inorganic N. Another experimental trial was established in fall 2012.
Objectives/Performance Targets
1. Cover crop residue decomposition
• Characterize C and N dynamics over time in decomposing cover crop residues composed of a range of legume:grass proportions to determine cover crop mixture that result in most persistent weed suppressive mulch.
• Determine the effect of poultry litter application (0 v. 67 kg plant available N ha-1), poultry litter placement (broadcast v. subsurface banded) and tillage on the rate of residue decomposition and N release for residues of varying composition.
o Progress:
? Two field seasons of cover crop decomposition data have been collected.
? Second year’s decomposition study included soil temperature and moisture sensors, along with an additional sampling event and expanded number of treatments
2. Soil N
• Characterize the spatial distribution of soil N in subsurface banded and broadcast poultry litter treatments across a gradient of cover crop mixtures over time.
o Progress:
? First season: spatially-specific soil cores were collected in subsurface banded and no poultry litter treatments from a single cover crop mixture; samples have been analyzed.
? Second season: spatially-specific soil cores were collected in the subsurface banded, no poultry litter, broadcast, and incorporated treatments in three of the cover crop mixture proportions.
• Determine the effect of high-residue cultivation on N distribution in subsurface banded and broadcast poultry litter treatments.
o We are no longer planning to test this hypothesis because we have found that high residue cultivation is generally completed before sidedress poultry litter application, so it likely does not disturb the band.
3. Crop and weed N uptake
• Determine the efficiency at which N is taken up and the relative sufficiency of N for corn growth in no-till plots receiving subsurface banded, broadcast and no poultry litter, as well as in tillage plots receiving broadcast poultry litter with varying cover crop proportions.
o Progress:
? Corn, weed and soil samples were collected from two seasons at several corn growth stages to assess N pools (first season was a subset of treatments and replicates).
? Bare soil plots were established within the experiment to serve as a check plot for background soil N mineralization needed to calculate N uptake efficiency.
Accomplishments/Milestones
In fall 2011, the field experiment was set up on two new fields at the Beltsville Agricultural Research Center (North Farm- fine loamy, mixed, mesic Typic Endoaquult and South Farm- fine loamy, mixed, mesic Typic Dystrudept). The fields had been in forage soybeans without prior N application and were moldboard plowed, disked twice, field cultivated using an S-tine harrow, and cultimulched prior to cover crop planting. Both fields also received 67 kg ha-1 K2O. Three reps were planted on each field, totaling six reps with plots 6.1 x 12.2 m in size with 3.1-m alleys between reps and a border area of at least 3.1 m around all sides. Cover crops were planted in hairy vetch: cereal rye mixtures with proportions of 0:1, 0.2:0.8, 0.4:0.6, 0.6:0.4, 0.8:0.2, 1:0 arranged randomly within reps, with the full rate of hairy vetch equal to 34 kg ha-1 and that of cereal rye equal to 168 kg ha-1. The fields were planted with a 10-foot drill on October 7 (North Farm) and October 10 (South Farm). Visual geese deterrents were placed on the South Farm field to prevent geese damage. In November, bare checkplots were established by field cultivation in the direction of future corn planting. The N taken up by corn in these plots will represent plant available N provided by the soil without fertilizer amendment. Twenty 0-30 cm soil cores were collected randomly within each rep on November 21 2011 for baseline soil characterization.
North Farm
Cover crop growth was terminated in spring 2012 by flail mowing and spading the tillage plots (May 8, 2012) or by rolling/crimping the no-till plots (May 17 at planting and May 23, 2012 to kill regrowth). Corn management was performed in the opposite direction of cover crop planting, forming a split-block experimental design. On May 17, 2012 tillage plots received a broadcast application of poultry litter at 3.6 Mg ha-1, which was incorporated by spading just prior to planting. The no-till plots were rolled and no-till planted to corn. All treatments received starter fertilizer at 0.6 Mg ha-1. Poultry litter was hand-applied in no-till plots receiving broadcast poultry litter at 3.6 Mg ha-1 just after planting. The tillage plots received three rotary hoeing operations and two between-row cultivations. No-till plots received two high-residue cultivations. On July 3, pelletized poultry litter was subsurface banded at 1.8, 3.6 or 7.2 Mg ha-1 in no-till plots.
South Farm
On South Farm, cover crops were terminated as on North Farm, with initial mowing and spading on May 18, and planting on May 29. To broaden the scope of the experiment and to improve accuracy of N accounting in the system, South Farm was managed as a hybrid organic-conventional system with limited chemical weed control. Glyphosate was applied at a rate of 2.8 kg active ingredient ha-1 on June 1 and June 21. Cultivation was not performed on South Farm. On June 27, pelletized poultry litter was subsurface banded at 3.6, 7.2, or 14.4 Mg ha-1 in no-till plots.
Cover crop biomass
Cover crop biomass samples were collected using 0.5 m2 quadrats. Aboveground biomass was collected within the frame from each plot (each cover crop x poultry litter treatment) at the time of cover crop termination. The samples were sorted by species, dried, weighed and analyzed for C and N concentration.
Decomposition
In spring 2012, litter bags were prepared using cover crop biomass from pure stands collected at the North Farm site. The bags were filled with fresh material for a target dry weight similar to average biomass levels in the field. They were then placed on the soil surface in no-till plots (with residues removed from the location in which bags were placed) or buried to 20 cm in tilled plots at the time of cover crop termination on North Farm. Litter bags were prepared for five cover crop mixtures (0:100, 25:75, 50:50, 75:25, 100:0 vetch:rye) in four poultry litter treatments (broadcast 3.6 Mg ha-1, broadcast incorporated 3.6 Mg ha-1, subsurface banded 3.6 Mg ha-1 and no poultry litter). One bag from each plot was collected as soon as the bags were placed in the field; and a single bag from each plot was collected at each of five additional sampling times (corn V2, V5, V8, R1 and R6 growth stages).
Soil moisture, temperature and electrical conductivity sensors were placed next to the litter bags in the 0, 60:40 and 100 vetch:rye mixtures at 20 cm depth in the tillage plots and at 5 cm depth in the no-till plots that received 3.6 Mg ha-1 subsurface banded poultry litter. Temperature loggers were just under the cover crop residue in plots with the same mixtures and 0, 3.6 Mg ha-1 subsurface banded and 3.6 Mg ha-1 broadcast poultry litter.
Spatio-temporal soil sampling
Soil samples were collected at five corn growth stages (emergence, V5, R1, R3 and R6) during summer 2012 at the South Farm site. Due to the intensive nature of the sampling, a subset of experimental treatments was sampled. Treatments of interest included the standard tillage management, 3.6 Mg ha-1 broadcast poultry litter, no poultry litter and 3.6 Mg ha-1 subsurface banded treatment in 0, 60:40 and 100 vetch:rye mixtures. In the subsurface banded plots, soil cores were taken at 0, 5, 10, 25 and 38 cm from the poultry litter band at depths of 0-5, 5-10, 10-15, 15-20 and 20-30 cm. In all other poultry litter treatments, soil cores were taken at 0, 20 and 38 cm from the interrow center at depths of 0-5, 5-10, 10-20 and 20-30 cm. Four or eight cores were sampled at each interrow location, split at proper depths and composited for each soil sample. The samples were collected in a mirror image on either side of the interrow center, so only four cores were collected in the center and eight cores were collected at all other interrow locations.
Moisture content was measured on each sample and the samples were air-dried and ground to pass a 2-mm sieve. A subset of the samples were weighed for bulk density determination. We are currently processing soil samples for KCl extraction and inorganic N analysis.
In addition to collecting soil cores at several times during the growing season, soil temperature, moisture and electrical conductivity sensors placed at several soil profile locations collected continuous data from sidedressing through the R5 corn growth stage. The sensors were placed in the pure rye and pure vetch treatments receiving 3.6 Mg ha-1 subsurface banded poultry litter at 0, 10 and 25 cm from the band and 5, 10 and 20 cm depth.
Nitrogen use
Destructive corn samples and weed samples were collected a several times during the corn growing season to evaluate N uptake and partitioning over time. Six whole corn plants were taken from each plot at each of three growth stages (V3, V5 and R1) on North Farm and two growth stages (V5 and R1) on South Farm. At crop maturity, a 10-foot length of corn was collected for biomass determination from both sites, and a subset of six plants was ground for C and N analysis. Weed biomass was collected from either a 0.5-m2 quadrat (early-season), or 1-m2 quadrat (R1 and R6) from North Farm. All biomass samples have been weighed and are currently being ground for future C and N analysis.
Two non-destructive methods were used to detect N stress of corn during the growing season. Leaf chlorophyll content was measured using a SPAD meter at both sites at the following corn growth stages: V5, V8, V10, V13, R1 and R3. Vegetative cover and relative N stress were detected using a CropCircle handheld crop canopy sensor that measures reflectance of different light wavelengths. Due to variable corn populations on North Farm, the CropCircle was only used on South Farm. Readings were taken at V3, V5, V6 and V8.
Soil samples were collected at corn emergence, V3, V5 and R1 growth stages in each plot on North Farm and at V5 and R1 growth stages on South Farm. Fewer plot-scale soil samples were collected on South Farm since intensive spatio-temporal sampling took place at the same site. Eight to twelve cores were taken randomly from within each plot and composited to form each sample. The soil samples were air-dried and are currently being ground in preparation for analysis. Residual N remaining at blacklayer will be quantified using fall N uptake by the subsequent cover crop.
Challenges
A major challenge posed by this cover crop-based no-till system is getting good crop seed placement through the heavy cover crop residues. In 2012, high biomass production, especially by the mixtures, created conditions that inhibited good soil-seed contact at our North Farm site. The difficulty planting into the residue was likely compounded by the high gravel content of the soil at this location. We observed that corn stands tended to be better in the pure vetch and pure rye treatments, but where vetch and rye were entangled, the planter was not able to cut through the residue to create a seed furrow. Due to the variable stands on North Farm, many of our plots at this location were discarded prior to analysis.
In fall 2012, two new fields were prepared at BARC North Farm and South Farm for another round of this experiment. Cover crops were planted on Sept. 17 and Sept. 25 at North Farm and South Farm, respectively. Field preparation, planting and bare checkplot management proceeded as in 2011. Twenty 0-30 cm soil cores were collected randomly from bare check plots in each rep on Oct. 12 for baseline soil characterization and residual N determination.
Impacts and Contributions/Outcomes
Thus far, I have collected and analyzed data on cover crop biomass, N content, decomposition and N release from two seasons. I have also looked at non-destructive measures of corn N stress across the cover crop mixture gradient and poultry litter treatments, and begun to summarize crop and weed biomass data from the 2012 season. The initial data provides evidence for greater biomass production in cover crop mixtures relative to monocultures. Cover crop decomposition data indicates that a large proportion of N contained in vetch residues is released rapidly upon termination, potentially contributing to early-season N losses. The inclusion of rye in the cover crop mixtures decreased the rate and proportion of N released from the residues. Early-season non-destructive measures suggest that corn N stress increased with rye proportion in mixtures, but to a lesser extent when poultry litter was applied broadcast or incorporated at planting. I am eager to complete sample processing and analysis to summarize the remaining data.
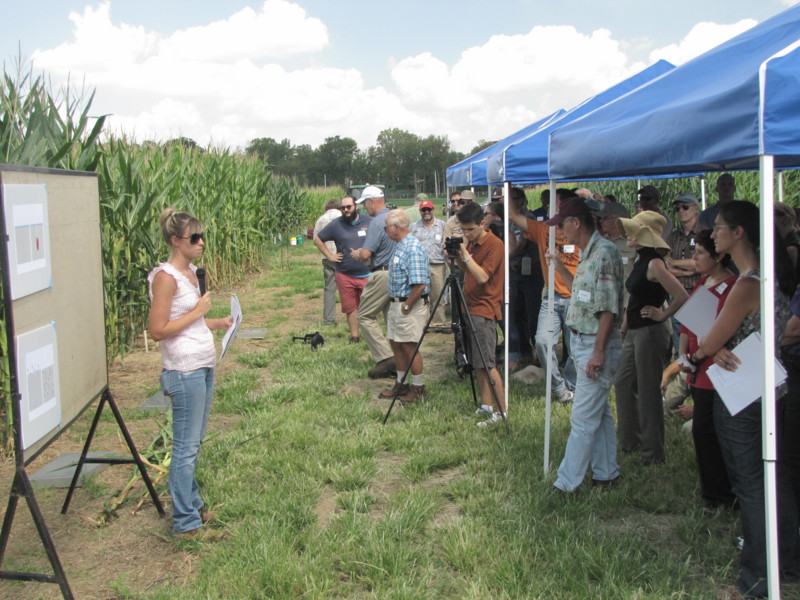
During the summer and fall of 2012, I participated in several important outreach activities to communicate research objectives, system design and preliminary findings. In July, I presented our South Farm experiment to student interns working at NIFA who toured the BARC facility to learn about agricultural research. While showing them our experimental set-up, I explained to the approximately 20 students the major components of the cover crop-based no-till system and reviewed the rationale and preliminary results of our study. In August, the Sustainable Agricultural Systems Lab hosted a field day for approximately 120 producers, extension agents, researchers and policymakers. Researchers within the lab presented on topics such as integrated nutrient management using cover crops and manure, performance of organic and conventional cropping systems, perennial wheat breeding and insect management in reduced-tillage organic production. The cover crop-based organic no-till system experiment was featured in three presentations on the topics of reduced-tillage organic management, N dynamics within the system, and greenhouse gas emissions within the system. The subsurface manure applicator was also included in equipment demonstrations. Attached to this report is a hand-out that was prepared for the field day, as well as pictures from the event (photos courtesy of Ray Weil and Betty Marose). This hand-out is currently being revised for an e-Organic publication.
In addition to the two field days, I also presented research findings at the American Society of Agronomy, Crop Science Society of America and Soil Science Society of America annual meetings in October 2012. I presented cover crop biomass and N content data of our cover crop mixtures, and mass loss and N loss of the mixtures over time (figures 1, 2 and 3). The same data were presented in a poster at the UMD-BARC symposium in October 2012.
- A hand-out prepared for the 2012 field day
- Dr. Cavigelli presents on integrated nutrient management at 2012 field day (photo by Betty Marose)
- Hanna Poffenbarger presents on nutrient management in reduced-tillage organic corn production (photo by Ray Weil)
- Figures prepared for oral presentation and poster
Collaborators:
Research ecologist
Building 001
10300 Baltimore Ave
Beltsville, MD 20705
Office Phone: 3015045324
Professor
University of Maryland
1109 HJ Patterson
University of Maryland
College Park, MD 20742
Office Phone: 3014051314