2016 Annual Report for OW15-008
Optimizing nitrogen management on organic and biologically-intensive farms
Summary
The long-term goal of this project is to improve nitrogen fertilizer management on farms implementing biologically-intensive soil-building practices to grow diverse crops. Cover cropping and organic amendments contribute to the soil’s fertility beyond the year they were incorporated by building active organic matter. Through this participatory research we will be able to place dollar values on the importance of optimizing soil fertility. Growers will be able to more accurately estimate nitrogen mineralization from soil organic matter and adjust fertilizer applications up or down accordingly. Extensive outreach efforts will be used to directly reach over 200 growers in Washington and Oregon.
Objectives/Performance Targets
- Assist producers with fertilizer applications through pre-season soil tests that predict nitrogen mineralization.
- Evaluate the net economic return of increasing amounts of organic fertilizer applied before planting across geographically dispersed farms with differing soil quality parameters.
- Assist producers with in-season soil tests that allow adjustment to fertility during the growing season.
- Assist producers in developing nitrogen management plans to increase profitability while protecting water quality.
Accomplishments/Milestones
Methods
Field Trials: An experiment to assess nitrogen contribution from organic matter and the economic benefit of five different rates of fertilizer application was performed with 5 organic farms. Two farm sites were located near Royal City in central Washington (Sites 1-2) with a semi-arid climate. Three farm sites were located in western Washington (Sites 3-5) with a maritime climate.
Fertilizer rates were determined through interviews with cooperating farmers and by consulting broccoli production guides (farmers reported applying between 20 and 60 pounds total N per acre). At each farm, organic feather meal fertilizer (11%N, 0%P, 0%K) was applied at 0, 60, 120, 180, and 240 lbs N/acre in a randomized complete block design with 3 replications.
Certified organic broccoli transplants were prepared at a central location and transplanted following ground preparation and fertilizer application. Transplanting occurred in central Washington on 14 April 2016 and on in western Washington on 17 and 18 May 2016. Plant spacing was determined by individual farmers and was similar at sites 1,2,3, and 5. Site 4, the smallest farm, planted broccoli more densely. Weather stations were set up at each site to record air temperature for calculation of growing degree days.
Soil Analyses: Soils were sampled before planting broccoli and analyzed for bulk density (BD), water-holding capacity, organic matter (OM), nitrate-N, P, K, and pH. Soil nitrate-N was more intensively sampled by sampling at 0 and 28 days after transplant (DAT) and at harvest (between 71 and 79 DAT). In addition to laboratory analysis, soil nitrate was also analyzed with a field nitrate testing kit (EM Quant™). Nitrogen mineralization predictive tests were done for soils collected in spring before planting. Predictive tests included the Haney test (performed at Ward Labs, Kearney, NE) which includes both 24-hr CO2 respiration (Solvita™ test) and predicted available nitrogen calculated from Solvita™ and weak acid extraction of mineral nitrogen. Other predictive tests were 42-day aerobic nitrate (NO3) mineralization at 22 and 35 ◦C (incubated soils sampled at 0, 7, 21, and 42 days), and 7-day anaerobic ammonium (NH4) mineralization at 40◦C.
Crop Yield and N uptake: Marketable broccoli yield was taken from each plot. Additionally, three adjacent broccoli plants from each replication of each treatment were destructively harvested and combined into a single sample and analyzed for biomass, total N and total C.
Statistical Analysis and Interpretation: The average of 3 field replications was calculated for bulk density, basic soil analyses, Haney tests, 7-day anaerobic NH4 incubation, and seasonal soil NO3 with EM Quant™ and lab test. The aerobic NO3 mineralization rate (lbs NO3 day-1) was calculated by fitting a linear model with nitrate mineralization versus days of incubation and averaging the rate across replications. Broccoli yield and above-ground biomass were fit to linear models for each site. The statistical significance of fertilizer effect was tested with analysis of variance and means were separated with Tukey’s HSD.
Results and Discussion
Despite the different climates, growing degree days (GDD7.2) were similar at sites 1-4 and ranged from 652 to 701. Site 5 required more days to reach first harvest and accumulated 802 GDD7.2 (Table 1). Site 5 was a silt loam while the other sites were sandy loam, fine sandy loam, or very fine sandy loam.
Table 1. Climate, soil properties, and plant density at 5 organic farm sites in Washington State, 2016.
|
Site |
Climate |
GDD7.2 to first harvest |
Days to first harvest |
Soil Series |
Soil Texture |
BDg cm-3 |
Plants acre-1 |
|
1 |
Semi-arid |
701 |
71 |
Royal |
Loamy sand |
1.10 |
17,424 |
|
2 |
Semi-arid |
~7001 |
71 |
Taunton |
Loamy sand |
1.24 |
17,424 |
|
3 |
Maritime |
652 |
71 |
Yelm |
Loam |
0.93 |
16,228 |
|
4 |
Maritime |
679 |
72 |
Alderwood |
Sandy loam |
0.89 |
23,522 |
|
5 |
Maritime |
802 |
79 |
Nooksack |
Silt loam |
1.06 |
16,228 |
1The weather station at Site 2 was compromised, but GDD were likely similar to Site 1. GDD7.2=Growing Degree Days with base temperature of 7.2 C
Soil organic matter ranged from 2.0% to 7.7% and pH ranged from 5.8 to 7.8 (Table 2). Organic matter was higher and pH was lower in the soils from the western Washington maritime climate than in the soils from the semi-arid climate in central Washington. Tests to predict N mineralization were consistent in their ranking of the soil sites with the exception of Site 5. The Haney tests predicted greater N mineralization from Site 5 than Sites 1 and 2, while the aerobic and anaerobic incubations predicted less mineralization from that soil than Sites 1 and 2 (Table 3). The Solvita test and 7-day anaerobic incubation showed the greatest range of potential mineralization among soils.
Table 2. Basic soil analysis prior to planting at 5 organic farm sites in Washington State, 2016.
|
Site |
pH |
NO3-N mg/kg |
P mg/kg |
K mg/kg |
OM % |
Ca |
Mg |
B |
|
1 |
7.7 |
3.2 |
86.9a |
195.2c |
2.8 |
11.0 |
1.7 |
0.3 |
|
2 |
7.8 |
1.1 |
18.9a |
235.6c |
2.0 |
7.8 |
1.4 |
0.2 |
|
3 |
6.0 |
3.0 |
206.0b |
207.0d |
7.5 |
8.1 |
1.4 |
0.6 |
|
4 |
7.1 |
6.2 |
102.9b |
255.2d |
7.7 |
12.7 |
1.7 |
0.3 |
|
5 |
5.8 |
3.0 |
25.2b |
68.2d |
3.5 |
6.7 |
1.4 |
0.5 |
aOlsen P test, bBray P test, cOlsen K test, dNH4OAC K test
Table 3. Results of nitrogen mineralization predictive tests at 5 organic farm sites in Washington State, 2016.
|
|
Haney Tests |
45-day aerobic incubation, 0-6 inches |
7-day anaerobic incubation, 0-6 inches |
||
|
|
Solvita CO2-C day-1 |
Predicted N min lbs acre-1 |
NO3 lbs a-1 day-1 |
NH4 mg kg soil-1 |
|
|
Site |
22C |
35C |
40 C |
||
|
1 |
12.8 |
11.7 |
5.1 |
11.2 |
40.5 |
|
2 |
18.8 |
9.1 |
6.2 |
11.0 |
55.2 |
|
3 |
116.2 |
53.3 |
8.3 |
24.7 |
113.4 |
|
4 |
60.9 |
46.9 |
5.3 |
10.8 |
100.2 |
|
5 |
40.2 |
18.0 |
2.7 |
8.0 |
9.0 |
At Site 1, broccoli transplants in several plots were completely lost to rodent damage, so Site 1 data was not included in above ground biomass or marketable yield analyses. Fertilizer rate had a significant effect (p<0.05) on above ground biomass at Sites 2 and 4, but not Site 3 or 5 (Figure 1). Fertilizer rate significantly affected marketable weight at Sites 2-5 (p<0.05; Figure 2).
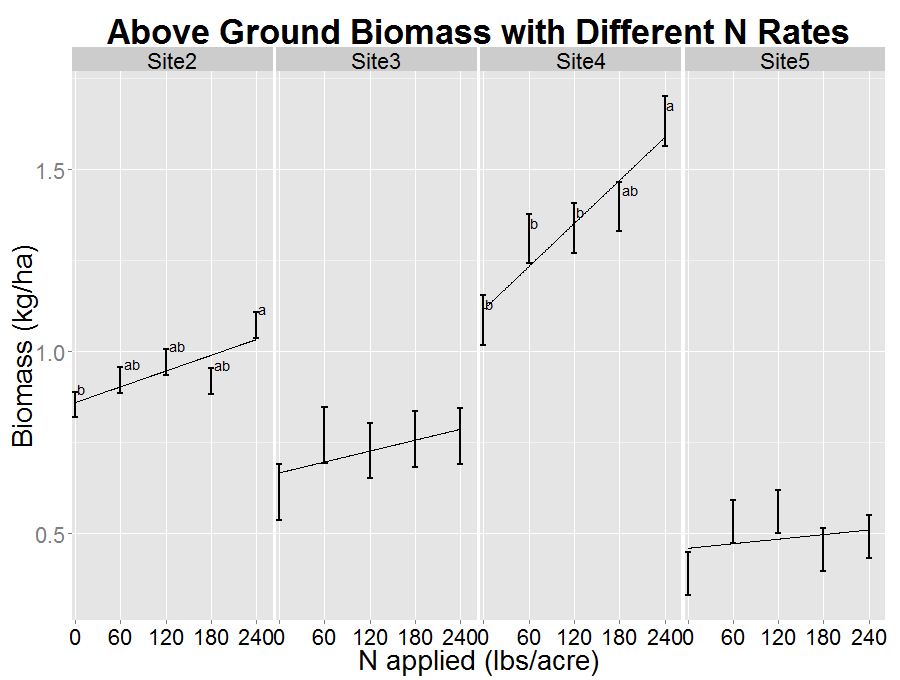
Figure 1. Above ground biomass with different N rates.
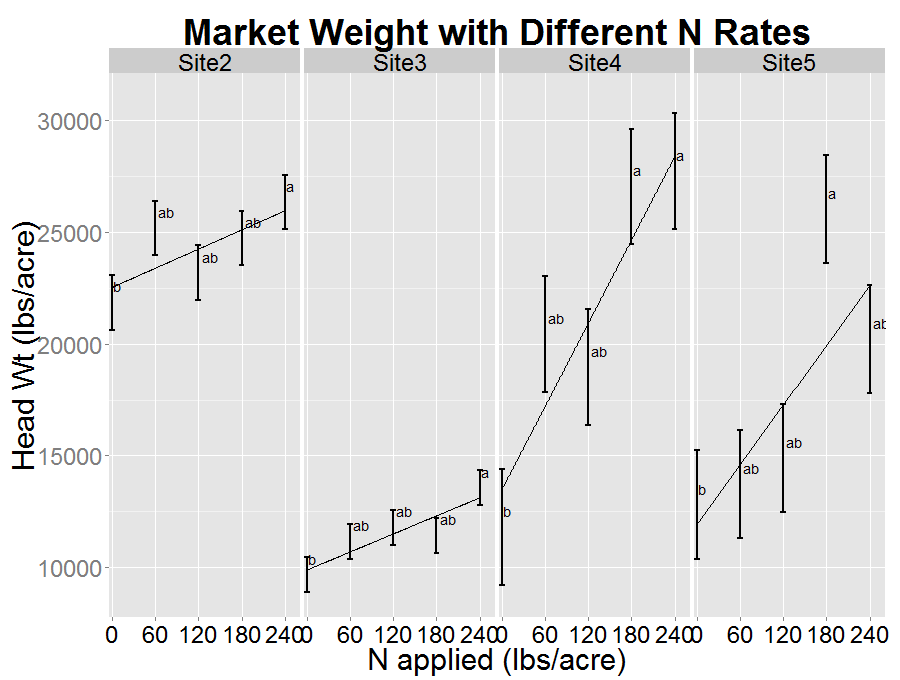
Figure 2. Market weight with different N rates. A linear model was the best fit for all sites and only Site 4 could be fit to a nonlinear logistic model, which is shown.
For aboveground biomass, Site 4 had the steepest slope in response to increasing fertilizer. Sites 4 and 5 had steeper slopes than Sites 2 and 3 for market weight. Soils with greater N mineralization potential (e.g. Site 3; Table 3) should have had less response to fertilizer than sites with lower N mineralization potential values (e.g. Sites 1,2, and 5). The high response to fertilizer at Site 5 is predicted by the low N mineralization potential. Site 4 had a surprisingly high response to fertilizer given the high predicted N mineralization potential. This farm plants broccoli more densely than the other sites (Table 1) and the more dramatic fertilizer response could be explained by intraspecific competition. Site 3 had a similar response to Site 2. The relatively low response at Site 3 is predicted by the high N mineralization potential, but the low response at Site 2 is surprising.
That a linear model fit best for market weight at all sites suggest that N was not applied at a high enough rate to find the rate where N availability did not limit market weight. However, fall soil nitrate levels are another indication of appropriate nitrogen application rate; leaving excess nitrate in the soil after harvest can degrade water quality. Soil nitrate at 30 ppm or greater is considered high and equates to about 105 lbs NO3-N a-1 . Sites 4 and 5 had excess nitrate in the soil with fertilizer application greater than 60 lbs N acre-1. These soil nitrate values are based on the EM Quant quick test and are being validated by laboratory analysis. Economic analysis is also underway and the experiment will be repeated in 2017.
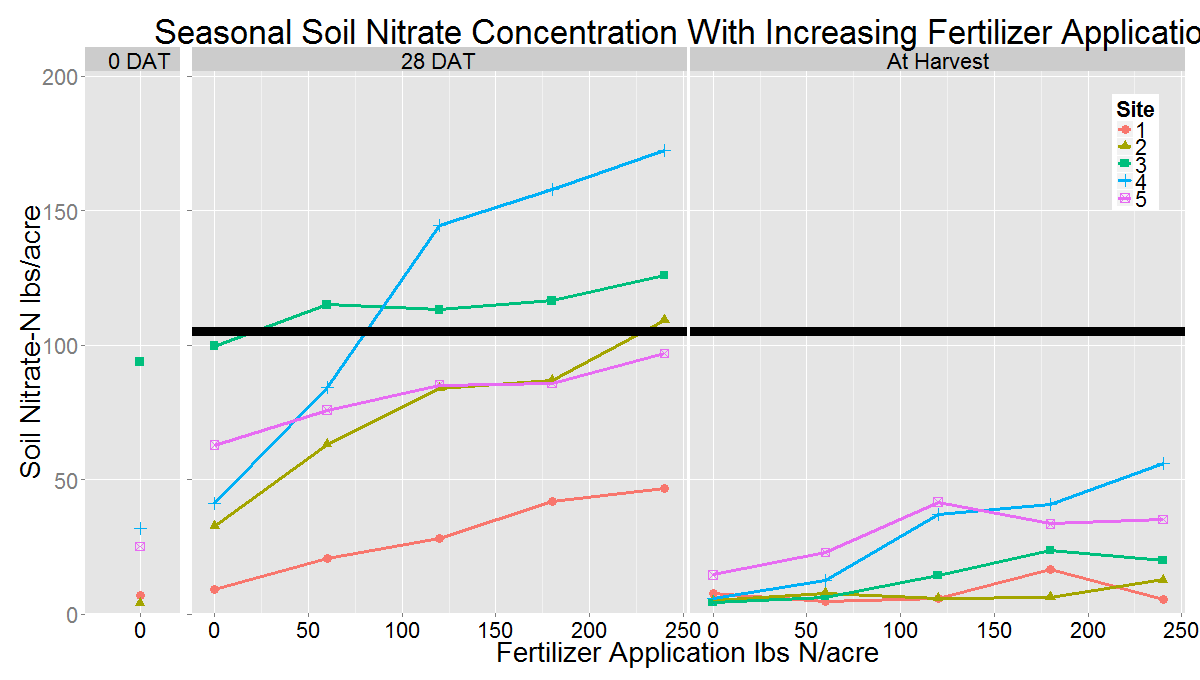
Figure 3. Seasonal soil nitrate concentration with increasing fertilizer application. Horizontal line represents 30 ppm, which is considered “high” for a post-harvest nitrate test.
References
Evanylo, G., C et al.. 2008. Soil and water environmental effects of fertilizer-, manure-, and compost-based fertility practices in an organic vegetable cropping system. Agriculture, Ecosystems & Environment 127:50–58. Gale, E.S., D.M. Sullivan, C.G. Cogger, A.I. Bary, D.D. Hemphill, and E.A. Myhre. 2006. Estimating Plant-Available Nitrogen Release from Manures, Composts, and Specialty Products. Journal of Environment Quality 35:2321. Haney, R.L., W.F. Brinton, and E. Evans. 2008. Soil CO2 Respiration: Comparison of Chemical Titration, CO2 IRGA Analysis and the Solvita Gel System. Renewable Agriculture and Food Systems 23:171–176. Haney, R.L., F.M. Hons, M.A. Sanderson, and A.J. Franzluebbers. 2001. A rapid procedure for estimating nitrogen mineralization in manured soil. Biology and Fertility of Soils 33:100–104.Sullivan, D., J.P.G. McQueen, and D.A. Horneck. 2008. Estimating nitrogen mineralization in organic potato production. Oregon State University Extension EM 8949-E.
Impacts and Contributions/Outcomes
Economic Impact of Organic Nitrogen Fertilizer
Nitrogen fertilizer addition at 240 lbs N/acre contributed between $7,011 and $35,703 net sales increase, assuming a sale price of $2.50/lb. broccoli and fertilizer cost of $0.70/lb fertilizer ($6.36/lb N).
While broccoli yield significantly increased with fertilizer at all sites, the rate of increase varied. Sites 4 and 5 both had the steepest increases in broccoli production with increased fertilizer (62.1 and 44.5 lbs broccoli / lb fertilizer, respectively) (Table 4).
Table 4. Economic analysis, assuming sale price of $2.50/ lb broccoli and fertilizer cost of $0.70/lb fertilizer ($6.36/lb N) at 4 organic farms in Washington State, 2016.
|
Site |
Lbs broc / lb fert |
Production at 0 lbs fert/ acre |
Production at 240 lbs fert / acre |
Sales gain with 240 lb fert/a |
Cost of 240 lbs fert |
Net sales gain at 240 lbs fert |
Value of N in OM |
|
2 |
14.2 |
22,538 |
25,953 |
$8,538 |
$1,527 |
$7,011 |
$3,960 |
|
3 |
13.5 |
9,903 |
13,133 |
$8,076 |
$1,527 |
$6,549 |
$1,740 |
|
4 |
62.1 |
13,505 |
28,397 |
$37,230 |
$1,527 |
$35,703 |
$2,373 |
|
5 |
44.5 |
11,943 |
22,621 |
$26,694 |
$1,527 |
$25,167 |
$2,098 |
Of all of the predictive tests considered, aerobic incubation at 22 C had the strongest association with fertilizer effect on broccoli yield. Sites 4 and 5 were predicted to have the lowest N mineralization from organic matter and these were the two sites the largest rate of increase from fertilizer (Table 5). Increased plant spacing may also explain the more pronounced fertilizer effect at site 4.
Table 5. Soil organic matter, nitrogen minerailzation potential, brocolli yield rate of increase with increasing fertilizer, and plant spacing at 4 organic farms in Washington State, 2016.
|
Site |
Organic Matter % |
N min predictive test, aerobic incubation at 22C: NO3 lbs a-1 day-1 |
Rate of increase lbs broccoli/lb N Fert |
Plants acre-1 |
|
5 |
3.0 |
2.7 |
44 |
16,228 |
|
4 |
6.2 |
5.3 |
62 |
23,522 |
|
2 |
1.1 |
6.2 |
14 |
17,424 |
|
3 |
3.0 |
8.3 |
13 |
17,424 |
Project Outreach
Research results from the first year of this project were presented at the National Small Farms Conference and published in the meeting proceedings. The work was also presented at the regional Tilth Alliance Conference. The first presentation reached 20 people, while the second presentation reached 80 people.
D.P. Collins, A. Bary, T. Vu. 2016. Optimizing nitrogen management on organic and biologically-intensive farms. Proceedings of the 7th National Small Farms Conference. Virginia Beach, VA.
D.P. Collins, A. Bary, T. Vu. 2016. Optimizing nitrogen management on organic and biologically-intensive farms. Tilth Producers of Washington Annual Conference. Wenatchee, WA. Invited Presentation.
Collaborators:
Owner/Operator
Plum Forest Farm
20020 107th Avenue SW
Vashon Island, WA 98070
Office Phone: 2064633518
Owner/Operator
Cloudview Ecofarm
14054 Road 11 SW
Royal City, WA 99375
Office Phone: 5093984624
Owner/Operator
Kirsop Farm
6136 Kirsop Road SW
Tumwater, WA 98512
Office Phone: 3604021318
Farm Manager
Oxbow Farm
10819 Carnation-Duvall Rd NE
Carnation, WA 98014
Office Phone: 2069093299
Owner/Operator
Tonnemaker Hill Farm
9098 Dodson Rd S
Royal City, WA 99357
Office Phone: 5093469706