Project Overview
Annual Reports
Commodities
- Nuts: papaya
- Vegetables: cabbages, eggplant
Practices
- Crop Production: organic fertilizers, tissue analysis
- Education and Training: demonstration, extension, on-farm/ranch research, workshop
- Farm Business Management: value added
- Natural Resources/Environment: carbon sequestration
- Production Systems: organic agriculture
- Soil Management: soil analysis, nutrient mineralization, soil chemistry, soil microbiology, organic matter, soil physics, soil quality/health
Abstract:
It is hypothesized that a combination of biochar and compost when applied to nutrient-poor soils would enhance soil fertility and plant growth more than when biochar or compost is applied separately. To test this hypothesis, a greenhouse experiment was conducted, consisting of two wood-based biochars at 0 and 2% and 2 composts (a vermi- and a thermos-compost) at 0 and 2%, factorially applied to two highly weathered, acid soils (an Oxisol and a Ultisol) of Hawaii. Two additional treatments: 2 cmolc/kg lime + 2% vermi-compost and 2 cmolc/kg lime + 2% thermo-compost were included for comparison. Chinese cabbage (Brassica rapa cv. Bonzai) was used as the test crop. Table 1 shows cabbage fresh weight and N uptake as affected by the various treatments.
Table 1. Cabbage fresh weight and N uptake as affected by biochar, compost, and lime amendments.
Leilehua Ultisol Wahiawa Oxisol
Shoot fresh weight N uptake Shoot fresh weight N uptake
Treatment g/plant mg N/plant g/plant mg N/plant
Lactree wood 6.0 21.0 16.0 40.0
Hilo wood 4.9 10.5 17.0 33.0
Vermicompost 13.5 37.0 17.5 41.0
Thermocompost 12.5 29.0 14.5 33.0
Lactree + vermi 23.0 68.0 17.0 44.0
Lactree + thermo 12.0 29.0 21.0 41.0
Hilo wood + vermi 18.0 52.0 16.5 58.0
Hilo wood + thermo 14.0 40.0 21.5 46.0
Lime + vermi 14.5 31.0 23.0 49.0
Lime + thermo 7.0 27.0 6.5 26.0
Our preliminary findings were: (1) the use of biochar in combination with compost improved soil fertility and increased plant growth, and (2) the effect varied with types of biochar, compost, as well as with plant nutrient studied: Lactree wood biochar + vermi-compost seemed to be the best soil amendment in terms of nutrient availability and plant growth.
Year 2.
- Effects of biochar on crop growth under tropical field conditions.
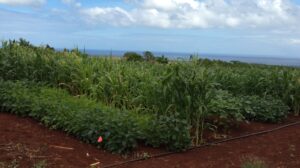
Effects of biochar on crop and soil under field conditions have been lacking. Thus, a field experiment was conducted on an Oxisol (Rhodic haplustox, Wahiawa series) in Oahu Island, Hawaii. A biochar locally produced from macadamia shell feedstock was applied along with either urea, or organic nitrogen (N) fertilizers (blood meal: 10% N and Organic Farm: 12% N). Sweet corn (Zea mays), soybean (Glycine max), and okra (Abelmoschus esculentus) served as the test crops. The N application rates were 150 and 300 kg N/ha, and biochar rates were 0, 2, and 4% by weight. The experiment had a factorial design, with biochar rate as main plot, N source as subplot, and N rate as sub-subplot. There were 3 replications per treatment. Table 1 shows selected chemical properties of the soil and biochar; and Figure 1 shows the set-up of the experiment.
Table 1. Selected chemical properties of the Oxisol soil and biochar used in the field experiment.
|
Material |
|
Total |
Mehlich-3 extractable, mg/kg |
||||||||
|
|
pHł |
ECł, dS/m |
C, % |
N, % |
P |
K |
Ca |
Mg |
Fe |
Mn |
Zn |
|
Oxisol soil |
5.38 |
1.50 |
1.5 |
0.14 |
49 |
600 |
2100 |
253 |
18 |
342 |
32 |
|
biochar |
9.15 |
2.40 |
65 |
0.41 |
2500 |
7000 |
2120 |
3100 |
189 |
103 |
56 |
ł pH and EC (Electrical Conductivity) were measure in 1:1 in water for soil and 1:5 for biochar.
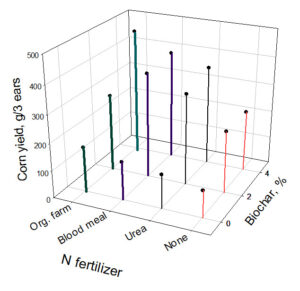
Our preliminary results showed that the N use efficiency markedly increased in the presence of biochar, especially for corn, okra, and even soybean (Tables 2 and 3). Interestingly, the effect of biochar on plant growth seemed to extend beyond N nutrition because the treatments receiving biochar but no N input also out-yielded those having N input but no biochar (Figure 2). Our experiment will be continued for some more years to test the prolonged/aging effect of biochar.
Table 2. The effect of biochar, N sources and rates on growth parameters of okra (Abelmoschus esculentus), soybean (Glycine max), and sweet corn (Zea mays). Different letters in each column per soil amendment (i.e., biochar, N source, N rate) indicate statistically significant difference at 95% level.
|
Factor |
Okra |
Soybean |
Sweet Corn |
|||||||
|
Plant Height (cm) |
Yield (g/10 plant) |
Plant height (cm) |
Biomass (g) |
Yield (g Pods) |
Pod % |
Plant height (cm) |
Total Biomass (g/3 plants) |
Stover (g/3 plants) |
Ears (g/ 3 plants) |
|
|
Biochar Application rate (% of soil weight) |
||||||||||
|
Control |
116a |
1631a |
68.5a |
2332c |
1141b |
48.6a |
119a |
384c |
247c |
136c |
|
2% |
120a |
1932a |
69.1a |
2589b |
1183b |
45.3b |
123a |
662b |
350b |
307b |
|
4% |
111a |
1880a |
71.6a |
3270a |
1515a |
46.3ab |
118a |
790a |
409a |
381a |
|
Fertilizer Source (Organic and Synthetic) |
||||||||||
|
Control |
121a |
1134b |
64.8b |
2375b |
1031b |
42.5b |
117a |
420c |
239c |
171c |
|
Blood Meal |
110a |
2019a |
69.9ab |
2665a |
1279a |
48.2a |
119a |
642ab |
333b |
309a |
|
Organic Farm |
109a |
1998a |
73.2a |
2834a |
1335a |
47.3a |
118a |
615b |
318b |
296ab |
|
Urea |
123a |
1767a |
68.6ab |
3869a |
1350a |
47.0a |
125a |
675a |
403a |
271b |
|
N Application Rate (kg N/ha) |
||||||||||
|
Control |
121a |
1134b |
64.8b |
2375b |
1031b |
42.5b |
117a |
420c |
239c |
171c |
|
150 |
114a |
1760a |
68.7ab |
2763a |
1308a |
47.3a |
119a |
583b |
341b |
241b |
|
300 |
114a |
2096a |
72.4a |
2817a |
1335a |
47.6a |
122a |
705a |
362a |
343a |
Table 3. Analysis of Variance (ANOVA) for the studied factors and interaction under factorial in split plot design with three blocks. Numbers indicate probability of differences.
|
SOV |
d.f. |
Okra |
Soybean |
Sweet Corn |
|||||||
|
Plant Height |
Yield |
Plant height |
Biomass |
Yield (Pods) |
Pod % |
Plant height |
Total Biomass |
Hay |
Ears |
||
|
Block |
2 |
|
|
|
|
|
|
|
|
|
|
|
Biochar (B) |
2 |
0.75 |
0.41 |
0.21 |
0.001** |
0.001** |
0.003** |
0.75 |
0.001** |
0.001** |
0.01* |
|
Error (a) |
4 |
|
|
|
|
|
|
|
|
|
|
|
Fertilizer (F) |
3 |
0.25 |
0.03* |
0.01* |
0.02* |
0.007** |
0.001** |
0.57 |
0.001** |
0.001** |
0.001** |
|
N Rate (N) |
2 |
0.93 |
0.16 |
0.02* |
0.06 |
0.07 |
0.02* |
0.42 |
0.001** |
0.003** |
0.02* |
|
B X F |
6 |
0.31 |
0.77 |
0.24 |
0.02* |
0.01* |
0.03* |
0.56 |
0.02* |
0.001** |
0.18 |
|
B X N |
4 |
0.81 |
0.87 |
0.95 |
0.34 |
0.51 |
0.67 |
0.93 |
0.07 |
0.18 |
0.25 |
|
F X N |
6 |
0.21 |
0.61 |
0.81 |
0.33 |
0.55 |
0.48 |
0.77 |
0. 11 |
0.11 |
0.67 |
|
B X F X N |
12 |
0.44 |
0.44 |
0.51 |
0.63 |
0.95 |
0.25 |
0.62 |
0.24 |
0.52 |
0.02* |
|
Error (b) |
21 |
|
|
|
|
|
|
|
|
|
|
|
Total |
62 |
|
|
|
|
|
|
|
|
|
|
- A greenhouse experiment studying the effect of placement (surface applied vs. incorporated) of biochar + compost combination on annual and perennial crops has been established.
An Andisol (Typic hapludand, Tantalus series) and an Oxisol (Rhodic haplustox, Wahiawa series) were used, each received 4% wood-based biochar and 4% compost (volume:volume) either surface applied or mixed with the top 10-cm soil in columns having 22-cm depth and containing 1.2 L of the amended soil. Chinese cabbage (Brassica rapa, Chinensis group) and papaya (Carica papaya) served as the test crops. Preliminary results will be available in the next three months.
Project objectives:


Year 1. The objectives of our experiment are
(1) to examine the effect of biochar on N dynamics (i.e., potential loss and rate of mineralization) of organic fertilizers over time and
(2) to evaluate the combined effect of biochar and compost on vegetable growth.
Year 2. The objectives of our experiments are
(1) to examine the effect of biochar on N dynamics (i.e., potential loss and rate of mineralization) of organic fertilizers over time under tropical field conditions, and (2) to evaluate the placement (surface application vs. incorporation) effect of biochar + compost combination on the growth of annual and perennial crops.